Attached files
| file | filename |
|---|---|
| 8-K - 8-K - CITIZENS FINANCIAL GROUP INC/RI | d393651d8k.htm |
 Barclays Americas Select Franchise Conference 2017 May 2017 Bruce Van Saun Chief Executive Officer Exhibit 99.1 |
 Forward-looking statements and use of key performance metrics and Non-GAAP financial measures
2 This document contains forward-looking statements within the Private Securities Litigation Reform Act of 1995. Any statement that does not describe historical or current facts is a forward-looking statement. These statements often include the words “believes,” “expects,” “anticipates,” “estimates,” “intends,” “plans,” “goals,” “targets,” “initiatives,” “potentially,” “probably,” “projects,” “outlook” or similar expressions or future conditional verbs such as “may,” “will,” “should,” “would,” and “could.” Forward-looking statements are based upon the current beliefs and expectations of management, and on information currently available to management. Our statements speak as of the date hereof, and we do not assume any obligation to update these statements or to update the reasons why actual results could differ from those contained in such statements in light of new information or future events. We caution you, therefore, against relying on any of these forward-looking statements. They are neither statements of historical fact nor guarantees or assurances of future performance. While there is no assurance that any list of risks and uncertainties or risk factors is complete, important factors that could cause actual results to differ materially from those in the forward-looking statements include the following, without limitation: negative economic conditions that adversely affect the general economy, housing prices, the job market, consumer confidence and spending habits which may affect, among other things, the level of nonperforming assets, charge-offs and provision expense; the rate of growth in the economy and employment levels, as well as general business and economic conditions; our ability to implement our strategic plan, including the cost savings and efficiency components, and achieve our indicative performance targets; our ability to remedy regulatory deficiencies and meet supervisory requirements and expectations; liabilities and business restrictions resulting from litigation and regulatory investigations; our capital and liquidity requirements (including under regulatory capital standards, such as the U.S. Basel III capital rules) and our ability to generate capital internally or raise capital on favorable terms; the effect of changes in interest rates on our net interest income, net interest margin and our mortgage originations, mortgage servicing rights and mortgages held for sale; changes in interest rates and market liquidity, as well as the magnitude of such changes, which may reduce interest margins, impact funding sources and affect the ability to originate and distribute financial products in the primary and secondary markets; the effect of changes in the level of checking or savings account deposits on our funding costs and net interest margin; financial services reform and other current, pending or future legislation or regulation that could have a negative effect on our revenue and businesses, including the Dodd-Frank Act and other legislation and regulation relating to bank products and services; a failure in or breach of our operational or security systems or infrastructure, or those of our third party vendors or other service providers, including as a result of cyber attacks; and management’s ability to identify and manage these and other risks. In addition to the above factors, we also caution that the amount and timing of any future common stock dividends or share repurchases will depend on our financial condition, earnings, cash needs, regulatory constraints, capital requirements (including requirements of our subsidiaries), and any other factors that our board of directors deems relevant in making such a determination. Therefore, there can be no assurance that we will pay any dividends to holders of our common stock, or as to the amount of any such dividends. More information about factors that could cause actual results to differ materially from those described in the forward-looking statements can be found under “Risk Factors” in Part I, Item 1A in our Annual Report on Form 10-K for the year ended December 31, 2016, filed with the United States Securities and Exchange Commission on February 24, 2017. Key Performance Metrics and Non-GAAP Financial Measures and Reconciliations Key Performance Metrics: Our management team uses key performance metrics (KPMs) to gauge our performance and progress over time in achieving our strategic and operational goals and also in comparing our performance against our peers. We have established the following financial targets, in addition to others, as KPMs, which are utilized by our management in measuring our progress against financial goals and as a tool in helping assess performance for compensation purposes. These KPMs can largely be found in our periodic reports which are filed with the Securities and Exchange Commission, and are supplemented from time to time with additional information in connection with our quarterly earnings releases. Our key performance metrics include: Return on average tangible common equity (ROTCE); Return on average total tangible assets (ROTA); Efficiency ratio; Operating leverage; and Common equity tier 1 capital ratio (U.S. Basel III Standardized fully phased-in basis). In establishing goals for these KPMs, we determined that they would be measured on a management-reporting basis, or an operating basis, which we refer to externally as “Adjusted” or “Underlying” results. We believe that these “Adjusted” or “Underlying” results provide the best representation of our financial progress towards these goals as they exclude items that our management does not consider indicative of our on-going financial performance. KPMs that contain “Adjusted” or “Underlying” results are considered non-GAAP financial measures. Non-GAAP Financial Measures: This document contains non-GAAP financial measures. The tables in the appendix present reconciliations of our non-GAAP measures. These reconciliations exclude “Adjusted” or “Underlying” items, which are included, where applicable, in the financial results presented in accordance with GAAP. “Adjusted” or “Underlying” results, which are non-GAAP measures, exclude certain items as applicable, that may occur in a reporting period which management does not consider indicative of on-going financial performance. The non-GAAP measures presented in the following tables include reconciliations to the most directly comparable GAAP measures and are: “noninterest income”, “total revenue”, “ noninterest expense”, “pre-provision profit”, “income before income tax expense”, “income tax expense”, “effective income tax rate”, “net income”, “net income available to common stockholders”, “other income”, “salaries and employee benefits”, “outside services”, “amortization of software expense”, “other operating expense”, “net income per average common share”, “return on average common equity” and “return on average total assets”. We believe these non-GAAP measures provide useful information to investors because these are among the measures used by our management team to evaluate our operating performance and make day-to-day operating decisions. In addition, we believe our “Adjusted” or “Underlying” results in any period reflect our operational performance in that period and, accordingly, it is useful to consider our GAAP results and our “Adjusted” or “Underlying” results together. We believe this presentation also increases comparability of period-to-period results. Other companies may use similarly titled non-GAAP financial measures that are calculated differently from the way we calculate such measures. Accordingly, our non-GAAP financial measures may not be comparable to similar measures used by other companies. We caution investors not to place undue reliance on such non-GAAP measures, but instead to consider them with the most directly comparable GAAP measure. Non-GAAP financial measures have limitations as analytical tools, and should not be considered in isolation, or as a substitute for our results as reported under GAAP. |
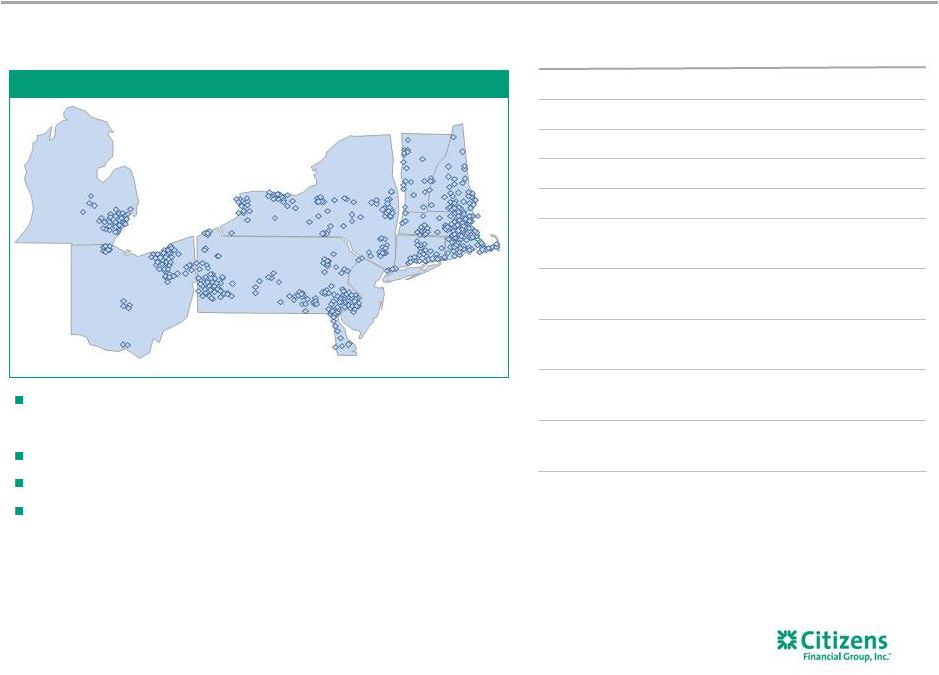 Dimension (1) Rank (2) Assets: $150.3 billion #12 Loans: $108.1 billion (4) #11 Deposits: $112.1 billion #12 Branches: ~1,200 #11 ATM network: ~3,200 #7 Mortgage: $15.4 billion #13 nationally (5) Education: $7.2 billion Top 4 rank nationally (6) Deposits: $112.1 billion Top 5 rank: 9/10 markets (3) HELOC: $14.0 billion Top 5 rank: 9/9 markets (7) Middle market lead/joint lead bookrunner #5 (8) Leading deposit market share of 12.0% in top 10 MSAs (3) – #2 deposit market share in New England Relatively diverse economies/affluent demographics Serve 5 million+ individuals, institutions and companies ~17,500 colleagues Retail presence in 11 states Top 5 deposit market share in 9 of 10 largest MSAs (3) Solid franchise with leading positions in attractive markets Source: SNL Financial. Data as of 12/31/2016, unless otherwise noted.
1) CFG data as of March 31, 2017. 2) Ranking based on 12/31/2016 data, unless otherwise noted; excludes non-retail depository institutions, includes U.S.
subsidiaries of foreign banks. 3)
Source: FDIC, June 2016. Excludes “non-retail banks” as
defined by SNL Financial. The scope of “non-retail banks” is subject to the discretion of SNL Financial, but typically includes: industrial bank and non-depository trust charters, institutions with more than 20% brokered deposits (of total deposits), institutions with more than 20% credit card loans (of total loans), institutions deemed not to broadly participate in the banking services market and other non-retail competitor
banks. 4)
Excludes held for sale.
5) According to IMF bank-only origination rank; volume as of 4Q16.
6) CFG estimate, based on published company reports, where available; private student loan origination data as of 12/31/2016.
7)
According to Equifax; origination volume as of 4Q16.
8) Thomson Reuters LPC, Loan syndications 4Q16 ranking based on number of deals for Overall Middle Market (defined as Borrower
Revenues < $500MM and Deal Size < $500MM). Buffalo,
NY: #5 Albany, NY: #3
Pittsburgh, PA: #2
Cleveland, OH: #4
Manchester, NH: #1
Boston, MA: #2
Rochester, NY: #5
Philadelphia, PA: #5
Detroit, MI: #8
Providence, RI: #1
3 |
 Robust product offerings and balanced business mix Corporate Banking Commercial Real Estate Franchise Finance Asset Finance PE/Sponsor Finance Healthcare/Technology/ Oil & Gas/Not-for-Profit verticals Capital Markets Global Markets Treasury Solutions Commercial Deposit Services Retail Deposit Services Mobile/Online Banking Credit/Debit Card Wealth Management Home Equity loans/lines Mortgage Auto Education Finance Business Banking Unsecured & Installment Lending Consumer Commercial Deep client relationships + Extensive product set Targeting 50/50 Mix Period-end loans and leases (1) Drive cross sell and wallet share and deepen and enhance client relationships through behavioral-based thought leadership 1) Reflects loans and leases and loans and leases held for sale in our operating segments (Consumer and Commercial Banking). Excludes
non-core loans held in Other. Non-core assets are
primarily loans inconsistent with our strategic goals, generally as a result of geographic location, industry, product type or risk level. $106 billion 1Q17 $74 billion 2009 4 64% 36% Commercial Consumer 54% 46% Commercial Consumer |
 Well capitalized with a common equity tier 1 capital ratio of 11.2%
Strong
asset-quality
performance
with net charge-offs of 33 bps (1) in 1Q17 Robust deposit franchise with $91.0 billion of average core deposits (2) ; 55% retail Strong liquidity and fully compliant liquidity coverage ratio Strong, clean balance sheet 5 Source: SNL Financial and Company filings. Peers include BBT, CMA, FITB, MTB, PNC, RF, STI and USB. As a result of KEY's 3Q16
acquisition of First Niagara, KEY's results have been
excluded from the peer average 1)
Net charge-off percentages are quarter-to-date on an
annualized basis. 2)
Excludes term and brokered deposits.
3) Period-end balance of as of March 31, 2017. 1Q17 total deposits/ total liabilities (3) 1Q17 net charge-offs/ average loans and leases (1) CFG Peer Average CFG Peer Average 1Q17 CET1 ratio (Basel III transitional basis common equity tier 1 ratio) 86% 87% CFG Peer Average 11.2% 10.5% 0.33% 0.36% |
 Green highlighting denotes new additions since January 2015. Average industry experience of 30 years Leadership Team Member Title Bruce Van Saun Chairman and Chief Executive Officer John F. Woods Chief Financial Officer Mary Ellen Baker EVP and Head of Business Services Brad Conner Vice Chairman and Head of Consumer Banking Stephen Gannon EVP, General Counsel and Chief Legal Officer Malcolm Griggs EVP and Chief Risk Officer Beth Johnson EVP, Chief Marketing Officer and Head of Consumer Strategy Susan LaMonica EVP and Chief Human Resource Officer Don McCree Vice Chairman and Head of Commercial Banking Brian O’Connell EVP and Regional Director Technology Services Board Member Committees Bruce Van Saun Chairman and Chief Executive Officer Arthur F. Ryan Lead Director; Chair of Compensation and Human Resources Committee; Member of Nominating and Corporate Governance Committee Mark Casady Member of Risk Committee Christine Cumming Member of Risk Committee Anthony Di Iorio Member of Audit Committee; Nominating and Corporate Governance Committee William P. Hankowsky Member of Audit Committee; Compensation and Human Resources Committee Howard W. Hanna III Member of Audit Committee; Nominating and Corporate Governance Committee Lee Higdon Member of Audit Committee; Compensation and Human Resources Committee Charles J. (“Bud”) Koch Chair of Risk Committee; Member of Audit Committee Shivan S. Subramaniam Chair of Nominating and Corporate Governance Committee; Member of Risk Committee Wendy A. Watson Chair of Audit Committee; Member of Risk Committee; Compensation and Human Resources Committee Marita Zuraitis Member of Risk Committee We are led by a strong and experienced board & leadership team Since January 2015, have attracted or promoted from within ~32% of our Executive Leadership Group (top 137) 6 |
 Aspire to be a top-performing regional bank, delivering well for all stakeholders
Colleagues
Regulators
Investors
Communities & Society
Customer-centric culture
7 Customers |
 8 Our vision and credo guide us To help our customers, colleagues and communities reach their potential
To be a top-performing bank distinguished by its
customer-centric culture, mindset of continuous
improvement and excellent capabilities We perform our best
every day so we can do more for our customers, colleagues,
communities and shareholders
We strive to always exceed customer expectations, do the right thing,
think long-term, work together
We are citizens helping citizens reach their potential
Mission Vision Credo |
 How we will stand out from the competition Customer-centric focus reflecting: Expertise and deep knowledge of customers High-quality advice Team approach Insights from data and analytics Selective in how and where we play Seeking to self-fund investments through search for efficiency;
expense discipline; mindset of continuous improvement
Utilizing new technologies to deliver more effective outcomes at lower
costs Good stewards of our capital
Consumer:
Banking products
Wealth advice
Data analytics
Personalized solutions
Business partnering
Commercial:
Quality coverage bankers
Capital and global markets
Treasury solutions
Team-based approach
Strong Culture Financial Discipline Excellence in key areas 9 |
 Making consistent progress against our financial goals 10 Goal is to deliver a 10%+ run-rate ROTCE in the medium term 1.0%+ Adjusted efficiency ratio (1) ~60% 10%+ Medium-term targets Key Indicators Adjusted ROTCE (1) Adjusted return on average total tangible assets (1) Adjusted diluted EPS (1) Common equity tier 1 ratio (2) (3) Underlying results (1) Reported results (1) 9.68% 8.98% 0.91% 0.85% Adjusted results (1) 1) Please see important information on Key Performance Metrics and Non-GAAP Financial Measures at the beginning and end of this
presentation for an explanation of our use of these metrics
and non-GAAP financial measures and their reconciliation to GAAP financial measures, as applicable. “Adjusted” results exclude restructuring charges, special items and/or
notable items, as applicable. “Underlying” results exclude a
$23 million benefit related to the settlement of certain state tax matters in the first quarter 2017. 2) Common equity tier 1 ("CET1") capital under Basel III replaced tier 1 common capital under Basel I effective January 1,
2015. 3)
Commencement of separation effort from RBS.
$0.61
$0.57
$0.26 $0.30 $0.30 $0.37 $0.36 $0.39 $0.39 $0.40 $0.40 $0.42 $0.41 $0.46 $0.52 $0.55 3Q13 4Q13 1Q14 2Q14 3Q14 4Q14 1Q15 2Q15 3Q15 4Q15 1Q16 2Q16 3Q16 4Q16 1Q17 13.9% 13.5% 13.4% 13.3% 12.9% 12.4% 12.2% 11.8% 11.8% 11.7% 11.6% 11.5% 11.3% 11.2% 11.2% 68% 68% 69% 70% 68% 67% 68% 67% 66% 66% 66% 65% 63% 62% 62% 0.52% 0.59% 0.57% 0.68% 0.66% 0.69% 0.69% 0.67% 0.68% 0.67% 0.68% 0.72% 0.80% 0.79% 4.34% 5.24% 5.24% 6.28% 6.22% 6.76% 6.73% 6.67% 6.60% 6.75% 6.61% 7.30% 8.02% 8.43% |
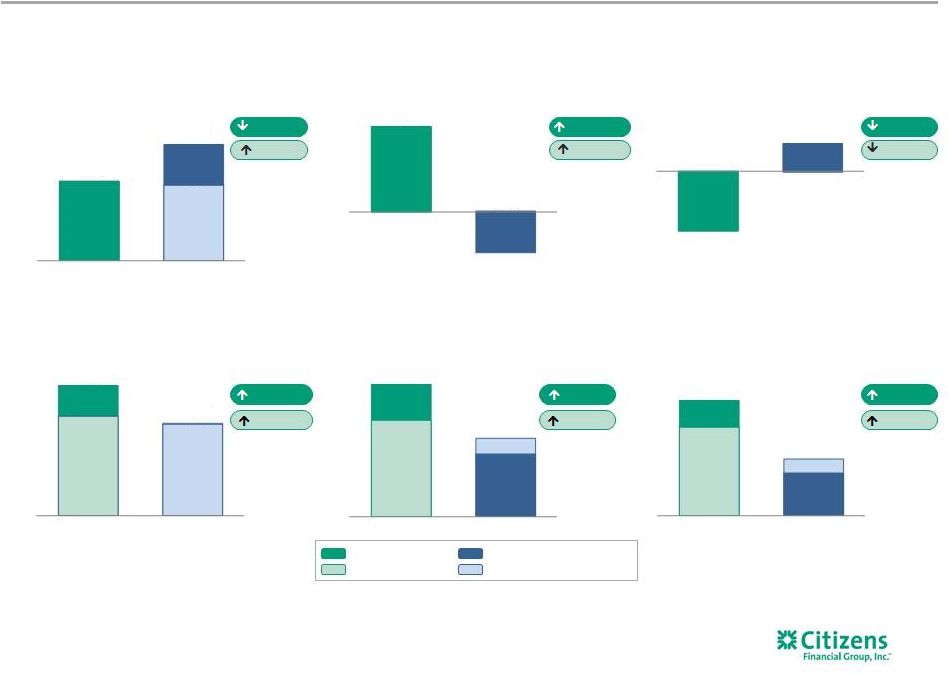
 11 bps improvement 10% growth Adjusted FY2016 outlook vs. Adjusted FY2015 (1) FY2016 performance vs. outlook 11 Actual Adjusted FY2016 vs. FY2015 (1) Note: Balance sheet outlook and actual results reflect average balances except spot loan-to-deposit ratio.
1) Outlook as provided on 4Q15 January 22, 2016 earnings call. Please see important information on Key Performance Metrics and
Non-GAAP Financial Measures at the beginning and end of
this presentation for an explanation of our use of these metrics and
non-GAAP financial measures and their reconciliation to GAAP financial measures, as applicable. “Adjusted” results exclude restructuring charges, special items and/or notable items, as applicable. “Underlying” results exclude a $23
million benefit related to the settlement of certain state tax matters in the first quarter 2017. 2) Reflects impacts linked to higher revenues. Balance sheet 5-6% earning asset growth 6-8% loan growth 5-7% deposit growth 6% 8% 6% *Including the estimated effect of a prospective card reward accounting change.
Net interest margin
Net interest income
6-12 bps improvement
7-10% growth
1% Noninterest income 2.5-4%* 1.3-2.3%* growth 1-2% target* 63-65%* 3% 4.2% 64% (2) Noninterest expense Operating leverage Efficiency ratio $369 million 32 bps 31.7% Provision expense Net charge-off rate Tax rate $375-$425 million normalize modestly ~33% 25-30%/CCAR stock buyback TBD 11.2-11.5% ~98% 24%/$430 million 11.2% spot 99%; avg 98% Dividend payout/stock buyback YE 2016 Basel III CET1 ratio Loan-to-deposit ratio ~85-90 bps/~2.40%-2.50% 2%-3% 4%-5% 75 bps/2.45% 1.6% 4.7% YE 2016: fed funds/10-year rate 2016 GDP growth YE 2016 unemployment rate |
 6 bps improvement 2% growth 1Q17 outlook vs. 4Q16 (1) 1Q17 performance vs. outlook 12 Actual 1Q17 vs. 4Q16 (1) Balance sheet ~1.5% loan growth 1.5% Net interest margin Net interest income 2-3 bps improvement 1% Noninterest income seasonally lower 1-2% positive 1% 0.7% 61.7% Noninterest expense Operating leverage Efficiency ratio $96 million 33 bps 26.4% Provision expense Net charge-off rate Tax rate stable lower 30-31% 11.1% ~98% 23%/$130 million 11.2% spot 97%; avg 99% Dividend payout/stock buyback YE 2017 Basel III CET1 ratio Loan-to-deposit ratio increases in Jun and Nov/Dec Mar17 rate increase YE 2017: fed funds/10-year rate 2017 GDP growth YE 2017 unemployment rate Note: Balance sheet outlook and actual results reflect average balances except spot loan-to-deposit ratio.
1) Outlook as provided on 4Q15 January 22, 2016 earnings call. Please see important information on Key Performance Metrics and
Non-GAAP Financial Measures at the beginning and end of
this presentation for an explanation of our use of these metrics and
non-GAAP financial measures and their reconciliation to GAAP financial measures, as applicable. “Adjusted” results exclude restructuring charges, special items and/or notable items, as applicable. “Underlying” results exclude a $23
million benefit related to the settlement of certain state tax matters in the first quarter 2017. |
 Source: CapIQ and Company filings. Peers include CMA, BBT, FITB, MTB, PNC, RF, STI and USB. As a result of KEY's 3Q16 acquisition
of First Niagara, KEY's results have been excluded from the
Peer average and Peer median. 1)
Where disclosed, peer results adjusted for unusual or special revenue,
expense and acquisition items. 2)
Reflects net interest income sensitivity to forward yield curve changes.
Peer data based on public disclosures as of 1Q17 10-Q filing. Peer data utilizes a +200 basis point gradual increase above the 12-month forward curve except PNC and STI, which disclose +100 basis point gradual increase and +200 basis
point shock. PNC and STI estimated based on the disclosed
data. Strong loan growth
(Average total loan growth)
A strong platform well-positioned to drive value
Growing revenues faster
(Total revenue growth)
Higher NIM expansion
(Net interest margin change)
` Asset-sensitive balance sheet (+200 bps gradual increase over forward curve (2) ) Peer data as of most recent 10-Q filing 10 bps Robust NII growth (Net interest income growth) Fee income growth (Noninterest income growth) 13 335 bps vs Peers 5 bps vs Peers 215 bps vs Peers Delivered attractive balance sheet and revenue growth in 1Q17 1Q17 vs. 1Q16 772 bps vs Peers 702 bps CFG GAAP Peer average GAAP Peer average Adjusted (1) 723 bps vs Peers 739 bps 957 bps vs Peers 762 bps 7.8% 4.4% CFG Peer Average 5.1% 12.2% 4.4% CFG Peer Average 5 bps CFG Peer Average 11.2% 3.9% 3.8% CFG Peer Average 14.8% 7.2% 5.3% CFG Peer Average 6.0% 3.9% CFG Peer Median |
 Well-controlled expenses; investing for growth (Noninterest expense change) Efficiency improvement (Efficiency ratio (1) change) Accelerating profitability (Net income available to common stockholders change) ` Return on equity (Return on average tangible common equity (1) change) Improving ROA as assets grow (Return on average total assets change) Strong operating leverage (YoY Positive operating leverage (1) ) 14 (398) bps 237 bps Source: CapIQ and Company filings. Peers include CMA, BBT, FITB, MTB, PNC, RF, STI and USB. As a result of KEY's 3Q16 acquisition
of First Niagara, KEY's results have been excluded from the
peer average and peer median. 1)
Please see important information on Key Performance Metrics and
Non-GAAP Financial Measures at the beginning and end of this presentation for an explanation of our use of these metrics and non-GAAP financial measures and their reconciliation to GAAP financial measures, as applicable.
“Adjusted” results exclude restructuring charges, special items and/or notable items, as applicable. “Underlying” results exclude a $23 million benefit related to the settlement of
certain state tax matters in the first quarter 2017.
2) Where disclosed, peer results adjusted for unusual or special revenue, expense and acquisition items.
With continued focus on expense control and improving returns
1Q17 vs. 1Q16
CFG GAAP
CFG Underlying
(1) Peer average GAAP Peer average Adjusted (2) 1314 bps vs Peers 279 bps 16 bps 11 bps vs Peers 3 bps 194 bps vs Peers 86 bps 307 bps (3.3)% 187 bps 22 bps 13 bps 11 bps 151 bps 113 bps 243 bps vs Peers 24 bps 1016 bps vs Peers 678 bps 585 bps vs Peers 394 bps (4) bps CFG Peer Average 6.9% 0.1% CFG Peer Average 5.3% 7.7% 5.1% CFG Peer Average 44.9% 31.8% 34.3% 31.5% CFG Peer Average CFG Peer Average CFG Peer Average |
 Initiative 1Q17 Status Commentary Grow and deepen relationships with primary households Primary households up ~23,000 YoY and added ~15,000 primary HHs with a loan or investment. Continue to
build out Mass Affluent and Affluent value propositions. Citizens
Checkup continues to help build stronger relationships
with customers and maintains high levels of customer satisfaction. Expand mortgage sales force Expanding platform with LOs up 124 YoY and 22 from 4Q16 to 560. Originations up 20% YoY
though down 25%
from 4Q16 due to re-finance headwinds. Fulfillment efficiency and
Top-box satisfaction showing improvement.
Strengthening linkages with wealth business. Optimize
Auto Continue to optimize returns in business through
focus on most profitable dealers and increased pricing.
Reducing portfolio in favor of more attractive education and unsecured
assets. SCUSA deal ends April 30. Grow Education/Unsecured
Credit
Continued strong momentum in education with total loan balances up 45%
YoY driven by steady growth in
Ed Refi. Apple iUp
balances up nicely YoY, adding new partners; expanding unsecured
through targeted marketing.
Expand Business Banking
Loan originations up YoY
reflecting increased demand for credit and new sales alignment
implemented in 2016. Deposit balances up 6%
YoY. Expand Wealth
Expand Wealth FCs up 31 YoY
to 360. YoY
managed money sales up 300% with Investment sales up 25%.
Fee-based business mix improved to 36% from 14% in
1Q16. Continue development of Capital
and Global Markets activities
Fee income up 89% YoY, reflecting strong capital markets activity in
loan and bond markets and modest growth in derivatives
and FX activity; benefitting from expanded capabilities.
Build out Treasury Solutions
Fees up
8% compared to prior-year quarter, reflecting pricing increase,
improving sales activity and a 15% increase in commercial
card fees. Maintaining focus on growing deposits. Continuing to build out product- and industry-specialist teams. Grow Franchise Finance Strong growth with balances up 27% YoY. Continue expansion in well-established brands of quick-service and
fast-casual franchises.
Expand Middle Market
Loan balances up 5% and origination volumes up 51% YoY. Deposits up $590 million, or 8%, and fee income up 16% YoY, driven by initiatives to deepen relationships with customers. Build out Mid-corp & Verticals Overall loan growth of 18% YoY, driven by Healthcare and Technology Industry Verticals, which had loan
growth of 28% YoY. Fee income up $26 million, or 80%
YoY. Prudently grow CRE Continue to deepen client penetration with top developers in core
geographies, while moderating growth in
multi-family and retail sectors. CRE loans grew 16%
YoY to $10.1
billion.
Reposition Asset Finance
Continue to realign product offering and strategy towards core Middle
Market and Mid-corp customers to drive
improved spread and fees.
Balance Sheet Optimization
NIM increased 10 bps YoY
with approximately one-half of the increase due to continued
execution of balance sheet strategies
targeting improved mix and pricing. Continue to optimize
auto and asset finance portfolios for higher
returns. TOP III
TOP III program on track to meet targeted run-rate pre-tax
benefit of $100-$115 million
by end of 2017. Summary of progress on strategic initiatives 15 Note: Slide information as of 4/20/2017. |
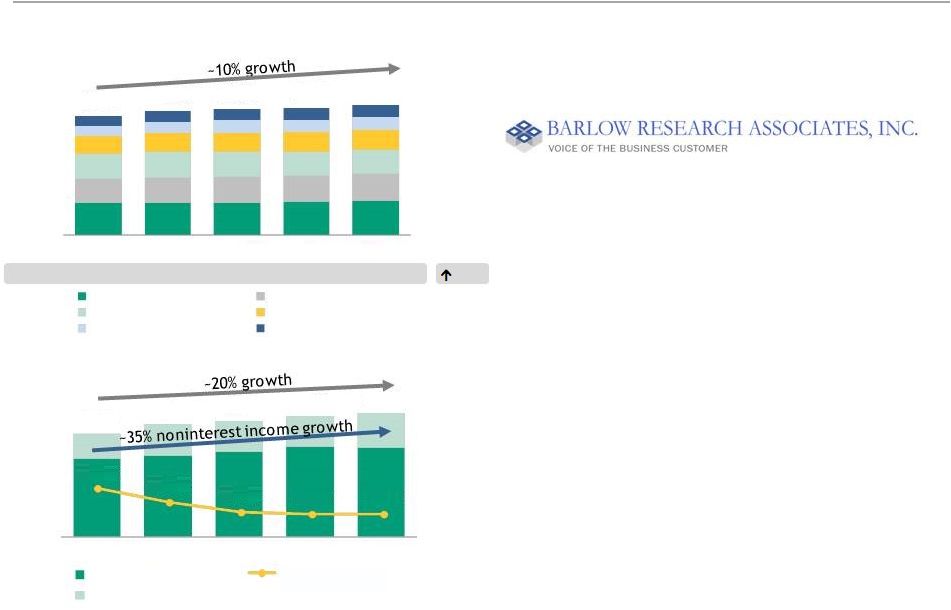
 Top 5 JD Power recognition Mortgage servicing and originations (2) Top 5 Business Banking (3) 10% better than peers Customer branch experience (4) 2016 Javelin Mobile Banking Leader in App Rating category (5) Noninterest income Consumer Banking 16 $s in billions Driving revenue improvement Robust loan growth Results reflect strong loan growth, improving yields, and investment in talent,
infrastructure, product and advisory capabilities
$s in millions
Note: Loan and deposit balances represent average balances.
1) Please see important information on Key Performance Metrics and Non-GAAP Financial Measures at the beginning and end of this
presentation for an explanation of our use of these metrics
and non-GAAP financial measures and their reconciliation to GAAP financial measures, as applicable. “Adjusted” results exclude restructuring charges, special items and/or
notable items, as applicable. “Underlying” results exclude a
$23 million benefit related to the settlement of certain state tax matters in the first quarter 2017. 2) JD Power survey results reflect 2015-2016 assessment period. 3) Greenwich survey period from October 1, 2015 to September 30, 2016.
4) JD Power survey results reflect 2015 – 2016 assessment period and derive from JD Power branch servicing assessment score. 5) Javelin Strategy & Research. (1) ~5% Recognition $53.5 $54.0 $55.0 $56.2 $56.9 1Q16 2Q16 3Q16 4Q16 1Q17 Home equity Auto Mortgage Education Business banking Other Deposits $70.9 $71.9 $72.1 $73.1 $74.1 78.1% 77.0% 76.5% 74.9% 75.4% Efficiency ratio $789 $821 $850 $866 $858 1Q16 2Q16 3Q16 4Q16 1Q17 Net interest income |
 17 Consumer Banking — Delivering on a multi-year growth strategy Utilizing segmentation strategies to drive primary household growth and attract, retain and
deepen customer relationships
Enhancing Mass Affluent and Affluent offerings, expanding merchant
partnership financing, growing education refinance and
personal unsecured Further enhancing branch network
efficiency and effectiveness Evolving distribution to
better meet changing consumer preferences and create integrated multi-channel experience Leveraging analytics, targeting and fulfillment capabilities Improving customer acquisition and experience Focus on becoming trusted advisor and developing deeper customer relationships
Driving continued improvement in fee income
Significant investments in Wealth and Mortgage capabilities showing
results |
 94% Barlow Overall Customer Satisfaction (3) 96% Relationship manager Satisfaction (3) Top 10 Middle Market Syndications (4) 22% annual growth Lead-left or joint-lead relationships (4) Commercial Banking – Solid track record of delivering organic growth 18 Note: Loan and deposit balances represent average balances. 1) Includes Business Capital, Govt & Professional Banking, Corporate Finance & Global Markets, Treasury Solutions, Corporate and Commercial Banking Admin. 2) Please see important information on Key Performance Metrics and Non-GAAP Financial Measures at the beginning and end of this
presentation for an explanation of our use of these metrics and non-GAAP financial measures and their reconciliation to GAAP financial measures, as applicable. “Adjusted” results exclude restructuring
charges, special items and/or notable items, as applicable. “Underlying” results exclude a $23 million benefit related to the settlement of certain state tax matters in the first quarter 2017.
3) Source: Barlow Research 2016 Voice of the Customer Survey, Top-2 box score, all Citizens Commercial Banking respondents
(n=606) 4)
Thomson Reuters LPC, Loan syndications 4Q16 ranking based on number of
deals for Overall Middle Market (defined as Borrower Revenues < $500MM and Deal Size < $500MM) as of 12/31/2016. $s in billions Driving revenue improvement Strong loan growth Results reflect continued investment in talent, and enhanced product and advisory capabilities
(2) $s in millions ~17% Recognition (1) Deposits $24.8 $25.1 $27.8 $29.4 $29.0 $399 $436 $450 $469 $480 1Q16 2Q16 3Q16 4Q16 1Q17 Net interest income Noninterest income 46.7% 42.9% 40.2% 39.8% 39.8% $43.8 $45.9 $46.5 $46.9 $48.0 1Q16 2Q16 3Q16 4Q16 1Q17 Middle Market CRE Asset Finance & Other Mid-corporate Franchise Finance Industry Verticals Efficiency ratio |
 19 Commercial Banking - Consistently enhancing our capabilities and gaining market share 1) Thomson Reuters LPC, Loan syndications 4Q16 ranking based on number of deals for Overall Middle Market (defined as Borrower
Revenues < $500MM and Deal Size < $500MM) as of
12/31/2016. Drive deeper share of wallet with existing
credit relationships and attract new relationships Focus on
enhancing product and service capabilities with selective extension into attractive growth areas Prudently expand geographic reach in Southeast Continue investment in key infrastructure and technology platforms (FX, IRP, Cash Mgmt.)
Continue momentum in Capital Markets
Continue to bolster strategic advice model for M&A, capital
structure, valuation and capital raises
Maintain top ten or better syndications league table status
(1) Commitment to uptiering leadership and talent Adding Market Leaders in Southeast, Midwest and New York metro to optimize client
coverage model
Created a National Sales Manager role to drive consistent account
prioritization and coverage routines
Continue to drive growth in lead-client relationships
|
 Key messages 20 Citizens 1Q17 results highlight continued momentum Strong revenue, net income and EPS growth Robust operating leverage, expanding net interest margin, improving efficiency ratio and
active capital management
ROTCE of 9.7%; 9.0% excluding the impact of certain state tax
matters (1)
Strong balance sheet position
Above peer-average CET1 ratio permits strong loan growth and
attractive returns to shareholders Attractive loan growth
with continued improvement in credit quality Disciplined
execution on growing more attractive risk-adjusted return portfolios Keen focus on continuous improvement and delivering benefits from TOP efficiency programs
Continue to self-fund significant investments in technology, talent
and growth initiatives Strong execution against
initiatives In particular, Capital Markets, Global Markets
and Wealth Management showed strong momentum in
1Q17 On track to deliver well for all stakeholders in
2017 Progressing well on objectives for customers,
colleagues, communities, shareholders and
regulators
1) Please see important information on Key Performance Metrics and Non-GAAP Financial Measures at the beginning and end of this
presentation for an explanation of our use of these metrics
and non-GAAP financial measures and their reconciliation to GAAP financial measures, as applicable. “Adjusted” results exclude restructuring charges, special items and/or
notable items, as applicable. “Underlying” results exclude a
$23 million benefit related to the settlement of certain state tax matters in the first quarter 2017. We are making strong, consistent progress and will continue to focus on
disciplined execution |
 Appendix / Key performance metrics, Non-GAAP financial measures and reconciliations 21 |
 Key performance metrics, Non-GAAP financial measures and reconciliations
22 $s in millions, except share, per share and ratio data 1Q17 4Q16 3Q16 2Q16 1Q16 $ % $ % Noninterest income, adjusted: Noninterest income (GAAP) $379 $377 $435 $355 $330 $2 1 % $49 15 % Less: Notable items — — 67 — — — — — — Noninterest income, adjusted (non-GAAP) $379 $377 $368 $355 $330 $2 1 % $49 15 % Total revenue, adjusted: Total revenue (GAAP) A $1,384 $1,363 $1,380 $1,278 $1,234 $21 2 % $150 12 % Less: Notable items — — 67 — — — — — — Total revenue, adjusted (non-GAAP) B $1,384 $1,363 $1,313 $1,278 $1,234 $21 2 % $150 12 % Noninterest expense, adjusted: Noninterest expense (GAAP) C $854 $847 $867 $827 $811 $7 1 % $43 5 % Less: Notable items — — 36 — — — — — — Noninterest expense, adjusted (non-GAAP) D $854 $847 $831 $827 $811 $7 1 % $43 5 % Pre-provision profit: Total revenue (GAAP) A $1,384 $1,363 $1,380 $1,278 $1,234 $21 2 % $150 12 % Noninterest expense (GAAP) C 854 847 867 827 811 7 1 43 5 Pre-provision profit (GAAP) $530 $516 $513 $451 $423 $14 3 % $107 25 % Pre-provision profit, adjusted: Total revenue, adjusted (non-GAAP) B $1,384 $1,363 $1,313 $1,278 $1,234 $21 2 % $150 12 % Less: Noninterest expense, adjusted (non-GAAP) D 854 847 831 827 811 7 1 43 5 Pre-provision profit, adjusted (non-GAAP) $530 $516 $482 $451 $423 $14 3 % $107 25 % Income before income tax expense, adjusted: Income before income tax expense (GAAP) $434 $414 $427 $361 $332 $20 5 % $102 31 % Less: Income before income tax expense (benefit) related to notable items
—
—
31 — — — — — — Income before income tax expense, adjusted (non-GAAP) $434 $414 $396 $361 $332 $20 5 % $102 31 % Income tax expense and effective income tax rate, adjusted: Income tax expense (GAAP) $114 $132 $130 $118 $109 ($18) (14%) $5 5 % Less: Income tax expense (benefit) related to notable items — — 12 — — — — — — Income tax expense, adjusted (non-GAAP) $114 $132 $118 $118 $109 ($18) (14%) $5 5 % Net income, adjusted: Net income (GAAP) E $320 $282 $297 $243 $223 $38 13 % $97 43 % Add: Notable items, net of income tax expense (benefit) — — (19) — — — — — — Net income, adjusted (non-GAAP) F $320 $282 $278 $243 $223 $38 13 % $97 43 % Net income available to common stockholders, adjusted: Net income available to common stockholders (GAAP) G $313 $282 $290 $243 $216 $31 11% $97 45 % Add: Notable items, net of income tax expense (benefit) — — (19) — — — — — — Net income available to common stockholders, adjusted (non-GAAP)
H $313 $282 $271 $243 $216 $31 11 % $97 45 % 4Q16 1Q16 QUARTERLY TRENDS 1Q17 Change |
 Key performance metrics, Non-GAAP financial measures and reconciliations
23 $s in millions, except share, per share and ratio data 1Q17 4Q16 3Q16 2Q16 1Q16 $/bps % $/bps % Operating leverage: Total revenue (GAAP) A $1,384 $1,363 $1,380 $1,278 $1,234 $21 1.54 % $150 12.16 % Less: Noninterest expense (GAAP) C 854 847 867 827 811 7 0.83 43 5.30 Operating leverage 0.71 % 6.86 % Operating leverage, adjusted: Total revenue, adjusted (non-GAAP) B $1,384 $1,363 $1,313 $1,278 $1,234 $21 1.54 % $150 12.16 % Less: Noninterest expense, adjusted (non-GAAP) D 854 847 831 827 811 7 0.83 43 5.30 Operating leverage, adjusted (non-GAAP) 0.71 % 6.86 % Efficiency ratio and efficiency ratio, adjusted: Efficiency ratio C/A 61.68 % 62.18 % 62.88 % 64.71 % 65.66 % (50) bps (398) bps Efficiency ratio, adjusted (non-GAAP) D/B 61.68 62.18 63.31 64.71 65.66 (50) bps (398) bps Return on average common equity and return on average common equity, adjusted:
Average common equity (GAAP)
I $19,460 $19,645 $19,810 $19,768 $19,567 ($185) (1%) ($107) (1%) Return on average common equity G/I 6.52 % 5.70 % 5.82 % 4.94 % 4.45 % 82 bps 207 bps Return on average common equity, adjusted (non-GAAP) H/I 6.52 5.70 5.44 4.94 4.45 82 bps 207 bps Return on average tangible common equity and return on average tangible common equity, adjusted:
Average common equity (GAAP)
I $19,460 $19,645 $19,810 $19,768 $19,567 ($185) (1%) ($107) (1%) Less: Average goodwill (GAAP) 6,876 6,876 6,876 6,876 6,876 — — — — Less: Average other intangibles (GAAP) — 1 1 2 3 (1) (100) (3) (100) Add: Average deferred tax liabilities related to goodwill (GAAP) 531 523 509 496 481 8 2 50 10 Average tangible common equity J $13,115 $13,291 $13,442 $13,386 $13,169 ($176) (1%) ($54) —% Return on average tangible common equity G/J 9.68 % 8.43 % 8.58 % 7.30 % 6.61 % 125 bps 307 bps Return on average tangible common equity, adjusted (non-GAAP)
H/J 9.68 8.43 8.02 7.30 6.61 125 bps 307 bps Return on average total assets and return on average total assets, adjusted:
Average total assets (GAAP)
K $148,786 $147,315 $144,399 $142,179 $138,780 $1,471 1 % $10,006 7 % Return on average total assets E/K 0.87 % 0.76 % 0.82 % 0.69 % 0.65 % 11 bps 22 bps Return on average total assets, adjusted (non-GAAP) F/K 0.87 0.76 0.77 0.69 0.65 11 bps 22 bps Return on average total tangible assets and return on average total tangible assets, adjusted:
Average total assets (GAAP)
K $148,786 $147,315 $144,399 $142,179 $138,780 $1,471 1 % $10,006 7 % Less: Average goodwill (GAAP) 6,876 6,876 6,876 6,876 6,876 — — — — Less: Average other intangibles (GAAP) — 1 1 2 3 (1) (100) (3) (100) Add: Average deferred tax liabilities related to goodwill (GAAP) 531 523 509 496 481 8 2 50 10 Average tangible assets L $142,441 $140,961 $138,031 $135,797 $132,382 $1,480 1 % $10,059 8 % Return on average total tangible assets E/L 0.91 % 0.79 % 0.86 % 0.72 % 0.68 % 12 bps 23 bps Return on average total tangible assets, adjusted (non-GAAP) F/L 0.91 0.79 0.80 0.72 0.68 12 bps 23 bps QUARTERLY TRENDS 1Q17 Change 4Q16 1Q16 |
 Key performance metrics, Non-GAAP financial measures and reconciliations
24 $s in millions, except share, per share and ratio data 1Q17 4Q16 3Q16 2Q16 1Q16 $/bps % $/bps % Tangible book value per common share: Common shares - at end of period (GAAP) M 509,515,646 511,954,871 518,148,345 529,094,976 528,933,727 (2,439,225) —% (19,418,081) (4%) Common stockholders' equity (GAAP) $19,600 $19,499 $19,934 $19,979 $19,718 $101 1 ($118) (1) Less: Goodwill (GAAP) 6,876 6,876 6,876 6,876 6,876 — — — — Less: Other intangible assets (GAAP) — 1 1 2 3 (1) (100) (3) (100) Add: Deferred tax liabilities related to goodwill (GAAP) 534 532 519 507 494 2 — 40 8 Tangible common equity N $13,258 $13,154 $13,576 $13,608 $13,333 $104 1 % ($75) (1%) Tangible book value per common share N/M $26.02 $25.69 $26.20 $25.72 $25.21 $0.33 1 % $0.81 3 % Net income per average common share - basic and diluted, adjusted: Average common shares outstanding - basic (GAAP) O 509,451,450 512,015,920 519,458,976 528,968,330 528,070,648 (2,564,470) (1%) (18,619,198) (4%) Average common shares outstanding - diluted (GAAP) P 511,348,200 513,897,085 521,122,466 530,365,203 530,446,188 (2,548,885) — (19,097,988) (4) Net income available to common stockholders (GAAP) G $313 $282 $290 $243 $216 $31 11 $97 45 Net income per average common share - basic (GAAP) G/O 0.61 0.55 0.56 0.46 0.41 0.06 11 0.20 49 Net income per average common share - diluted (GAAP) G/P 0.61 0.55 0.56 0.46 0.41 0.06 11 0.20 49 Net income available to common stockholders, adjusted (non-GAAP)
H 313 282 271 243 216 31 11 97 45 Net income per average common share - basic, adjusted (non-GAAP) H/O 0.61 0.55 0.52 0.46 0.41 0.06 11 0.20 49 Net income per average common share - diluted, adjusted (non-GAAP) H/P 0.61 0.55 0.52 0.46 0.41 0.06 11 0.20 49 Pro forma Basel III fully phased-in common equity tier 1 capital ratio
1 : Common equity tier 1 capital (regulatory) $13,941 $13,822 $13,763 $13,768 $13,570 Less: Change in DTA and other threshold deductions (GAAP) — — — 1 1 Pro forma Basel III fully phased-in common equity tier 1 capital
Q $13,941 $13,822 $13,763 $13,767 $13,569 Risk-weighted assets (regulatory general risk weight approach)
$124,881
$123,857
$121,612
$119,492
$116,591
Add: Net change in credit and other risk-weighted assets
(regulatory) 247
244 228 228 232 Pro forma Basel III standardized approach risk-weighted assets
R $125,128 $124,101 $121,840 $119,720 $116,823 Pro forma Basel III fully phased-in common equity tier 1 capital ratio
1 Q/R 11.1 % 11.1 % 11.3 % 11.5 % 11.6 % QUARTERLY TRENDS 1Q17 Change 4Q16 1Q16 1 Basel III ratios assume certain definitions impacting qualifying Basel III capital, which otherwise will phase in through
2019, are fully phased-in. Ratios also reflect the
required US Standardized methodology for calculating RWAs, effective January 1, 2015. |
 Key performance metrics, Non-GAAP financial measures and reconciliations
25 $s in millions, except share, per share and ratio data 1Q17 4Q16 3Q16 2Q16 1Q16 $ % $ % Other income, adjusted Other income (GAAP) $24 $25 $87 $15 $20 ($1) (4%) $4 20 % Less: Notable items — — 67 — — — — — — Other income, adjusted (non-GAAP) $24 $25 $20 $15 $20 ($1) (4%) $4 20 % Salaries and employee benefits, adjusted: Salaries and employee benefits (GAAP) $444 $420 $432 $432 $425 $24 6 % $19 4 % Less: Notable items — — 11 — — — — — — Salaries and employee benefits, adjusted (non-GAAP) $444 $420 $421 $432 $425 $24 6 % $19 4 % Outside services, adjusted: Outside services (GAAP) $91 $98 $102 $86 $91 ($7) (7%) $— —% Less: Notable items — — 8 — — — — — — Outside services, adjusted (non-GAAP) $91 $98 $94 $86 $91 ($7) (7%) $— —% Occupancy, adjusted: Occupancy (GAAP) $82 $77 $78 $76 $76 $5 6 % $6 8 % Less: Notable items — — — — — — — — — Occupancy, adjusted (non-GAAP) $82 $77 $78 $76 $76 $5 6 % $6 8 % Equipment expense, adjusted: Equipment expense (GAAP) $67 $69 $65 $64 $65 ($2) (3%) $2 3 % Less: Notable items — — — — — — — — — Equipment expense, adjusted (non-GAAP) $67 $69 $65 $64 $65 ($2) (3%) $2 3 % Amortization of software, adjusted: Amortization of software (GAAP) $44 $44 $46 $41 $39 $— —% $5 13 % Less: Notable items — — 3 — — — — — — Amortization of software, adjusted (non-GAAP) $44 $44 $43 $41 $39 $— —% $5 13 % Other operating expense, adjusted: Other operating expense (GAAP) $126 $139 $144 $128 $115 ($13) (9%) $11 10 % Less: Notable items — — 14 — — — — — — Other operating expense, adjusted (non-GAAP) $126 $139 $130 $128 $115 ($13) (9%) $11 10 % 4Q16 1Q16 QUARTERLY TRENDS 1Q17 Change |
 Key performance metrics, Non-GAAP financial measures and reconciliations
26 $s in millions, except share, per share and ratio data 2016 2015 $ % Noninterest income, adjusted: Noninterest income (GAAP) $1,497 $1,422 $75 5 % Less: Special items — — — — Less: Notable items 67 — 67 100 Noninterest income, adjusted (non-GAAP) $1,430 $1,422 $8 1 % Total revenue, adjusted: Total revenue (GAAP) A $5,255 $4,824 $431 9 % Less: Special items — — — — Less: Notable items 67 — 67 100 Total revenue, adjusted (non-GAAP) B $5,188 $4,824 $364 8 % Noninterest expense, adjusted: Noninterest expense (GAAP) C $3,352 $3,259 $93 3 % Less: Restructuring charges and special items — 50 (50) (100) Less: Notable items 36 — 36 100 Noninterest expense, adjusted (non-GAAP) D $3,316 $3,209 $107 3 % Pre-provision profit, adjusted: Total revenue, adjusted (non-GAAP) $5,188 $4,824 $364 8 % Less: Noninterest expense, adjusted (non-GAAP) 3,316 3,209 107 3 Pre-provision profit, adjusted (non-GAAP) $1,872 $1,615 $257 16 % Income before income tax expense, adjusted: Income before income tax expense (GAAP) E $1,534 $1,263 $271 21 % Less: Income before income tax expense (benefit) related to restructuring charges
and special items
—
(50) 50 100 Less: Income before income tax expense (benefit) related to notable items
31 — 31 100 Income before income tax expense, adjusted (non-GAAP) F $1,503 $1,313 $190 14 % Income tax expense, adjusted: Income tax expense (GAAP) G $489 $423 $66 16 % Less: Income tax expense (benefit) related to restructuring charges and special
items — (19) 19 100 Less: Income tax expense (benefit) related to notable items 12 — 12 100 Income tax expense, adjusted (non-GAAP) H $477 $442 $35 8 % Net income, adjusted: Net income (GAAP) I $1,045 $840 $205 24 % Add: Restructuring charges and special items, net of income tax expense (benefit)
—
31 (31) (100) Add: Notable items, net of income tax expense (benefit) (19) — (19) (100) Net income, adjusted (non-GAAP) J $1,026 $871 $155 18 % Net income available to common stockholders, adjusted: Net income available to common stockholders (GAAP) K $1,031 $833 $198 24 % Add: Restructuring charges and special items, net of income tax expense (benefit)
—
31 (31) (100) Add: Notable items, net of income tax expense (benefit) (19) — (19) (100) Net income available to common stockholders, adjusted (non-GAAP)
L $1,012 $864 $148 17 % Effective income tax rate, adjusted: Effective income tax rate G/E 31.88% 33.52% (164) bps Effective income tax rate, adjusted: H/F 31.74 33.67 (193) bps FULL YEAR 2016 Change 2015 |
 Key performance metrics, Non-GAAP financial measures and reconciliations
27 $s in millions, except share, per share and ratio data 2016 2015 $/bps % Operating leverage: Total revenue (GAAP) A $5,255 $4,824 $431 8.93 % Less: Noninterest expense (GAAP) C 3,352 3,259 93 2.85 Operating leverage 6.08 % Operating leverage, adjusted: Total revenue, adjusted (non-GAAP) B $5,188 $4,824 $364 7.55 % Less: Noninterest expense, adjusted (non-GAAP) D 3,316 3,209 107 3.33 Operating leverage, adjusted (non-GAAP) 4.22 % Efficiency ratio and efficiency ratio, adjusted: Efficiency ratio C/A 63.80 % 67.56 % (376) bps Efficiency ratio, adjusted (non-GAAP) D/B 63.92 66.52 (260) bps Return on average common equity and return on average common equity,
adjusted:
Average common equity (GAAP)
M $19,698 $19,354 $344 2 % Return on average common equity K/M 5.23 % 4.30 % 93 bps Return on average common equity, adjusted (non-GAAP) L/M 5.14 4.46 68 bps Return on average tangible common equity and return on average tangible
common equity, adjusted:
Average common equity (GAAP)
M $19,698 $19,354 $344 2 % Less: Average goodwill (GAAP) 6,876 6,876 — — Less: Average other intangibles (GAAP) 2 4 (2) (50) Add: Average deferred tax liabilities related to goodwill (GAAP)
502 445 57 13 Average tangible common equity N $13,322 $12,919 $403 3 % Return on average tangible common equity K/N 7.74 % 6.45 % 129 bps Return on average tangible common equity, adjusted (non-GAAP)
L/N 7.60 6.69 91 bps Return on average total assets and return on average total assets, adjusted:
Average total assets (GAAP)
O $143,183 $135,070 $8,113 6 % Return on average total assets I/O 0.73 % 0.62 % 11 bps Return on average total assets, adjusted (non-GAAP) J/O 0.72 0.64 8 bps Return on average total tangible assets and return on average total tangible
assets, adjusted:
Average total assets (GAAP)
O $143,183 $135,070 $8,113 6 % Less: Average goodwill (GAAP) 6,876 6,876 — — Less: Average other intangibles (GAAP) 2 4 (2) (50) Add: Average deferred tax liabilities related to goodwill (GAAP)
502 445 57 13 Average tangible assets P $136,807 $128,635 $8,172 6 % Return on average total tangible assets I/P 0.76 % 0.65 % 11 bps Return on average total tangible assets, adjusted (non-GAAP)
J/P 0.75 0.68 7 bps FULL YEAR 2016 Change 2015 |
 Key performance metrics, Non-GAAP financial measures and reconciliations
28 $s in millions, except share, per share and ratio data 2016 2015 $/bps % Tangible book value per common share: Common shares - at end of period (GAAP) Q 511,954,871 527,774,428 (15,819,557) (3%) Common stockholders' equity (GAAP) $19,499 $19,399 $100 1 Less: Goodwill (GAAP) 6,876 6,876 — — Less: Other intangible assets (GAAP) 1 3 (2) (67) Add: Deferred tax liabilities related to goodwill (GAAP) 532 480 52 11 Tangible common equity R $13,154 $13,000 $154 1 % Tangible book value per common share R/Q $25.69 $24.63 $1.06 4 % Net income per average common share - basic and diluted, adjusted:
Average common shares outstanding - basic (GAAP)
S 522,093,545 535,599,731 (13,506,186) (3%) Average common shares outstanding - diluted (GAAP) T 523,930,718 538,220,898 (14,290,180) (3) Net income available to common stockholders (GAAP) K $1,031 $833 $198 24 Net income per average common share - basic (GAAP) K/S 1.97 1.55 0.42 27 Net income per average common share - diluted (GAAP) K/T 1.97 1.55 0.42 27 Net income available to common stockholders, adjusted (non-GAAP)
L 1,012 864 148 17 Net income per average common share - basic, adjusted (non-GAAP)
L/S 1.94 1.61 0.33 20 Net income per average common share - diluted, adjusted (non-GAAP)
L/T 1.93 1.61 0.32 20 FULL YEAR 2016 Change 2015 |
 Key performance metrics, Non-GAAP financial measures and reconciliations
29 $s in millions, except share, per share and ratio data Consumer Commercial Other Consolidated Consumer Commercial Other Consolidated Consumer Commercial Other Consolidated Net income available to common stockholders: Net income (loss) (GAAP) A $95 $180 $45 $320 $92 $172 $18 $282 $92 $162 $43 $297 Less: Preferred stock dividends — — 7 7 — — — — — — 7 7 Net income available to common stockholders B $95 $180 $38 $313 $92 $172 $18 $282 $92 $162 $36 $290 Return on average tangible common equity: Average common equity (GAAP) $5,460 $5,528 $8,472 $19,460 $5,275 $5,278 $9,092 $19,645 $5,190 $5,172 $9,448 $19,810 Less: Average goodwill (GAAP) — — 6,876 6,876 — — 6,876 6,876 — — 6,876 6,876 Average other intangibles (GAAP) — — — — — — 1 1 — — 1 1 Add: Average deferred tax liabilities related to goodwill (GAAP) — — 531 531 — — 523 523 — — 509 509 Average tangible common equity C $5,460 $5,528 $2,127 $13,115 $5,275 $5,278 $2,738 $13,291 $5,190 $5,172 $3,080 $13,442 Return on average tangible common equity B/C 7.06 % 13.18 % NM 9.68 % 6.97 % 12.94 % NM 8.43 % 7.04 % 12.50 % NM 8.58 % Return on average total tangible assets: Average total assets (GAAP) $58,660 $49,243 $40,883 $148,786 $58,066 $48,024 $41,225 $147,315 $56,689 $47,902 $39,808 $144,399 Less: Average goodwill (GAAP) — — 6,876 6,876 — — 6,876 6,876 — — 6,876 6,876 Average other intangibles (GAAP) — — — — — — 1 1 — — 1 1 Add: Average deferred tax liabilities related to goodwill (GAAP) — — 531 531 — — 523 523 — — 509 509 Average tangible assets D $58,660 $49,243 $34,538 $142,441 $58,066 $48,024 $34,871 $140,961 $56,689 $47,902 $33,440 $138,031 Return on average total tangible assets A/D 0.66 % 1.48 % NM 0.91 % 0.63 % 1.42 % NM 0.79 % 0.64 % 1.35 % NM 0.86 % Efficiency ratio: Noninterest expense (GAAP) E $647 $190 $17 $854 $649 $187 $11 $847 $650 $181 $36 $867 Net interest income (GAAP) 638 346 21 1,005 639 347 — 986 621 327 (3) 945 Noninterest income (GAAP) 220 134 25 379 227 122 28 377 229 123 83 435 Total revenue (GAAP) F $858 $480 $46 $1,384 $866 $469 $28 $1,363 $850 $450 $80 $1,380 Efficiency ratio E/F 75.41 % 39.80 % NM 61.68 % 74.90 % 39.83 % NM 62.18 % 76.46 % 40.21 % NM 62.88 % 2017 2016 2016 THREE MONTHS ENDED MAR 31, THREE MONTHS ENDED DEC 31, THREE MONTHS ENDED SEPT 30, Consumer Commercial Other Consolidated Consumer Commercial Other Consolidated Net income available to common stockholders: Net income (loss) (GAAP) A $90 $164 ($11) $243 $71 $133 $19 $223 Less: Preferred stock dividends — — — — — — 7 7 Net income available to common stockholders B $90 $164 ($11) $243 $71 $133 $12 $216 Return on average tangible common equity: Average common equity (GAAP) $5,110 $5,040 $9,618 $19,768 $5,089 $4,790 $9,688 $19,567 Less: Average goodwill (GAAP) — — 6,876 6,876 — — 6,876 6,876 Average other intangibles (GAAP) — — 2 2 — — 3 3 Add: Average deferred tax liabilities related to goodwill (GAAP) — — 496 496 — — 481 481 Average tangible common equity C $5,110 $5,040 $3,236 $13,386 $5,089 $4,790 $3,290 $13,169 Return on average tangible common equity B/C 7.09 % 13.04 % NM 7.30 % 5.59 % 11.19 % NM 6.61 % Return on average total tangible assets: Average total assets (GAAP) $55,660 $47,388 $39,131 $142,179 $55,116 $45,304 $38,360 $138,780 Less: Average goodwill (GAAP) — — 6,876 6,876 — — 6,876 6,876 Average other intangibles (GAAP) — — 2 2 — — 3 3 Add: Average deferred tax liabilities related to goodwill (GAAP) — — 496 496 — — 481 481 Average tangible assets D $55,660 $47,388 $32,749 $135,797 $55,116 $45,304 $31,962 $132,382 Return on average total tangible assets A/D 0.65 % 1.39 % NM 0.72 % 0.52 % 1.18 % NM 0.68 % Efficiency ratio: Noninterest expense (GAAP) E $632 $186 $9 $827 $616 $187 $8 $811 Net interest income (GAAP) 602 314 7 923 581 300 23 904 Noninterest income (GAAP) 219 122 14 355 208 99 23 330 Total revenue (GAAP) F $821 $436 $21 $1,278 $789 $399 $46 $1,234 Efficiency ratio E/F 76.98 % 42.88 % NM 64.71 % 78.08 % 46.74 % NM 65.66 % THREE MONTHS ENDED JUNE 30, THREE MONTHS ENDED MAR 31, 2016 2016 |
 Key performance metrics, Non-GAAP financial measures and reconciliations
30 $s in millions, except share, per share and ratio data 1Q17 4Q16 1Q16 $/bps % $/bps % Income before income tax expense (GAAP) A $434 $414 $332 $20 4.8 % $102 30.7 % Income tax expense and effective income tax rate, underlying: Income tax expense (GAAP) B $114 $132 $109 ($18) (13.6)% $5 4.6 % Less: Settlement of certain state tax matters (23) — — (23) (100.0) (23) (100.0) Income tax expense, underlying C $137 $132 $109 $5 3.8 % $28 25.7 % Effective income tax rate (GAAP) B/A 26.36 % 31.90 % 32.87 % (554) bps (651) bps Effective income tax rate, underlying C/A 31.56 31.90 32.87 (34) bps (131) bps Net income, underlying: Net income (GAAP) D $320 $282 $223 $38 13.5 % $97 43.5 % Less: Settlement of certain state tax matters 23 — — 23 100.0 23 100.0 Net income, underlying E $297 $282 $223 $15 5.3 % $74 33.2 % Net income available to common stockholders, underlying: Net income available to common stockholders (GAAP) F $313 $282 $216 $31 11.0 % $97 44.9 % Less: Settlement of certain state tax matters 23 — — 23 100.0 23 100.0 Net income available to common stockholders, underlying G $290 $282 $216 $8 2.8 % $74 34.3 % Return on average common equity and return on average common equity, underlying:
Average common equity (GAAP)
H $19,460 $19,645 $19,567 ($185) (0.9)% ($107) (0.5)% Return on average common equity F/H 6.52 % 5.70 % 4.45 % 82 bps 207 bps Return on average common equity, underlying G/H 6.05 5.70 4.45 35 bps 160 bps Return on average tangible common equity and return on average tangible common equity, underlying:
Average common equity (GAAP)
H $19,460 $19,645 $19,567 ($185) (0.9)% ($107) (0.5)% Less: Average goodwill (GAAP) 6,876 6,876 6,876 — — — — Less: Average other intangibles (GAAP) — 1 3 (1) (100.0) (3) (100.0) Add: Average deferred tax liabilities related to goodwill (GAAP) 531 523 481 8 1.5 50 10.4 Average tangible common equity I $13,115 $13,291 $13,169 ($176) (1.3)% ($54) (0.4)% Return on average tangible common equity F/I 9.68 % 8.43 % 6.61 % 125 bps 307 bps Return on average tangible common equity, underlying G/I 8.98 8.43 6.61 55 bps 237 bps Return on average total assets and return on average total assets, underlying:
Average total assets (GAAP)
J $148,786 $147,315 $138,780 $1,471 1.0 % $10,006 7.2 % Return on average total assets D/J 0.87 % 0.76 % 0.65 % 11 bps 22 bps Return on average total assets, underlying E/J 0.81 0.76 0.65 5 bps 16 bps Return on average total tangible assets and return on average total tangible assets, underlying:
Average total assets (GAAP)
J $148,786 $147,315 $138,780 $1,471 1.0 % $10,006 7.2 % Less: Average goodwill (GAAP) 6,876 6,876 6,876 — — — — Less: Average other intangibles (GAAP) — 1 3 (1) (100.0) (3) (100.0) Add: Average deferred tax liabilities related to goodwill (GAAP) 531 523 481 8 1.5 50 10.4 Average tangible assets K $142,441 $140,961 $132,382 $1,480 1.0 % $10,059 7.6 % Return on average total tangible assets D/K 0.91 % 0.79 % 0.68 % 12 bps 23 bps Return on average total tangible assets, underlying E/K 0.85 0.79 0.68 6 bps 17 bps Net income per average common share - basic and diluted, underlying:
Average common shares outstanding - basic (GAAP)
L 509,451,450 512,015,920 528,070,648 (2,564,470) (0.5)% (18,619,198) (3.5)% Average common shares outstanding - diluted (GAAP) M 511,348,200 513,897,085 530,446,188 (2,548,885) (0.5) (19,097,988) (3.6) Net income available to common stockholders (GAAP) F $313 $282 $216 $31 11.0 $97 44.9 Net income per average common share - basic (GAAP) F/L 0.61 0.55 0.41 0.06 10.9 0.20 48.8 Net income per average common share - diluted (GAAP) F/M 0.61 0.55 0.41 0.06 10.9 0.20 48.8 Net income available to common stockholders, underlying G 290 282 216 8 2.8 74 34.3 Net income per average common share - basic, underlying
G/L 0.57 0.55 0.41 0.02 3.6 0.16 39.0 Net income per average common share - diluted, underlying
G/M 0.57 0.55 0.41 0.02 3.6 0.16 39.0 QUARTERLY TRENDS 1Q17 Change 4Q16 1Q16 |
 Key performance metrics, Non-GAAP financial measures and reconciliations
31 $s in millions, except share, per share and ratio data MAR. 31, DEC. 31, SEP. 30, JUNE 30, MAR. 31, DEC. 31, SEP. 30, JUNE 30, MAR. 31, DEC. 31, SEP. 30, JUNE 30, MAR. 31, DEC. 31, SEP. 30, 2017 2016 2016 2016 2016 2015 2015 2015 2015 2014 2014 2014 2014 2013 2013 Total revenue, adjusted: Total revenue (GAAP) A $1,384 $1,363 $1,380 $1,278 $1,234 $1,232 $1,209 $1,200 $1,183 $1,179 $1,161 $1,473 $1,166 $1,158 $1,153 Less: Special items — — — — — — — — — — — 288 — — — Less: Notable items — — 67 — — — — — — — — — — — — Total revenues, adjusted (non-GAAP) B $1,384 $1,363 $1,313 $1,278 $1,234 $1,232 $1,209 $1,200 $1,183 $1,179 $1,161 $1,185 $1,166 $1,158 $1,153 Noninterest expense, adjusted: Noninterest expense (GAAP) C $854 $847 $867 $827 $811 $810 $798 $841 $810 $824 $810 $948 $810 $818 $788 Less: Restructuring charges and special items — — — — — — — 40 10 33 21 115 — 26 — Less: Notable items — — 36 — — — — — — — — — — — — Noninterest expense, adjusted (non-GAAP) D $854 $847 $831 $827 $811 $810 $798 $801 $800 $791 $789 $833 $810 $792 $788 Efficiency ratio and efficiency ratio, adjusted: Efficiency ratio C/A 62% 62% 63% 65% 66% 66% 66 % 70 % 68 % 70 % 70 % 64 % 69% 71% 68% Efficiency ratio, adjusted (non-GAAP) D/B 62 62 63 65 66 66 66 67 68 67 68 70 69 68 68 Net income, adjusted: Net income (GAAP) E $320 $282 $297 $243 $223 $221 $220 $190 $209 $197 $189 $313 $166 $152 $144 Add: Restructuring charges and special items, net of income tax expense (benefit)
—
—
—
—
—
—
—
25 6 20 13 (108) — 17 — Add: Notable items, net of income tax expense (benefit) — — (19) — — — — — — — — — — — — Net income, adjusted (non-GAAP) F $320 $282 $278 $243 $223 $221 $220 $215 $215 $217 $202 $205 $166 $169 $144 Net income per average common share - diluted, and net income per average common share - diluted,
adjusted Net income available to common stockholders
(GAAP) G
$313 $282 $290 $243 $216 $221 $213 $190 $209 $197 $189 $313 $166 $152 $144 Add: Restructuring charges and special items, net of income tax expense (benefit)
—
—
—
—
—
—
—
25 6 20 13 (108) — 17 — Add: Notable items, net of income tax expense (benefit) — — (19) — — — — — — — — — — — — Net income available to common stockholders, adjusted (non-GAAP)
H $313 $282 $271 $243 $216 $221 $213 $215 $215 $217 $202 $205 $166 $169 $144 Average common shares outstanding - diluted (GAAP) P 511,348,200 513,897,085 521,122,466 530,365,203 530,446,188 530,275,673 533,398,158 539,909,366 549,798,717 550,676,298 560,243,747 559,998,324 559,998,324 559,998,324 559,998,324 Net income per average common share - diluted G/P $0.61 $0.55 $0.56 $0.46 $0.41 $0.42 $0.40 $0.35 $0.38 $0.36 $0.34 $0.56 $0.30 $0.27 $0.26 Net income per average common share - diluted, adjusted (non-GAAP)
H/P 0.61 0.55 0.52 0.46 0.41 0.42 0.40 0.40 0.39 0.39 0.36 0.37 0.30 0.30 0.26 Return on average tangible common equity and return on average tangible common equity, adjusted:
Average common equity (GAAP)
$19,460
$19,645
$19,810
$19,768
$19,567
$19,359
$19,261
$19,391
$19,407
$19,209
$19,411
$19,607
$19,370
$19,364
$19,627
Less: Average goodwill (GAAP)
6,876 6,876 6,876 6,876 6,876 6,876 6,876 6,876 6,876 6,876 6,876 6,876 6,876 6,876 6,876 Less: Average other intangibles (GAAP) — 1 1 2 3 3 4 5 5 6 6 7 7 8 9 Add: Average deferred tax liabilities related to goodwill (GAAP) 531 523 509 496 481 468 453 437 422 403 384 369 351 342 325 Average tangible common equity J $13,115 $13,291 $13,442 $13,386 $13,169 $12,948 $12,834 $12,947 $12,948 $12,730 $12,913 $13,093 $12,838 $12,822 $13,067 Return on average tangible common equity G/J 9.68 % 8.43 % 8.58 % 7.30 % 6.61 % 6.75 % 6.60 % 5.90 % 6.53 % 6.12 % 5.81 % 9.59 % 5.24% 4.71 % 4.34 % Return on average tangible common equity, adjusted (non-GAAP)
H/J 9.68 8.43 8.02 7.30 6.61 6.75 6.60 6.67 6.73 6.76 6.22 6.28 5.24 5.24 4.34 Return on average total tangible assets and return on average total tangible assets, adjusted:
Average total assets (GAAP)
K $148,786 $147,315 $144,399 $142,179 $138,780 $136,298 $135,103 $135,521 $133,325 $130,671 $128,691 $127,148 $123,904 $120,393 $117,386 Less: Average goodwill (GAAP) 6,876 6,876 6,876 6,876 6,876 6,876 6,876 6,876 6,876 6,876 6,876 6,876 6,876 6,876 6,876 Less: Average other intangibles (GAAP) — 1 1 2 3 3 4 5 5 6 6 7 7 8 9 Add: Average deferred tax liabilities related to goodwill (GAAP) 531 523 509 496 481 468 453 437 422 403 384 369 351 342 325 Average tangible assets L $142,441 $140,961 $138,031 $135,797 $132,382 $129,887 $128,676 $129,077 $126,866 $124,192 $122,193 $120,634 $117,372 $113,851 $110,826 Return on average total tangible assets E/L 0.91 % 0.79 % 0.86 % 0.72 % 0.68 % 0.67 % 0.68 % 0.59 % 0.67 % 0.63 % 0.61 % 1.04 % 0.57% 0.53 % 0.52 % Return on average total tangible assets, adjusted (non-GAAP) F/L 0.91 0.79 0.80 0.72 0.68 0.67 0.68 0.67 0.69 0.69 0.66 0.68 0.57 0.59 0.52 FOR THE THREE MONTHS ENDED |
 |