Attached files
| file | filename |
|---|---|
| 8-K - FORM 8-K - AMYRIS, INC. | f8k_051617.htm |
Exhibit 99.1
1 232/151/55 0/90/132 145/145/149 178/187/30 185/52/75 105/109/17 117/76/12 Copyright © 2017 Amyris, Inc. CONFIDENTIAL Biotech Summit 2017 & Investor Day May 16, 2017 Innovative Science for a Healthier Planet
2 232/151/55 0/90/132 145/145/149 178/187/30 185/52/75 105/109/17 117/76/12 This presentation and oral statements accompanying this presentation contain forward - looking statements, and any statements other than statements of historical fact could be deemed to be forward - looking statements. These forward - looking statements include, among other things, statements regarding future events, such as expected returns from funded development, anticipated revenue, including revenue from product sales, collaborations and value share payments, expected gross profit and margin, the anticipated development and commercialization of Amyris’s product pipeline and revenue relating thereto, expected production costs and time to market, anticipated production capacity expansion, including the timing thereof, the anticipated growth rates of Amyris’s target markets and Amyris’s expected market share and revenue by target market, expected annual product sales, revenue and growth rate, anticipated corporate events, including a reverse stock split, expected financing and debt reduction in 2017 and the impact of such financing and debt reduction, expected revenue growth in 2017 and beyond, anticipated improvements of Amyris’s balance sheet and product margins, and expectations regarding Amyris’s financial and operational results and ability to achieve its business plan in 2017 and beyond, that involve risks and uncertainties. These statements are based on management’s current expectations and actual results and future events may differ materially due to risks and uncertainties, including risks related to Amyris’s liquidity and ability to fund operating and capital expenses, timing and execution risks associated with manufacturing, uncertainty regarding consummating potential transactions, including the timing thereof, and growth in sales, potential delays or failures in development, production and commercialization of products, risks related to Amyris's reliance on third parties to achieve its goals, and other risks detailed in the “Risk Factors” section of Amyris’s quarterly report on Form 10 - Q filed on November 9, 2016. Amyris disclaims any obligation to update information contained in these forward - looking statements whether as result of new information, future events, or otherwise. Forward - Looking Statements
3 232/151/55 0/90/132 145/145/149 178/187/30 185/52/75 105/109/17 117/76/12 Copyright © 2017 Amyris, Inc. CONFIDENTIAL Amyris Strategy & Update John Melo Innovative Science for a Healthier Planet Confidential & Proprietary
4 232/151/55 0/90/132 145/145/149 178/187/30 185/52/75 105/109/17 117/76/12 Our Promise Making Better Products For A Healthier Planet
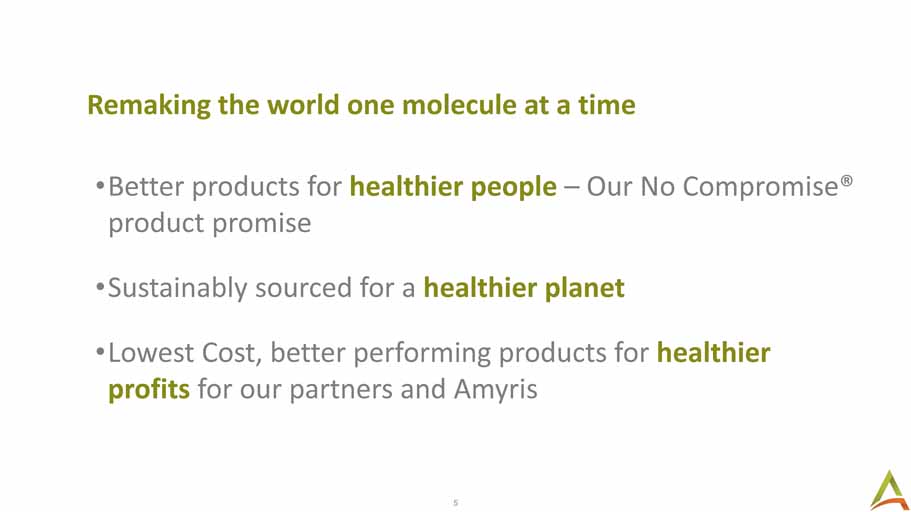
5 232/151/55 0/90/132 145/145/149 178/187/30 185/52/75 105/109/17 117/76/12 • Better products for healthier people – Our No Compromise® product promise • Sustainably sourced for a healthier planet • Lowest Cost, better performing products for healthier profits for our partners and Amyris Remaking the world one molecule at a time
6 232/151/55 0/90/132 145/145/149 178/187/30 185/52/75 105/109/17 117/76/12 Amyris. We are:
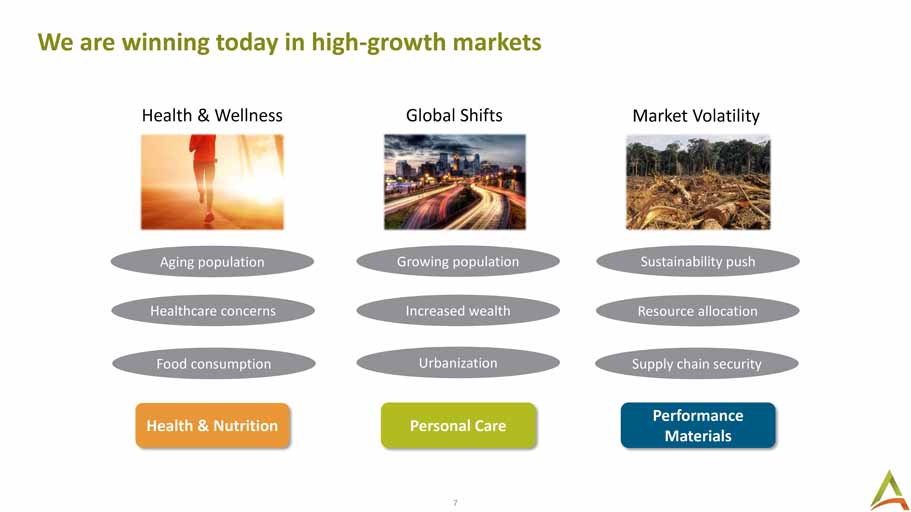
7 232/151/55 0/90/132 145/145/149 178/187/30 185/52/75 105/109/17 117/76/12 We are winning today in high - growth markets Health & Wellness Global Shifts Market Volatility Health & Nutrition Personal Care Performance Materials Food consumption Healthcare concerns Aging population Growing population Sustainability push Increased wealth Resource allocation Urbanization Supply chain security
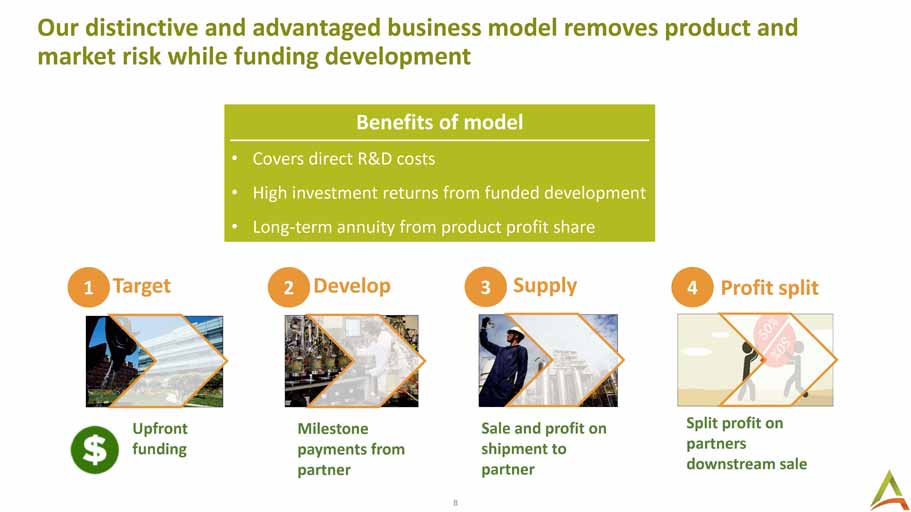
8 232/151/55 0/90/132 145/145/149 178/187/30 185/52/75 105/109/17 117/76/12 Our distinctive and advantaged business model removes product and market risk while funding development 1 2 3 4 Target Develop Supply Profit split Upfront funding Milestone payments from partner Sale and profit on shipment to partner Split profit on partners downstream sale Benefits of model • Covers direct R&D costs • High investment returns from funded development • Long - term annuity from product profit share
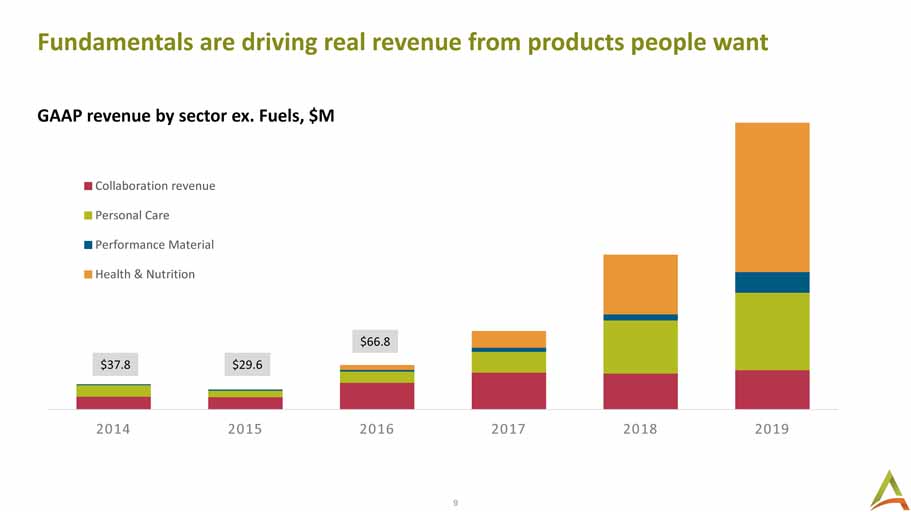
9 232/151/55 0/90/132 145/145/149 178/187/30 185/52/75 105/109/17 117/76/12 2014 2015 2016 2017 2018 2019 Collaboration revenue Personal Care Performance Material Health & Nutrition Fundamentals are driving real revenue from products people want GAAP revenue by sector ex. Fuels, $M $29.6 $66.8 $37.8
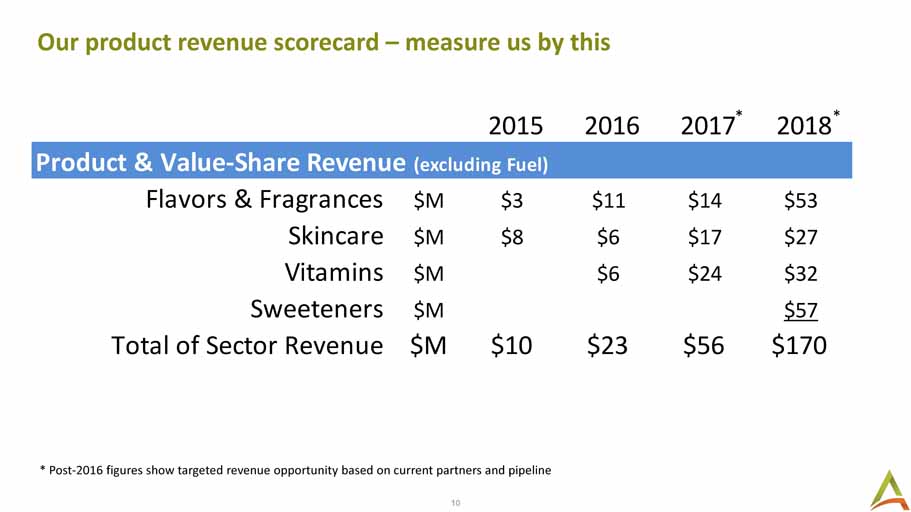
10 232/151/55 0/90/132 145/145/149 178/187/30 185/52/75 105/109/17 117/76/12 Our product revenue scorecard – measure us by this 2015 2016 2017 2018 Product & Value-Share Revenue (excluding Fuel) Flavors & Fragrances $M $3 $11 $14 $53 Skincare $M $8 $6 $17 $27 Vitamins $M $6 $24 $32 Sweeteners $M $57 Total of Sector Revenue $M $10 $23 $56 $170 * Post - 2016 figures show targeted revenue opportunity based on current partners and pipeline * *
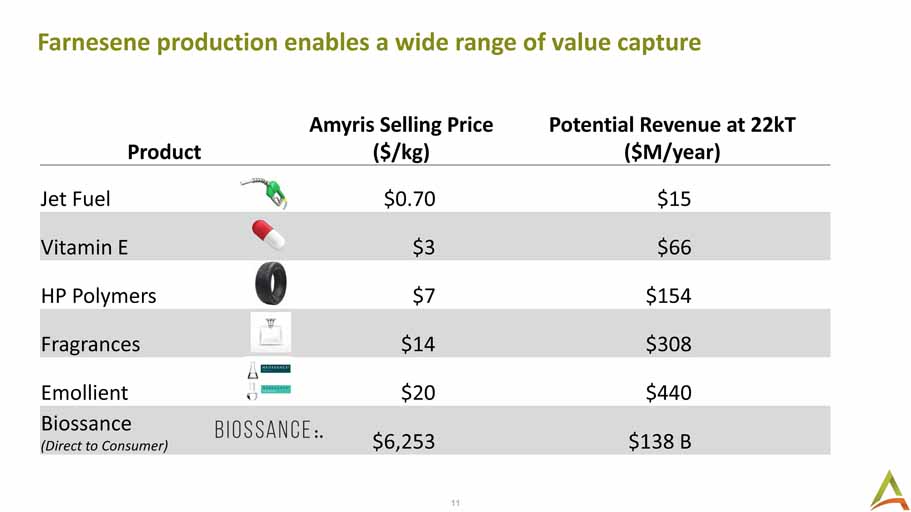
11 232/151/55 0/90/132 145/145/149 178/187/30 185/52/75 105/109/17 117/76/12 Farnesene production enables a wide range of value capture Product Amyris Selling Price ($/kg) Potential Revenue at 22kT ($M/year) Jet Fuel $0.70 $15 Vitamin E $3 $66 HP Polymers $7 $154 Fragrances $14 $308 Emollient $20 $440 Biossance (Direct to Consumer) $6,253 $138 B
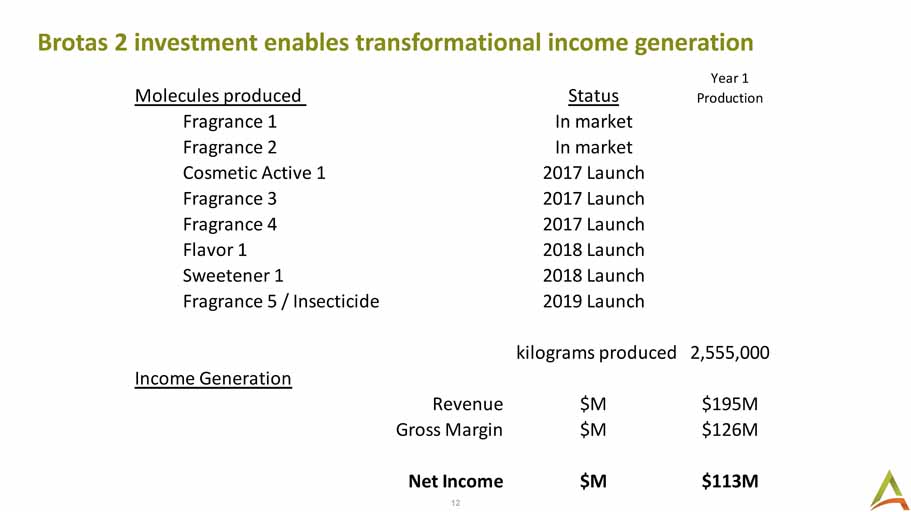
12 232/151/55 0/90/132 145/145/149 178/187/30 185/52/75 105/109/17 117/76/12 Brotas 2 investment enables transformational income generation Molecules produced Status Year 1 Production Fragrance 1 In market Fragrance 2 In market Cosmetic Active 1 2017 Launch Fragrance 3 2017 Launch Fragrance 4 2017 Launch Flavor 1 2018 Launch Sweetener 1 2018 Launch Fragrance 5 / Insecticide 2019 Launch kilograms produced 2,555,000 Income Generation Revenue $M $195M Gross Margin $M $126M Net Income $M $113M
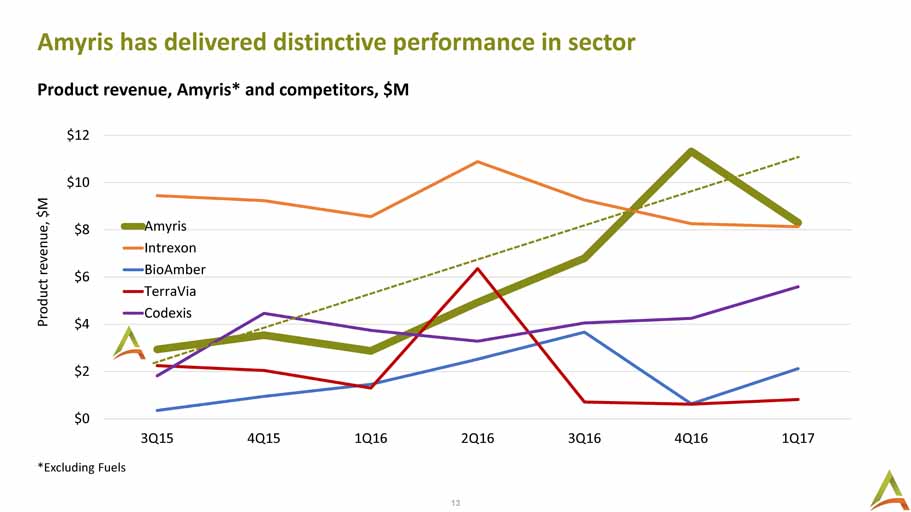
13 232/151/55 0/90/132 145/145/149 178/187/30 185/52/75 105/109/17 117/76/12 Amyris has delivered distinctive performance in sector Product revenue, Amyris* and competitors, $M *Excluding Fuels $0 $2 $4 $6 $8 $10 $12 3Q15 4Q15 1Q16 2Q16 3Q16 4Q16 1Q17 Product revenue, $M Amyris Intrexon BioAmber TerraVia Codexis
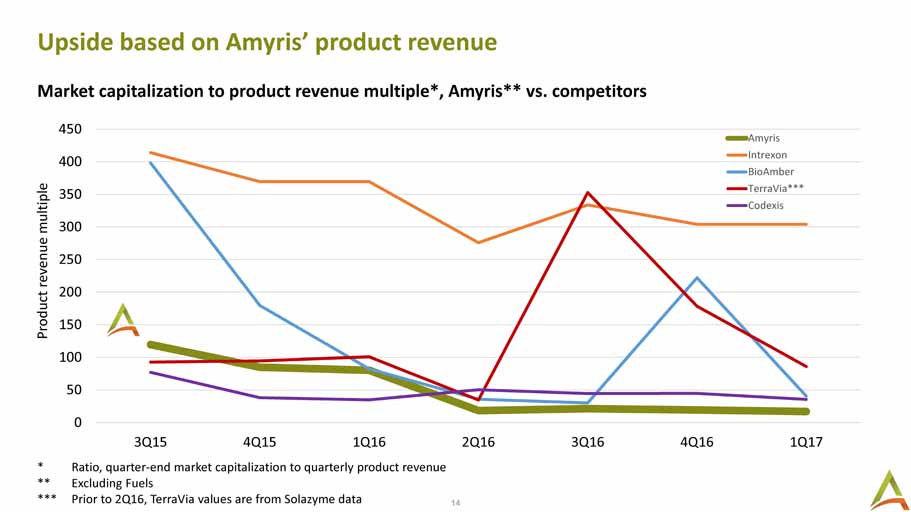
14 232/151/55 0/90/132 145/145/149 178/187/30 185/52/75 105/109/17 117/76/12 0 50 100 150 200 250 300 350 400 450 3Q15 4Q15 1Q16 2Q16 3Q16 4Q16 1Q17 Product revenue multiple Amyris Intrexon BioAmber TerraVia*** Codexis Upside based on Amyris’ product revenue Market capitalization to product revenue multiple*, Amyris** vs. competitors * Ratio, quarter - end market capitalization to quarterly product revenue ** Excluding Fuels *** Prior to 2Q16, TerraVia values are from Solazyme data
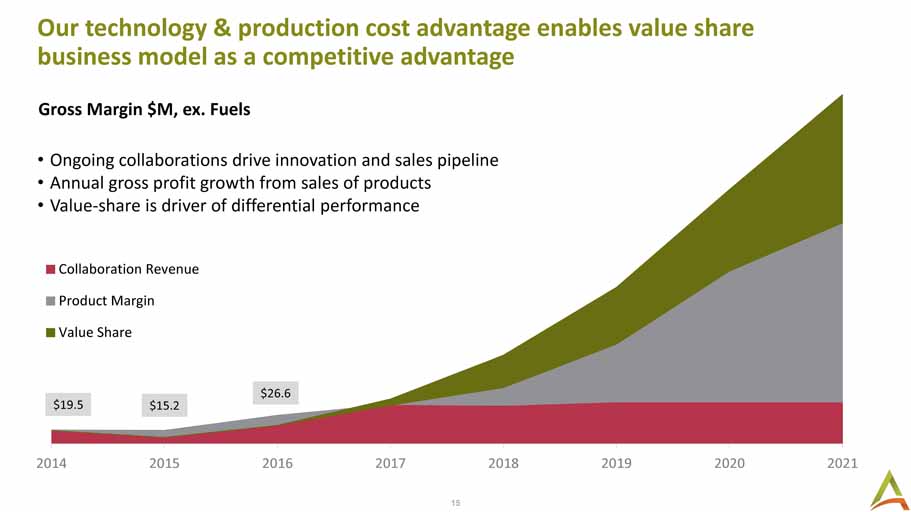
15 232/151/55 0/90/132 145/145/149 178/187/30 185/52/75 105/109/17 117/76/12 Our technology & production cost advantage enables value share business model as a competitive advantage 2014 2015 2016 2017 2018 2019 2020 2021 Collaboration Revenue Product Margin Value Share • Ongoing collaborations drive innovation and sales pipeline • Annual gross profit growth from sales of products • Value - share is driver of differential performance Gross Margin $M, ex. Fuels $19.5 $15.2 $26.6
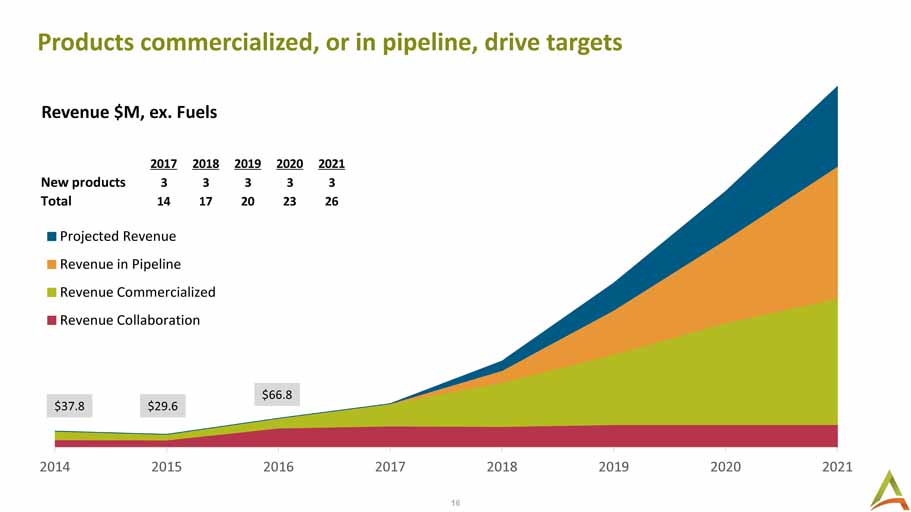
16 232/151/55 0/90/132 145/145/149 178/187/30 185/52/75 105/109/17 117/76/12 Products commercialized, or in pipeline, drive targets 2014 2015 2016 2017 2018 2019 2020 2021 Projected Revenue Revenue in Pipeline Revenue Commercialized Revenue Collaboration 2017 2018 2019 2020 2021 New products 3 3 3 3 3 Total 14 17 20 23 26 Revenue $M, ex. Fuels $37.8 $66.8 $29.6
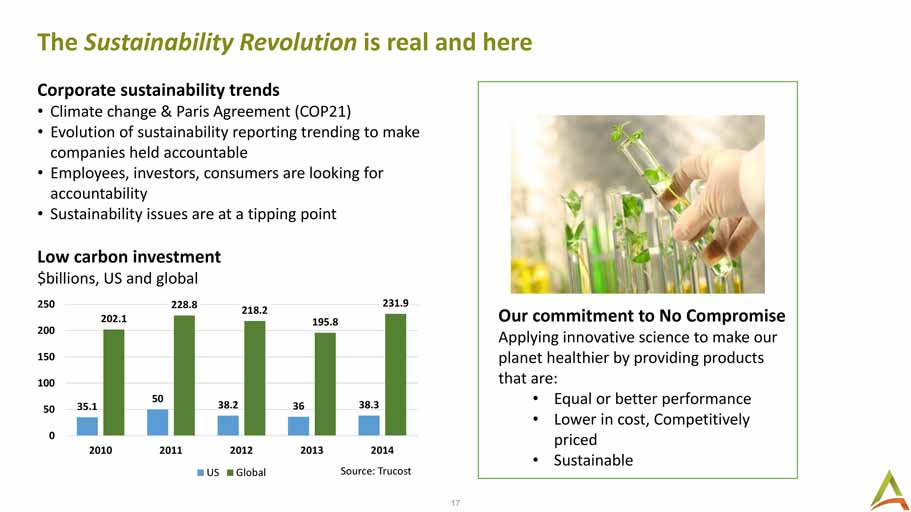
17 232/151/55 0/90/132 145/145/149 178/187/30 185/52/75 105/109/17 117/76/12 The Sustainability Revolution is real and here Corporate sustainability trends • Climate change & Paris Agreement (COP21) • Evolution of sustainability reporting trending to make companies held accountable • Employees, investors, consumers are looking for accountability • Sustainability issues are at a tipping point Our commitment to No Compromise Applying innovative science to make our planet healthier by providing products that are: • Equal or better performance • Lower in cost, Competitively priced • Sustainable 35.1 50 38.2 36 38.3 202.1 228.8 218.2 195.8 231.9 0 50 100 150 200 250 2010 2011 2012 2013 2014 US Global Low carbon investment $billion s, US and global Source: Trucost
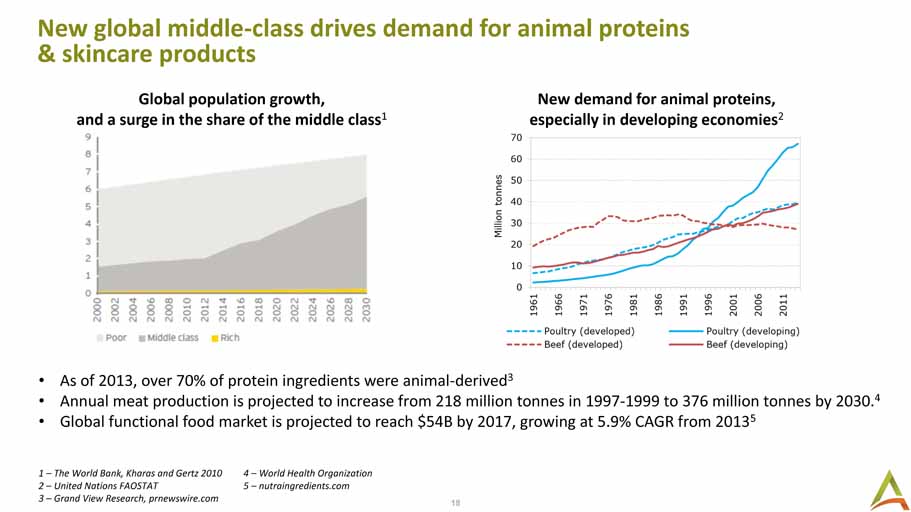
18 232/151/55 0/90/132 145/145/149 178/187/30 185/52/75 105/109/17 117/76/12 New global middle - class drives demand for animal proteins & skincare products 1 – The World Bank, Kharas and Gertz 2010 4 – World Health Organization 2 – United Nations FAOSTAT 5 – nutraingredients.com 3 – Grand View Research, prnewswire.com Global population growth, and a surge in the share of the middle class 1 New demand for animal proteins, especially in developing economies 2 • As of 2013, over 70% of protein ingredients were animal - derived 3 • Annual meat production is projected to increase from 218 million tonnes in 1997 - 1999 to 376 million tonnes by 2030. 4 • Global functional food market is projected to reach $54B by 2017, growing at 5.9% CAGR from 2013 5
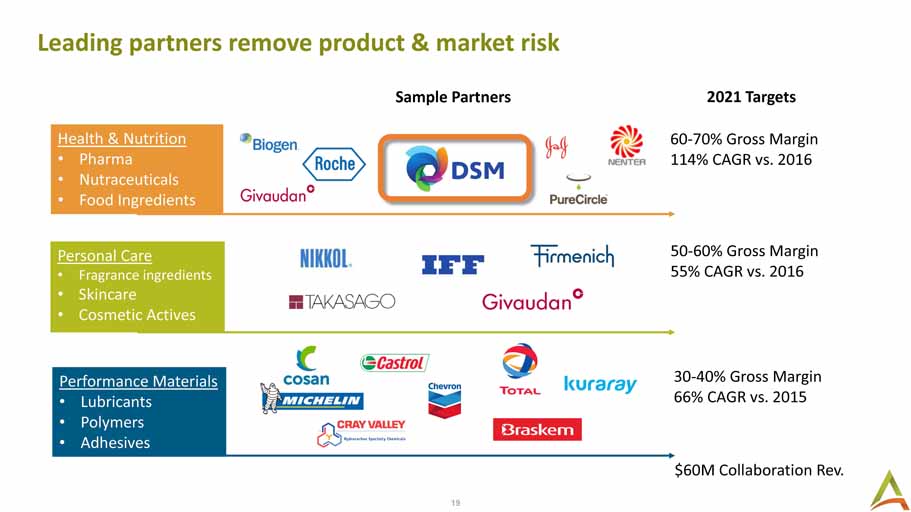
19 232/151/55 0/90/132 145/145/149 178/187/30 185/52/75 105/109/17 117/76/12 Leading partners remove product & market risk Health & Nutrition • Pharma • Nutraceuticals • Food Ingredients Personal Care • Fragrance ingredients • Skincare • Cosmetic Actives Performance Materials • Lubricants • Polymers • Adhesives 2021 Targets 60 - 70% Gross Margin 114% CAGR vs. 2016 50 - 60% Gross Margin 55% CAGR vs. 2016 Sample Partners 30 - 40% Gross Margin 66% CAGR vs. 2015 $60M Collaboration Rev.
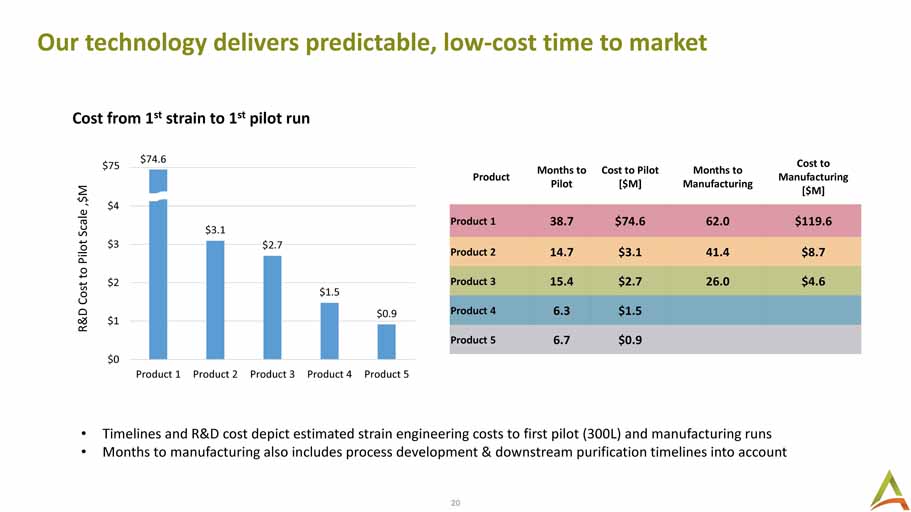
20 232/151/55 0/90/132 145/145/149 178/187/30 185/52/75 105/109/17 117/76/12 Our technology delivers predictable, low - cost time to market • Timelines and R&D cost depict estimated strain engineering costs to first pilot (300L) and manufacturing runs • Months to manufacturing also includes process development & downstream purification timelines into account Product Months to Pilot Cost to Pilot [$M] Months to Manufacturing Cost to Manufacturing [$M] Product 1 38.7 $74.6 62.0 $119.6 Product 2 14.7 $3.1 41.4 $8.7 Product 3 15.4 $2.7 26.0 $4.6 Product 4 6.3 $1.5 Product 5 6.7 $0.9 $3.1 $2.7 $1.5 $0.9 $0 $1 $2 $3 $4 $5 Product 1 Product 2 Product 3 Product 4 Product 5 R&D Cost to Pilot Scale ,$M $75 $74.6 Cost from 1 st strain to 1 st pilot run
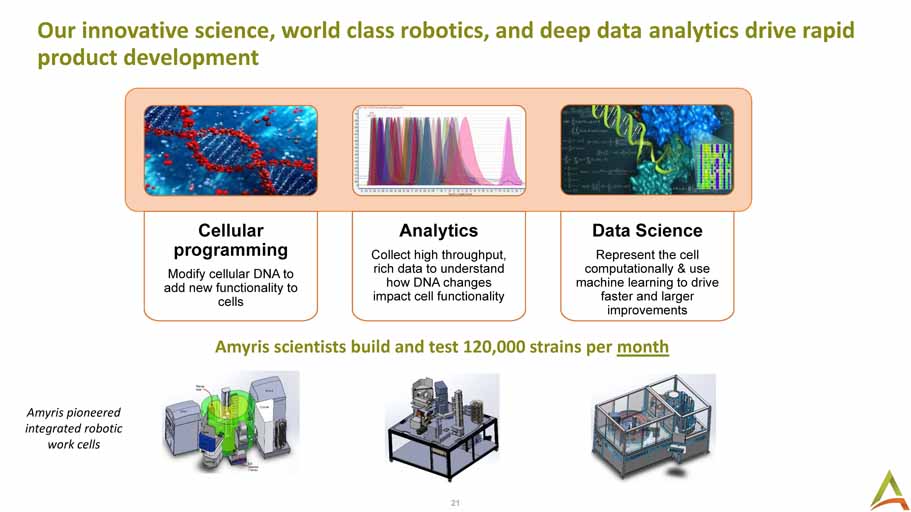
21 232/151/55 0/90/132 145/145/149 178/187/30 185/52/75 105/109/17 117/76/12 Cellular programming Modify cellular DNA to add new functionality to cells Analytics Collect high throughput, rich data to understand how DNA changes impact cell functionality Data Science Represent the cell computationally & use machine learning to drive faster and larger improvements Our innovative science, world class robotics, and deep data analytics drive rapid product development Amyris scientists build and test 120,000 strains per month Amyris pioneered integrated robotic work cells
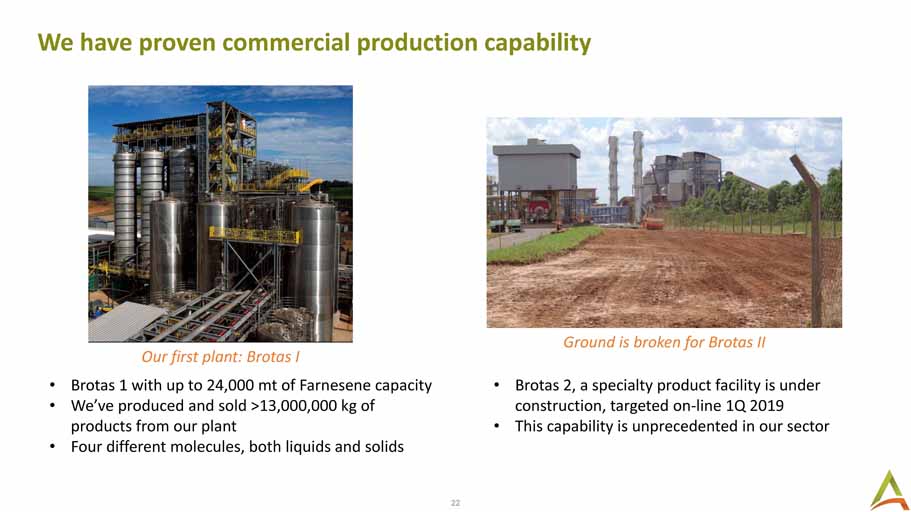
22 232/151/55 0/90/132 145/145/149 178/187/30 185/52/75 105/109/17 117/76/12 We have proven commercial production capability • Brotas 2, a specialty product facility is under construction, targeted on - line 1Q 2019 • This capability is unprecedented in our sector Ground is broken for Brotas II Our first plant: Brotas I • Brotas 1 with up to 24,000 mt of Farnesene capacity • We’ve produced and sold >13,000,000 kg of products from our plant • Four different molecules, both liquids and solids
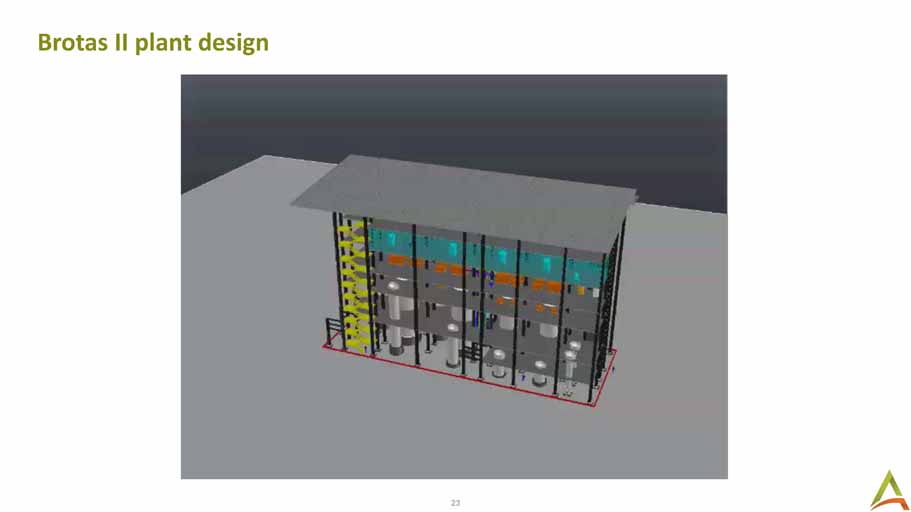
23 232/151/55 0/90/132 145/145/149 178/187/30 185/52/75 105/109/17 117/76/12 Brotas II plant design
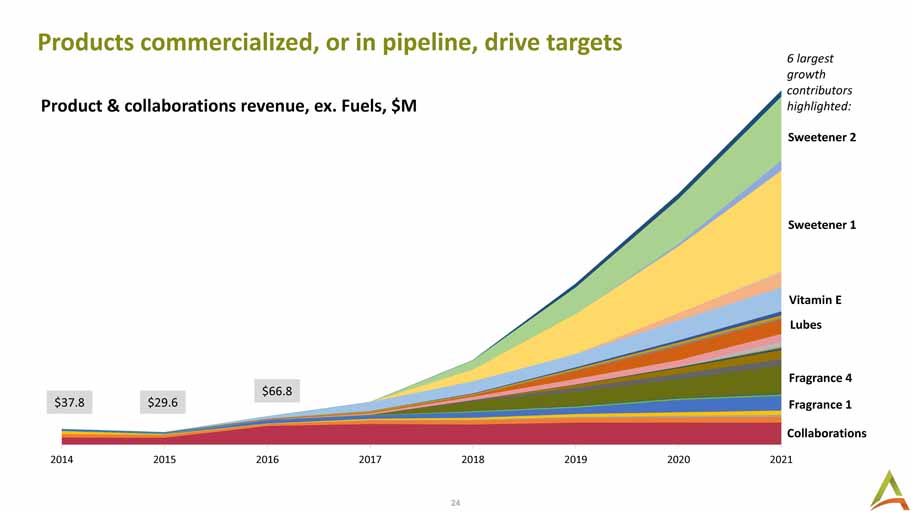
24 232/151/55 0/90/132 145/145/149 178/187/30 185/52/75 105/109/17 117/76/12 Products commercialized, or in pipeline, drive targets Sweetener 1 Vitamin E Collaborations Fragrance 4 Lubes Fragrance 1 2014 2015 2016 2017 2018 2019 2020 2021 Product & collaborations revenue, ex. Fuels, $M Sweetener 2 $37.8 $66.8 $29.6 6 largest growth contributors highlighted:
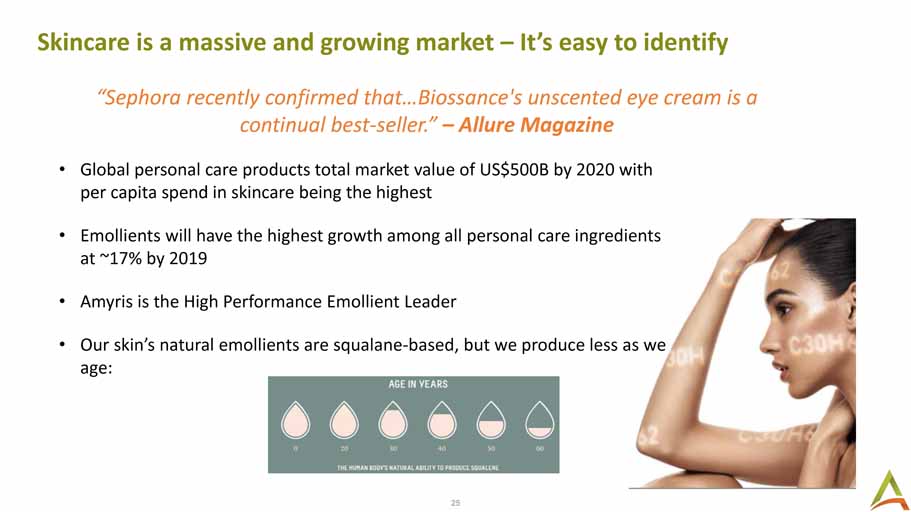
25 232/151/55 0/90/132 145/145/149 178/187/30 185/52/75 105/109/17 117/76/12 Skincare is a massive and growing market – It’s easy to identify “Sephora recently confirmed that…Biossance's unscented eye cream is a continual best - seller.” – Allure Magazine • Global personal care products total market value of US$500B by 2020 with per capita spend in skincare being the highest • Emollients will have the highest growth among all personal care ingredients at ~17% by 2019 • Amyris is the High Performance Emollient Leader • Our skin’s natural emollients are squalane - based, but we produce less as we age:
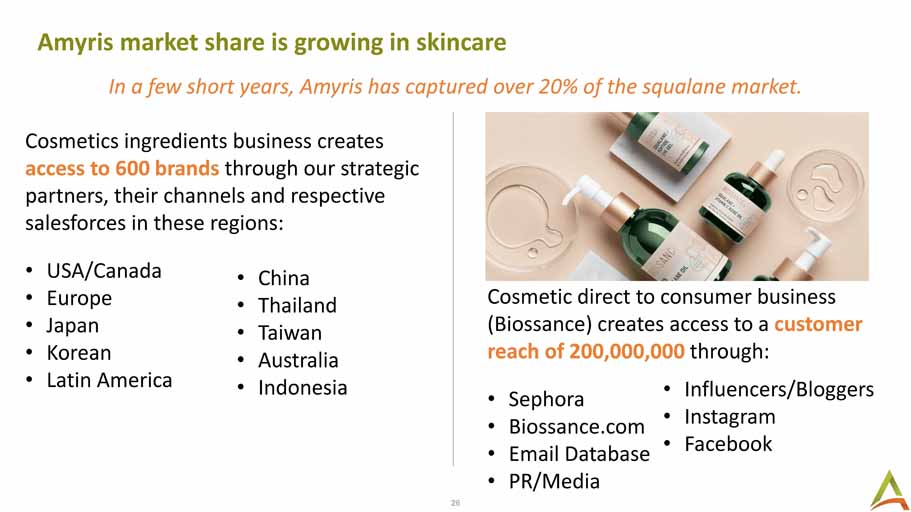
26 232/151/55 0/90/132 145/145/149 178/187/30 185/52/75 105/109/17 117/76/12 Amyris market share is growing in skincare In a few short years, Amyris has captured over 20% of the squalane market. Cosmetics ingredients business creates access to 600 brands through our strategic partners, their channels and respective salesforces in these regions: • USA/Canada • Europe • Japan • Korean • Latin America Cosmetic direct to consumer business (Biossance) creates access to a customer reach of 200,000,000 through: • Sephora • Biossance.com • Email Database • PR/Media • China • Thailand • Taiwan • Australia • Indonesia • Influencers/Bloggers • Instagram • Facebook
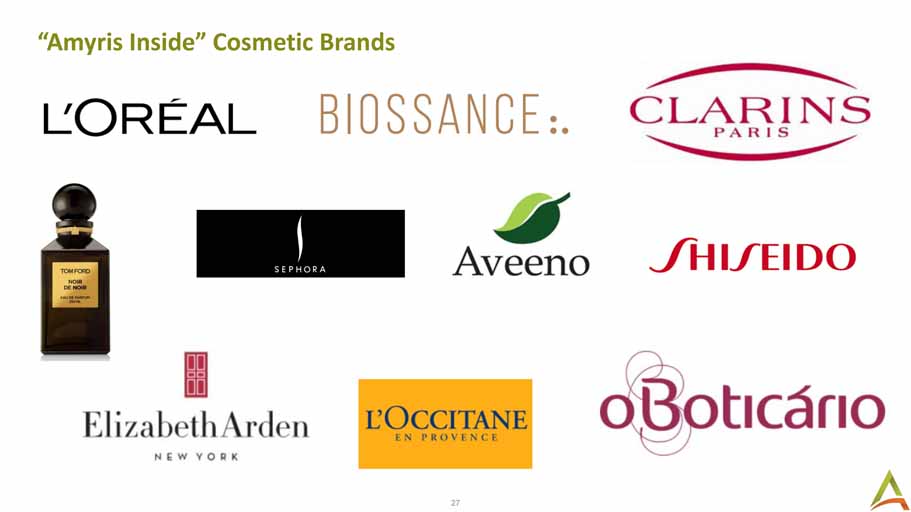
27 232/151/55 0/90/132 145/145/149 178/187/30 185/52/75 105/109/17 117/76/12 “Amyris Inside” Cosmetic Brands
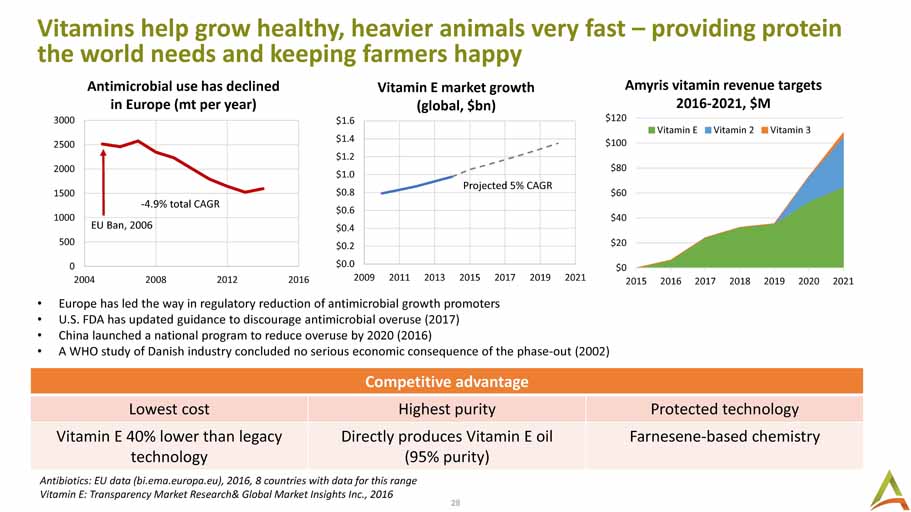
28 232/151/55 0/90/132 145/145/149 178/187/30 185/52/75 105/109/17 117/76/12 0 500 1000 1500 2000 2500 3000 2004 2008 2012 2016 $0.0 $0.2 $0.4 $0.6 $0.8 $1.0 $1.2 $1.4 $1.6 2009 2011 2013 2015 2017 2019 2021 Vitamins help grow healthy, heavier animals very fast – providing protein the world needs and keeping farmers happy Competitive advantage Lowest cost Highest purity Protected technology Vitamin E 40% lower than legacy technology Directly produces Vitamin E oil (95% purity) Farnesene - based chemistry Antibiotics: EU data (bi.ema.europa.eu), 2016, 8 countries with data for this range Vitamin E: Transparency Market Research& Global Market Insights Inc., 2016 Amyris vitamin revenue targets 2016 - 2021, $M Projected 5% CAGR • Europe has led the way in regulatory reduction of antimicrobial growth promoters • U.S. FDA has updated guidance to discourage antimicrobial overuse (2017) • China launched a national program to reduce overuse by 2020 (2016) • A WHO study of Danish industry concluded no serious economic consequence of the phase - out (2002) Vitamin E market growth (global, $bn) - 4.9% total CAGR EU Ban, 2006 $0 $20 $40 $60 $80 $100 $120 2015 2016 2017 2018 2019 2020 2021 Vitamin E Vitamin 2 Vitamin 3 Antimicrobial use has declined in Europe ( mt per year)
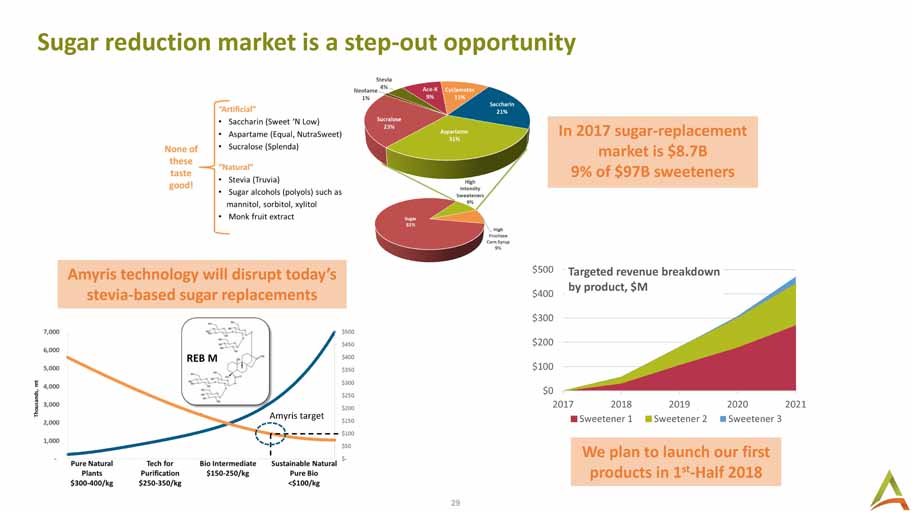
29 232/151/55 0/90/132 145/145/149 178/187/30 185/52/75 105/109/17 117/76/12 Sugar reduction market is a step - out opportunity In 2017 sugar - replacement market is $8.7B 9% of $97B sweeteners Amyris technology will disrupt today’s stevia - based sugar replacements We plan to launch our first products in 1 st - Half 2018 REB M $0 $100 $200 $300 $400 $500 2017 2018 2019 2020 2021 Targeted revenue breakdown by product, $M Sweetener 1 Sweetener 2 Sweetener 3 Amyris target
30 232/151/55 0/90/132 145/145/149 178/187/30 185/52/75 105/109/17 117/76/12 Today and looking ahead 1) We have underpinned line - of - sight into Amyris’ growth: • >$900M by 2021 • > 90% w/ existing customers & products already commercialized or near launch 2) We are addressing our balance sheet: • $95M in new financing • Over $75M reduction in debt by end 2Q • A strong strategic partner that helps underpin financial stability for the future 3) We recognize we have a share price issue: • 15:1 reverse stock - split is planned • Enables Amyris to capitalize on strong interest from institutional investors 4) Going forward you can expect from Amyris: • Predictable product revenue with more than 100% annual growth • Deep focus on products where we are the lowest cost and best performing • Continued momentum w/ partners & significant cash from Value Share Model 5) No other “shoe” to drop … Just old fashioned execution!!!
31 232/151/55 0/90/132 145/145/149 178/187/30 185/52/75 105/109/17 117/76/12 • Over 10 products now generate at least $1M in annual sales • 3 brands that are on track for over $10M in sales this year • 1 molecule that will generate over $30M in revenue this year • All existing partners have or are in process of significantly deepening their relationship with Amyris • Our ingredients are inside over $3B of consumer purchases • We are the low cost & best performing technology for the Personal Care and Health & Nutrition segments • We are launching the leading products into the Sweetener market. We want to replace sugar & are committed to a healthier planet!! Our track record
32 232/151/55 0/90/132 145/145/149 178/187/30 185/52/75 105/109/17 117/76/12