Attached files
| file | filename |
|---|---|
| 8-K - 8-K - S&T BANCORP INC | form8-k1q17annualpres.htm |

MEMBER FDIC
Charles G. Urtin
Chairman of the Board

MEMBER FDIC
Todd D. Brice
President and Chief Executive Officer

3
Forward Looking Statement
and Risk Factors
This presentation contains or incorporates statements that we believe are forward-looking statements within the meaning of the Private
Securities Litigation Reform Act of 1995. Forward-looking statements generally relate to our financial condition, results of operations, plans,
objectives, outlook for earnings, revenues, expenses, capital and liquidity levels and ratios, asset levels, asset quality, financial position, and
other matters regarding or affecting S&T and its future business and operations. Forward looking statements are typically identified by words
or phrases such as “will likely result,” “expect”, “anticipate,” “estimate,” “forecast,” “project,” “intend”, “ believe”, “assume”, “strategy”, “trend”,
“plan”, “outlook”, “outcome”, “continue”, “remain”, “potential,” “opportunity”, “believe”, “comfortable”, “current”, “position”, “maintain”, “sustain”,
“seek”, “achieve” and variations of such words and similar expressions, or future or conditional verbs such as will, would, should, could or
may. Although we believe the assumptions upon which these forward-looking statements are based are reasonable, any of these
assumptions could prove to be inaccurate and the forward-looking statements based on these assumptions could be incorrect. The matters
discussed in these forward-looking statements are subject to various risks, uncertainties and other factors that could cause actual results and
trends to differ materially from those made, projected, or implied in or by the forward-looking statements depending on a variety of
uncertainties or other factors including, but not limited to: credit losses; cyber-security concerns; rapid technological developments and
changes; sensitivity to the interest rate environment including a prolonged period of low interest rates, a rapid increase in interest rates or a
change in the shape of the yield curve; a change in spreads on interest-earning assets and interest-bearing liabilities; regulatory supervision
and oversight; legislation affecting the financial services industry as a whole, and S&T, in particular; the outcome of pending and future
litigation and governmental proceedings; increasing price and product/service competition; the ability to continue to introduce competitive
new products and services on a timely, cost-effective basis; managing our internal growth and acquisitions; the possibility that the anticipated
benefits from acquisitions cannot be fully realized in a timely manner or at all, or that integrating the acquired operations will be more difficult,
disruptive or costly than anticipated; containing costs and expenses; reliance on significant customer relationships; general economic or
business conditions; deterioration of the housing market and reduced demand for mortgages; deterioration in the overall macroeconomic
conditions or the state of the banking industry that could warrant further analysis of the carrying value of goodwill and could result in an
adjustment to its carrying value resulting in a non-cash charge to net income; re-emergence of turbulence in significant portions of the global
financial and real estate markets that could impact our performance, both directly, by affecting our revenues and the value of our assets and
liabilities, and indirectly, by affecting the economy generally and access to capital in the amounts, at the times and on the terms required to
support our future businesses. Many of these factors, as well as other factors, are described in our filings with the SEC. Forward-looking
statements are based on beliefs and assumptions using information available at the time the statements are made. We caution you not to
unduly rely on forward-looking statements because the assumptions, beliefs, expectations and projections about future events may, and often
do, differ materially from actual results. Any forward-looking statement speaks only as to the date on which it is made, and we undertake no
obligation to update any forward-looking statement to reflect developments occurring after the statement is made.
4
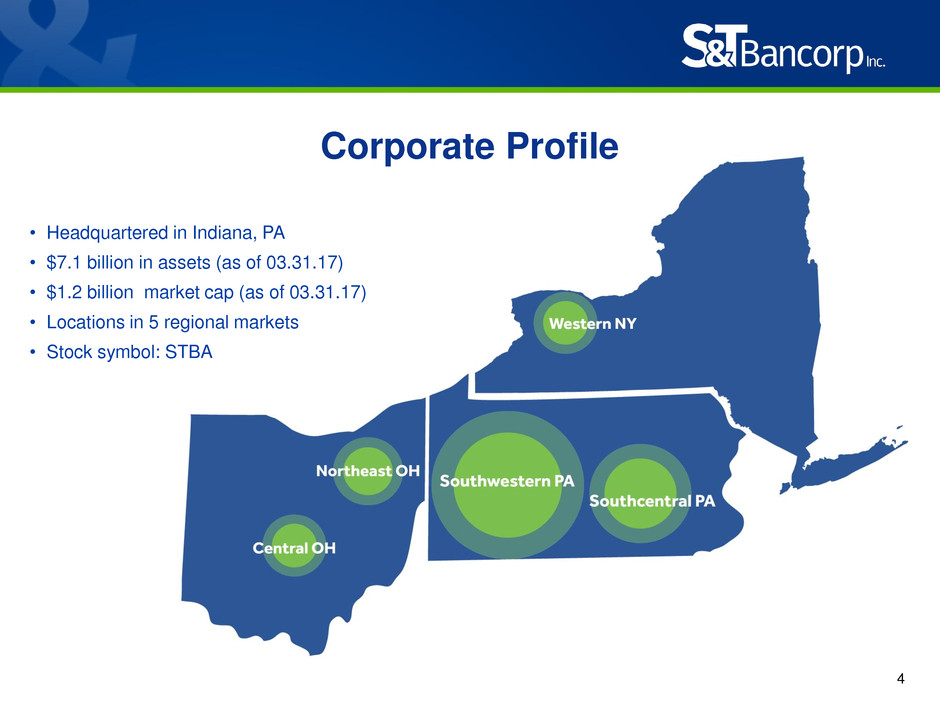
Corporate Profile
4
• Headquartered in Indiana, PA
• $7.1 billion in assets (as of 03.31.17)
• $1.2 billion market cap (as of 03.31.17)
• Locations in 5 regional markets
• Stock symbol: STBA
5
$ in millions
(1)Includes Pittsburgh, Altoona & Johnstown MSAs and Indiana, Clearfield & Jefferson Counties
(2)Based on customer residence
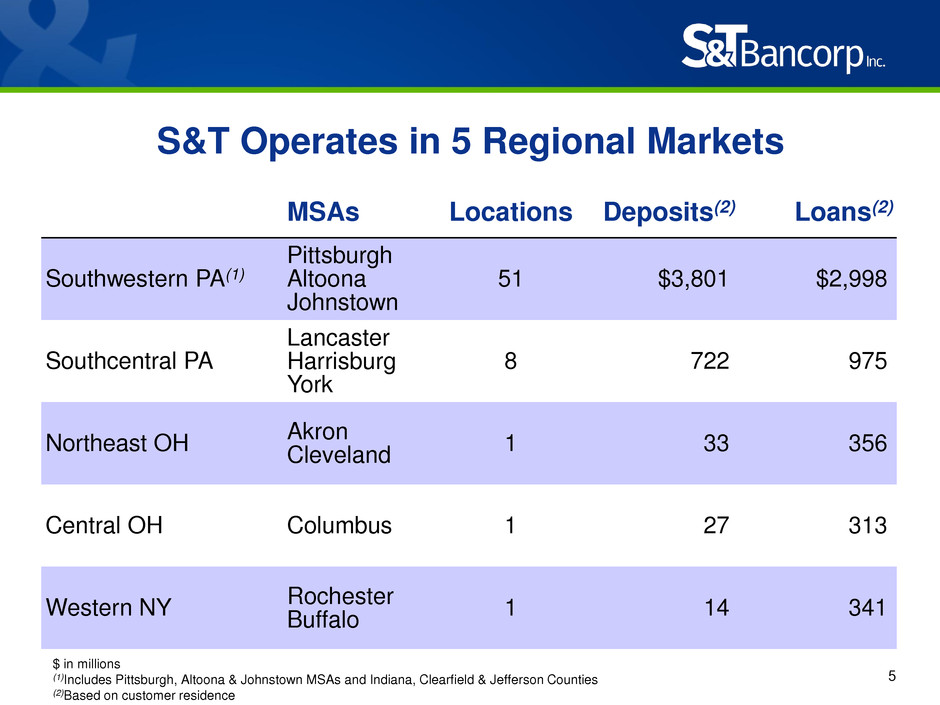
S&T Operates in 5 Regional Markets
MSAs Locations Deposits(2) Loans(2)
Southwestern PA(1)
Pittsburgh
Altoona
Johnstown
51 $3,801 $2,998
Southcentral PA
Lancaster
Harrisburg
York
8 722 975
Northeast OH
Akron
Cleveland
1 33 356
Central OH Columbus 1 27 313
Western NY
Rochester
Buffalo
1 14 341
6

7

8
Total Annualized Shareholder Return
Includes reinvested dividends (Data as of
3.31.17)
Source: Bloomberg
Stock Performance
1 YR 3 YR 5 YR 10 YR
STBA 38.00 % 16.39 % 12.88 % 3.64 %
NASDAQ Bank 42.87 % 14.16 % 17.68 % 3.73 %
KRX-Dow Jones KBW Regional
Bank 40.76 % 12.77 % 16.06 % 3.55 %
S&P 500 17.16 % 10.34 % 13.26 % 7.49 %

9
STBA Investment Thesis
• Above peer performance
• Undervalued compared to peer
• Strategic and effective mergers and expansion
• Demonstrated expense discipline and efficiency
• Organic growth
• Stable regional markets with long-term
• oil and gas benefit
• Sound asset quality

10
The Right Size
• Big enough to:
• Provide full complement of products and services
• Access technology
• Access capital markets
• Attract talent
• Expand – mergers and acquisitions/de novo
• Small enough to:
• Stay close to our customers
• Understand our markets
• Be responsive
MEMBER FDIC
Mark Kochvar
Chief Financial Officer
12
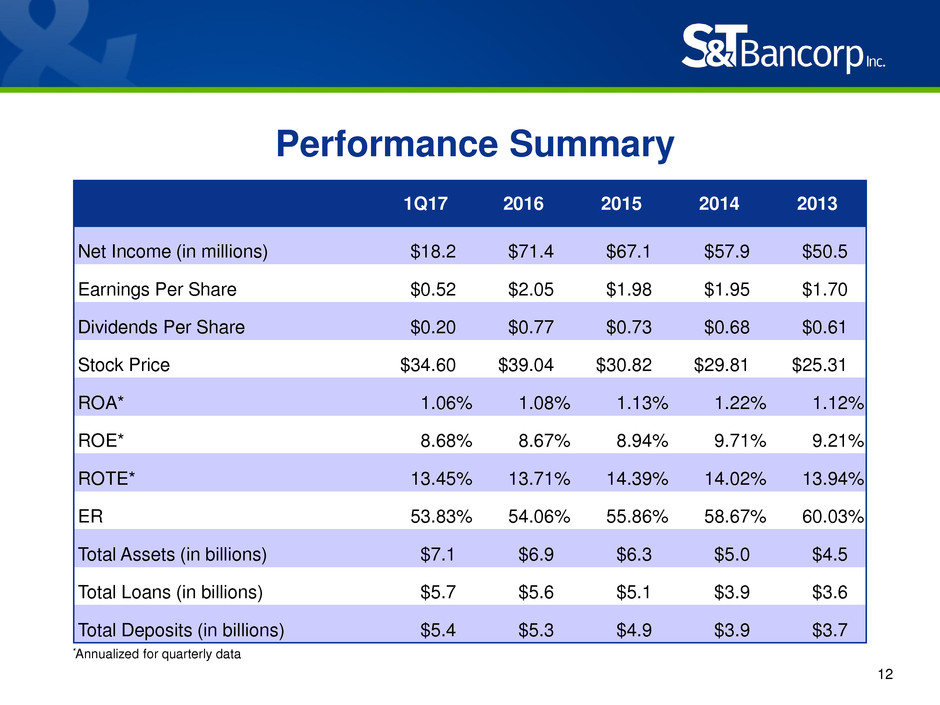
Performance Summary
*Annualized for quarterly data
1Q17 2016 2015 2014 2013
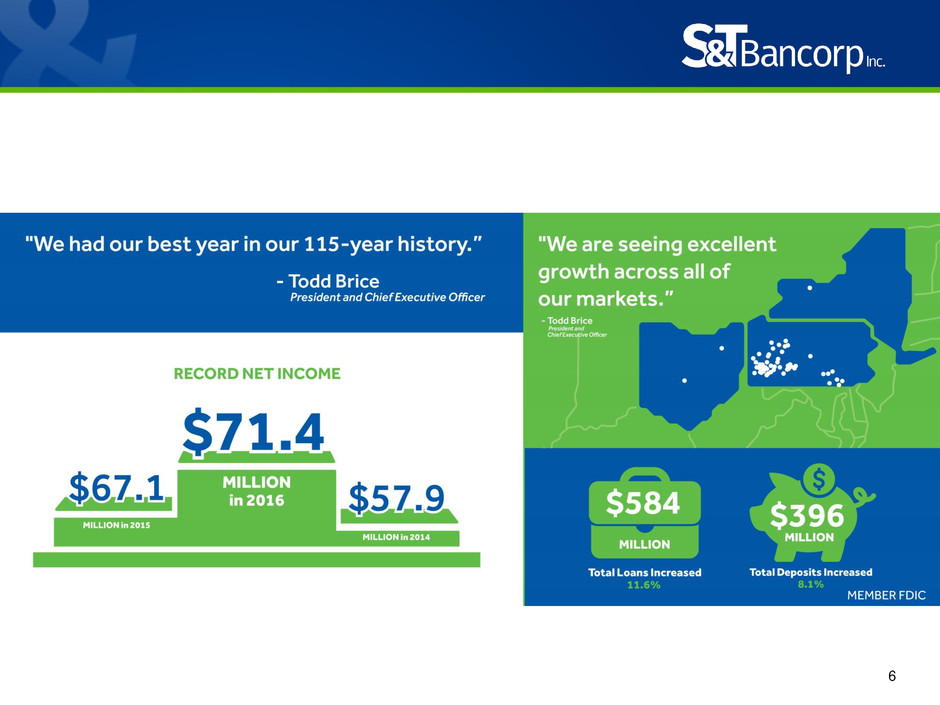
Net Income (in millions) $18.2 $71.4 $67.1 $57.9 $50.5
Earnings Per Share $0.52 $2.05 $1.98 $1.95 $1.70
Dividends Per Share $0.20 $0.77 $0.73 $0.68 $0.61
Stock Price $34.60 $39.04 $30.82 $29.81 $25.31
ROA* 1.06 % 1.08 % 1.13 % 1.22 % 1.12 %
ROE* 8.68 % 8.67 % 8.94 % 9.71 % 9.21 %
ROTE* 13.45 % 13.71 % 14.39 % 14.02 % 13.94 %
ER 53.83 % 54.06 % 55.86 % 58.67 % 60.03 %
Total Assets (in billions) $7.1 $6.9 $6.3 $5.0 $4.5
Total Loans (in billions) $5.7 $5.6 $5.1 $3.9 $3.6
Total Deposits (in billions) $5.4 $5.3 $4.9 $3.9 $3.7

13
Peer(1)
(1) BHCPR Peer Group 2: Bank Holding Companies with $3-10 Billion of Assets
(2)Annualized
(2)

14
Peer(1)
(1) BHCPR Peer Group 2: Bank Holding Companies with $3-10 Billion of Assets
(2)Annualized
(2)
15
Peer(1)
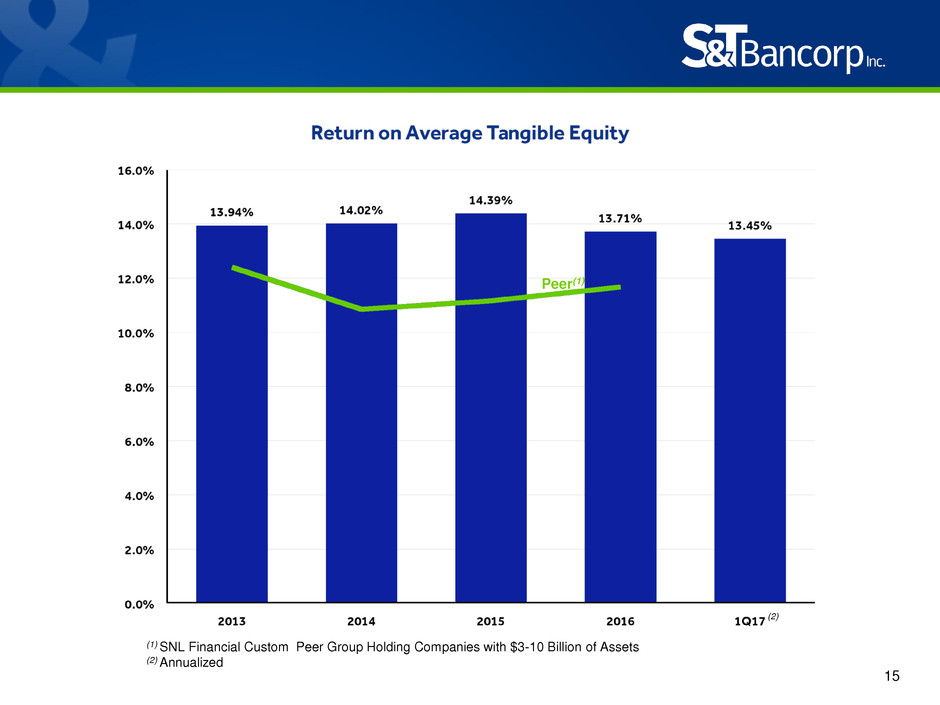
(1) SNL Financial Custom Peer Group Holding Companies with $3-10 Billion of Assets
(2) Annualized
(2)

16
Peer(1)
(1) BHCPR Peer Group 2: Bank Holding Companies with $3-10 Billion of Assets

MEMBER FDIC
2017 Annual Meeting
