Attached files
| file | filename |
|---|---|
| 8-K - 8-K - FULTON FINANCIAL CORP | a8-k5x15x17.htm |

ANNUAL SHAREHOLDERS’ MEETING
1
May 15, 2017

REMINDER:
If you have not yet voted your shares,
please do so now by visiting the
Judge of Election table at the side
of the room.
2

FORWARD-LOOKING STATEMENTS
This presentation may contain forward-looking statements with respect to Fulton Financial Corporation’s financial
condition, results of operations and business. Do not unduly rely on forward-looking statements. Forward-looking
statements can be identified by the use of words such as “may,” “should,” “will,” “could,” “estimates,” “predicts,”
“potential,” “continue,” “anticipates,” “believes,” “plans,” “expects,” “future,” “intends” and similar expressions
which are intended to identify forward-looking statements.
Forward-looking statements are not guarantees of future performance and are subject to risks and uncertainties,
some of which are beyond the Corporation’s control and ability to predict, that could cause actual results to differ
materially from those expressed in the forward-looking statements. The Corporation undertakes no obligation, other
than as required by law, to update or revise any forward-looking statements, whether as a result of new information,
future events or otherwise.
A discussion of certain risks and uncertainties affecting the Corporation, and some of the factors that could cause the
Corporation’s actual results to differ materially from those described in the forward-looking statements, can be
found in the sections entitled “Risk Factors” and “Management’s Discussion and Analysis of Financial Condition and
Results of Operations” in the Corporation’s Annual Report on Form 10-K for the year ended December 31, 2016 and
on Form 10-Q for the quarter ended March 31, 2017, which have been filed with the Securities and Exchange
Commission and are available in the Investor Relations section of the Corporation’s website (www.fult.com) and on
the Securities and Exchange Commission’s website (www.sec.gov).
The Corporation uses certain non-GAAP financial measures in this presentation. These non-GAAP financial measures
are reconciled to the most comparable GAAP measures at the end of this presentation.
3

RULES OF CONDUCT
• Cameras, recording devices and cell phones are not permitted to be used
in the meeting.
• The display of placards and/or signs is prohibited.
• Questions from shareholders should be directed to the Chairperson of the
meeting during the Question and Answer (Q&A) period.
• During the Q&A period, please remember to state your name prior to
asking your question.
• During the Q&A period, please limit yourself to one question to give other
shareholders the opportunity to speak.
4

WELCOME AND
OPENING REMARKS
Phil Wenger, Chairman, President and CEO
5

TODAY’S AGENDA
• Business Meeting
• Proposals:
• Election of Directors
• Say on Pay
• Say When on Pay
• Ratification of appointment of independent auditor
• Introductions
• Results of Voting
• Conclusion of Business Meeting
• Management Presentation
• Questions and Answers
6

BOARD OF DIRECTORS
7

BOARD OF DIRECTORS
8
Lisa Crutchfield

BOARD OF DIRECTORS
9
Denise Devine

BOARD OF DIRECTORS
10
Pat Freer

BOARD OF DIRECTORS
11
George Hodges

BOARD OF DIRECTORS
12
Al Morrison

BOARD OF DIRECTORS
13
Rob Moxley

BOARD OF DIRECTORS
14
Scott Smith

BOARD OF DIRECTORS
15
Scott Snyder

BOARD OF DIRECTORS
16
Ron Spair

BOARD OF DIRECTORS
17
Mark Strauss

BOARD OF DIRECTORS
18
Ernie Waters

SENIOR
MANAGEMENT
19

SENIOR MANAGEMENT
20
Phil Rohrbaugh

SENIOR MANAGEMENT
21
Craig Roda

SENIOR MANAGEMENT
22
Meg Mueller

SENIOR MANAGEMENT
23
Curt Myers

SENIOR MANAGEMENT
24
Angie Sargent

SENIOR MANAGEMENT
25
Betsy Chivinski

REPORT OF THE
JUDGE OF ELECTION
26

ANNUAL SHAREHOLDERS’ MEETING
27
May 15, 2017

A LOOK BACK AND
A LOOK AHEAD
Phil Wenger, Chairman, President and CEO
28

29
Pennsylvania
Virginia
Maryland
Delaware
New
Jersey
A VALUABLE FRANCHISE
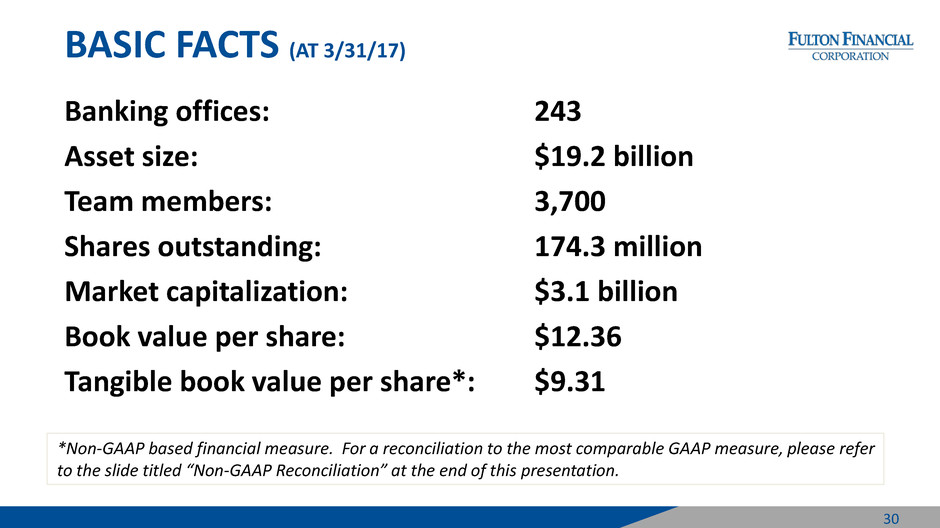
BASIC FACTS (AT 3/31/17)
Banking offices: 243
Asset size: $19.2 billion
Team members: 3,700
Shares outstanding: 174.3 million
Market capitalization: $3.1 billion
Book value per share: $12.36
Tangible book value per share*: $9.31
30
*Non-GAAP based financial measure. For a reconciliation to the most comparable GAAP measure, please refer
to the slide titled “Non-GAAP Reconciliation” at the end of this presentation.

FINANCIAL PERFORMANCE
31

2016 HIGHLIGHTS (COMPARISONS ARE TO 2015)
32
Net Interest Income
• Increased 4.2%
Net Interest Margin • Decreased 3 basis points to 3.18%
Non-Interest Income
(Excluding Securities Gains)
• Increased 8.6%
Non-Interest Expense
(Excluding Loss on Redemption
of TruPS)
• Increased 3.2%

DILUTED EARNINGS PER SHARE
33
$ 0.80 $ 0.83
$ 0.84 $0.85
0.93
$-
$0.25
$0.50
$0.75
$1.00
2012 2013 2014 2015 2016

RETURN ON AVERAGE ASSETS, TANGIBLE EQUITY & AVERAGE EQUITY
34
0.88%
0.93%
0.89%
0.70%
0.80%
0.90%
1.00%
2012 2013 2014 2015 2016
FULT
Note: Return an average assets determined by dividing net income for the period indicated by average assets. Return on average equity determined by dividing net income for the period indicated by average shareholders
equity. Return an tangible equity is a non-GAAP based financial measure. Please refer to the calculation and management’s reasons for using this measure on the slides titled “Non-GAAP Reconciliation” at the end of this
presentation.
˄ See “Appendix” for listing of Peer Group banks.
* Comprised of the 50 largest publicly traded domestic banks/thrifts in assets size as of December 31, 2016. Excludes credit card companies.
Source: SNL Financial LC
10.30%
11.13%
10.67%
8.0%
10.0%
12.0%
14.0%
2012 2013 2014 2015 2016
FULT
Return on Average Assets Return on Tangible Equity
7.69%
7.69%
8.19%
6.0%
8.0%
10.0%
2012 2013 2014 2015 2016
FULT
Return on Average Equity

AVERAGE LOAN AND AVERAGE DEPOSIT GROWTH
35
6.0%
10.9%
8.6%
-1.0%
1.0%
3.0%
5.0%
7.0%
9.0%
11.0%
13.0%
2012 2013 2014 2015 2016
FULT Peer^ Top 50*
Note: 2012 through 2016 represents December year-over-year change in average loans and average deposits
˄ See “Appendix” for listing of Peer Group banks.
* Comprised of the 50 largest publicly traded domestic banks/thrifts in assets size as of December 31,2016. Excludes credit card companies.
Source: SNL Financial LC
6.1%
8.4%
6.4%
-1.0%
1.0%
3.0%
5.0%
7.0%
9.0%
11.0%
13.0%
2012 2013 2014 2015 2016
FULT Peer^ Top 50*
Average Loan Growth Average Deposit Growth

DEPOSIT PORTFOLIO COMPOSITION
36
36
Note: Deposit composition is based on average balances for the periods indicated.
Average demand and savings were up 9.3% compared to 2015; while total average deposits were up 6.1%.
19%
29%
24%
18%
10%
Year Ended
December 31, 2016
22%
28% 24%
17%
9%
Year Ended
December 31, 2015
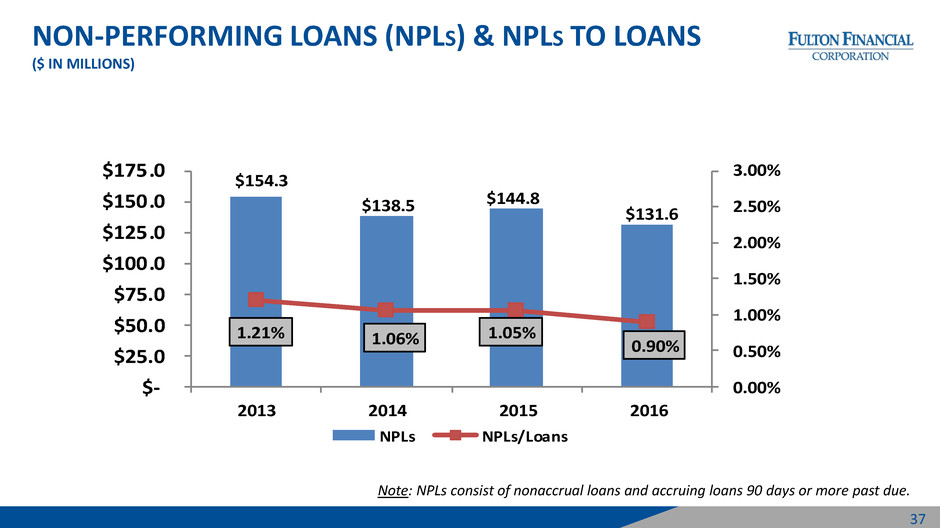
NON-PERFORMING LOANS (NPLS) & NPLS TO LOANS
($ IN MILLIONS)
37
Note: NPLs consist of nonaccrual loans and accruing loans 90 days or more past due.
$154.3
$138.5 $144.8 $131.6
1.21% 1.06% 1.05% 0.90%
0.00%
0.50%
1.00%
1.50%
2.00%
2.50%
3.00%
$-
$25.0
$50.0
$75.0
$100.0
$125.0
$150.0
$175.0
2013 2014 2015 2016
NPLs NPLs/Loans

PROVISION FOR CREDIT LOSSES ($ IN MILLIONS)
$40.5
$12.5
$2.3
$13.2
$-
$10.0
$20.0
$30.0
$40.0
$50.0
2013 2014 2015 2016
38

NET INTEREST MARGIN
39
3.18%
3.53%
3.03%
2.6%
2.8%
3.0%
3.2%
3.4%
3.6%
3.8%
4.0%
2012 2013 2014 2015 2016
FULT Peer^ Top 50*
Note: Fully-taxable equivalent.
˄ See “Appendix” for listing of Peer Group banks.
* Comprised of the 50 largest publicly traded domestic banks/thrifts in assets size
as of December 31,2016. Excludes credit card companies.
Source: SNL Financial LC

EFFICIENCY RATIO
40
67.2%
62.7%
61.7%
54.0%
56.0%
58.0%
60.0%
62.0%
64.0%
66.0%
68.0%
70.0%
2012 2013 2014 2015 2016
FULT Peer^ Top 50*
Note: The efficiency ratio is a non-GAAP based financial measure. Please refer to the calculation and management’s reasons for using this measure
on the slides titled “Non-GAAP Reconciliation” at the end of this presentation.
˄ See “Appendix” for listing of Peer Group banks. * Comprised of the 50 largest publicly traded domestic banks/thrifts in assets size as of
December 31,2016. Excludes credit card companies. Source: SNL Financial LC

CAPITAL STRENGTH
41
(1)Non-GAAP based financial measure. Please refer to the calculation and management’s reasons for using this measure on the slides titled
“Non-GAAP Reconciliation” at the end of this presentation.
Regulatory Capital Ratios & TCE Ratio
15.6%
15.0% 14.7%
13.2% 13.2% 13.4% 13.1%
12.3%
10.2% 10.4%
9.7%
9.3%
8.8% 8.7% 8.6%
0.0%
4.0%
8.0%
12.0%
16.0%
2012 2013 2014 2015 2016
Total Risk-Based Capital Ratio Tier 1 Risk-Based Capital Ratio TCE Ratio (1)

2016 CAPITAL DEPLOYMENT
• Increased quarterly cash dividend by $0.01 to $0.10
• Paid a $0.02 special dividend in 4th quarter
• Repurchased $18.6 million of common stock
• Remaining authorization to repurchase
up to $31.4 million in shares through December 2017
42

A SUSTAINABLE PAYOUT
43
(1) Dividends declared per share divided by period-end stock price. (2) Compounded annual growth rate from December 31, 2011 to December 31, 2016.
Cash Dividend Per Common Share & Yield
$0.20
$0.30
$0.32
$0.34
$0.38
2.04%
3.12%
2.44%
2.75%
2.92%
2.18%
0.0%
0.5%
1.0%
1.5%
2.0%
2.5%
3.0%
3.5%
4.0%
4.5%
$0.00
$0.05
$0.10
$0.15
$0.20
$0.25
$0.30
$0.35
$0.40
$0.45
2011 2012 2013 2014 2015 2016
Cash Dividend Yield
CAGR (2) = 15.4%
$0.41
(1)

FIRST QUARTER 2017 PERFORMANCE
• Diluted earnings per share: $0.25
• Pre-provision net revenue*: increased $10.0 million (19.8%) year-over-year
• Return on assets: 0.92%
• Return on equity: 8.22%
• Return on tangible equity*: 10.93%
• Average loans: increased 7.2% from 1st quarter 2016
• Average core deposits: increased 7.1% from 1st quarter 2016
• Net interest margin improved linked-quarter and year-over-year
• Most credit metrics improved linked-quarter
*Non-GAAP based financial measure. Please refer to the calculation and management’s reasons for using this measure on the slides titled,
“Non-GAAP Reconciliation” at the end of this presentation.
44

FULTON FINANCIAL
STOCK PERFORMANCE AND
ANALYSTS’ RECOMMENDATIONS
45
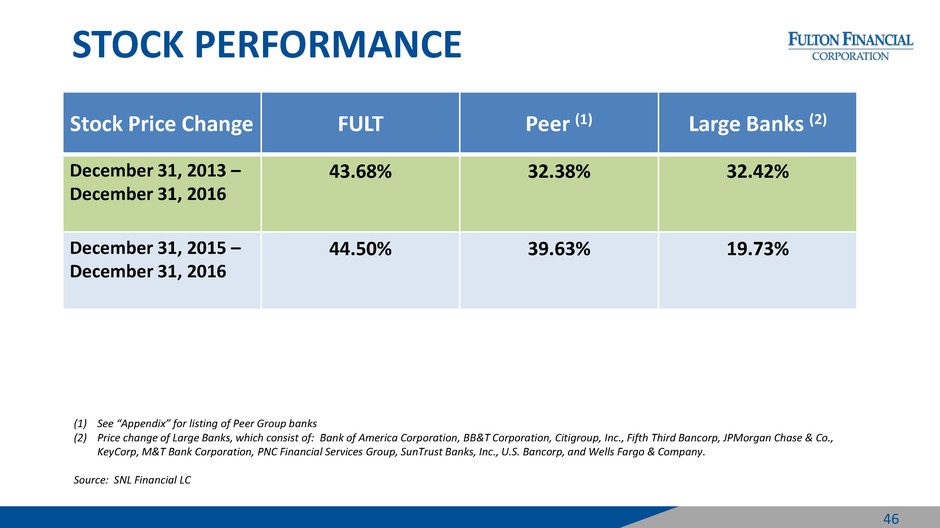
STOCK PERFORMANCE
Stock Price Change FULT Peer (1) Large Banks (2)
December 31, 2013 –
December 31, 2016
43.68% 32.38% 32.42%
December 31, 2015 –
December 31, 2016
44.50%
39.63%
19.73%
46
(1) See “Appendix” for listing of Peer Group banks
(2) Price change of Large Banks, which consist of: Bank of America Corporation, BB&T Corporation, Citigroup, Inc., Fifth Third Bancorp, JPMorgan Chase & Co.,
KeyCorp, M&T Bank Corporation, PNC Financial Services Group, SunTrust Banks, Inc., U.S. Bancorp, and Wells Fargo & Company.
Source: SNL Financial LC

ANALYSTS’ EARNINGS ESTIMATES – 2017 PEER GROUP
47
Average
change(2):
17.1%
Median
change(2):
13.2%
Notes:
1) 2017 median analyst estimates as of
4/30/2017
2) Average and median change above
represents peer percent changes,
excluding Fulton
Source: SNL Financial LC
Rank Company HQ State
2017 Median EPS
Estimate1 2016 Actual Diluted EPS Percent Change
1 Northwest Bancshares PA $0.87 $0.49 77.6%
2 Hancock Holding Company MS $2.78 $1.87 48.7%
3 F.N.B. Corporation PA $0.99 $0.78 26.9%
4 MB Financial IL $2.61 $2.13 22.5%
5 Western Alliance Bancorporation AZ $2.99 $2.50 19.6%
6 BancorpSouth MS $1.64 $1.41 16.3%
7 Trustmark Corporation MS $1.86 $1.60 16.3%
8 Fulton Financial Corporation PA $1.07 $0.93 15.1%
9 Webster Financial Corporation CT $2.48 $2.16 14.8%
10
UMB Financial Corporation MO $3.69 $3.22 14.6%
11 Wintrust Financial Corporation IL $4.09 $3.66 11.7%
12 Valley National Bancorp NJ $0.70 $0.63 11.1%
13 Commerce Bancshares, MO $2.84 $2.61 8.8%
14 IBERIABANK Corporation LA $4.49 $4.30 4.4%
15 TCF Financial Corporation MN $1.20 $1.15 4.3%
16 United Bankshares WV $2.07 $1.99 4.0%
17 Umpqua Holdings Corporation OR $1.08 $1.05 2.9%
18 Prosperity Bancshares TX $4.05 $3.94 2.8%
19 Old National Bancorp IN $1.06 $1.05 1.0%

ANALYSTS’ RECOMMENDATIONS (AS OF 5/08/17)
48
• Barclays Capital, Inc. Underweight
• Boenning & Scattergood, Inc. Neutral
• FBR & Co. Market Perform
• Hovde Group, LLC Market Perform
• Jefferies LLC Hold
• Keefe, Bruyette & Woods, Inc. Market Perform
• Merion Capital Group Outperform
• Piper Jaffray & Co. Neutral
• Raymond James & Associates, Inc. Market Perform
• Sandler O’Neill & Partners, L.P. Hold

ANNUAL SHAREHOLDERS’ MEETING
49
May 15, 2017

REGULATORY UPDATE
50

OUR FUTURE GOAL: ONE BANK
51

HOW WE WILL OPERATE?
Centralized
• Strategic Planning
• Product development
• Operations/shared services
Market-based
• Sales
• Service
• One-to-one problem resolution
52 52
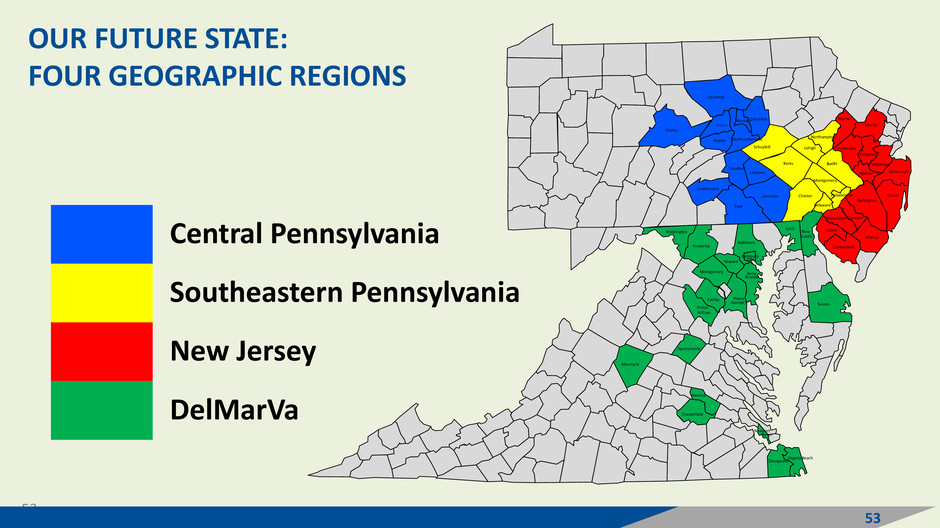
Central Pennsylvania
Southeastern Pennsylvania
New Jersey
DelMarVa
New
Castle
Sussex
Cecil
Frederick
Howard
Montgomery
Prince
George's
Washington
Baltimore
Anne
Arundel
Baltimore
Atlantic
Burlington
Camden
Cumberland
Gloucester
Hunterdon
Mercer
Middlesex
Monmouth
Morris
Ocean
Salem
Somerset
Warren
Berks
Centre
Chester
Columbia
Cumberland
Dauphin
Delaware
Lancaster
Lebanon
Lehigh
Lycoming
Montgomery
Montour
Northampton
Northumberland
Philadelphia
Schuylkill
Snyder
Union
York
Albemarle
Fairfax
Newport
Virginia Beach
Henrico
Chesapeake
News
Prince
William
Chesterfield
OUR FUTURE STATE:
FOUR GEOGRAPHIC REGIONS
53
53
Spotsylvania

New
Castle
Sussex
Cecil
Frederick
Montgomery
Prince
George's
Washington
Baltimore
Anne
Arundel
Baltimore
Atlantic
Burlington
Camden
Cumberland
Hunterdon
Mercer
Middlesex
Monmouth
Morris
Ocean
Salem
Somerset
Warren
Berks
Centre
Chester
Columbia
Cumberland
Dauphin
Delaware
Lebanon
Lancaster
Lehigh
Lycoming
Montgomery
Montour
Northampton Northumberland
Philadelphia
Schuylkill
Snyder
Union
York
Albemarle
Fairfax
Newport
Virginia Beach
Henrico
Chesapeake
News
© Copyright Bruce Jones Design Inc. 2014
Prince William
Chest
erfield
Gloucester
Howard
Spotsylvania
DelMar
Baltimore Metro
Washington DC Metro
South New Jersey
Central New Jersey
North New Jersey
Berks
Lehigh Valley
Premier
Brandywine
Philadelphia Metro
North Pennsylvania
Capital
Lancaster
Lebanon
York
Central Virginia
East Shore Virginia
18 MARKETS

Segmentation influences our operating model
55
Branch/
Relat. Mgr.
Social Call
Center
Customers
Channels
Products
ATM Online Mobile
Checking Savings Borrowing Investing
Cash Flow
Management
Employee
Banking
Retirement
Services
Commercial
Annual Revenue
Loan Amounts
$5mm -
$50mm
>$50mm
$2.5mm -
$10mm
>$10mm
Segment 3 Segment 2 Segment 1
$1mm -
$5mm
$250k -
$2.5mm
Mass
Market
<$100k
Assets
Mass
Affluent
$100k -
$1mm
Assets
Affluent
$1mm -
$3mm
Assets
Wealth
Mgmt.
>$3mm
Assets
Consumer
Small
Business
<$1 mm
Revenue
<$250k
Loans

THREE MAIN BUSINESS AREAS
Focused on the needs of specific customer segments
56
Consumer Commercial Shared
Services

57
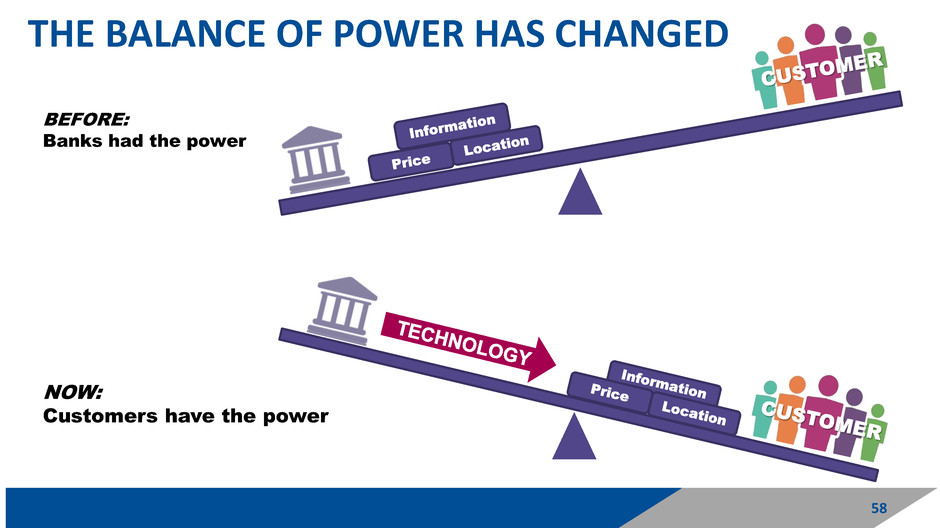
THE BALANCE OF POWER HAS CHANGED
58
BEFORE:
Banks had the power
NOW:
Customers have the power
58

WHY SEGMENTATION?
59
IMPROVE
CUSTOMER
EXPERIENCE
OPTIMIZE
RESULTS
BECOME
MORE
EFFECTIVE
AND EFFICIENT
FOCUS
EFFORTS
59

FFC’s New Approach:
60
SUPPORTING OUR COMMUNITIES
60

MISSION STATEMENT:
Fulton Forward™ helps build
vibrant communities through gifts
of time and dollars and through
programs, products and services
designed to:
• foster affordable housing,
• drive economic development,
and
• promote education and financial
literacy in the neighborhoods
we serve.
Economic
Development
Financial
Literacy
Housing
Assistance
William “Smokey” Glover
Director, Fair and
Responsible Banking
61

62
PARTNERSHIP WITH OPERATION HOPE, INC.
62

63
INVESTMENT IN
UNITED BANCSHARES, INC.
Phil Wenger
Chairman,
President
and CEO,
Fulton Financial
Corporation
Evelyn Smalls
President and CEO
United Bank
of Philadelphia
63

ANNUAL SHAREHOLDERS’ MEETING
64
May 15, 2017

QUESTIONS & ANSWERS
May 15, 2017
65

ANNUAL SHAREHOLDERS’ MEETING
66
May 15, 2017

APPENDIX
67

NON-GAAP RECONCILIATION
68
2016 2015 2014 2013 2012
Eff iciency rat io
Non-interest expense 489,519$ 480,160$ 459,246$ 461,433$ 449,294$
Less: Intangible amortization - (247) (1,259) (2,438) (3,031)
Less: Loss on redemption of trust preferred securities - (5,626) - - -
Numerator 489,519$ 474,287$ 457,987$ 458,995$ 446,263$
Net interest income (fully taxable equivalent) 541,271$ 518,464$ 532,322$ 544,474$ 561,190$
P lus: Total Non-interest income 190,178 181,839 167,379 187,664 216,412
Less: Investment securities (gains) losses (2,550) (9,066) (2,041) (8,004) (3,026)
Denominator 728,899$ 691,237$ 697,660$ 724,134$ 774,576$
Efficiency ratio 67.16% 68.61% 65.65% 63.39% 57.61%
T hree M o nths Ended
M arch 31,
2017 2016 2015 2014 2013 2012
R eturn o n T angible Equity
Net income 43,380$ 161,625$ 149,502$ 157,894$ 161,840$ 159,845$
P lus: Intangible amortization, net of tax - - 161 818 1,585 1,970
Numerator 43,380$ 161,625$ 149,663$ 158,712$ 163,425$ 161,815$
Average shareholders' equity 2,140,547$ 2,100,634$ 2,026,883$ 2,071,640$ 2,053,821$ 2,050,994$
Less: Average goodwill and intangible assets (531,556) (531,556) (531,618) (532,425) (534,431) (542,600)
Average tangible shareholders' equity (denominator) 1,608,991$ 1,569,078$ 1,495,265$ 1,539,215$ 1,519,390$ 1,508,394$
Return on average common shareholders' equity (tangible), annualized 10.93% 10.30% 10.01% 10.31% 10.76% 10.73%
Year Ended D ecember 31,
(dollars in thousands)
Year Ended D ec 31,
(dollars in thousands)
Note: The Corporation has presented the following non-GAAP (Generally Accepted Accounting Principles) financial measures because it believes
that these measures provide useful and comparative information to assess trends in the Corporation's results of operations and financial
condition. Presentation of these non-GAAP financial measures is consistent with how the Corporation evaluates its performance internally and
these non-GAAP financial measures are frequently used by securities analysts, investors and other interested parties in the evaluation of
companies in the Corporation's industry. Investors should recognize that the Corporation's presentation of these non-GAAP financial measures
might not be comparable to similarly-titled measures of other companies. These non-GAAP financial measures should not be considered a
substitute for GAAP basis measures and the Corporation strongly encourages a review of its condensed consolidated financial statements in their
entirety.

NON-GAAP RECONCILIATION (CONTINUED)
69
D ec 3 1, D ec 3 1, D ec 3 1, D ec 3 1, D ec 3 1,
2 0 16 2 0 15 2 0 14 2 0 13 2 0 12
Tang ib le C ommon Equit y t o Tang ib le A sset s ( TC E R at io )
Shareholders' equity 2,121,115$ 2,041,894$ 1,996,665$ 2,063,187$ 2,081,656$
Less: Intangible assets (531,556) (531,556) (531,803) (533,076) (535,563)
Tangible shareholders' equity (numerator) 1,589,559$ 1,510,338$ 1,464,862$ 1,530,111$ 1,546,093$
Total assets 18,944,247$ 17,914,718$ 17,124,767$ 16,934,634$ 16,533,097$
Less: Intangible assets (531,556) (531,556) (531,803) (533,076) (535,563)
Total tangible assets (denominator) 18,412,691$ 17,383,162$ 16,592,964$ 16,401,558$ 15,997,534$
Tangible Common Equity to Tangible Assets 8 .6 3 % 8 .6 9 % 8 .8 3 % 9 .3 3 % 9 .6 6 %
M ar 3 1, 3 1- M ar M ar 3 1,
2 0 17 2 0 16 2 0 17
Pre- Provision N et R evenue Tang ib le B ook V alue per Share
Net interest income 137,579$ 129,054$ Shareholder's equity 2,154,683$
Non-interest income 46,673 43,137 Less: Goodwill and intangible assets (531,556)
Less: Investment securit ies gains (1,106) (947) Tangible shareholder's equity (numerator) 1,623,127
Total Revenue 183,146 171,244
Total Non-interest expense 122,275 120,413 Shares outstanding, end of period (denominator) 174,343
Pre- Provision N et R evenue 60,871$ 50,831$ Shareho lder 's equit y ( t ang ib le) , per share 9.31$
Three M ont hs Ended
FFC Consolidated
(dollars in thousands)
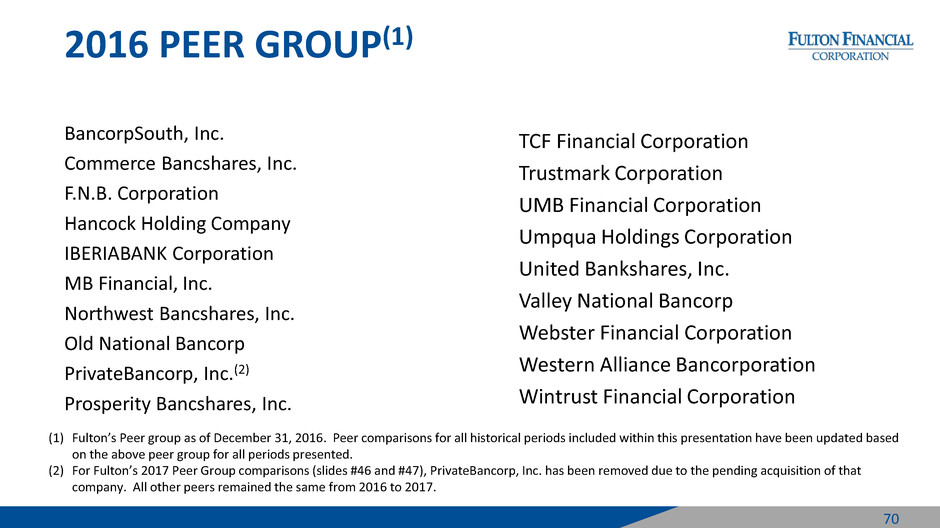
2016 PEER GROUP(1)
BancorpSouth, Inc.
Commerce Bancshares, Inc.
F.N.B. Corporation
Hancock Holding Company
IBERIABANK Corporation
MB Financial, Inc.
Northwest Bancshares, Inc.
Old National Bancorp
PrivateBancorp, Inc.(2)
Prosperity Bancshares, Inc.
70
(1) Fulton’s Peer group as of December 31, 2016. Peer comparisons for all historical periods included within this presentation have been updated based
on the above peer group for all periods presented.
(2) For Fulton’s 2017 Peer Group comparisons (slides #46 and #47), PrivateBancorp, Inc. has been removed due to the pending acquisition of that
company. All other peers remained the same from 2016 to 2017.
TCF Financial Corporation
Trustmark Corporation
UMB Financial Corporation
Umpqua Holdings Corporation
United Bankshares, Inc.
Valley National Bancorp
Webster Financial Corporation
Western Alliance Bancorporation
Wintrust Financial Corporation
