Attached files
| file | filename |
|---|---|
| EX-32.1 - CERTIFICATION - China Green Agriculture, Inc. | f10q0317ex32i_chinagreen.htm |
| EX-31.2 - CERTIFICATION - China Green Agriculture, Inc. | f10q0317ex31ii_chinagreen.htm |
| EX-31.1 - CERTIFICATION - China Green Agriculture, Inc. | f10q0317ex31i_chinagreen.htm |
UNITED STATES
SECURITIES AND EXCHANGE COMMISSION
WASHINGTON, D.C. 20549
FORM 10-Q
(Mark One)
☒ QUARTERLY REPORT PURSUANT TO SECTION 13 or 15(d) OF THE SECURITIES EXCHANGE ACT OF 1934.
For the quarterly period ended March 31, 2017
☐ TRANSITION REPORT PURSUANT TO SECTION 13 OR 15(d) OF THE SECURITIES EXCHANGE ACT OF 1934.
For the transition period from ____________ to ____________
Commission File Number 001-34260
CHINA GREEN AGRICULTURE, INC.
(Exact name of registrant as specified in its charter)
| Nevada | 36-3526027 | |
| (State or other jurisdiction of | (IRS Employer | |
| incorporation or organization) | Identification No.) |
| 3rd floor, Borough A, Block A. No. 181, South Taibai Road,Xi’an, Shaanxi province, PRC 710065 | ||
| (Address of principal executive offices) (Zip Code) |
| +86-29-88266368 | ||
| (Issuer's telephone number, including area code) |
Indicate by check mark whether the issuer (1) filed all reports required to be filed by Section 13 or 15(d) of the Securities Exchange Act of 1934 during the preceding 12 months (or for such shorter period that the registrant was required to file such reports), and (2) has been subject to such filing requirements for the past 90 days. Yes ☒ No ☐
Indicate by check mark whether the registrant has submitted electronically and posted on its corporate Web site, if any, every Interactive Data File required to be submitted and posted pursuant to Rule 405 of Regulation S-T (§232.405 of this chapter) during the preceding 12 months (or for such shorter period that the registrant was required to submit and post such files). Yes ☒ No ☐
Indicate by check mark whether the registrant is a large accelerated filer, an accelerated filer, a non-accelerated filer, smaller reporting company, or an emerging growth company. See the definitions of “large accelerated filer,” “accelerated filer,” “smaller reporting company,” and “emerging growth company” in Rule 12b-2 of the Exchange Act.
| Large accelerated filer | ☐ | Accelerated filer | ☐ |
| Non-accelerated filer | ☐ (Do not check if a smaller reporting company) | Smaller reporting company | ☒ |
| Emerging growth company | ☐ | ||
If an emerging growth company, indicate by check mark if the registrant has elected not to use the extended transition period for complying with any new or revised financial accounting standards provided pursuant to Section 13(a) of the Exchange Act. ☐
Indicate by check mark whether the registrant is a shell company (as defined in Rule 12b-2 of the Exchange Act). Yes ☐ No ☒
APPLICABLE ONLY TO CORPORATE ISSUERS:
Indicate the number of shares outstanding of each of the issuer's classes of common stock, as of the latest practicable date: 38,551,265 shares of common stock, $.001 par value, as of May 8, 2017.
TABLE OF CONTENTS
PART I – FINANCIAL INFORMATION
| CHINA GREEN AGRICULTURE INC. AND SUBSIDIARIES | ||||||||
| CONSOLIDATED BALANCE SHEETS | ||||||||
| March 31, 2017 | June 30, 2016 | |||||||
| (unaudited) | ||||||||
| ASSETS | ||||||||
| Current Assets | ||||||||
| Cash and cash equivalents | $ | 118,259,995 | $ | 102,896,486 | ||||
| Accounts receivable, net | 154,950,404 | 117,055,376 | ||||||
| Inventories | 46,418,945 | 87,436,315 | ||||||
| Prepaid expenses and other current assets | 1,801,665 | 1,329,098 | ||||||
| Advances to suppliers, net | 28,540,308 | 26,863,959 | ||||||
| Total Current Assets | 349,971,317 | 335,581,234 | ||||||
| Plant, Property and Equipment, Net | 33,909,365 | 37,569,739 | ||||||
| Deferred Asset, Net | 1,967,215 | 13,431,621 | ||||||
| Other Assets | 262,881 | 379,047 | ||||||
| Other Non-current Assets | 9,920,596 | - | ||||||
| Intangible Assets, Net | 22,589,546 | 23,840,048 | ||||||
| Goodwill | 8,356,291 | 7,980,838 | ||||||
| Total Assets | $ | 426,977,211 | $ | 418,782,527 | ||||
| LIABILITIES AND STOCKHOLDERS' EQUITY | ||||||||
| Current Liabilities | ||||||||
| Accounts payable | $ | 11,783,861 | $ | 5,246,153 | ||||
| Customer deposits | 6,555,693 | 8,578,341 | ||||||
| Accrued expenses and other payables | 8,451,805 | 16,414,392 | ||||||
| Amount due to related parties | 3,034,201 | 2,473,004 | ||||||
| Taxes payable | 3,379,961 | 4,104,218 | ||||||
| Short term loans | 5,965,201 | 4,665,500 | ||||||
| Interest payable | 297,121 | - | ||||||
| Derivative liability | 52,768 | 144,818 | ||||||
| Total Current Liabilities | 39,520,611 | 41,626,426 | ||||||
| Long-term Liabilities | ||||||||
| Long-term loan | 3,428 | - | ||||||
| Convertible notes payable, Net | 8,167,929 | 6,671,769 | ||||||
| Total Liabilities | 8,171,357 | 6,671,769 | ||||||
| Stockholders' Equity | ||||||||
| Preferred Stock, $.001 par value, 20,000,000 shares authorized, zero shares issued and outstanding | - | - | ||||||
| Common stock, $.001 par value, 115,197,165 shares authorized, 38,535,161 and 36,978,605 shares issued and outstanding as of March 31, 2017 and June 30, 2016, respectively | 38,535 | 37,648 | ||||||
| Additional paid-in capital | 128,896,690 | 127,593,932 | ||||||
| Statutory reserve | 28,872,126 | 27,203,861 | ||||||
| Retained earnings | 240,726,280 | 221,345,279 | ||||||
| Accumulated other comprehensive income | (19,248,388 | ) | (5,696,388 | ) | ||||
| Total Stockholders' Equity | 379,285,243 | 370,484,332 | ||||||
| Total Liabilities and Stockholders' Equity | $ | 426,977,211 | $ | 418,782,527 | ||||
The accompanying notes are an integral part of these consolidated financial statements.
| 1 |
| CHINA GREEN AGRICULTURE INC. AND SUBSIDIARIES | ||||||||||||||||
| CONSOLIDATED STATEMENTS OF INCOME AND COMPREHENSIVE INCOME (LOSS) | ||||||||||||||||
| (UNAUDITED) | ||||||||||||||||
| Three Months Ended March 31, | Nine Months Ended March 31, | |||||||||||||||
| 2017 | 2016 | 2017 | 2016 | |||||||||||||
| Sales | ||||||||||||||||
| Jinong | $ | 26,316,821 | $ | 31,602,239 | $ | 84,570,215 | $ | 97,612,604 | ||||||||
| Gufeng | 30,858,499 | 43,762,058 | 67,734,572 | 85,576,564 | ||||||||||||
| Yuxing | 2,781,003 | 3,274,177 | 6,590,728 | 6,599,577 | ||||||||||||
| VIEs | 21,349,305 | - | 43,039,748 | - | ||||||||||||
| Net sales | 81,305,628 | 78,638,474 | 201,935,263 | 189,788,745 | ||||||||||||
| Cost of goods sold | ||||||||||||||||
| Jinong | 12,143,167 | 13,353,222 | 37,744,757 | 41,328,293 | ||||||||||||
| Gufeng | 26,319,435 | 38,109,311 | 57,843,171 | 72,567,833 | ||||||||||||
| Yuxing | 2,230,319 | 2,441,652 | 5,209,973 | 4,334,600 | ||||||||||||
| VIEs | 19,260,074 | - | 37,173,460 | - | ||||||||||||
| Cost of goods sold | 59,952,995 | 53,904,185 | 137,971,361 | 118,230,726 | ||||||||||||
| Gross profit | 21,352,633 | 24,734,289 | 63,963,902 | 71,558,019 | ||||||||||||
| Operating expenses | ||||||||||||||||
| Selling expenses | 6,130,825 | 3,441,511 | 15,108,275 | 11,070,369 | ||||||||||||
| Selling expenses - amortization of deferred asset | 1,556,031 | 8,780,893 | 11,140,251 | 27,158,360 | ||||||||||||
| General and administrative expenses | 3,971,890 | 2,204,771 | 11,837,282 | 7,864,395 | ||||||||||||
| Total operating expenses | 11,658,746 | 14,427,175 | 38,085,808 | 46,093,124 | ||||||||||||
| Income from operations | 9,693,887 | 10,307,114 | 25,878,094 | 25,464,895 | ||||||||||||
| Other income (expense) | ||||||||||||||||
| Other income (expense) | 330,538 | (2,473 | ) | 175,366 | (6,307 | ) | ||||||||||
| Interest income | 79,280 | 263,768 | 232,396 | 416,700 | ||||||||||||
| Interest expense | (232,639 | ) | (211,734 | ) | (464,430 | ) | (943,413 | ) | ||||||||
| Total other income (expense) | 177,179 | 49,561 | (56,668 | ) | (533,020 | ) | ||||||||||
| Income before income taxes | 9,871,066 | 10,356,675 | 25,821,426 | 24,931,875 | ||||||||||||
| Provision for income taxes | 1,679,391 | 2,104,904 | 4,772,160 | 5,166,897 | ||||||||||||
| Net income | 8,191,675 | 8,251,771 | 21,049,266 | 19,764,978 | ||||||||||||
| Other comprehensive income (loss) | ||||||||||||||||
| Foreign currency translation gain (loss) | (2,801,325 | ) | 2,722,073 | (19,248,388 | ) | (20,006,295 | ) | |||||||||
| Comprehensive income (loss) | $ | 5,390,350 | $ | 10,973,844 | $ | 1,800,878 | $ | (241,317 | ) | |||||||
| Basic weighted average shares outstanding | 38,532,033 | 36,962,166 | 37,941,957 | 36,610,131 | ||||||||||||
| Basic net earnings per share | $ | 0.21 | $ | 0.22 | $ | 0.55 | $ | 0.54 | ||||||||
| Diluted weighted average shares outstanding | 38,532,033 | 36,962,166 | 37,941,957 | 36,610,131 | ||||||||||||
| Diluted net earnings per share | 0.21 | 0.22 | 0.55 | 0.54 | ||||||||||||
The accompanying notes are an integral part of these consolidated financial statements.
| 2 |
| CHINA GREEN AGRICULTURE INC. AND SUBSIDIARIES |
| CONSOLIDATED STATEMENTS OF CASH FLOWS |
| (UNAUDITED) |
| Nine Months Ended March 31, | ||||||||
| 2017 | 2016 | |||||||
| Cash flows from operating activities | ||||||||
| Net income | $ | 21,049,266 | $ | 19,764,978 | ||||
| Adjustments to reconcile net income to net cash provided by operating activities | ||||||||
| Issuance of common stock and stock options for compensation | 1,303,645 | 3,014,153 | ||||||
| Depreciation and amortization | 14,921,548 | 31,245,614 | ||||||
| Loss on disposal of property, plant and equipment | 115,933 | 1,375 | ||||||
| Amortization of debt discount | 231,998 | - | ||||||
| Change in fair value of derivative liability | (88,106 | ) | - | |||||
| Allowance for bad debts | 5,624,394 | 218,244 | ||||||
| Changes in operating assets | ||||||||
| Accounts receivable | (47,292,468 | ) | (10,096,055 | ) | ||||
| Amount due from related parties | - | (618,198 | ) | |||||
| Other current assets | (509,573 | ) | (52,579 | ) | ||||
| Inventories | 39,403,840 | (12,622,730 | ) | |||||
| Advances to suppliers | (2,675,330 | ) | 1,440,660 | |||||
| Other assets | (9,753,250 | ) | 53,797 | |||||
| Changes in operating liabilities | ||||||||
| Accounts payable | 6,094,687 | 343,579 | ||||||
| Customer deposits | (2,181,648 | ) | (12,842,647 | ) | ||||
| Tax payables | (8,461,337 | ) | (420,814 | ) | ||||
| Accrued expenses and other payables | (585,606 | ) | 456,970 | |||||
| Interest payable | 301,355 | - | ||||||
| Net cash provided by operating activities | 17,499,348 | 19,886,347 | ||||||
| Cash flows from investing activities | ||||||||
| Purchase of plant, property, and equipment | (30,756 | ) | (16,608 | ) | ||||
| Cash paid for acquisition, net | (123,614 | ) | - | |||||
| Change in construction in process | (204,660 | ) | - | |||||
| Net cash used in investing activities | (359,030 | ) | (16,608 | ) | ||||
| Cash flows from financing activities | ||||||||
| Proceeds from loans | 5,890,757 | 5,626,800 | ||||||
| Repayment of loans | (4,562,642 | ) | (23,319,960 | ) | ||||
| Advance from related party | 600,000 | 200,000 | ||||||
| Net cash provided by financing activities | 1,928,115 | (17,493,160 | ) | |||||
| Effect of exchange rate change on cash and cash equivalents | (3,704,924 | ) | (4,888,986 | ) | ||||
| Net increase in cash and cash equivalents | 15,363,509 | (2,512,407 | ) | |||||
| Cash and cash equivalents, beginning balance | 102,896,486 | 92,982,564 | ||||||
| Cash and cash equivalents, ending balance | $ | 118,259,995 | $ | 90,470,157 | ||||
| Supplement disclosure of cash flow information | ||||||||
| Interest expense paid | $ | 464,430 | $ | 943,413 | ||||
| Income taxes paid | $ | 6,071,366 | $ | 583,304 | ||||
The accompanying notes are an integral part of these consolidated financial statements.
| 3 |
NOTE 1 – ORGANIZATION AND DESCRIPTION OF BUSINESS
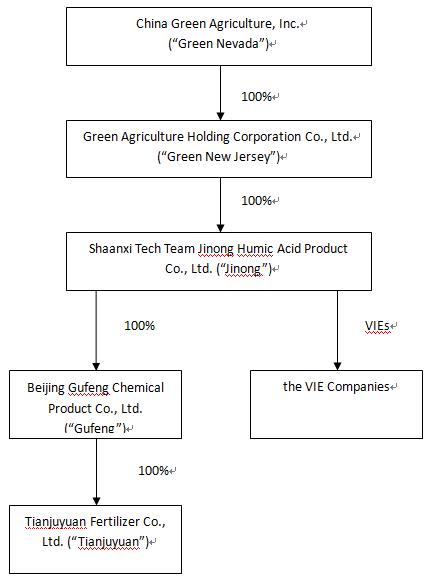
China Green Agriculture, Inc. (the “Company”, “Parent Company” or “Green Nevada”), through its subsidiaries, is engaged in the research, development, production, distribution and sale of humic acid-based compound fertilizer, compound fertilizer, blended fertilizer, organic compound fertilizer, slow-release fertilizers, highly-concentrated water-soluble fertilizers and mixed organic-inorganic compound fertilizer and the development, production and distribution of agricultural products.
Unless the context indicates otherwise, as used in the notes to the financial statements of the Company, the following are the references herein of all the subsidiaries of the Company (i) Green Agriculture Holding Corporation (“Green New Jersey”), a wholly-owned subsidiary of Green Nevada, incorporated in the State of New Jersey; (ii) Shaanxi TechTeam Jinong Humic Acid Product Co., Ltd. (“Jinong”), a wholly-owned subsidiary of Green New Jersey organized under the laws of the PRC; (iii) Xi’an Hu County Yuxing Agriculture Technology Development Co., Ltd. (“Yuxing”), a Variable Interest Entity (“VIE”) in the in the People’s Republic of China (the “PRC”) controlled by Jinong through a series of contractual agreements; (iv) Beijing Gufeng Chemical Products Co., Ltd., a wholly-owned subsidiary of Jinong in the PRC (“Gufeng”), and (v) Beijing Tianjuyuan Fertilizer Co., Ltd., Gufeng’s wholly-owned subsidiary in the PRC (“Tianjuyuan”).
On June 30, 2016 the Company, through its wholly-owned subsidiary Jinong, entered into strategic acquisition agreements and a series of contractual agreements with the shareholders of the following six companies that are organized under the laws of the PRC and would be deemed VIEs: Shaanxi Lishijie Agrochemical Co., Ltd. (“Lishijie”), Songyuan Jinyangguang Sannong Service Co., Ltd. (“Jinyangguang”), Shenqiu County Zhenbai Agriculture Co., Ltd. (“Zhenbai”), Weinan City Linwei District Wangtian Agricultural Materials Co., Ltd. (“Wangtian”), Aksu Xindeguo Agricultural Materials Co., Ltd. (“Xindeguo”), and Xinjiang Xinyulei Eco-agriculture Science and Technology co., Ltd. (“Xinyulei”). On January 1, 2017, the Company, through its wholly-owned subsidiary Jinong, entered into strategic acquisition agreements and a series of contractual agreements with the shareholders of the following two companies that are organized under the laws of the PRC and would be deemed VIEs, Sunwu County Xiangrong Agricultural Materials Co., Ltd. (“Xiangrong”), and Anhui Fengnong Seed Co., Ltd. (“Fengnong”).
Yuxing, Lishijie, Jinyangguang, Zhenbai, Wangtian, Xindeguo, Xinyulei, Xiangrong and Fengnong may also collectively be referred to as the “the VIE Companies”
| 4 |
The Company’s current corporate structure as of is set forth in the diagram below:
| 5 |
NOTE 2 – BASIS OF PRESENTATION AND SUMMARY OF SIGNIFICANT ACCOUNTING POLICIES
Principle of consolidation
The accompanying consolidated financial statements include the accounts of the Company and its wholly-owned subsidiaries, Green New Jersey, Jinong, Gufeng, Tianjuyuan, Yuxing and the VIE Companies. All significant inter-company accounts and transactions have been eliminated in consolidation.
VIE assessment
A VIE is an entity (1) that has total equity at risk that is not sufficient to finance its activities without additional subordinated financial support from other entities, (2) where the group of equity holders does not have the power to direct the activities of the entity that most significantly impact the entity’s economic performance, or the obligation to absorb the entity’s expected losses or the right to receive the entity’s expected residual returns, or both, or (3) where the voting rights of some investors are not proportional to their obligations to absorb the expected losses of the entity, their rights to receive the expected residual returns of the entity, or both, and substantially all of the entity’s activities either involve or are conducted on behalf of an investor that has disproportionately few voting rights. In order to determine if an entity is considered a VIE, the Company first performs a qualitative analysis, which requires certain subjective decisions regarding its assessments, including, but not limited to, the design of the entity, the variability that the entity was designed to create and pass along to its interest holders, the rights of the parties, and the purpose of the arrangement. If the Company cannot conclude after a qualitative analysis whether an entity is a VIE, it performs a quantitative analysis. The qualitative analysis considered the design of the entity, the risks that cause variability, the purpose for which the entity was created, and the variability that the entity was designed to pass along to its variable interest holders. When the primary beneficiary could not be identified through a qualitative analysis, we used internal cash flow models to compute and allocate expected losses or expected residual returns to each variable interest holder based upon the relative contractual rights and preferences of each interest holder in the VIE’s capital structure.
Use of estimates
The preparation of consolidated financial statements in conformity with accounting principles generally accepted in the United States of America requires management to make estimates and assumptions that affect the reported amounts of assets and liabilities and disclosure of contingent assets and liabilities at the date of the consolidated financial statements and the amount of revenues and expenses during the reporting periods. Management makes these estimates using the best information available at the time the estimates are made. However, actual results could differ materially from those results.
Cash and cash equivalents and concentration of cash
For statement of cash flows purposes, the Company considers all cash on hand and in banks, certificates of deposit with state owned banks in the Peoples Republic of China (“PRC”) and banks in the United States, and other highly-liquid investments with maturities of nine months or less, when purchased, to be cash and cash equivalents. The Company maintains large sums of cash in three major banks in China. The aggregate cash in such accounts and on hand as of March 31, 2017 and June 30, 2016 were $118,259,995 and $102,896,486, respectively. In addition, the Company also had $221,024 and $167,495 in cash in two banks in the United States as of March 31, 2017 and June 30, 2016, respectively. Cash overdraft as of balance sheet date will be reflected as liabilities in the balance sheet. The Company has not experienced any losses in such accounts and believes it is not exposed to any significant risks on its cash in bank accounts.
Accounts receivable
The Company's policy is to maintain reserves for potential credit losses on accounts receivable. Management regularly reviews the composition of accounts receivable and analyzes customer creditworthiness, current economic trends and changes in customer payment patterns to evaluate the adequacy of these reserves at each year-end. Accounts considered uncollectible are written off through a charge to the valuation allowance. As of March 31, 2017 and June 30, 2016, the Company had accounts receivable of $154,950,404 and $117,055,376, net of allowance for doubtful accounts of $6,859,447 and $1,362,852, respectively.
Inventories
Inventory is valued at the lower of cost (determined on a weighted average basis) or market. Inventories consist of raw materials, work in process, finished goods and packaging materials. The Company reviews its inventories regularly for possible obsolete goods and establishes reserves when determined necessary.
| 6 |
Deferred assets
Deferred assets represent amounts that the distributors owed to the Company in their marketing efforts and developing standard stores to expand the Company’s products’ competitiveness and market shares. The amount owed to the Company to assist its distributors will be expensed over three years, which is the term as stated in the cooperation agreement, as long as the distributors are actively selling the Company’s products. For the nine months ended March 31, 2017 and 2016, the Company amortized $13,735,614 and $21,430,699, respectively, of the deferred assets. If a distributor breaches, defaults, or terminates the agreement with the Company within the three-year period, the outstanding unamortized portion of the amount owed will become payable to the Company immediately. The Company’s Chairman, Mr. Li, has guaranteed repayment of any amounts due to the Company remaining unpaid from distributors.
The deferred assets consist of items inside the distributors’ stores such as furniture, racks, cabinets, and display units, and items outside or attached to the distributors’ stores, such as signage and billboards. These types of assets would be capitalized as fixed assets if the Company actually owned the stores or utilized the assets for its own operations. These assets would also be capitalized as leasehold improvements if the Company leased these stores from the distributors. Therefore, the Company believes that under U.S. generally accepted accounting principles, these types of asset purchases are properly capitalized. In addition, the Company believes that these assets are properly classified as deferred assets because if a distributor breaches, defaults, or terminates the agreement with the Company within a three-year period, a proportionate amount expended by the Company is to be repaid by the distributor. The Company’s Chairman, Mr. Li, has guaranteed repayment of any amounts due to the Company remaining unpaid from distributors.
The assets inside the distributors’ stores are custom made to fit the layout of each individual store and the signage and billboards are also custom designed to fit the specific location. The assets were purchased by the Company directly from the manufacturers and installed in the distributors’ stores. The Company wants to maintain control over the quality of the items being purchased as well as making them uniform among all the distributor locations.
Intangible Assets
The Company records intangible assets acquired individually or as part of a group at fair value. Intangible assets with definite lives are amortized over the useful life of the intangible asset, which is the period over which the asset is expected to contribute directly or indirectly to the entity’s future cash flows. The Company evaluates intangible assets for impairment at least annually and more often whenever events or changes in circumstances indicate that the carrying value may not be recoverable. Whenever any such impairment exists, an impairment loss will be recognized for the amount by which the carrying value exceeds the fair value.
Goodwill
Goodwill represents the excess of purchase price over the underlying net assets of businesses acquired. Goodwill is reviewed for impairment on an annual basis, or more frequently if events or changes in circumstances indicate that the carrying amount of goodwill may be impaired. The goodwill impairment test is a two-step test. Under the first step, the fair value of the reporting unit is compared with its carrying value including goodwill. If the fair value of the reporting unit exceeds its carrying value, step two does not need to be performed. If the fair value of the reporting unit is less than its carrying value, an indication of goodwill impairment exists for the reporting unit and the enterprise must perform step two of the impairment test. Under step two, an impairment loss is recognized for any excess of the carrying amount of the reporting unit’s goodwill over the implied fair value of that goodwill. The implied fair value of goodwill is determined by allocating the fair value of the reporting unit in a manner similar to a purchase price allocation. The residual fair value after this allocation is the implied fair value of the reporting unit goodwill. As of June 30, 2016, the Company performed the required impairment review which resulted in no impairment adjustment.
Summary of changes in goodwill by reporting segments is as follows:
| Balance at | Foreign | Balance at | ||||||||||||||
| June 30, | Currency | March 31, | ||||||||||||||
| Segment | 2016 | Additions | Adjustment | 2017 | ||||||||||||
| Gufeng | $ | 4,822,659 | - | $ | (172,590 | ) | 4,650,069 | |||||||||
| Acquisition of VIE Companies | 3,158,179 | 661,066 | (113,023 | ) | 3,706,222 | |||||||||||
| $ | 7,930,838 | $ | 661,066 | $ | (422,984 | ) | $ | 8,356,291 | ||||||||
The goodwill addition in the above table is due to the acquisition of two new VIE Companies in January 2017. Such addition amount will be subject to the year-end audit as of June 30, 2017 for adjustments if needed.
| 7 |
Fair Value Measurement and Disclosures
Our accounting for Fair Value Measurement and Disclosures, defines fair value as the exchange price that would be received for an asset or paid to transfer a liability (an exit price) in the principal or most advantageous market for the asset or liability in an orderly transaction between market participants on the measurement date. This topic also establishes a fair value hierarchy which requires classification based on observable and unobservable inputs when measuring fair value. The fair value hierarchy distinguishes between assumptions based on market data (observable inputs) and an entity’s own assumptions (unobservable inputs). The hierarchy consists of three levels:
Level one — Quoted market prices in active markets for identical assets or liabilities;
Level two — Inputs other than level one inputs that are either directly or indirectly observable; and
Level three — Unobservable inputs developed using estimates and assumptions, which are developed by the reporting entity and reflect those assumptions that a market participant would use.
Determining which category an asset or liability falls within the hierarchy requires significant judgment. The Company evaluates its hierarchy disclosures each quarter.
The following table presents the Company’s assets and liabilities required to be reflected within the fair value hierarchy as of March 31, 2017.
| Fair Value | Fair Value Measurements at | |||||||||||||||
| As
of March 31, | June
30, 2016 | |||||||||||||||
| Description | 2017 | Using Fair Value Hierarchy | ||||||||||||||
| Level 1 | Level 2 | Level 3 | ||||||||||||||
| Derivative liability | $ | 52,768 | $ | - | $ | 144,818 | $ | - | ||||||||
The carrying values of cash and cash equivalents, trade and other receivables, trade and other payables approximate their fair values due to the short maturities of these instruments.
Derivative financial instruments
The Company evaluates its financial instruments to determine if such instruments are derivatives or contain features that qualify as embedded derivatives. For derivative financial instruments that are accounted for as liabilities, the derivative instrument is initially recorded at its fair value and is then re-valued at each reporting date, with changes in the fair value reported in the statements of operations. The Company uses a binomial option pricing model to value the derivative instruments. The classification of derivative instruments, including whether such instruments should be recorded as liabilities or as equity, is evaluated at the end of each reporting period.
At March 31, 2017, the only derivative financial instrument is the variable conversion feature embedded in the convertible notes payable (See Note 9). The fair value of the embedded conversion of $52,768 is recorded as a derivative liability at March 31, 2017. The fair value was determined using a binomial option pricing model with the following assumptions:
| Risk-free rate | 2.96 | % | ||
| Volatility | 51.4 | % | ||
| Dividend yield | 0.0 | % | ||
| Country risk premium | 90.0 | % | ||
| Liquidity risk premium | 3.0 | % |
Customer deposits
Payments received before all of the relevant criteria for revenue recognition are satisfied are recorded as customer deposits. When all revenue recognition criteria are met, the customer deposits are recognized as revenue. As of March 31, 2017 and June 30, 2016, the Company had customer deposits of $6,555,693 and $8,578,341, respectively.
| 8 |
Earnings per share
Basic earnings per share is computed based on the weighted average number of shares of common stock outstanding during the period. Diluted earnings per share is computed based on the weighted average number of shares of common stock plus the effect of dilutive potential common shares outstanding during the period using the treasury stock method. Dilutive potential common shares include outstanding stock options and stock awards.
The components of basic and diluted earnings per share consist of the following:
| Three Months Ended March 31, | ||||||||
| 2017 | 2016 | |||||||
| Net Income for Basic Earnings Per Share | $ | 8,191,675 | $ | 8,251,771 | ||||
| Basic Weighted Average Number of Shares | 38,532,033 | 36,962,166 | ||||||
| Net Income Per Share – Basic | $ | 0.21 | $ | 0.22 | ||||
| Net Income for Diluted Earnings Per Share | $ | 8,191,675 | $ | 8,251,771 | ||||
| Diluted Weighted Average Number of Shares | 38,532,033 | 36,962,166 | ||||||
| Net Income Per Share – Diluted | $ | 0.21 | $ | 0.22 | ||||
| Nine Months Ended March 31, | ||||||||
| 2017 | 2016 | |||||||
| Net Income for Basic Earnings Per Share | $ | 21,049,266 | $ | 19,764,978 | ||||
| Basic Weighted Average Number of Shares | 37,941,957 | 36,610,131 | ||||||
| Net Income Per Share – Basic | $ | 0.55 | $ | 0.54 | ||||
| Net Income for Diluted Earnings Per Share | $ | 21,049,266 | $ | 19,764,978 | ||||
| Diluted Weighted Average Number of Shares | 37,941,957 | 36,610,131 | ||||||
| Net Income Per Share – Diluted | $ | 0.55 | $ | 0.54 | ||||
Recent accounting pronouncements
In May 2014, the FASB issued ASU 2014-09, Revenue from Contracts with Customers, which supersedes nearly all existing revenue recognition guidance under U.S. GAAP. The core principle of ASU 2014-09 is to recognize revenues when promised goods or services are transferred to customers in an amount that reflects the consideration to which an entity expects to be entitled for those goods or services. ASU 2014-09 defines a five step process to achieve this core principle and, in doing so, more judgment and estimates may be required within the revenue recognition process than are required under existing U.S. GAAP. This pronouncement is effective for annual reporting periods beginning after December 15, 2016, and is to be applied using one of two retrospective application methods, with early application not permitted. The Company is currently assessing the materiality of the impact to our consolidated financial statements, and have not yet selected a transition approach.
In January 2015, the FASB issued Accounting Standards Update (ASU) No. 2015-01 (Subtopic 225-20) - Income Statement - Extraordinary and Unusual Items. ASU 2015-01 eliminates the concept of an extraordinary item from GAAP. As a result, an entity will no longer be required to segregate extraordinary items from the results of ordinary operations, to separately present an extraordinary item on its income statement, net of tax, after income from continuing operations or to disclose income taxes and earnings-per-share data applicable to an extraordinary item. However, ASU 2015-01 will still retain the presentation and disclosure guidance for items that are unusual in nature and occur infrequently. ASU 2015-01 is effective for periods beginning after December 15, 2015. The adoption of ASU 2015-01 is not expected to have a material effect on the Company’s consolidated financial statements. Early adoption is permitted.
In February, 2015, the FASB issued Accounting Standards Update (ASU) No. 2015-02, Consolidation (Topic 810): Amendments to the Consolidation Analysis. ASU 2015-02 provides guidance on the consolidation evaluation for reporting organizations that are required to evaluate whether they should consolidate certain legal entities such as limited partnerships, limited liability corporations, and securitization structures (collateralized debt obligations, collateralized loan obligations, and mortgage-backed security transactions). ASU 2015-02 is effective for periods beginning after December 15, 2015. The adoption of ASU 2015-02 is not expected to have a material effect on the Company’s consolidated financial statements. Early adoption is permitted.
| 9 |
In September, 2015, the FASB issued ASU No. 2015-16, Business Combinations (Topic 805). Topic 805 requires that an acquirer retrospectively adjust provisional amounts recognized in a business combination, during the measurement period. To simplify the accounting for adjustments made to provisional amounts, the amendments in the Update require that the acquirer recognize adjustments to provisional amounts that are identified during the measurement period in the reporting period in which the adjustment amount is determined. The acquirer is required to also record, in the same period’s financial statements, the effect on earnings of changes in depreciation, amortization, or other income effects, if any, as a result of the change to the provisional amounts, calculated as if the accounting had been completed at the acquisition date. In addition an entity is required to present separately on the face of the income statement or disclose in the notes to the financial statements the portion of the amount recorded in current-period earnings by line item that would have been recorded in previous reporting periods if the adjustment to the provisional amounts had been recognized as of the acquisition date. ASU 2015-16 is effective for fiscal years beginning December 15, 2015. The adoption of ASU 2015-016 is not expected to have a material effect on the Company’s consolidated financial statements.
In November 2015, the FASB issued ASU No. 2015-17, Balance Sheet Classification of Deferred Taxes. The new guidance requires that all deferred tax assets and liabilities, along with any related valuation allowance, be classified as noncurrent on the balance sheet. This update is effective for annual periods beginning after December 15, 2016 and interim periods within those annual periods. The Company does not anticipate the adoption of this ASU will have a significant impact on its consolidated financial position, results of operations, or cash flows.
In February 2016, the FASB issued ASU No. 2016-02, Leases (Topic 842). The guidance in ASU No. 2016-02 supersedes the lease recognition requirements in ASC Topic 840, Leases (FAS 13). ASU 2016-02 requires an entity to recognize assets and liabilities arising from a lease for both financing and operating leases, along with additional qualitative and quantitative disclosures. ASU 2016-02 is effective for fiscal years beginning after December 15, 2018, with early adoption permitted. The Company is currently evaluating the effect this standard will have on its consolidated financial statements.
In March 2016, the FASB issued ASU 2016-09, Improvements to Employee Share Based Payment Accounting, to simplify several aspects of the accounting for share-based payment transactions, including the income tax consequences, classification of awards as either equity or liabilities, and classification on the statement of cash flows. The guidance will be effective for annual periods beginning after December 15, 2016 and interim periods within those annual periods. Early adoption is permitted, including adoption in an interim period. The Company is currently evaluating the impact of the adoption of this newly issued guidance to its consolidated financial statements.
Other recent accounting pronouncements issued by the FASB, including its Emerging Issues Task Force, the American Institute of Certified Public Accountants, and the Securities and Exchange Commission did not or are not believed by management to have a material impact on the Company's present or future financial statements.
NOTE 3 – INVENTORIES
Inventories consisted of the following:
| March 31, | June 30, | |||||||
| 2017 | 2016 | |||||||
| Raw materials | $ | 6,964,106 | $ | 29,926,762 | ||||
| Supplies and packing materials | $ | 514,822 | $ | 444,373 | ||||
| Work in progress | $ | 362,137 | $ | 408,820 | ||||
| Finished goods | $ | 38,577,880 | $ | 56,656,360 | ||||
| Total | $ | 46,418,945 | $ | 87,436,315 | ||||
| 10 |
NOTE 4 – PROPERTY, PLANT AND EQUIPMENT
Property, plant and equipment consisted of the following:
| March 31, | June 30, | |||||||
| 2017 | 2016 | |||||||
| Building and improvements | $ | 40,930,618 | $ | 42,489,975 | ||||
| Auto | 1,134,845 | 937,642 | ||||||
| Machinery and equipment | 18,136,674 | 19,015,420 | ||||||
| Agriculture assets | 738,571 | 765,983 | ||||||
| Total property, plant and equipment | 60,940,708 | 63,209,020 | ||||||
| Less: accumulated depreciation | (27,031,343 | ) | (25,639,281 | ) | ||||
| Total | $ | 33,909,365 | $ | 37,569,739 | ||||
NOTE 5 – INTANGIBLE ASSETS
Intangible assets consisted of the following:
| March 31, | June 30, | |||||||
| 2017 | 2016 | |||||||
| Land use rights, net | $ | 9,834,810 | $ | 10,381,215 | ||||
| Technology patent, net | 3,976 | 4,462 | ||||||
| Customer relationships, net | 5,725,467 | 6,403,343 | ||||||
| Non-compete agreement | 1,119,153 | 925,678 | ||||||
| Trademarks | 5,906,140 | 6,125,350 | ||||||
| Total | $ | 22,589,546 | $ | 23,840,048 | ||||
LAND USE RIGHT
On September 25, 2009, Yuxing was granted a land use right for approximately 88 acres (353,000 square meters or 3.8 million square feet) by the People’s Government and Land & Resources Bureau of Hu County, Xi’an, Shaanxi Province. The fair value of the related intangible asset was determined to be the respective cost of RMB73,184,895 (or $10,620,153). The intangible asset is being amortized over the grant period of 50 years using the straight line method.
On August 13, 2003, Tianjuyuan was granted a certificate of Land Use Right for a parcel of land of approximately 11 acres (42,726 square meters or 459,898 square feet) at Ping Gu District, Beijing. The purchase cost was recorded at RMB1,045,950 (or $151,782). The intangible asset is being amortized over the grant period of 50 years.
On August 16, 2001, Jinong received a land use right as a contribution from a shareholder, which was granted by the People’s Government and Land & Resources Bureau of Yangling District, Shaanxi Province. The fair value of the related intangible asset at the time of the contribution was determined to be RMB7,285,099 (or $1,057,170). The intangible asset is being amortized over the grant period of 50 years.
| 11 |
The Land Use Rights consisted of the following:
| March 31, | June 30, | |||||||
| 2017 | 2016 | |||||||
| Land use rights | $ | 11,829,105 | $ | 12,268,150 | ||||
| Less: accumulated amortization | (1,994,295 | ) | (1,886,935 | ) | ||||
| Total land use rights, net | $ | 9,834,810 | $ | 10,381,215 | ||||
TECHNOLOGY PATENT
On August 16, 2001, Jinong was issued a technology patent related to a proprietary formula used in the production of humic acid. The fair value of the related intangible asset was determined to be the respective cost of RMB5,875,068 (or $852,555) and is being amortized over the patent period of 10 years using the straight line method. This technology patent has been fully amortized.
On July 2, 2010, the Company acquired Gufeng and its wholly-owned subsidiary Tianjuyuan. The fair value on the acquired technology patent was estimated to be RMB9,200,000 (or $1,335,049) and is amortized over the remaining useful life of six years using the straight line method.
The technology know-how consisted of the following:
| March 31, | June 30, | |||||||
| 2017 | 2016 | |||||||
| Technology know-how | $ | 2,191,906 | $ | 2,273,260 | ||||
| Less: accumulated amortization | (2,187,930 | ) | (2,268,798 | ) | ||||
| Total technology know-how, net | $ | 3,976 | $ | 4,462 | ||||
CUSTOMER RELATIONSHIPS
On July 2, 2010, the Company acquired Gufeng and its wholly-owned subsidiary Tianjuyuan. The fair value of the acquired customer relationships was estimated to be RMB65,000,000 (or $9,432,410) and is amortized over the remaining useful life of ten years. On June 30, 2016, and January 1, 2017 the Company acquired the VIE Companies. The fair value of the acquired customer relationships was estimated to be RMB19,917,253 (or $2,890,272) and is amortized over the remaining useful life of seven to ten years.
| March 31, | June 30, | |||||||
| 2017 | 2016 | |||||||
| Customer relationships | $ | 12,322,682 | $ | 12,257,100 | ||||
| Less: accumulated amortization | (6,597,215 | ) | (5,853,757 | ) | ||||
| Total customer relationships, net | $ | 5,725,467 | $ | 6,403,343 | ||||
NON-COMPETE AGREEMENT
On July 2, 2010, the Company acquired Gufeng and its wholly-owned subsidiary Tianjuyuan. The fair value of the acquired non-compete agreement was estimated to be RMB1,320,000 (or $191,550) and is amortized over the remaining useful life of five years using the straight line method. On June 30, 2016, and January 1, 2017 the Company acquired the VIE Companies. The fair value of the acquired non-compete agreements was estimated to be RMB8,765,582 (or $1,272,009) and is amortized over the remaining useful life of five years using the straight line method.
| March 31, | June 30, | |||||||
| 2017 | 2016 | |||||||
| Non-compete agreement | $ | 1,463,559 | $ | 1,124,338 | ||||
| Less: accumulated amortization | (344,406 | ) | (198,660 | ) | ||||
| Total non-compete agreement, net | $ | 1,119,153 | $ | 925,678 | ||||
| 12 |
TRADEMARKS
On July 2, 2010, the Company acquired Gufeng and its wholly-owned subsidiary Tianjuyuan. The preliminary fair value of the acquired trademarks was estimated to be RMB40,700,000 (or $5,906,140) and is subject to an annual impairment test.
AMORTIZATION EXPENSE
Estimated amortization expenses of intangible assets for the next five twelve months periods ending March 31, are as follows:
| Twelve Months Ending March 31, | Expense ($) | |||
| 2018 | 1,647,388 | |||
| 2019 | 1,647,388 | |||
| 2020 | 1,628,631 | |||
| 2021 | 864,932 | |||
| 2022 | 552,158 | |||
NOTE 6 – ACCRUED EXPENSES AND OTHER PAYABLES
Accrued expenses and other payables consisted of the following:
| March 31, | June 30, | |||||||
| 2017 | 2016 | |||||||
| Payroll payable | $ | 103,915 | $ | 58,704 | ||||
| Welfare payable | 148,980 | 154,510 | ||||||
| Accrued expenses | 4,666,446 | 4,450,306 | ||||||
| Other payables | 3,410,762 | 11,624,653 | ||||||
| Other levy payable | 121,702 | 126,219 | ||||||
| Total | $ | 8,451,805 | $ | 16,414,392 | ||||
| 13 |
NOTE 7 – AMOUNT DUE TO RELATED PARTIES
As of March 31, 2017 and June 30, 2016, the amount due to related parties was $3,034,201 and $2,473,004, respectively. As of March 31, 2017 and June 30, 2016, $1,015,798 and $1,092,243, respectively were amounts that Gufeng borrowed from a related party, Xi’an Techteam Science & Technology Industry (Group) Co. Ltd., a company controlled by Mr. Tao Li, Chairman and CEO of the Company, representing unsecured, non-interest bearing loans that are due on demand. These loans are not subject to written agreements.
At the end of December 2015, Yuxing entered into a sales agreement with the Company’s affiliate, 900LH.com Food Co., Ltd. ("900LH.com", previously announced as Xi'an Gem Grain Co., Ltd) pursuant to which Yuxing is to supply various vegetables to 900LH.com for its incoming seasonal sales at the holidays and year ends (the “Sales Agreement”). The contingent contracted value of the Sales Agreement is RMB25,500,000 (approximately $3,700,407). For the nine months ended March 31, 2017, Yuxing has sold approximately $2,552,963 products to 900LH.com.
On June 29, 2016, Jinong signed an office lease with Kingtone Information Technology Co., Ltd. (“Kingtone Information”), of which Mr. Tao Li, Chairman and CEO of the Company, serves as Chairman. Pursuant to the lease, Jinong rented 612 square meters (approximately 6,588 square feet) of office space from Kingtone Information. The lease provides for a two-year term effective as of July 1, 2016 with monthly rent of RMB24,480 (approximately $3,552).
NOTE 8 – LOAN PAYABLES
As of March 31, 2017, the short-term loan payables consisted of three loans which mature on dates ranging from July 28, 2016 through March 5, 2018 with interest rates ranging from 5.22% to 6.3075%. Loan No. 1 below is collateralized by Tianjuyan’s real estate, and guaranteed by Jinong’s credit and Loan No. 2 below is guaranteed by Jinong’s credit.
| No. | Payee | Loan period per agreement | Interest Rate | March 31, 2017 |
||||||||
| 1 | Postal Savings Bank of China-Pinggu Branch | March 24, 2017 - March 5, 2018 | 6.3075 | % | 1,886,482 | |||||||
| 2 | Beijing Bank- Pinggu Branch | July 28, 2016 – July 28, 2017 | 5.22 | % | 1,451,140 | |||||||
| Total | $ | 3,337,622 | ||||||||||
As of June 30, 2016, the short-term loan payables consisted of three loans which mature on dates ranging from May 18, 2016 through March 17, 2017 with interest rates ranging from 4.87% to 5.82%. Loans No. 1 and 3 below are collateralized by Tianjuyan’s land use right and building ownership right. Loan No. 2 below is guaranteed by Jinong’s credit.
| No. | Payee | Loan period per agreement | Interest Rate | June 30, 2016 | ||||||||
| 1 | Agriculture Bank of China-Pinggu Branch | May. 18, 2016 – Mar. 17, 2017 | 4.87 | % | $ | 1,956,500 | ||||||
| 2 | Beijing Bank - Pinggu Branch | Aug. 11, 2015 – Aug. 2, 2016 | 5.82 | % | 1,505,000 | |||||||
| 3 | Agriculture Bank of China-Pinggu Branch | Jan. 19, 2016 – Jan. 17, 2017 | 5.00 | % | 1,204,000 | |||||||
| Total | $ | 4,665,500 | ||||||||||
The interest expense from short-term loans was $464,430 and $943,413 for the nine months ended March 31, 2017 and 2016, respectively.
| 14 |
NOTE 9 – CONVERTIBLE NOTES PAYABLE
In connection with the acquisition of the VIE Companies, the Company’s subsidiary, Jinong, issued to the VIE Companies’ shareholders convertible notes payable in the aggregate amount of RMB63,000,000 ($9,142,182), with a term of three years and an annual interest rate of 3%. The convertible notes take priority over the preferred stock and common stock of Jinong, and any other class or series of capital stock Jinong issues in the future in terms of interests and payments in the event of any liquidation, dissolution or winding up of Jinong. On or after the third anniversary of the issuance date of the notes, noteholders may request Jinong to process the note conversion to convert the note into shares of the Company’s common stock. The notes cannot be converted prior to the maturity date. The per share conversion price of the notes is the higher of the following: (i) $5.00 per share or (ii) 75% of the closing price of the Company’s common stock on the date the noteholder delivers the conversion notice.
The Company determined that the fair value of the convertible notes payable was RMB56,286,294 ($8,167,929) and RMB44,330,692 ($6,383,620) as of March 31, 2017 and June 30, 2016, respectively, which was due to the lower than market interest rate and the conversion feature. The difference between the fair value of the notes and the face amount of the notes will be amortized to interest expense over the three year life of the notes. As of March 31, 2017, the amortization of this discount into interest expense was $249,125.
NOTE 10 – TAXES PAYABLE
Enterprise Income Tax
Effective January 1, 2008, the Enterprise Income Tax (“EIT”) law of the PRC replaced the tax laws for Domestic Enterprises (“DEs”) and Foreign Invested Enterprises (“FIEs”). The EIT rate of 25% replaced the 33% rate that was applicable to both DEs and FIEs. The two year tax exemption and three year 50% tax reduction tax holiday for production-oriented FIEs was eliminated. Since January 1, 2008, Jinong became subject to income tax in China at a rate of 15% as a high-tech company, as a result of the expiration of its tax exemption on December 31, 2007. Accordingly, it made provision for income taxes for the nine months ended March 31, 2017 and 2016 of $2,814,503 and $1,805,667, respectively, which is mainly due to the operating income from Jinong. Gufeng is subject to 25% EIT rate and thus it made provision for income taxes of $1,428,284 and $1,256,325 for the nine months ended March 31, 2017 and 2016, respectively.
Value-Added Tax
All of the Company’s fertilizer products that are produced and sold in the PRC were subject to a Chinese Value-Added Tax (VAT) of 13% of the gross sales price. On April 29, 2008, the PRC State of Administration of Taxation (SAT) released Notice #56, “Exemption of VAT for Organic Fertilizer Products”, which allows certain fertilizer products to be exempt from VAT beginning June 1, 2008. The Company submitted the application for exemption in May 2009, which was granted effective September 1, 2009, continuing through March 31, 2016.
Income Taxes and Related Payables
Taxes payable consisted of the following:
| March 31, | June 30, | |||||||
| 2017 | 2016 | |||||||
| VAT provision | $ | (423,349 | ) | $ | 2,218 | |||
| Income tax payable | 3,803,310 | 3,445,480 | ||||||
| Other levies | 121,702 | 656,520 | ||||||
| Total | $ | 3,501,663 | $ | 4,104,218 | ||||
| 15 |
The provision for income taxes consists of the following:
| March 31, 2017 | June 30, 2016 | |||||||
| Current tax - foreign | $ | 4,772,160 | $ | 7,371,967 | ||||
| Deferred tax | - | - | ||||||
| $ | 4,772,160 | $ | 7,371,967 | |||||
Tax Rate Reconciliation
Our effective tax rates were approximately 20.1% and 24.7% for the nine months ended March 31, 2017 and 2016, respectively. Substantially all of the Company’s income before income taxes and related tax expense are from PRC sources. Actual income tax benefit reported in the consolidated statements of income and comprehensive income differ from the amounts computed by applying the US statutory income tax rate of 34% to income before income taxes for the nine months ended March 31, 2017 and 2016 for the following reasons:
| March 31, 2017 | ||||||||||||||||||||||||||||
| China | United States | |||||||||||||||||||||||||||
| 15% - 25% | 34% | Total | ||||||||||||||||||||||||||
| Pretax income (loss) | $ | 25,831,101 | - | (2,067,988 | ) | - | $ | 23,763,113 | ||||||||||||||||||||
| Expected income tax expense (benefit) | 6,457,775 | 25.0 | % | (703,116 | ) | 34.0 | % | 5,754,659 | ||||||||||||||||||||
| High-tech income benefits on Jinong | (1,653,707 | ) | (6 | )% | - | (1,653,707 | ) | |||||||||||||||||||||
| Losses from subsidiaries in which no benefit is recognized | (31,908 | ) | (0.1 | )% | - | (31,908 | ) | |||||||||||||||||||||
| Change in valuation allowance on deferred tax asset from US tax benefit | 0 | - | 703,116 | 703,116 | (34.0 | )% | 703,116 | |||||||||||||||||||||
| Actual tax expense | $ | 4,772,160 | 18 | % | $ | - | - | % | $ | 4,772,160 | 20.1 | % | ||||||||||||||||
| March 31, 2016 | ||||||||||||||||||||||||
| China | United States | |||||||||||||||||||||||
| 15% - 25% | 34% | Total | ||||||||||||||||||||||
| Pretax income (loss) | $ | 24,931,875 | - | 3,973 | - | $ | 20,957,987 | |||||||||||||||||
| Expected income tax expense (benefit) | 6,232,969 | 25.0 | % | (1,351,122 | ) | 34.0 | % | 4,881,847 | ||||||||||||||||
| High-tech income benefits on Jinong | (1,729,430 | ) | (6.94 | )% | - | - | (1,729,430 | ) | ||||||||||||||||
| Losses from subsidiaries in which no benefit is recognized | 663,358 | 2.66 | % | - | - | 663,358 | ||||||||||||||||||
| Change in valuation allowance on deferred tax asset from US tax benefit | - | - | 1,351,122 | (34.0 | )% | 1,351,122 | ||||||||||||||||||
| Actual tax expense | $ | 5,166,897 | 21 | % | $ | - | - | % | $ | 5,166,897 | 24.7 | % | ||||||||||||
| 16 |
NOTE 11 – STOCKHOLDERS’ EQUITY
Common Stock
On September 30, 2014, the Company granted an aggregate of 1,750,000 shares of restricted stock under the 2009 Plan to certain executive officers, directors and employees, among which were (i) 240,000 shares of restricted stock to Mr. Tao Li, the CEO; (ii) 100,000 shares of restricted stock to Mr. Ken Ren, the CFO, (iii) 40,000 shares of restricted stock to Mr. Yizhao Zhang, (iv) 30,000 shares of restricted stock to Ms. Yiru Shi, and (v) 20,000 shares of restricted stock to Mr. Lianfu Liu, each an independent director of the Company; and (vi) 1,320,000 shares of restricted stock to key employees. The stock grants are subject to time-based vesting schedules, vesting in various installments until March 31, 2015 for the CFO and the three independent directors, until June 30, 2015 for the CEO and until March 31, 2017 for the employees. The value of the restricted stock awards was $3,675,000 and is based on the fair value of the Company’s common stock on the grant date. This amount is being amortized to compensation expense over the vesting periods for the various awards. As of June 30, 2016 the unamortized portion of the compensation expense was $235,264 which will be amortized to expense through December 15, 2016.
On September 28, 2015, the Company granted an aggregate of 1,000,000 shares of restricted stock under the 2009 Plan to certain key employees. The stock grants are subject to time-based vesting schedules, vesting in various installments until June 30, 2016. The value of the restricted stock awards was $1,660,000 and is based on the fair value of the Company’s common stock on the grant date. This amount is being amortized to compensation expense over the vesting periods for the various awards.
On June 26, 2016, the Company granted an aggregate of 670,000 shares of restricted stock under the 2009 Plan to certain key employees. The stock grants vest immediately. The value of the restricted stock awards was $897,800 and is based on the fair value of the Company’s common stock on the grant date.
On December 30, 2016, the Company granted an aggregate of 870,000 shares of restricted stock under the 2009 Plan to certain key employees. The stock grants vest immediately. The value of the restricted stock awards was $1,044,000 and is based on the fair value of the Company’s common stock on the grant date.
The following table sets forth changes in compensation-related restricted stock awards during the twelve-month periods ended March 31, 2017 and 2016:
| Fair | Grant Date | |||||||||||
| Number of | Value of | Fair Value | ||||||||||
| Shares | Shares | Per share | ||||||||||
| Outstanding (unvested) at June 30, 2016 | - | $ | - | |||||||||
| Granted | - | - | $ | - | ||||||||
| Forfeited | - | |||||||||||
| Vested | - | - | ||||||||||
| Outstanding (unvested) at March 31, 2017 | - | $ | - | |||||||||
As of March 31, 2017, the unamortized expense related to the grant of restricted shares of common stock was nil. The fair value of the restricted common stock awards was based on the closing price of the Company’s common stock on the grant date. The fair value of the common stock awarded is amortized over the various vesting terms of each grant.
| 17 |
Dividend
On October 1, 2014, the Company's Board of Directors declared a cash dividend of $0.10 per share to the Company's stockholders of common stock. The dividend payable represents a total payment to the stockholders of $3,296,156. The cash dividend of $2,161,904 was paid on January 30, 2015 to stockholders of record as of the close of business on the record date of October 31, 2014. Certain stockholders, including the Company’s Chairman, Mr. Li, elected to waive the dividend payment due to them and directed the Company to retain the funds for working capital purposes.
Preferred Stock
Under the Company’s Articles of Incorporation, the Board has the authority, without further action by stockholders, to designate up to 20,000,000 shares of preferred stock in one or more series and to fix the rights, preferences, privileges, qualifications and restrictions granted to or imposed upon the preferred stock, including dividend rights, conversion rights, voting rights, rights and terms of redemption, liquidation preference and sinking fund terms, any or all of which may be greater than the rights of the common stock. If the Company sells preferred stock under its registration statement on Form S-3, it will fix the rights, preferences, privileges, qualifications and restrictions of the preferred stock of each series in the certificate of designation relating to that series and will file the certificate of designation that describes the terms of the series of preferred stock the Company offers before the issuance of the related series of preferred stock.
As of March 31, 2017, the Company has 20,000,000 shares of preferred stock authorized, with a par value of $.001 per share, of which no shares are issued or outstanding.
NOTE 12 – CONCENTRATIONS
Cash and cash equivalents concentration
The Company maintains large sums of cash in three major banks in China. The aggregate cash in such accounts and on hand as of March 31, 2017 and June 30, 2016 were $118,259,995 and $102,896,486, respectively. Financial instruments that potentially subject the Company to concentration of credit risk consist principally of cash deposits.
Market Concentration
All of the Company's revenue-generating operations are conducted in the PRC. Accordingly, the Company's business, financial condition and results of operations may be influenced by the political, economic and legal environments in the PRC, and by the general state of the PRC's economy.
The Company's operations in the PRC are subject to specific considerations and significant risks not typically associated with companies in North America and Western Europe. These include risks associated with, among other things, the political, economic and legal environment and foreign currency exchange. The Company’s results may be adversely affected by, among other things, changes in governmental policies with respect to laws and regulations, anti-inflationary measures, currency conversion and remittance abroad, and rates and methods of taxation.
Vendor and Customer Concentration
There is one vendor from which the Company purchased 15.4% of its raw materials for the three month ended March 31, 2017. Total purchases from this vendor amounted to $8,670,903 as of March 31, 2017.
There is one vendor from which the Company purchased 15.4% of its raw materials for the three months ended March 31, 2017. Total purchases from this vendor amounted to $8,670,903 as of March 31, 2017.
No customer accounted for over 10% of the Company’s sales for the three months ended March 31, 2017.
One customer accounted for 37.8% of the Company’s sales for the three months ended March 31, 2016.
| 18 |
NOTE 13 – SEGMENT REPORTING
As of March 31, 2017, the Company was organized into three main business segments based on location and product: Jinong (fertilizer production), Gufeng (fertilizer production), and Yuxing (agricultural products production). As of June 30, 2016, with the acquisition of the VIE Companies, the Company added a new distribution segment. Each of the four operating segments referenced above has separate and distinct general ledgers. The chief operating decision maker (“CODM”) receives financial information, including revenue, gross margin, operating income and net income produced from the various general ledger systems to make decisions about allocating resources and assessing performance; however, the principal measure of segment profitability or loss used by the CODM is net income by segment.
| Three Months Ended March 31, | Nine Months Ended March 31, | |||||||||||||||
| Revenues from unaffiliated customers: | 2017 | 2016 | 2017 | 2016 | ||||||||||||
| Jinong | $ | 26,316,821 | $ | 31,602,239 | $ | 84,570,215 | $ | 97,612,604 | ||||||||
| Gufeng | 30,858,499 | 43,762,058 | 67,734,572 | 85,576,564 | ||||||||||||
| Yuxing | 2,781,003 | 3,274,177 | 6,590,728 | 6,599,577 | ||||||||||||
| VIES | 21,349,305 | - | 43,039,748 | - | ||||||||||||
| Consolidated | $ | 81,305,628 | $ | 78,638,474 | $ | 201,935,263 | $ | 189,788,745 | ||||||||
| Operating income : | ||||||||||||||||
| Jinong | $ | 5,960,846 | $ | 5,854,750 | $ | 18,080,850 | $ | 17,509,024 | ||||||||
| Gufeng | 2,457,008 | 4,805,591 | 5,448,907 | 10,468,423 | ||||||||||||
| Yuxing | 244,978 | 543,855 | 732,788 | 1,461,365 | ||||||||||||
| VIES | 1,242,773 | - | 3,683,537 | - | ||||||||||||
| Reconciling item (1) | - | - | - | - | ||||||||||||
| Reconciling item (2) | (209,917 | ) | (41,454 | ) | (209,917 | ) | (261,208 | ) | ||||||||
| Reconciling item (2)--stock compensation | (1,801 | ) | (855,628 | ) | (1,858,071 | ) | (3,712,709 | ) | ||||||||
| Consolidated | $ | 9,693,887 | $ | 10,307,114 | $ | 25,878,094 | $ | 25,464,895 | ||||||||
| Net income: | ||||||||||||||||
| Jinong | $ | 4,852,889 | $ | 5,023,016 | $ | 15,048,662 | $ | 15,023,381 | ||||||||
| Gufeng | 2,160,630 | 3,577,278 | 4,145,555 | 7,247,542 | ||||||||||||
| Yuxing | 245,239 | 548,559 | 732,828 | 1,467,943 | ||||||||||||
| VIES | 1,144,635 | - | 3,190,209 | - | ||||||||||||
| Reconciling item (1) | - | - | - | 29 | ||||||||||||
| Reconciling item (2) | (211,718 | ) | (897,082 | ) | (2,067,988 | ) | (3,973,917 | ) | ||||||||
| Consolidated | $ | 8,191,675 | $ | 8,251,771 | $ | 21,049,266 | $ | 19,764,978 | ||||||||
| Depreciation and Amortization: | ||||||||||||||||
| Jinong | $ | 1,764,443 | $ | 8,723,607 | $ | 11,752,674 | $ | 28,015,696 | ||||||||
| Gufeng | 578,525 | 747,160 | 1,836,875 | 2,221,221 | ||||||||||||
| Yuxing | 302,729 | 328,956 | 922,855 | 1,008,697 | ||||||||||||
| VIES | 159,942 | - | 409,144 | - | ||||||||||||
| Consolidated | $ | 2,805,639 | $ | 9,799,723 | $ | 14,921,548 | $ | 31,245,614 | ||||||||
| Interest expense: | ||||||||||||||||
| Jinong | 188,003 | - | 301,355 | - | ||||||||||||
| Gufeng | 44,636 | 211,734 | 163,075 | 943,413 | ||||||||||||
| Consolidated | $ | 232,639 | $ | 211,734 | $ | 464,430 | $ | 943,413 | ||||||||
| Capital Expenditure: | ||||||||||||||||
| Jinong | $ | 1,186 | $ | 616 | $ | 2,979 | $ | 7,259 | ||||||||
| Gufeng | 2,300 | 1,962 | 7,299 | 1,962 | ||||||||||||
| Yuxing | - | 938 | 6,226 | 7,387 | ||||||||||||
| VIES | 14,252 | - | 14,252 | - | ||||||||||||
| Consolidated | $ | 17,738 | $ | 3,516 | $ | 30,756 | $ | 16,608 | ||||||||
| 19 |
| As of | ||||||||
| March 31, | June 30, | |||||||
| 2017 | 2016 | |||||||
| Identifiable assets: | ||||||||
| Jinong | $ | 202,114,827 | $ | 198,599,977 | ||||
| Gufeng | 148,636,436 | 149,891,328 | ||||||
| Yuxing | 42,462,630 | 45,448,157 | ||||||
| VIES | 33,542,223 | 24,675,499 | ||||||
| Reconciling item (1) | 223,973 | 170,444 | ||||||
| Reconciling item (2) | (2,878 | ) | (2,878 | ) | ||||
| Consolidated | $ | 426,977,211 | $ | 418,782,527 | ||||
(1) Reconciling amounts refer to the unallocated assets or expenses of Green New Jersey.
(2) Reconciling amounts refer to the unallocated assets or expenses of the Parent Company.
NOTE 14 - COMMITMENTS AND CONTINGENCIES
On March 27, 2017, Jinong entered into lease agreement for 1550 mu (approximately 255 acres) paddy field, 1860 mu (approximately 306 acres) cultivated dry field, and approximately 2660 hectares uplands with the local authority at Shiquan County, Shaanxi Province, for a term of 50 years, from April 1, 2017 to March 31, 2066. The leasing fees for every ten-year period are approximately $3,338 per mu for paddy field, $1,451 per mu for cultivated dry field, $4,360 per hectare for uplands. Such ten-year fees become due prior to the beginning of every ten-year period. Jinong had paid half of the first ten-year period’s leasing fee, with an amount of RMB 67.1 million (approximately $9.7 million) by April 1, 2017, and the second half of the ten-year fee will be due by May 15, 2017.
On June 29, 2016, Jinong signed an office lease with Kingtone Information. Pursuant to the lease, Jinong rented 612 square meters (approximately 6,588 square feet) of office space from Kingtone Information. The lease provides for a two-year term effective as of July 1, 2016 with monthly rent of $3,552 (RMB24,480).
In January 2008, Jintai signed a ten-year land lease with Xi’an Jinong Hi-tech Agriculture Demonstration Zone for a monthly rent of $754 (RMB5,200).
In February 2004, Tianjuyuan signed a fifty-year lease with the village committee of Dong Gao Village and Zhen Nan Zhang Dai Village in the Beijing Ping Gu District, at a monthly rent of $429 (RMB2,958).
Accordingly, the Company recorded an aggregate of $42,626 and $16,896 as rent expenses for the nine months ended March 31, 2017 and 2016, respectively.
Lease expenses for the next five twelve month periods ending March 31, are as follows:
| Twelve Months ending March 31, | ||||
| 2018 | $ | 2,004,990 | ||
| 2019 | 2,004,990 | |||
| 2020 | 2,004,990 | |||
| 2021 | 2,004,990 | |||
| 2022 | 2,004,990 | |||
| 20 |
NOTE 15 – BUSINESS COMBINATIONS
On January 1, 2017, the Company, through its wholly-owned subsidiary Jinong, entered into strategic acquisition agreements and also into a series of contractual agreements to qualify as VIEs with the shareholders of two new VIE Companies, Sunwu County Xiangrong Agricultural Materials Co., Ltd., and Anhui Fengnong Seed Co., Ltd. (“Xiangrong and Fengnong”),.
Jinong, the two new VIE Companies, Xiangrong and Fengnong and the shareholders of the two new VIE Companies, Xiangrong and Fengnong, also entered into a series of contractual agreements for the VIE Companies to qualify as VIEs (the “VIE Agreements”). The VIE Agreements are as follows:
Entrusted Management Agreements
Pursuant to the terms of certain Entrusted Management Agreements dated January 1, 2017, between Jinong and the shareholders of the two new VIE Companies (the “Entrusted Management Agreements”), the two new VIE Companies and their shareholders agreed to entrust the operations and management of its business to Jinong. According to the Entrusted Management Agreement, Jinong possesses the full and exclusive right to manage the VIE Companies’ operations, assets and personnel, has the right to control all of the VIE Companies' cash flows through an entrusted bank account, is entitled to the VIE Companies' net profits as a management fee, is obligated to pay all of the VIE Companies’ payables and loan payments, and bears all losses of the VIE Companies. The Entrusted Management Agreements will remain in effect until (i) the parties mutually agree to terminate the agreement; (ii) the dissolution of the VIE Companies; or (iii) Jinong acquires all of the assets or equity of the VIE Companies (as more fully described below under “Exclusive Option Agreements”).
Exclusive Technology Supply Agreements
Pursuant to the terms of certain Exclusive Technology Supply Agreements dated January 1, 2017, between Jinong and the VIE Companies (the “Exclusive Technology Supply Agreements”), Jinong is the exclusive technology provider to the VIE Companies. The VIE Companies agreed to pay Jinong all fees payable for technology supply prior to making any payments under the Entrusted Management Agreement. The Exclusive Technology Supply Agreements shall remain in effect until (i) the parties mutually agree to terminate the agreement; (ii) the dissolution of the VIE Companies; or (iii) Jinong acquires the VIE Companies (as more fully described below under “Exclusive Option Agreements”).
Shareholder’s Voting Proxy Agreements
Pursuant to the terms of certain Shareholder’s Voting Proxy Agreements dated January 1, 2017, among Jinong and the shareholders of the VIE Companies (the “Shareholder’s Voting Proxy Agreements”), the shareholders of the VIE Companies irrevocably appointed Jinong as their proxy to exercise on such shareholders’ behalf all of their voting rights as shareholders pursuant to PRC law and the Articles of Association of the VIE Companies, including the appointment and election of directors of the VIE Companies. Jinong agreed that it shall maintain a board of directors, the composition and appointment of which shall be approved by the Board of the Company. The Shareholder’s Voting Proxy Agreements will remain in effect until Jinong acquires all of the assets or equity of the VIE Companies.
Exclusive Option Agreements
Pursuant to the terms of certain Exclusive Option Agreements dated January 1, 2017, among Jinong, the VIE Companies, and the shareholders of the VIE Companies (the “Exclusive Option Agreements”), the shareholders of the VIE Companies granted Jinong an irrevocable and exclusive purchase option (the “Option”) to acquire the VIE Companies’ equity interests and/or remaining assets, but only to the extent that the acquisition does not violate limitations imposed by PRC law on such transactions. The Option is exercisable at any time at Jinong’s discretion so long as such exercise and subsequent acquisition of the VIE Companies does not violate PRC law. The consideration for the exercise of the Option is to be determined by the parties and memorialized in the future by definitive agreements setting forth the kind and value of such consideration. Jinong may transfer all rights and obligations under the Exclusive Option Agreements to any third parties without the approval of the shareholders of the VIE Companies so long as a written notice is provided. The Exclusive Option Agreements may be terminated by mutual agreements or by 30 days written notice by Jinong.
Equity Pledge Agreements
Pursuant to the terms of certain Equity Pledge Agreements dated January 1, 2017, among Jinong and the shareholders of the VIE Companies (the “Pledge Agreements”), the shareholders of the VIE Companies pledged all of their equity interests in the VIE Companies to Jinong, including the proceeds thereof, to guarantee all of Jinong's rights and benefits under the Entrusted Management Agreements, the Exclusive Technology Supply Agreements, the Shareholder’ Voting Proxy Agreements and the Exclusive Option Agreements. Prior to termination of the Pledge Agreements, the pledged equity interests cannot be transferred without Jinong's prior written consent. The Pledge Agreements may be terminated only upon the written agreement of the parties.
| 21 |
Non-Compete Agreements
Pursuant to the terms of certain Non-Compete Agreements dated January 1, 2017, among Jinong and the shareholders of the VIE Companies (the “Non-Compete Agreements”), the shareholders of the VIE Companies agreed that during the period beginning on the initial date of their services with Jinong, and ending five (5) years after termination of their services with Jinong, without Jinong’s prior written consent, they will not provide services or accept positions including but not limited to partners, directors, shareholders, managers, proxies or consultants, provided by any profit making organizations with businesses that may compete with Jinong. They will not solicit or interfere with any of the Jinong’s customers, or solicit, induce, recruit or encourage any person engaged or employed by Jinong to terminate his or her service or engagement. In the event that the shareholders of the VIE Companies breach the non-compete obligations contained therein, Jinong is entitled to all loss and damages; in the event that the damages are difficult to determine, remedies bore the shareholders of the VIE Companies shall be no less than 50% of the salaries and other expenses Jinong provided in the past.
The Company entered into these VIE Agreements as a way for the Company to have more control over the distribution of its products. The transactions are accounted for as business combinations in accordance with ASC 805. A summary of the purchase price allocations at fair value is below:
| Cash | $ | 1,037,297 | ||
| Accounts receivable | 1,001,521 | |||
| Prepaid expenses and other current assets | 17,716 | |||
| Inventories | 961,936 | |||
| Machinery and equipment | 215,277 | |||
| Intangible assets | 883,689 | |||
| Goodwill | 661,066 | |||
| Accounts payable | (708,724 | ) | ||
| Customer deposits | (435,342 | ) | ||
| Accrued expenses and other payables | (806,697 | ) | ||
| Short-term loan | (160,641 | ) | ||
| Purchase price | $ | 2,667,098 |
A summary of the purchase consideration paid for the VIE Companies is below:
| Cash | $ | 1,160,912 | ||
| Convertible notes | 1,485,800 | |||
| Derivative liability | 20,386 | |||
| $ | 2,667,098 |
The cash component of the purchase price for these acquisitions was paid during March 2017.
NOTE 16 - VARIABLE INTEREST ENTITIES
In accordance with accounting standards regarding consolidation of variable interest entities, VIEs are generally entities that lack sufficient equity to finance their activities without additional financial support from other parties or whose equity holders lack adequate decision making ability. All VIEs with which a company is involved must be evaluated to determine the primary beneficiary of the risks and rewards of the VIE. The primary beneficiary is required to consolidate the VIE for financial reporting purposes.
Green Nevada through one of its subsidiaries, Jinong, entered into a series of agreements (the “VIE Agreements”) with Yuxing for it to qualify as a VIE, effective June 16, 2013.
The Company has concluded, based on the contractual arrangements, that Yuxing is a VIE and that the Company’s wholly-owned subsidiary, Jinong, absorbs a majority of the risk of loss from the activities of Yuxing, thereby enabling the Company, through Jinong, to receive a majority of Yuxing’s expected residual returns.
On June 30, 2016, and January 1, 2017, the Company, through its wholly-owned subsidiary Jinong, entered into strategic acquisition agreements and also into a series of contractual agreements to qualify as VIEs with the shareholders of the VIE Companies.
Jinong, the VIE Companies, and the shareholders of the VIE Companies also entered into a series of contractual agreements for the VIE Companies to qualify as VIEs (the “VIE Agreements”).
| 22 |
As a result of these contractual arrangements with Yuxing and the VIE Companies, the Company is entitled to substantially all of the economic benefits of Yuxing and the VIE Companies. The following financial statement amounts and balances of the VIEs are included in the accompanying consolidated financial statements as of March 31, 2017 and June 30, 2016:
| March 31, | June 30, | ||||||||
| 2017 | 2016 | ||||||||
| ASSETS | |||||||||
| Current Assets | |||||||||
| Cash and cash equivalents | $ | 841,855 | $ | 1,017,841 | |||||
| Accounts receivable, net | 17,821,871 | 7,050,201 | |||||||
| Inventories | 25,470,980 | 26,370,202 | |||||||
| Other current assets | 1,635,899 | 1,875,912 | |||||||
| Advances to suppliers | 1,566,273 | 4,900,524 | |||||||
| Total Current Assets | 47,336,878 | 41,214,680 | |||||||
| Plant, Property and Equipment, Net | 12,361,600 | 13,377,817 | |||||||
| Other assets | 217,819 | 334,264 | |||||||
| Intangible Assets, Net | 12,777,313 | 12,913,776 | |||||||
| Goodwill | 3,706,222 | 3,158,179 | |||||||
| Total Assets | $ | 76,399,832 | $ | 70,998,716 | |||||
| LIABILITIES AND STOCKHOLDERS' EQUITY | |||||||||
| Current Liabilities | |||||||||
| Accounts payable | $ | 9,839,580 | $ | 3,840,052 | |||||
| Customer deposits | 2,186,165 | 3,486,150 | |||||||
| Accrued expenses and other payables | 2,947,891 | 5,580,642 | |||||||
| Amount due to related parties | 40,636,386 | 43,478,158 | |||||||
| Short-term Loan | 160,641 | - | |||||||
| Total Current Liabilities | 55,770,663 | 56,385,002 | |||||||
| Long-term Liabilities | |||||||||
| Long-term Loan | 3,428 | - | |||||||
| Stockholders' equity | 20,625,741 | 14,613,714 | |||||||
| Total Liabilities and Stockholders' Equity | $ | 76,399,832 | $ | 70,998,716 | |||||
| Three months ended March 31, | Nine months ended March 31, | |||||||||||||||
| 2017 | 2016 | 2017 | 2016 | |||||||||||||
| Revenue | $ | 24,130,308 | $ | 3,274,177 | $ | 49,630,476 | $ | 6,599,577 | ||||||||
| Expenses | 22,740,434 | 2,725,619 | 45,707,439 | 5,131,634 | ||||||||||||
| Net income (loss) | $ | 1,389,874 | $ | 548,558 | $ | 3,923,037 | $ | 1,467,943 | ||||||||
| 23 |
Item 2. Management’s Discussion and Analysis of Financial Condition and Results of Operations
The following discussion and analysis of our financial condition and results of operations should be read in conjunction with our consolidated financial statements and the notes to those financial statements appearing elsewhere in this report. This discussion and analysis contains forward-looking statements that involve significant risks and uncertainties. As a result of many factors, such as the slow-down of the macro-economic environment in China and its impact on economic growth in general, the competition in the fertilizer industry and the impact of such competition on pricing, revenues and margins, the weather conditions in the areas where our customers are based, the cost of attracting and retaining highly skilled personnel, the prospects for future acquisitions, and the factors set forth elsewhere in this report, our actual results may differ materially from those anticipated in these forward-looking statements. In light of these risks and uncertainties, there can be no assurance that the forward-looking statements contained in this report will in fact occur. You should not place undue reliance on the forward-looking statements contained in this report.
The forward-looking statements speak only as of the date on which they are made, and, except to the extent required by U.S. federal securities laws, we undertake no obligation to update any forward-looking statement to reflect events or circumstances after the date on which the statement is made or to reflect the occurrence of unanticipated events. Further, the information about our intentions contained in this report is a statement of our intention as of the date of this report and is based upon, among other things, the existing regulatory environment, industry conditions, market conditions and prices, and our assumptions as of such date. We may change our intentions, at any time and without notice, based upon any changes in such factors, in our assumptions or otherwise.
Unless the context indicates otherwise, as used in the notes to the financial statements of the Company, the following are the references herein of all the subsidiaries of the Company (i) Green Agriculture Holding Corporation (“Green New Jersey”), a wholly-owned subsidiary of Green Nevada, incorporated in the State of New Jersey; (ii) Shaanxi TechTeam Jinong Humic Acid Product Co., Ltd. (“Jinong”), a wholly-owned subsidiary of Green New Jersey organized under the laws of the People’s Republic of China (the “PRC”); (iii) Xi’an Hu County Yuxing Agriculture Technology Development Co., Ltd. (“Yuxing”), a Variable Interest Entity (“VIE”) in the PRC controlled by Jinong through a series of contractual agreements; (iv) Beijing Gufeng Chemical Products Co., Ltd., a wholly-owned subsidiary of Jinong in the PRC (“Gufeng”), (v) Beijing Tianjuyuan Fertilizer Co., Ltd., Gufeng’s wholly-owned subsidiary in the PRC (“Tianjuyuan”), Shaanxi Lishijie Agrochemical Co., Ltd.(“Lishijie”), a VIE in the PRC controlled by Jinong, Songyuan Jinyangguang Sannong Service Co., Ltd., (“Jinyangguang”), a VIE in the PRC controlled by Jinong, Shenqiu County Zhenbai Agriculture Co., Ltd. (“Zhenbai”), a VIE in the PRC controlled by Jinong, Weinan City Linwei District Wangtian Agricultural Materials Co., Ltd. (“Wangtian”), a VIE in the PRC controlled by Jinong, Aksu Xindeguo Agricultural Materials Co., Ltd. (“Xindeguo”), a VIE in the PRC controlled by Jinong, Xinjiang Xinyulei Eco-agriculture Science and Technology co., Ltd. (“Xinyulei”), a VIE in the PRC controlled by Jinong. Sunwu County Xiangrong Agricultural Materials Co., Ltd. (“Xiangrong”). Anhui Fengnong Seed Co., Ltd. (“Fengnong”). Yuxing, Lishijie, Jinyangguang, Zhenbai, Wangtian, Xindeguo, Xinyulei, Xiangrong and Fengnong may also collectively be referred to as the “the VIE Companies”
Unless the context otherwise requires, all references to (i) “PRC” and “China” are to the People’s Republic of China; (ii) “U.S. dollar,” “$” and “US$” are to United States dollars; and (iii) “RMB”, “Yuan” and Renminbi are to the currency of the PRC or China.
Overview
We are engaged in the research, development, production and sale of various types of fertilizers and agricultural products in the PRC through our wholly-owned Chinese subsidiaries, Jinong and Gufeng (including Gufeng’s subsidiary Tianjuyuan), and our VIE, Yuxing. Our primary business is fertilizer products, specifically humic-acid based compound fertilizer produced by Jinong and compound fertilizer, blended fertilizer, organic compound fertilizer, slow-release fertilizer, highly-concentrated water-soluble fertilizer and mixed organic-inorganic compound fertilizer produced by Gufeng. In addition, through Yuxing, we develop and produce various agricultural products, such as top-grade fruits, vegetables, flowers and colored seedlings. For financial reporting purposes, our operations are organized into three business segments: fertilizer products (Jinong), fertilizer products (Gufeng) and agricultural products (Yuxing).
| 24 |
The fertilizer business conducted by Jinong and Gufeng generated approximately 78.9% and 97.0% of our total revenues for the nine months ended March 31, 2017 and 2016, respectively. Yuxing serves as a research and development base for our fertilizer products.
Fertilizer Products
As of March 31, 2017, we had developed and produced a total of 668 different fertilizer products in use, of which 132 were developed and produced by Jinong and 332 by Gufeng, and 251 by the VIE companies.
Below is a table that shows the metric tons of fertilizer sold by Jinong and Gufeng and the revenue per ton for the periods indicated:
| Three Months Ended March 31, | Change from 2016 to 2017 | |||||||||||||||
| 2017 | 2016 | Amount | % | |||||||||||||
| (metric tons) | ||||||||||||||||
| Jinong | 14,455 | 8,932 | 5,523 | 61.8 | % | |||||||||||
| Gufeng | 90,235 | 121,668 | (31,433 | ) | (25.8 | )% | ||||||||||
| 104,690 | 130,600 | (25,910 | ) | (19.8 | )% | |||||||||||
| Three Months Ended March 31, | ||||||||
| 2017 | 2016 | |||||||
| (revenue per ton) | ||||||||
| Jinong | $ | 1,821 | $ | 3,538 | ||||
| Gufeng | 342 | 360 | ||||||
| Nine months Ended March 31, | Change from 2016 to 2017 | |||||||||||||||
| 2017 | 2016 | Amount | % | |||||||||||||
| (metric tons) | ||||||||||||||||
| Jinong | 39,740 | 28,535 | 11,205 | 39.3 | % | |||||||||||
| Gufeng | 198,933 | 230,065 | (19,642 | ) | (11.0 | )% | ||||||||||
| 238,673 | 258,600 | (19,927 | ) | (7.7 | )% | |||||||||||
| Nine months Ended March 31, | ||||||||
| 2017 | 2016 | |||||||
| (revenue per ton) | ||||||||
| Jinong | $ | 2,128 | $ | 3,420 | ||||
| Gufeng | 340 | 372 | ||||||
For the three months ended March 31, 2017, we sold approximately 104,690 metric tons of fertilizer products, as compared to 130,600 metric tons for the three months ended March 31, 2016. For the three months ended March 31, 2017, Jinong sold approximately 14,455 metric tons of fertilizer products, an increase of 5,523 metric tons, or 61.8%, as compared to 8,932 metric tons for the three months ended March 31, 2016. For the three months ended March 31, 2017, Gufeng sold approximately 90,235 metric tons of fertilizer products, as compared to 121,668 metric tons for the three months ended March 31, 2016.
| 25 |
For the nine months ended March 31, 2017, we sold approximately 238,673 metric tons of fertilizer products, as compared to 258,600 metric tons for the nine months ended March 31, 2016. For the nine months ended March 31, 2017, Jinong sold approximately 39,740 metric tons of fertilizer products, an increase of 11,205 metric tons, or 39.3%, as compared to 28,535 metric tons for the nine months ended March 31, 2016. For the nine months ended March 31, 2017, Gufeng sold approximately 198,933 metric tons of fertilizer products, as compared to 230,065 metric tons for the nine months ended March 31, 2016.
Our sales of fertilizer products to customers in five provinces accounted for approximately 60.4% of our fertilizer revenue for the three months ended March 31, 2017. Specifically, the provinces and their respective percentage contributed to our fertilizer revenues were: Hebei (24.3%), Heilongjiang (10.6%), Liaoning (9.6%), Inner Mongolia (8.7%), and Shaanxi (7.25%).
As of March 31, 2017, we had a total of 1,921 distributors covering 27 provinces, four autonomous regions and three central government-controlled municipalities in China. Jinong had 1,090 distributors in China. Jinong’s sales are not dependent on any single distributor or any group of distributors. Jinong’s top five distributors accounted for 3.6% of its fertilizer revenues for the three months ended March 31, 2017. Gufeng had 307 distributors, including some large state-owned enterprises. Gufeng’s top five distributors accounted for 72.5% of its revenues for the three months ended March 31, 2017.
Agricultural Products
Through Yuxing, we develop, produce and sell high-quality flowers, green vegetables and fruits to local marketplaces and various horticulture and planting companies. We also use certain of Yuxing’s greenhouse facilities to conduct research and development activities for our fertilizer products. The three PRC provinces that accounted for 83.2% of our agricultural products revenue for the three months ended March 31, 2017 were Shaanxi (71.7%), Sichuan (7.7%), and Gansu (3.9%).
Recent Developments
New products and distributors
During the three months ended March 31, 2017, Jinong did not launch any new fertilizer products. However, Jinong added four new distributors during this period. Gufeng did not launch any new fertilizer products, but added two new distributors.
Strategic Acquisitions
As previously reported, on January 1, 2017, through Jinong, as authorized by our board of directors and Jinong, we entered into (i) Strategic Acquisition Agreements (the “SAA”), and (ii) Agreements for Convertible Notes (the “ACN”), with the shareholders of the companies as listed below (the “Targets”). The transaction represented by the SAA, ACN and the VIE Agreements as defined below are collectively referred to as the “Strategic Acquisitions.”
| Company Name | Business Scope | Cash Payment for Acquisition (RMB[1]) | Principal of Notes for Acquisition (RMB) | |||||||
| Sunwu County Xiangrong Agricultural Materials Co., Ltd. | Sales of pesticides, agricultural chemicals, chemical fertilizers, agricultural materials; Manufacture and sales of mulches. | 4,000,000 | 6,000,000 | |||||||
| Anhui Fengnong Seed Co., Ltd. | Wholesale and retail sales of pesticides; Sales of chemical fertilizers, packaged seeds, agricultural mulches, micronutrient fertilizers, compound fertilizers and plant growth regulators | 4,000,000 | 6,000,000 | |||||||
| Total | 8,000,000 | 12,000,000 | ||||||||
| [1] |
RMB: Abbreviation for renminbi, the official currency of the People’s Republic of China where Jinong and the Targets operate. The exchange rate between RMB and U.S. dollars on January 1, 2017 is RMB1=US$0.144, according to the exchange rate published by Bank of China. |
Pursuant to the SAA and the ACN, the shareholders of the Targets, while be in possession of the equity interests and will continue to be the legal owners of such interests, agreed to pledge and entrust all of their equity interests, including the proceeds thereof but excluding any claims or encumbrances, and the operations and management of its business to Jinong, in exchange of an aggregated amount of RMB8,000,000 (approximately $1,152,000) to be paid by Jinong within three days following the execution of the SAA, ACN and the VIE Agreements, and convertible notes with an aggregated face value of RMB12,000,000 (approximately $1,728,000) with an annual fixed compound interest rate of 3% and term of three years. Jinong had made the payments above and issued the convertible notes correspondingly.
| 26 |
Business development
Results of Operations
Three Months ended March 31, 2017 Compared to the Three Months ended March 31, 2016.
| Three Months Ended March 31, | ||||||||||||||||
| 2017 | 2016 | Change$ | Change% | |||||||||||||
| Sales | ||||||||||||||||
| Jinong | 26,316,821 | 31,602,239 | (5,285,418 | ) | -16.7 | % | ||||||||||
| Gufeng | 30,858,499 | 43,762,058 | (12,903,559 | ) | -29.5 | % | ||||||||||
| Yuxing | 2,781,003 | 3,274,177 | (493,174 | ) | -15.1 | % | ||||||||||
| VIEs | 21,349,305 | - | 21,349,305 | |||||||||||||
| Net sales | 81,305,628 | 78,638,474 | 2,667,154 | 3.4 | % | |||||||||||
| Cost of goods sold | ||||||||||||||||
| Jinong | 12,143,167 | 13,353,222 | (1,210,055 | ) | -9.1 | % | ||||||||||
| Gufeng | 26,319,435 | 38,109,311 | (11,789,876 | ) | -30.9 | % | ||||||||||
| Yuxing | 2,230,319 | 2,441,652 | (211,333 | ) | -8.7 | % | ||||||||||
| VIEs | 19,260,074 | - | 19,260,074 | |||||||||||||
| Cost of goods sold | 59,952,995 | 53,904,185 | 6,048,810 | 11.2 | % | |||||||||||
| Gross profit | 21,352,633 | 24,734,289 | (3,381,656 | ) | -13.7 | % | ||||||||||
| Operating expenses | ||||||||||||||||
| Selling expenses | 6,130,825 | 3,441,511 | 2,689,314 | 78.1 | % | |||||||||||
| Selling expenses - amortization of deferred asset | 1,556,031 | 8,780,893 | (7,224,862 | ) | -82.3 | % | ||||||||||
| General and administrative expenses | 3,971,890 | 2,204,771 | 1,767,119 | 80.1 | % | |||||||||||
| Total operating expenses | 11,658,746 | 14,427,175 | (2,768,429 | ) | -19.2 | % | ||||||||||
| Income from operations | 9,693,887 | 10,307,114 | (613,227 | ) | -5.9 | % | ||||||||||
| Other income (expense) | ||||||||||||||||
| Other income (expense) | 330,538 | (2,473 | ) | 333,011 | -13465.9 | % | ||||||||||
| Interest income | 79,280 | 263,768 | (184,488 | ) | -69.9 | % | ||||||||||
| Interest expense | (232,639 | ) | (211,734 | ) | (20,905 | ) | 9.9 | % | ||||||||
| Total other income (expense) | 177,179 | 49,561 | 127,618 | 257.5 | % | |||||||||||
| Income before income taxes | 9,871,066 | 10,356,675 | (485,609 | ) | -4.7 | % | ||||||||||
| Provision for income taxes | 1,679,391 | 2,104,904 | (425,513 | ) | -20.2 | % | ||||||||||
| Net income | 8,191,675 | 8,251,771 | (60,096 | ) | -0.7 | % | ||||||||||
| Other comprehensive income (loss) | ||||||||||||||||
| Foreign currency translation gain (loss) | (2,801,325 | ) | 2,722,073 | (5,523,398 | ) | -203 | % | |||||||||
| Comprehensive income (loss) | 5,390,350 | 10,973,844 | (5,583,494 | ) | -50.9 | % | ||||||||||
| Basic weighted average shares outstanding | 38,532,033 | 36,962,166 | 1,569,867 | 4.2 | % | |||||||||||
| Basic net earnings per share | 0.21 | 0.22 | (0.01 | ) | -4.7 | % | ||||||||||
| Diluted weighted average shares outstanding | 38,532,033 | 36,962,166 | 1,569,867 | 4.2 | % | |||||||||||
| Diluted net earnings per share | 0.21 | 0.22 | (0.01 | ) | -4.7 | % | ||||||||||
Net Sales
Total net sales for the three months ended March 31, 2017 were $81,305,628, an increase of $2,667,154, or 3.4%, from $78,638,474 for the three months ended March 31, 2016.
This increase was largely due to the inclusion of VIEs’ net sales during the three months ended March 31, 2017, which contributed approximately $21.3 million, or 26.3%, of the total net sales. The total net sales without including VIEs’ net sales for the three months ended March 31, 2017 were $59,956,323, a decrease of $18,682,151, or 23.8%, from the same period a year ago.
| 27 |
For the three months ended March 31, 2017, Jinong’s net sales decreased by $5,285,418, or 16.7%, to $26,316,821 from $31,602,239 for the three months ended March 31, 2016. This decrease was mainly attributable to the decrease in Jinong’s sales volume, which was result of Jinong’s implementation of its sales strategy that rebalances the production of fertilizer types during the last three months.
For the three months ended March 31, 2017, Gufeng’s net sales were $30,858,499, a decrease of $12,903,559 or 29.5% from $43,762,058 for the three months ended March 31, 2016. This decrease was mainly attributable to Gufeng’s lowering selling prices and volumes to answer market demand during the three months ended March 31, 2017.
For the three months ended March 31, 2017, Yuxing’s net sales were $2,781,003, a decrease of $493,174 or 15.1%, from $3,274,177 during the three months ended March 31, 2016. The decrease was mainly attributable to the decrease in market demand and the lower prices on Yuxing’s top-grade flowers.
Cost of Goods Sold
Total cost of goods sold for the three months ended March 31, 2017 was $59,952,995, an increase of $6,048,810, or 11.2%, from $53,904,185 for the three months ended March 31, 2016. The increase was mainly due to the production and sale of VIEs’ products, which accounted for $19,260,074, or 32.1% of total cost of goods sold. The total cost of goods sold without including VIEs’ cost of goods sold for the three months ended March 31, 2017 was $40,692,921, a decrease of $13,211,264, or 24.5%, from the same period a year ago.
Cost of goods sold by Jinong for the three months ended March 31, 2017 was $12,143,167, a decrease of $1,210,055, or 9.1%, from $13,353,222 for the three months ended March 31, 2016. The decrease in cost of goods sold was primarily attributable to the decreased in net sales during the last three months.
Cost of goods sold by Gufeng for the three months ended March 31, 2017 was $26,319,435, a decrease of $11,789,876, or 30.9%, from $38,109,311 for the three months ended March 31, 2016. This decrease was primarily attributable to the less products sold during the last three months.
For the three months ended March 31, 2017, cost of goods sold by Yuxing was $2,230,319, a decrease of $211,333, or 8.7%, from $2,441,652 for the three months ended March 31, 2016. This decrease was mainly due to the decrease in Yuxing’s net sales during the last three months.
Gross Profit
Total gross profit for the three months ended March 31, 2017 decreased by $3,381,656 to $21,352,633, as compared to $24,734,289 for the three months ended March 31, 2016. Gross profit margin was 26.3% and 31.5% for the three months ended March 31, 2017 and 2016, respectively. The decrease in gross profit margin was mainly due to the Jinong, Gufeng and Yuxing’s decreased gross margins for the three months ended March 31, 2017, compared to the same period last year.
Gross profit generated by Jinong decreased by $4,075,363, or 22.3%, to $14,173,654 for the three months ended March 31, 2017 from $18,249,017 for the three months ended March 31, 2016. Gross profit margin from Jinong’s sales was approximately 53.9% and 57.7% for the three months ended March 31, 2017 and 2016, respectively. The decrease in gross profit margin was mainly due to the higher raw material cost and packaging cost.
For the three months ended March 31, 2017, gross profit generated by Gufeng was $4,539,064, a decrease of $1,113,683, or 19.7%, from $5,652,747 for the three months ended March 31, 2016. Gross profit margin from Gufeng’s sales was approximately 14.7% and 12.9% for the three months ended March 31, 2017 and 2016, respectively. The decrease in gross profit percentage was mainly due to the increased weight for lower-margin products sales in Gufeng’s total sales answering to market demand.
For the three months ended March 31, 2017, gross profit generated by Yuxing was $550,684, a decrease of $281,841, or 33.9% from $832,525 for the three months ended March 31, 2016. The gross profit margin was approximately 19.8% and 25.4% for the three months ended March 31, 2017 and 2016, respectively. The decrease in gross profit margin was mainly due to the higher labor cost during the three months ended March 31, 2017.
Gross profits generated by VIEs were $2,089,231 with a gross profit margin of approximately 9.8% for the three months ended March 31, 2017.
| 28 |
Selling Expenses
Our selling expenses consisted primarily of salaries of sales personnel, advertising and promotion expenses, freight-out costs and related compensation. Selling expenses were $6,130,825, or 7.5%, of net sales for the three months ended March 31, 2017, as compared to $3,441,511, or 4.4%, of net sales for the three months ended March 31, 2016, an increase of $2,689,314, or 78.1%. The selling expenses of VIEs were $912,957, or 1.8%, of VIEs’ net sales. The selling expenses of Yuxing were $10,690, or 0.4%, of Yuxing’s net sales for the three months ended March 31, 2017, as compared to $47,110, or 1.4%, of Yuxing’s net sales for the three months ended March 31, 2016. The selling expenses of Gufeng were $80,781, or 0.3%, of Gufeng’s net sales for the three months ended March 31, 2017, as compared to $186,626, or 0.4%, of Gufeng’s net sales for the three months ended March 31, 2016. The selling expenses of Jinong for the three months ended March 31, 2017 were $16,894,249, or 64.2%, of Jinong’s net sales, as compared to selling expenses of $3,207,775, or 10.2%, of Jinong’s net sales for the three months ended March 31, 2016.
Selling Expenses – amortization of deferred assets
Our selling expenses - amortization of our deferred assets were $1,556,031, or 1.9%, of net sales for the three months ended March 31, 2017, as compared to $8,780,893 or 11.2%, of net sales for the three months ended March 31, 2016, a decrease of $7,224,862, or 82%. This decrease was due to the fact that some of the deferred assets were fully amortized and therefore no amortization was recorded on the fully amortized assets during the three months ended March 31, 2017.
General and Administrative Expenses
General and administrative expenses consisted primarily of related salaries, rental expenses, business development, depreciation and travel expenses incurred by our general and administrative departments and legal and professional expenses including expenses incurred and accrued for certain litigation. General and administrative expenses were $3,971,890, or 4.9%, of net sales for the three months ended March 31, 2017, as compared to $2,204,771, or 2.8%, of net sales for the three months ended March 31, 2016, an increase of $1,767,119, or 80%. The increase in general and administrative expenses was mainly due to VIEs, which had $657,652 of general and administrative expenses during the last three months.
Total Other Income
Total other income consisted of income from subsidies received from the PRC government, interest income, interest expenses and bank charges. The total other income for the three months ended March 31, 2017 was $177,179, as compared to $49,561 for the three months ended March 31, 2016, an increase of $127,618, or 257.5%. The increase in total other income partly resulted from large increase of non-operating income during the three months ended March 31, 2017.
Income Taxes
Jinong is subject to a preferred tax rate of 15% as a result of its business being classified as a High-Tech project under the PRC Enterprise Income Tax Law (“EIT”) that became effective on January 1, 2008. Jinong incurred income tax expenses of $935,038 for the three months ended March 31, 2017, as compared to $896,220 for the three months ended March 31, 2016, an increase of $38,818, or 4.3%.
Gufeng, subject to a tax rate of 25%, incurred income tax expenses of $615,713 for the three months ended March 31, 2017, as compared to $1,208,685 for the three months ended March 31, 2016, a decrease of $592,972, or 49.1%.
Yuxing has no income tax for the three months ended March 31, 2017 as a result of being exempted from paying income tax due to the fact its products fall into the tax exemption list set out in the EIT.
| 29 |
Net Income
Net income for the three months ended March 31, 2017 was $8,191,675, a decrease of $60,096, or 0.7%, compared to $8,251,771 for the three months ended March 31, 2016. Net income as a percentage of total net sales was approximately 10.1% and 10.5% for the three months ended March 31, 2017 and 2016, respectively.
Nine months ended March 31, 2017 Compared to the Nine months ended March 31, 2016.
| Nine Months Ended March 31, | ||||||||||||||||
| 2017 | 2016 | Change$ | Change% | |||||||||||||
| Sales | ||||||||||||||||
| Jinong | $ | 84,570,215 | 97,612,604 | (13,042,389 | ) | -13.4 | % | |||||||||
| Gufeng | 67,734,572 | 85,576,564 | (17,841,992 | ) | -20.8 | % | ||||||||||
| Yuxing | 6,590,728 | 6,599,577 | (8,849 | ) | -0.1 | % | ||||||||||
| VIEs | 43,039,748 | - | 43,039,748 | |||||||||||||
| Net sales | 201,935,263 | 189,788,745 | 12,146,518 | 6.4 | % | |||||||||||
| Cost of goods sold | ||||||||||||||||
| Jinong | 37,744,757 | 41,328,293 | (3,583,536 | ) | -8.7 | % | ||||||||||
| Gufeng | 57,843,171 | 72,567,833 | (14,724,662 | ) | -20.3 | % | ||||||||||
| Yuxing | 5,209,973 | 4,334,600 | 875,373 | 20.2 | % | |||||||||||
| VIEs | 37,173,460 | - | 37,173,460 | |||||||||||||
| Cost of goods sold | 137,971,361 | 118,230,726 | 19,740,635 | 16.7 | % | |||||||||||
| Gross profit | 63,963,902 | 71,558,019 | (7,594,117 | ) | -10.6 | % | ||||||||||
| Operating expenses | ||||||||||||||||
| Selling expenses | 15,108,275 | 11,070,369 | 4,037,906 | 36.5 | % | |||||||||||
| Selling expenses - amortization of deferred asset | 11,140,251 | 27,158,360 | (16,018,109 | ) | -59.0 | % | ||||||||||
| General and administrative expenses | 11,837,282 | 7,864,395 | 3,972,887 | 50.5 | % | |||||||||||
| Total operating expenses | 38,085,808 | 46,093,124 | (8,007,316 | ) | -17.4 | % | ||||||||||
| Income from operations | 25,878,094 | 25,464,895 | 413,199 | 1.6 | % | |||||||||||
| Other income (expense) | ||||||||||||||||
| Other income (expense) | 175,366 | (6,307 | ) | 181,673 | -2880.5 | % | ||||||||||
| Interest income | 232,396 | 416,700 | (184,304 | ) | -44.2 | % | ||||||||||
| Interest expense | (464,430 | ) | (943,413 | ) | 478,983 | -50.8 | % | |||||||||
| Total other income (expense) | (56,668 | ) | (533,020 | ) | 476,352 | -89.4 | % | |||||||||
| Income before income taxes | 25,821,426 | 24,931,875 | 889,551 | 3.6 | % | |||||||||||
| Provision for income taxes | 4,772,160 | 5,166,897 | (394,737 | ) | -7.6 | % | ||||||||||
| Net income | 21,049,266 | 19,764,978 | 1,284,288 | 6.5 | % | |||||||||||
| Other comprehensive income (loss) | ||||||||||||||||
| Foreign currency translation gain (loss) | (19,248,388 | ) | (20,006,295 | ) | 757,907 | -3.8 | % | |||||||||
| Comprehensive income (loss) | $ | 1,800,878 | (241,317 | ) | 2,042,195 | -846.3 | % | |||||||||
| Basic weighted average shares outstanding | 37,941,957 | 36,610,131 | 1,331,826 | 3.6 | % | |||||||||||
| Basic net earnings per share | $ | 0.55 | 0.54 | 0.01 | 1.9 | % | ||||||||||
| Diluted weighted average shares outstanding | 37,941,957 | 36,610,131 | 1,331,826 | 3.6 | % | |||||||||||
| Diluted net earnings per share | 0.55 | 0.54 | 0.01 | 1.9 | % | |||||||||||
Net Sales
Total net sales for the nine months ended March 31, 2017 were $201,935,263, an increase of $12,146,518, or 6.4%, from $189,788,745 for the nine months ended March 31, 2016.
This increase was largely due to the inclusion of VIEs’ net sales during the nine months ended March 31, 2017, which contributed approximately $43 million, or 21.3%, of the total net sales. The total net sales without including VIEs’ net sales for the nine months ended March 31, 2017 were $158,895,515, a decrease of $30,893,230, or 16.3%, from the same period a year ago.
| 30 |
For the nine months ended March 31, 2017, Jinong’s net sales decreased of $13,042,389, or 13.4%, to $84,570,215 from $97,612,604 for the nine months ended March 31, 2016. This decrease was mainly attributable to the decrease in Jinong’s sales volume, which was result of Jinong’s implementation of its sales strategy that rebalances the production of fertilizer types during the last nine months.
For the nine months ended March 31, 2017, Gufeng’s net sales were $67,734,572, a decrease of $17,841,992, or 20.8%, from $85,576,564 for the nine months ended March 31, 2016. This decrease was mainly attributable to Gufeng’s lowering selling prices and volumes to answer market demand during the nine months ended March 31, 2017.
For the nine months ended March 31, 2017, Yuxing’s net sales were $6,590,728, a slight decrease of $8,849, or 0.1%, from $6,599,577 during the nine months ended March 31, 2016.
Cost of Goods Sold
Total cost of goods sold for the nine months ended March 31, 2017 was $137,971,361, an increase of $19,740,635, or 16.7%, from $118,230,726 for the nine months ended March 31, 2016. This increase was mainly due to the production and sale of VIEs’ products, which accounted for $37,173,460, or 26.9%, of total cost of goods sold. The total cost of goods sold without including VIEs’ cost of goods sold for the three months ended March 31, 2017 was $100,797,901, a decrease of $17,432,825, or 14.7%, from the same period a year ago.
Cost of goods sold by Jinong for the nine months ended March 31, 2017 was $37,744,757, a decrease of $3,583,536, or 8.7%, from $41,328,293 for the nine months ended March 31, 2016. The decrease was primarily attributable to its lower net sales.
Cost of goods sold by Gufeng for the nine months ended March 31, 2017 was $57,843,171, a decrease of $14,724,662, or 20.3%, from $72,567,833 for the nine months ended March 31, 2016. This decrease was primarily attributable to the less products sold during the last nine months.
For the nine months ended March 31, 2017, cost of goods sold by Yuxing was $5,209,973, an increase of $875,373, or 20.2%, from $4,334,600 for the nine months ended March 31, 2016. This increase was mainly due to the increase in Yuxing’s net sales and the higher labor costs.
Gross Profit
Total gross profit for the nine months ended March 31, 2017 decreased by $7,594,117 to $63,963,902, as compared to $71,558,019 for the nine months ended March 31, 2016. Gross profit margin was 31.7% and 37.7% for the nine months ended March 31, 2017 and 2016, respectively.
Gross profit generated by Jinong decreased by $9,458,853, or 16.8%, to $46,825,458 for the nine months ended March 31, 2017 from $56,284,311 for the nine months ended March 31, 2016. Gross profit margin from Jinong’s sales was approximately 55.4% and 57.7% for the nine months ended March 31, 2017 and 2016, respectively. The decrease in gross profit margin was mainly due to higher raw material cost and higher packaging cost.
For the nine months ended March 31, 2017, gross profit generated by Gufeng was $9,891,401, a decrease of $3,117,330, or 24%, from $13,008,731 for the nine months ended March 31, 2016. Gross profit margin from Gufeng’s sales was approximately 14.6% and 15.2% for the nine months ended March 31, 2017 and 2016, respectively. The decrease in gross profit percentage was mainly due to the increased weight for lower-margin products sales in Gufeng’s total sales answering to market demand.
For the nine months ended March 31, 2017, gross profit generated by Yuxing was $1,380,755, a decrease of $884,222, or 39% from $2,264,977 for the nine months ended March 31, 2016. The gross profit margin was approximately 20.9% and 34.3% for the nine months ended March 31, 2017 and 2016, respectively. The decrease in gross profit margin was mainly due to the higher labor cost during the nine months ended March 31, 2017.
Gross profit generated by VIEs were $5,866,288 with a gross profit margin of approximately 13.6% for the nine months ended March 31, 2017.
| 31 |
Selling Expenses
Our selling expenses consisted primarily of salaries of sales personnel, advertising and promotion expenses, freight-out costs and related compensation. Selling expenses were $15,108,275, or 7.5%, of net sales for the nine months ended March 31, 2017, as compared to $11,070,369 or 5.8% of net sales for the nine months ended March 31, 2016, an increase of $4,037,906, or 36.5%. This increase was primarily due to Jinong, and the inclusion of VIEs’ selling expenses for the nine months ended March 31, 2017. The selling expenses of VIEs were $912,957, or 1.8%, of VIEs’ net sales. The selling expenses of Yuxing were $29,665 or 0.5% of Yuxing’s net sales for the nine months ended March 31, 2017, as compared to $190,281, or 2.9% of Yuxing’s net sales for the nine months ended March 31, 2016.The selling expenses of Gufeng were $294,189 or 0.4% of Gufeng’s net sales for the nine months ended March 31, 2017, as compared to $450,283, or 0.5% of Gufeng’s net sales for the nine months ended March 31, 2016. The selling expenses of Jinong for the nine months ended March 31, 2017 were $25,037,160 or 29.6% of Jinong’s net sales, as compared to selling expenses of $10,429,805, or 10.7% of Jinong’s net sales for the nine months ended March 31, 2016. The increase in Jinong’s selling expenses was due to Jinong’s expanded marketing efforts and the increase in shipping costs.
Selling Expenses – amortization of deferred assets
Our selling expenses - amortization of our deferred assets were $11,140,251, or 5.5%, of net sales for the nine months ended March 31, 2017, as compared to $27,158,360, or 14.3%, of net sales for the nine months ended March 31, 2016, a decrease of $16,018,109, or 59%. This decrease was due to the fact that some of the deferred assets were fully amortized and therefore no amortization was recorded on the fully amortized assets during the nine months ended March 31, 2017.
General and Administrative Expenses
General and administrative expenses consisted primarily of related salaries, rental expenses, business development, depreciation and travel expenses incurred by our general and administrative departments and legal and professional expenses including expenses incurred and accrued for certain litigation. General and administrative expenses were $11,837,282, or 5.9% of net sales for the nine months ended March 31, 2017, as compared to $7,864,395, or 4.1%, of net sales for the nine months ended March 31, 2016, an increase of $3,972,887, or 50.5%. The increase in general and administrative expenses was mainly due to VIEs, which had $1,917,762 general and administrative expenses during the last nine months.
Total Other Expenses
Total other expenses consisted of income from subsidies received from the PRC government, interest income, interest expenses and bank charges. The total other expense for the nine months ended March 31, 2017 was $56,668, as compared to $533,020 for the nine months ended March 31, 2016, a decrease of $476,352, or 89.4%.
| 32 |
Income Taxes
Jinong is subject to a preferred tax rate of 15% as a result of its business being classified as a High-Tech project under the PRC Enterprise Income Tax Law (“EIT”) that became effective on January 1, 2008. Jinong incurred income tax expenses of $2,814,503 for the nine months ended March 31, 2017, as compared to $2,701,887 for the nine months ended March 31, 2016, an increase of $112,616, or 4.2%.
Gufeng, subject to a tax rate of 25%, incurred income tax expenses of $1,408,216 for the nine months ended March 31, 2017, as compared to $2,465,010 for the nine months ended March 31, 2016, a decrease of $1,056,794, or 42.9%.
Yuxing has no income tax for the nine months ended March 31, 2017 as a result of being exempted from paying income tax due to its products fall into the tax exemption list set out in the EIT.
Net Income
Net income for the nine months ended March 31, 2017 was $21,049,266, an increase of $1,284,288, or 6.5%, compared to $19,764,978 for the nine months ended March 31, 2016. Net income as a percentage of total net sales was approximately 10.4% and 10.4 % for the nine months ended March 31, 2017 and 2016, respectively.
Discussion of Segment Profitability Measures
As of March 31, 2017, we were engaged in the following businesses: the production and sale of fertilizers through Jinong and Gufeng and the production and sale of high-quality agricultural products by Yuxing. For financial reporting purpose, our operations were organized into three main business segments based on locations and products: Jinong (fertilizer production), Gufeng (fertilizer production) and Yuxing (agricultural products production). Each of the segments has its own annual budget with regard to development, production and sales.
Each of the three operating segments referenced above has separate and distinct general ledgers. The chief operating decision maker (“CODM”) makes decisions with respect to resources allocation and performance assessment upon receiving financial information, including revenue, gross margin, operating income and net income produced from the various general ledger systems; however, net income by segment is the principal benchmark to measure profit or loss adopted by the CODM.
For Jinong, the net income increased by $25,281 or 0.2% to $15,048,662 for the nine months ended March 31, 2017 from $15,023,381 for the nine months ended March 31, 2016.
For Gufeng, the net income decreased by $3,101,988 or 41.7% to $4,145,555 for the nine months ended March 31, 2017 from $7,247,543 for the nine months ended March 31, 2016.
For Yuxing, the net income decreased by $735,115 or 50.1% to $732,828 for the nine months ended March 31, 2017 from $1,467,943 for the nine months ended March 31, 2016.
Liquidity and Capital Resources
Our principal sources of liquidity include cash from operations, borrowings from local commercial banks and net proceeds of offerings of our securities consummated in July 2009 and November/December 2009 (collectively the “Public Offerings”).
As of March 31, 2017, cash and cash equivalents were $118,259,995, an increase of $15,363,509, or 14.9%, from $102,896,486 as of June 30, 2016.
| 33 |
We intend to use our working capital to acquire new businesses, upgrade production lines and complete Yuxing’s new greenhouse facilities for agriculture products located on 88 acres of land in Hu County, 18 kilometers southeast of Xi’an city. Our liquidity needs have generally consisted of working capital necessary to finance receivables, raw material and finished goods inventory. We believe that we have sufficient cash on hand and positive projected cash flow from operations to support our business growth for the next twelve months to the extent we do not have further significant acquisitions or expansions. However, if events or circumstances occur and we do not meet our operating plan as expected, we may be required to seek additional capital and/or to reduce certain discretionary spending, which could have a material adverse effect on our ability to achieve our business objectives. Notwithstanding the foregoing, we may seek additional financing as necessary for expansion purposes and when we believe market conditions are most advantageous, which may include additional debt and/or equity financings. There can be no assurance that any additional financing will be available on acceptable terms, if at all. Any equity financing may result in dilution to existing stockholders and any debt financing may include restrictive covenants.
The following table sets forth a summary of our cash flows for the periods indicated:
| Nine Months Ended March 31, | ||||||||
| 2017 | 2016 | |||||||
| Net cash provided by operating activities | $ | 17,499,348 | $ | 19,886,347 | ||||
| Net cash used in investing activities | (359,030 | ) | (16,608 | ) | ||||
| Net cash provided by (used in) financing activities | 1,928,115 | (17,493,160 | ) | |||||
| Effect of exchange rate change on cash and cash equivalents | (3,704,924 | ) | (4,888,986 | ) | ||||
| Net increase (decrease) in cash and cash equivalents | 15,363,509 | 2,512,407 | ||||||
| Cash and cash equivalents, beginning balance | 102,896,486 | 92,982,564 | ||||||
| Cash and cash equivalents, ending balance | $ | 118,259,995 | $ | 90,470,157 | ||||
Operating Activities
Net cash provided by operating activities was $17,499,348 for the nine months ended March 31, 2017, a decrease of $2,386,999, or 12%, compared to $19,886,347 for the nine months ended March 31, 2016. The decrease was mainly attributable to the increase in net income, account receivable and customer deposits, offset by a decrease in inventories and advances to suppliers during the nine months ended March 31, 2017 as compared to the same period in 2016.
Investing Activities
Net cash used in investing activities for the nine months ended March 31, 2017 was $359,030, an increase of $342,422, or 2061.8%, from $16,608 for the nine months ended March 31, 2016. During the nine months ended March 31, 2017, we purchased more plants, property and equipment compared to the same period last year.
Financing Activities
Net cash provided by financing activities for the nine months ended March 31, 2017 was $1,928,115, compared to cash used in financing activities of $17,493,160 for the nine months ended March 31, 2016, which was largely due to we had nil proceeds and repayment of loans for the three months ended March 31, 2017.
As of March 31, 2017 and June 30, 2016, our loans payable were as follows:
| March 31, 2017 | June 30, 2016 | |||||||
| Short term loans payable: | $ | 5,965,201 | $ | 4,665,500 | ||||
| Total | $ | 5,965,201 | $ | 4,665,500 | ||||
Accounts Receivable
We had accounts receivable of $161,809,851 as of March 31, 2017, as compared to $118,418,228 as of June 30, 2016, an increase of $43,391,623 or 36.64%, which is mainly attributable to Gufeng. As of March 31, 2017, Gufeng had accounts receivable of $88,944,961, an increase of $41,598,899, compared to $47,346,062 as of June 30, 2016.
Allowance for doubtful accounts in accounts receivable for the nine months ended March 31, 2017 was $6,859,447, an increase of $5,496,595 from $1,362,852 as of June 30, 2016, and the allowance for doubtful accounts as a percentage of accounts receivable was 4.2% as of March 31, 2017 and 1.2% as of June 30, 2016.
| 34 |
Deferred assets
We had deferred assets of $1,967,215 as of March 31, 2017, as compared to $13,431,621 as of June 30, 2016. We have been assisting our distributors in certain marketing efforts and developing standard stores to enhance our competitive advantages and market shares since March 31, 2016. Based on the distributor agreements, the amount owed by the distributors in certain marketing efforts and store development will be expensed over three years as long as the distributors are actively selling our products. If a distributor defaults, breaches, or terminates the agreement with us earlier than the realization of contractual terms, the unamortized portion of the amount owed by the distributor is to be refunded to us immediately. The Company’s Chairman and CEO, Mr. Li, provided credit backup to guarantee toward potential losses to the Company of any amounts due from distributors in this matter.
Inventories
We had inventory of $46,418,945 as of March 31, 2017, as compared to $87,436,315 as of June 30, 2016, a decrease of $41,017,370, or 46.9%. The decrease was primarily attributable to Gufeng’s inventory. Gufeng’s inventory was $19,873,778 as of March 31, 2017, compared to $60,183,741 as of June 30, 2016.
Advances to Suppliers
We had advances to suppliers of $28,540,308 as of March 31, 2017 as compared to $26,863,959 as of June 30, 2016, representing an increase of $1,676,349 or 6.2%, which was due to the large acquisition of raw material during the last nine months. To ensure our ability to deliver compound fertilizer to the distributor timely prior to the planting season, we need to have sufficient raw material in stock to stabilize the production. To build up the inventory, we typically make advance payment to the suppliers to secure the supply of raw material of basic fertilizer. Our inventory level may fluctuate from time to time, depending how quickly the raw material gets consumed and replenished during the production process, and how soon the finished goods are sold. The replenishment of raw material relies on management’s estimate of numerous factors, including but not limited to, the raw material’s future price, and spot price along with its volatility, as well as the seasonal demand and future price of finished fertilizer products. Such estimate may not be accurate, and the purchase decision of raw materials based on the estimate can cause excessive inventories in times of slow sales and insufficient inventories in peak times.
Accounts Payable
We had accounts payable of $11,783,861 as of March 31, 2017 as compared to $5,246,153 as of June 30, 2016, representing an increase of $6,537,708, or 124.6%. The increase was primarily due to the VIEs, which had $9,839,580 accounts payable as of March 31, 2017.
Unearned Revenue (Customer Deposits)
We had unearned revenue of $6,555,693 as of March 31, 2017 as compared to $8,578,341 as of June 30, 2016, representing a decrease of $2,022,648, or 23.6%. The decrease was mainly attributable to Gufeng’s $2,718,018unearned revenue as of March 31, 2017, compared to $4,381,169 unearned revenue as of June 30, 2016, caused by the advance deposits made by clients. This decrease was a seasonal fluctuation and we expect to deliver products to our customers during the next three months at which time we will recognize the revenue.
We do not have any off-balance sheet arrangements.
| 35 |
Critical Accounting Policies and Estimates
Management’s discussion and analysis of its financial condition and results of operations are based upon our consolidated financial statements, which have been prepared in accordance with United States generally accepted accounting principles. Our financial statements reflect the selection and application of accounting policies which require management to make significant estimates and judgments. See Note 2 to our consolidated financial statements, “Basis of Presentation and Summary of Significant Accounting Policies.” We believe that the following paragraphs reflect the most critical accounting policies that currently affect our financial condition and results of operations:
Use of estimates
The preparation of consolidated financial statements in conformity with accounting principles generally accepted in the United States of America requires management to make estimates and assumptions that affect the reported amounts of assets and liabilities and disclosure of contingent assets and liabilities at the date of the consolidated financial statements and the amount of revenues and expenses during the reporting periods. Management makes these estimates using the best information available at the time the estimates are made. However, actual results could differ materially from those estimates.
Revenue recognition
Sales revenue is recognized at the date of shipment to customers when a formal arrangement exists, the price is fixed or determinable, the delivery is completed, we have no other significant obligations and collectability is reasonably assured. Payments received before all of the relevant criteria for revenue recognition are satisfied are recorded as unearned revenue.
Our revenue consists of invoiced value of goods, net of a value-added tax (VAT). No product return or sales discount allowance is made as products delivered and accepted by customers are normally not returnable and sales discounts are normally not granted after products are delivered.
Cash and cash equivalents
For statement of cash flows purposes, we consider all cash on hand and in banks, certificates of deposit and other highly-liquid investments with maturities of three months or less, when purchased, to be cash and cash equivalents.
Accounts receivable
Our policy is to maintain reserves for potential credit losses on accounts receivable. Management reviews the composition of accounts receivable and analyzes historical bad debts, customer concentrations, customer credit worthiness, current economic trends and changes in customer payment patterns to evaluate the adequacy of these reserves. Any accounts receivable of Jinong and Gufeng that are outstanding for more than 180 days will be accounted as allowance for bad debts, and any accounts receivable of Yuxing that are outstanding for more than 90 days will be accounted as allowance for bad debts.
Deferred assets
Deferred assets represent amounts the Company advanced to the distributors in their marketing and stores development to expand our competitive advantage and market shares. Based on the distributor agreements, the amount owed by the distributors in certain marketing efforts and store development will be expensed over three years as long as the distributors are actively selling our products. If a distributor defaults, breaches, or terminates the agreement with us earlier than the realization the contractual terms, the unamortized portion of the amount owed by the distributor has to be refunded to us immediately. The Company’s Chairman and CEO, Mr. Li, provided credit backup guarantee toward potential losses to the Company of any amounts due from distributors in this matter.
Segment reporting
FASB ASC 280 requires use of the “management approach” model for segment reporting. The management approach model is based on the way a company’s management organizes segments within the company for making operating decisions and assessing performance. Reportable segments are based on products and services, geography, legal structure, management structure, or any other manner in which management disaggregates a company.
As of March 31, 2017, we were organized into four main business segments: Jinong (fertilizer production), Gufeng (fertilizer production) Yuxing (agricultural products production), and VIEs.
| 36 |
Item 3. Quantitative and Qualitative Disclosures about Market Risk
Disclosures about Market Risk
We may be exposed to changes in financial market conditions in the normal course of business. Market risk generally represents the risk that losses may occur as a result of movements in interest rates and equity prices. We currently do not, in the normal course of business, use financial instruments that are subject to changes in financial market conditions.
Currency Fluctuations and Foreign Currency Risk
Substantially all of our revenues and expenses are denominated in RMB. However, we use the U.S. dollar for financial reporting purposes. Conversion of RMB into foreign currencies is regulated by the People’s Bank of China through a unified floating exchange rate system. Although the PRC government has stated its intention to support the value of RMB, there can be no assurance that such exchange rate will not again become volatile or that RMB will not devalue significantly against U.S. dollar. Exchange rate fluctuations may adversely affect the value, in U.S. dollar terms, of our net assets and income derived from our operations in the PRC.
Our reporting currency is the U.S. dollar. Except for U.S. holding companies, all of our consolidated revenues, consolidated costs and expenses, and our assets are denominated in RMB. As a result, we are exposed to foreign exchange risk as our revenues and results of operations may be affected by fluctuations in the exchange rate between U.S. dollars and RMB. If RMB depreciates against the U.S. dollar, the value of our RMB revenues, earnings and assets as expressed in our U.S. dollar financial statements will decline. Assets and liabilities are translated at the exchange rates as of the balance sheet dates, revenues and expenses are translated at the average exchange rates, and shareholders’ equity is translated at historical exchange rates. Any resulting translation adjustments are not included in determining net income but are included in determining other comprehensive income, a component of shareholders’ equity. As of December 31, 2016, our accumulated other comprehensive income was $22.1 million. We have not entered into any hedging transactions in an effort to reduce our exposure to foreign exchange risk. The value of RMB against the U.S. dollar and other currencies is affected by, among other things, changes in the PRC’s political and economic conditions. In 2016, China’s currency dropped by a cumulative 6.8% against the U.S. dollar. The effect on trade can be substantial. Moreover, it is possible that, in the future, PRC authorities may lift restrictions on fluctuations in RMB exchange rate and lessen intervention in the foreign exchange market.
Interest Rate Risk
We deposit surplus funds with Chinese banks earning daily interest. We do not invest in any instruments for trading purposes. All of our outstanding debt instruments carry fixed rates of interests. The amount of short-term debt outstanding as of March 31, 2017 and June 30, 2016 was $4.5 million and $4.7 million, respectively. We are exposed to interest rate risk primarily with respect to our short-term bank loans. Although the interest rates, which are based on the banks’ prime rates with respect to our short-term loans, are fixed for the terms of the loans, the terms are typically three to twelve months for short-term bank loans and interest rates are subject to change upon renewal. There were no material changes in interest rates for short-term bank loans renewed during the three months ended March 31, 2017. The original loan term on average is one year, and the remaining average life of the short term-loans is approximately five months.
Management monitors the banks’ prime rates in conjunction with our cash requirements to determine the appropriate level of debt balances relative to other sources of funds. We have not entered into any hedging transactions in an effort to reduce our exposure to interest rate risk.
Credit Risk
We have not experienced significant credit risk, as most of our customers are long-term customers with superior payment records. Our receivables are monitored regularly by our credit managers.
Inflation Risk
Inflationary factors such as increases in the cost of our products and overhead costs may adversely affect our operating results. Although we do not believe that inflation has had a material impact on our financial position or results of operations to date, a high rate of inflation in the future may have an adverse effect on our ability to maintain current levels of gross margin and selling, general and administrative expenses as a percentage of net revenues if the selling prices of our products do not increase with these increased costs.
| 37 |
Item 4. Controls and Procedures
(a) Evaluation of disclosure controls and procedures
At the conclusion of the period ended March 31, 2017 we carried out an evaluation, under the supervision and with the participation of our management, including our Chief Executive Officer (“CEO”) and Chief Financial Officer (“CFO”), of the effectiveness of the design and operation of our disclosure controls and procedures (as such term is defined in Rules 13a-15(e) and 15d-15(e) under the Securities Exchange Act of 1934 (the “Exchange Act”)). Based upon that evaluation, our CEO and CFO concluded that as of the end of the period covered by this Quarterly Report, our disclosure controls and procedures were effective and adequately designed to ensure that the information required to be disclosed by us in the reports we file or submit under the Exchange Act is recorded, processed, summarized and reported within the time periods specified in the applicable rules and forms, and that such information was accumulated and communicated to our management, including our CEO and CFO, in a manner that allowed for timely decisions regarding required disclosure.
(b) Changes in internal controls
There were no changes in our internal control over financial reporting identified in connection with the evaluation required by paragraph (d) of Exchange Act Rules 13a-15 or 15d-15 that occurred during the quarter ended March 31, 2017 that have materially affected, or are reasonably likely to materially affect, our internal control over financial reporting.
Item 1. Legal Proceedings
There are no other actions, suits, proceedings, inquiries or investigation before or by any court, public board, government agency, self-regulatory organization or body pending or, to the knowledge of the executive officers of our company or any of our subsidiaries, threatened against or affecting our company, our common stock, any of our subsidiaries or of our companies or our subsidiaries’ officers or directors in their capacities as such, in which an adverse decision could have a material adverse effect.
Item 2. Unregistered Sales of Equity Securities and Use of Proceeds
There were no unregistered sales of the Company’s equity securities during the three months ended March 31, 2017, that were not otherwise disclosed in a Current Report on Form 8-K.
Item 3. Defaults Upon Senior Securities
There has been no default in the payment of principal, interest, sinking or purchase fund installment, or any other material default, with respect to any indebtedness of the Company.
Item 4. Mine Safety Disclosures
Not applicable.
Item 5. Other Information
There is no other information required to be disclosed under this item which was not previously disclosed.
The exhibits required by this item are set forth in the Exhibit Index attached hereto.
| 38 |
Pursuant to the requirements of the Securities Exchange Act of 1934, the Registrant has duly caused this report to be signed on its behalf by the undersigned thereunto duly authorized.
| CHINA GREEN AGRICULTURE, INC. | ||
| Date: May__, 2017 | By: | /s/ Tao Li |
| Name: | Tao Li | |
| Title: | Chief Executive Officer | |
| (principal executive officer) | ||
| Date: May__, 2017 | By: | /s/ Zhuoyu “Richard” Li |
| Name: | Zhuoyu “Richard” Li | |
| Title: | President | |
| (deputy executive officer) | ||
| Date: May__, 2017 | By: | /s/ Ken Ren |
| Name: | Ken Ren | |
| Title: | Chief Financial Officer | |
| (principal
financial officer and principal accounting officer) | ||
| 39 |
| No. | Description | |
| 31.1 | Certification of Principal Executive Officer pursuant to Section 302 of the Sarbanes-Oxley Act of 2002. | |
| 31.2 | Certification of Principal Financial Officer pursuant to Section 302 of the Sarbanes-Oxley Act of 2002. | |
| 32.1 | Certification of Principal Executive Officer and Principal Financial Officer pursuant to Section 906 of the Sarbanes-Oxley Act of 2002. | |
| 101.INS | XBRL Instance Document | |
| 101.SCH | XBRL Taxonomy Extension Schema Document | |
| 101.CAL | XBRL Taxonomy Extension Calculation Linkbase Document | |
| 101.DEF | XBRL Taxonomy Extension Definition Linkbase Document | |
| 101.LAB | XBRL Taxonomy Extension Label Linkbase Document | |
| 101.PRE | XBRL Taxonomy Extension Presentation Linkbase Document |
40