Attached files
UNITED STATES
SECURITIES AND EXCHANGE COMMISSION
Washington, D.C. 20549
FORM 10-Q
[x] | QUARTERLY REPORT PURSUANT TO SECTION 13 OR 15(d) OF THE SECURITIES EXCHANGE ACT OF 1934 |
For the quarterly period ended March 31, 2017
OR
[ ] | TRANSITION REPORT PURSUANT TO SECTION 13 OR 15(d) OF THE SECURITIES EXCHANGE ACT OF 1934 |
For the transition period from __________ to __________
Commission File Number 000-54755
CĪON Investment Corporation | ||
(Exact name of registrant as specified in its charter) | ||
Maryland | 45-3058280 | |
(State or other jurisdiction of incorporation or organization) | (I.R.S. Employer Identification No.) | |
3 Park Avenue, 36th Floor New York, New York | 10016 | |
(Address of principal executive offices) | (Zip Code) | |
(212) 418-4700 | ||
(Registrant’s telephone number, including area code) | ||
Not applicable | ||
(Former name, former address and former fiscal year, if changed since last report) | ||
Indicate by check mark whether the registrant (1) has filed all reports required to be filed by Section 13 or 15(d) of the Securities Exchange Act of 1934 during the preceding 12 months (or for such shorter period that the registrant was required to file such reports), and (2) has been subject to such filing requirements for the past 90 days.
Yes [x] No [ ]
Indicate by check mark whether the registrant has submitted electronically and posted on its corporate Website, if any, every Interactive Data File required to be submitted and posted pursuant to Rule 405 of Regulation S-T (§232.405 of this chapter) during the preceding 12 months (or for such shorter period that the registrant was required to submit and post such files).
Yes [ ] No [ ]
Indicate by check mark whether the registrant is a large accelerated filer, an accelerated filer, a non-accelerated filer, a smaller reporting company, or an emerging growth company. See the definitions of “large accelerated filer,” “accelerated filer,” “smaller reporting company,” and "emerging growth company" in Rule 12b-2 of the Exchange Act.
Large accelerated filer [ ] | Accelerated filer [ ] | |
Non-accelerated filer [x] (Do not check if a smaller reporting company) | Smaller reporting company [ ] | |
Emerging growth company [ ] | ||
If an emerging growth company, indicate by check mark if the registrant has elected not to use the extended transition period for complying with any new or revised financial accounting standards provided pursuant to Section 13(a) of the Exchange Act.
[ ]
Indicate by check mark whether the registrant is a shell company (as defined in Rule 12b-2 of the Exchange Act).
Yes [ ] No [x]
The number of shares of the registrant’s common stock, $0.001 par value, outstanding as of May 10, 2017 was 111,249,220.
CĪON INVESTMENT CORPORATION
FORM 10-Q
TABLE OF CONTENTS
Page | ||
PART I – FINANCIAL INFORMATION
Item 1. Financial Statements
CĪON Investment Corporation
Consolidated Balance Sheets
(in thousands, except share and per share amounts)
March 31, 2017 | December 31, 2016 | |||||||
(unaudited) | ||||||||
Assets | ||||||||
Investments, at fair value (amortized cost of $1,468,258 and $1,096,948, respectively) | $ | 1,457,788 | $ | 1,089,478 | ||||
Derivative asset (cost of $229) | — | 46 | ||||||
Cash | 23,185 | 15,046 | ||||||
Restricted cash | 2,000 | 2,000 | ||||||
Due from counterparty(1) | 20,081 | 143,335 | ||||||
Interest receivable on investments | 5,300 | 6,689 | ||||||
Receivable due on investments sold | 2,112 | — | ||||||
Unrealized appreciation on total return swap(1) | 134 | — | ||||||
Receivable due on total return swap(1) | — | 4,187 | ||||||
Prepaid expenses and other assets | 105 | 282 | ||||||
Total assets | $ | 1,510,705 | $ | 1,261,063 | ||||
Liabilities and Shareholders' Equity | ||||||||
Liabilities | ||||||||
Payable for investments purchased | $ | 27,760 | $ | 15,837 | ||||
Credit facilities payable (net of unamortized debt issuance costs of $4,805 and $3,212, respectively) | 451,316 | 221,211 | ||||||
Accounts payable and accrued expenses | 1,086 | 1,476 | ||||||
Interest payable | 973 | 864 | ||||||
Commissions payable for common stock purchased | — | 2 | ||||||
Accrued management fees | 6,482 | 5,781 | ||||||
Accrued administrative services expense | 346 | 682 | ||||||
Due to CIG - offering costs | 45 | 45 | ||||||
Payable on total return swap(1) | 12,687 | — | ||||||
Unrealized depreciation on total return swap(1) | — | 15,402 | ||||||
Total liabilities | 500,695 | 261,300 | ||||||
Commitments and contingencies (Note 4 and Note 11) | ||||||||
Shareholders' Equity | ||||||||
Common stock, $0.001 par value; 500,000,000 shares authorized; | ||||||||
111,370,686 and 109,787,557 shares issued and outstanding, respectively | 111 | 110 | ||||||
Capital in excess of par value | 1,035,770 | 1,021,280 | ||||||
Undistributed net investment income | 2,684 | 1,428 | ||||||
Accumulated net unrealized depreciation on investments | (10,470 | ) | (7,653 | ) | ||||
Accumulated net realized loss from total return swap(1) | (18,219 | ) | — | |||||
Accumulated net unrealized appreciation (depreciation) on total return swap(1) | 134 | (15,402 | ) | |||||
Total shareholders' equity | 1,010,010 | 999,763 | ||||||
Total liabilities and shareholders' equity | $ | 1,510,705 | $ | 1,261,063 | ||||
Net asset value per share of common stock at end of period | $ | 9.07 | $ | 9.11 | ||||
(1) See Note 7 for a discussion of the Company’s total return swap agreement.
See accompanying notes to consolidated financial statements.
1
CĪON Investment Corporation
Consolidated Statements of Operations
(in thousands, except share and per share amounts)
Three Months Ended March 31, | ||||||||
2017 | 2016 | |||||||
(unaudited) | (unaudited) | |||||||
Investment income | ||||||||
Interest income | $ | 27,498 | $ | 17,079 | ||||
Fee and other income | 547 | 192 | ||||||
Total investment income | 28,045 | 17,271 | ||||||
Operating expenses | ||||||||
Management fees | 6,482 | 4,512 | ||||||
Administrative services expense | 346 | 292 | ||||||
General and administrative(1) | 1,746 | 1,753 | ||||||
Interest expense | 2,926 | 120 | ||||||
Total operating expenses | 11,500 | 6,677 | ||||||
Recoupment of expense support from CIG(2) | — | 119 | ||||||
Net operating expenses | 11,500 | 6,796 | ||||||
Net investment income | 16,545 | 10,475 | ||||||
Realized and unrealized gains (losses) | ||||||||
Net realized gain (loss) on investments | 740 | (8 | ) | |||||
Net realized gain on foreign currency | 144 | — | ||||||
Net change in unrealized depreciation on investments | (2,817 | ) | (12,605 | ) | ||||
Net realized (loss) gain on total return swap(3) | (14,269 | ) | 8,362 | |||||
Net change in unrealized appreciation (depreciation) on total return swap(3) | 15,536 | (1,608 | ) | |||||
Total net realized and unrealized losses | (666 | ) | (5,859 | ) | ||||
Net increase in net assets resulting from operations | $ | 15,879 | $ | 4,616 | ||||
Per share information—basic and diluted | ||||||||
Net increase in net assets per share resulting from operations | $ | 0.14 | $ | 0.04 | ||||
Weighted average shares of common stock outstanding | 110,083,778 | 103,957,573 | ||||||
(1) See Note 10 for details of the Company's general and administrative expenses.
(2) See Note 4 for a discussion of expense support from CIG and recoupment of expense support.
(3) See Note 7 for a discussion of the Company's total return swap agreement.
See accompanying notes to consolidated financial statements.
2
CĪON Investment Corporation
Consolidated Statements of Changes in Net Assets
(in thousands, except share and per share amounts)
Three Months Ended March 31, | |||||||||
2017 | 2016 | ||||||||
(unaudited) | (unaudited) | ||||||||
Changes in net assets from operations: | |||||||||
Net investment income | $ | 16,545 | $ | 10,475 | |||||
Net realized gain (loss) on investments | 740 | (8 | ) | ||||||
Net realized gain on foreign currency | 144 | — | |||||||
Net change in unrealized depreciation on investments | (2,817 | ) | (12,605 | ) | |||||
Net realized (loss) gain on total return swap(1) | (14,269 | ) | 8,362 | ||||||
Net change in unrealized appreciation (depreciation) on total return swap(1) | 15,536 | (1,608 | ) | ||||||
Net increase in net assets resulting from operations | 15,879 | 4,616 | |||||||
Changes in net assets from shareholders' distributions:(2) | |||||||||
Net investment income | (15,289 | ) | (10,475 | ) | |||||
Net realized gain on total return swap | |||||||||
Net interest and other income from TRS portfolio | (3,316 | ) | (8,193 | ) | |||||
Net gain on TRS loan sales(4) | (634 | ) | (169 | ) | |||||
Net realized gain on investments and foreign currency | (884 | ) | — | ||||||
Distributions in excess of net investment income(3) | — | (167 | ) | ||||||
Net decrease in net assets from shareholders' distributions | (20,123 | ) | (19,004 | ) | |||||
Changes in net assets from capital share transactions: | |||||||||
Issuance of common stock, net of issuance costs of $448 and $50, respectively | 11,935 | 424 | |||||||
Reinvestment of shareholders' distributions | 9,926 | 9,683 | |||||||
Repurchase of common stock | (7,370 | ) | (2,437 | ) | |||||
Net increase in net assets resulting from capital share transactions | 14,491 | 7,670 | |||||||
Total increase (decrease) in net assets | 10,247 | (6,718 | ) | ||||||
Net assets at beginning of period | 999,763 | 904,326 | |||||||
Net assets at end of period | $ | 1,010,010 | $ | 897,608 | |||||
Net asset value per share of common stock at end of period | $ | 9.07 | $ | 8.57 | |||||
Shares of common stock outstanding at end of period | 111,370,686 | 104,723,030 | |||||||
Undistributed (distributions in excess of) net investment income at end of period(3) | $ | 2,684 | $ | (167 | ) | ||||
(1) | See Note 7 for a discussion of the Company’s total return swap agreement. |
(2) | This table presents changes in net assets from shareholders' distributions on a GAAP basis. See Note 5 for a discussion of the sources of distributions paid by the Company. |
(3) | Distributions in excess of net investment income represent certain expenses, which are not deductible on a tax-basis. Unearned capital gains incentive fees and certain offering expenses reduce GAAP basis net investment income, but do not reduce tax basis net investment income. These tax-related adjustments represent additional net investment income available for distribution for tax purposes. |
(4) | During the three months ended March 31, 2017, the Company realized losses of $21,146, which are not currently deductible on a tax-basis. |
See accompanying notes to consolidated financial statements.
3
CĪON Investment Corporation
Consolidated Statements of Cash Flows
(in thousands)
Three Months Ended March 31, | ||||||||
2017 | 2016 | |||||||
(unaudited) | (unaudited) | |||||||
Operating activities: | ||||||||
Net increase in net assets resulting from operations | $ | 15,879 | $ | 4,616 | ||||
Adjustments to reconcile net increase in net assets resulting from operations to net cash used in | ||||||||
operating activities: | ||||||||
Net accretion of discount on investments | (1,817 | ) | (409 | ) | ||||
Proceeds from principal repayment of investments | 109,443 | 10,749 | ||||||
Purchase of investments | (508,339 | ) | (37,007 | ) | ||||
Paid-in-kind interest | (729 | ) | (17 | ) | ||||
Decrease in short term investments, net | 198 | 369 | ||||||
Proceeds from sale of investments | 30,903 | 10,920 | ||||||
Net realized (gain) loss on investments | (740 | ) | 8 | |||||
Net unrealized depreciation on investments | 2,817 | 12,605 | ||||||
Net unrealized (appreciation) depreciation on total return swap(1) | (15,536 | ) | 1,608 | |||||
Amortization of deferred financing costs | 273 | 69 | ||||||
(Increase) decrease in due from counterparty(1) | 123,254 | (5,515 | ) | |||||
(Increase) decrease in interest receivable on investments | 1,389 | 1,014 | ||||||
(Increase) decrease in receivable due on investments sold | (2,112 | ) | (7,465 | ) | ||||
(Increase) decrease in receivable due on total return swap(1) | 16,874 | (534 | ) | |||||
(Increase) decrease in prepaid expenses and other assets | 127 | (106 | ) | |||||
Increase (decrease) in payable for investments purchased | 11,923 | (4,870 | ) | |||||
Increase (decrease) in accounts payable and accrued expenses | (395 | ) | 216 | |||||
Increase (decrease) in interest payable | 109 | — | ||||||
Increase (decrease) in accrued management fees | 701 | 82 | ||||||
Increase (decrease) in accrued administrative services expense | (336 | ) | (325 | ) | ||||
Increase (decrease) in accrued recoupment of expense support from CIG(2) | — | (361 | ) | |||||
Increase (decrease) in due to CIG - offering, organizational and other costs | — | (20 | ) | |||||
Net cash used in operating activities | (216,114 | ) | (14,373 | ) | ||||
Financing activities: | ||||||||
Gross proceeds from issuance of common stock | 12,383 | 5,933 | ||||||
Commissions and dealer manager fees paid | (450 | ) | (517 | ) | ||||
Repurchase of common stock | (7,370 | ) | (2,437 | ) | ||||
Shareholders' distributions paid(3) | (10,197 | ) | (9,321 | ) | ||||
Borrowings under revolving credit facilities(4) | 231,698 | — | ||||||
Deferred financing costs paid | (1,811 | ) | (150 | ) | ||||
Net cash provided by (used in) financing activities | 224,253 | (6,492 | ) | |||||
Net increase (decrease) in cash and restricted cash | 8,139 | (20,865 | ) | |||||
Cash and restricted cash, beginning of period | 17,046 | 39,741 | ||||||
Cash and restricted cash, end of period | $ | 25,185 | $ | 18,876 | ||||
Supplemental disclosure of cash flow information: | ||||||||
Cash paid for interest | $ | 2,540 | $ | 50 | ||||
Supplemental non-cash financing activities: | ||||||||
Reinvestment of shareholders' distributions(3) | $ | 9,926 | $ | 9,683 | ||||
(1) | See Note 7 for a discussion of the Company’s total return swap agreement. |
(2) | See Note 4 for a discussion of expense support from CIG and recoupment of expense support. |
(3) | See Note 5 for a discussion of the sources of distributions paid by the Company. |
(4) | See Note 8 for a discussion of the Company’s credit facilities. |
See accompanying notes to consolidated financial statements.
4
CĪON Investment Corporation
Consolidated Schedule of Investments (unaudited)
March 31, 2017
(in thousands)
Portfolio Company(a) | Index Rate(b) | Industry | Principal/ Par Amount/ Units(d) | Cost(r) | Fair Value(c) | |||||||||||
Senior Secured First Lien Debt - 85.8% | ||||||||||||||||
AbelConn, LLC / Atrenne Computing Solutions, LLC / Airco Industries, LLC, L+875, 1.00% LIBOR Floor, 7/17/2019(j)(n) | 3 Month LIBOR | Aerospace & Defense | $ | 21,895 | $ | 21,530 | $ | 21,840 | ||||||||
Academy, Ltd., L+400, 1.00% LIBOR Floor, 7/1/2022(o) | Various | Retail | 14,730 | 11,537 | 10,947 | |||||||||||
Access CIG, LLC, L+500, 1.00% LIBOR Floor, 10/18/2021(o) | 3 Month LIBOR | Services: Business | 6,781 | 6,828 | 6,815 | |||||||||||
Adams Publishing Group, LLC, L+700, 1.00% LIBOR Floor, 11/3/2020(n) | 3 Month LIBOR | Media: Advertising, Printing & Publishing | 3,704 | 3,638 | 3,649 | |||||||||||
ALM Media, LLC, L+450, 1.00% LIBOR Floor, 7/31/2020(o) | 3 Month LIBOR | Media: Advertising, Printing & Publishing | 7,683 | 7,328 | 7,337 | |||||||||||
Alvogen Pharma US, Inc., L+500, 1.00% LIBOR Floor, 4/1/2022(o) | 1 Month LIBOR | Healthcare & Pharmaceuticals | 9,304 | 9,258 | 9,298 | |||||||||||
American Clinical Solutions LLC, L+950, 1.00% LIBOR Floor, 6/11/2020 | 3 Month LIBOR | Healthcare & Pharmaceuticals | 9,034 | 8,918 | 8,492 | |||||||||||
American Dental Partners, Inc., L+475, 1.00% LIBOR Floor, 8/29/2021(o) | 3 Month LIBOR | Healthcare & Pharmaceuticals | 10,694 | 10,214 | 10,213 | |||||||||||
American Energy - Marcellus, LLC, L+425, 1.00% LIBOR Floor, 8/4/2020 | 3 Month LIBOR | Energy: Oil & Gas | 4,270 | 2,970 | 2,968 | |||||||||||
American Media, Inc., L+750, 1.00% LIBOR Floor, 8/24/2020(i)(n) | 3 Month LIBOR | Media: Advertising, Printing & Publishing | 16,237 | 15,862 | 15,953 | |||||||||||
American Media, Inc., 0.50% Unfunded, 8/24/2020 | None | Media: Advertising, Printing & Publishing | 801 | (24 | ) | (14 | ) | |||||||||
American Media, Inc., 7.50%, 8/24/2020 | None | Media: Advertising, Printing & Publishing | 206 | (6 | ) | (4 | ) | |||||||||
American Residential Services, LLC, L+400, 1.00% LIBOR Floor, 6/30/2022(o) | 1 Month LIBOR | Construction & Building | 14,102 | 14,137 | 14,137 | |||||||||||
American Teleconferencing Services, Ltd., L+650, 1.00% LIBOR Floor, 12/8/2021(n) | 1 Month LIBOR | Telecommunications | 18,997 | 17,310 | 19,009 | |||||||||||
AMPORTS, Inc., L+500, 1.00% LIBOR Floor, 5/19/2020(j) | 3 Month LIBOR | Automotive | 19,100 | 18,767 | 18,670 | |||||||||||
Aquilex, LLC, L+400, 1.00% LIBOR Floor, 12/31/2020(o) | 1 Month LIBOR | Chemicals, Plastics & Rubber | 1,813 | 1,758 | 1,767 | |||||||||||
Arctic Glacier Group Holdings, Inc., L+425, 1.00% LIBOR Floor, 3/20/2024(o) | 1 Month LIBOR | Beverage, Food & Tobacco | 1,216 | 1,228 | 1,231 | |||||||||||
Associated Asphalt Partners, LLC, L+525, 1.00% LIBOR Floor, 4/5/2024(i)(o) | 1 Month LIBOR | Construction & Building | 2,946 | 2,931 | 2,964 | |||||||||||
Avaya Inc., L+525, 1.00% LIBOR Floor, 5/29/2020(o) | 3 Month LIBOR | Telecommunications | 14,689 | 11,531 | 11,770 | |||||||||||
Avaya Inc., L+750, 1.00% LIBOR Floor, 1/24/2018 | 1 Month LIBOR | Telecommunications | 3,509 | 3,479 | 3,614 | |||||||||||
Azure Midstream Energy, LLC, L+650, 1.00% LIBOR Floor, 11/15/2018(o) | 1 Month LIBOR | Energy: Oil & Gas | 2,188 | 2,088 | 2,086 | |||||||||||
Blue Ribbon, LLC, L+400, 1.00% LIBOR Floor, 11/15/2021 | 3 Month LIBOR | Beverage, Food & Tobacco | 9,950 | 9,950 | 9,353 | |||||||||||
California Pizza Kitchen, Inc., L+600, 1.00% LIBOR Floor, 8/23/2022(i) | 1 Month LIBOR | Beverage, Food & Tobacco | 5,000 | 5,013 | 5,000 | |||||||||||
Caraustar Industries, Inc., L+550, 1.00% LIBOR Floor, 3/14/2022(o) | 3 Month LIBOR | Forest Products & Paper | 5,620 | 5,690 | 5,679 | |||||||||||
Central Security Group, Inc., L+563, 1.00% LIBOR Floor, 10/6/2020(o) | 1 Month LIBOR | Services: Consumer | 13,024 | 13,089 | 13,057 | |||||||||||
CF Entertainment Inc., L+850, 1.00% LIBOR Floor, 1/27/2023(n) | 3 Month LIBOR | Media: Diversified & Production | 50,000 | 49,067 | 49,000 | |||||||||||
CF Entertainment Inc., 2.00% Unfunded, 1/28/2019 | None | Media: Diversified & Production | 10,000 | (243 | ) | (200 | ) | |||||||||
Charming Charlie, LLC, L+800, 1.00% LIBOR Floor, 12/24/2019 | 3 Month LIBOR | Retail | 7,772 | 3,992 | 3,964 | |||||||||||
Cozzini Bros., Inc., L+550, 1.00% LIBOR Floor, 3/10/2023 | 2 Month LIBOR | Services: Business | 3,000 | 2,941 | 2,940 | |||||||||||
CSP Technologies North America, LLC, L+525, 1.00% LIBOR Floor, 1/29/2022 | 1 Month LIBOR | Chemicals, Plastics & Rubber | 13,623 | 13,351 | 13,657 | |||||||||||
CT Technologies Intermediate Holdings, Inc., L+425, 1.00% LIBOR Floor, 12/1/2021 | 1 Month LIBOR | Healthcare & Pharmaceuticals | 14,713 | 13,981 | 13,941 | |||||||||||
David's Bridal, Inc., L+400, 1.25% LIBOR Floor, 10/11/2019(o) | 3 Month LIBOR | Retail | 3,477 | 2,888 | 2,878 | |||||||||||
DBRS, Inc., L+525, 1.00% LIBOR Floor, 3/4/2022(h)(o) | 3 Month LIBOR | Services: Business | 12,971 | 12,496 | 12,517 | |||||||||||
DFS Holding Company, Inc., L+550, 1.00% LIBOR Floor, 2/17/2022 | 3 Month LIBOR | Capital Equipment | 3,307 | 3,266 | 3,265 | |||||||||||
See accompanying notes to consolidated financial statements.
5
CĪON Investment Corporation
Consolidated Schedule of Investments (unaudited)
March 31, 2017
(in thousands)
Portfolio Company(a) | Index Rate(b) | Industry | Principal/ Par Amount/ Units(d) | Cost(r) | Fair Value(c) | |||||||||
Dodge Data & Analytics, LLC / Skyline Data News and Analytics, LLC, L+875, 1.00% LIBOR Floor, 10/31/2019(n) | 3 Month LIBOR | Construction & Building | 10,162 | 10,034 | 9,997 | |||||||||
Dorner Holding Corp., L+575, 1.00% LIBOR Floor, 3/15/2023 | 3 Month LIBOR | Capital Equipment | 1,118 | 1,090 | 1,090 | |||||||||
ECI Acquisition Holdings, Inc., L+625, 1.00% LIBOR Floor, 3/11/2019(n) | 3 Month LIBOR | High Tech Industries | 8,495 | 8,474 | 8,495 | |||||||||
EIG Investors Corp., L+548, 1.00% LIBOR Floor, 11/9/2019(h)(o) | 3 Month LIBOR | Services: Business | 1,763 | 1,775 | 1,774 | |||||||||
Elemica, Inc., L+800, 1.00% LIBOR Floor, 7/7/2021(n) | 1 Month LIBOR | High Tech Industries | 17,369 | 16,978 | 17,021 | |||||||||
Elemica, Inc., 0.50% Unfunded, 7/7/2021 | None | High Tech Industries | 2,500 | (54 | ) | (50 | ) | |||||||
Emmis Operating Company, L+600, 1.00% LIBOR Floor, 6/10/2021(o) | 3 Month LIBOR | Media: Broadcasting & Subscription | 7,328 | 6,907 | 6,925 | |||||||||
EnTrans International, LLC, L+750, 1.00% LIBOR Floor, 6/4/2020 | 3 Month LIBOR | Capital Equipment | 13,594 | 10,167 | 10,161 | |||||||||
Evergreen Skills Lux S.À.R.L., L+475, 1.00% LIBOR Floor, 4/28/2021(h)(o) | 1 Month LIBOR | High Tech Industries | 7,331 | 6,747 | 6,772 | |||||||||
F+W Media, Inc., L+950, 1.25% LIBOR Floor, 6/30/2019(n)(q) | 3 Month LIBOR | Media: Diversified & Production | 7,280 | 7,104 | 2,807 | |||||||||
Forbes Media LLC, L+675, 1.00% LIBOR Floor, 9/12/2019(j) | 1 Month LIBOR | Media: Advertising, Printing & Publishing | 15,000 | 14,652 | 14,588 | |||||||||
Global Cash Access, Inc., L+525, 1.00% LIBOR Floor, 12/18/2020(o) | 3 Month LIBOR | Hotel, Gaming & Leisure | 10,562 | 10,641 | 10,661 | |||||||||
Harland Clarke Holdings Corp., L+550, 1.00% LIBOR Floor, 2/9/2022(o) | 2 Month LIBOR | Services: Business | 14,912 | 15,035 | 15,051 | |||||||||
Healogics, Inc., L+425, 1.00% LIBOR Floor, 7/1/2021(o) | 3 Month LIBOR | Healthcare & Pharmaceuticals | 4,887 | 4,574 | 4,557 | |||||||||
Ignite Restaurant Group, Inc., L+700, 1.00% LIBOR Floor, 2/13/2019(n) | 3 Month LIBOR | Beverage, Food & Tobacco | 10,482 | 10,408 | 6,813 | |||||||||
Infinity Sales Group, LLC, L+1050, 1.00% LIBOR Floor, 11/21/2018(n) | 1 Month LIBOR | Services: Business | 8,118 | 7,536 | 7,347 | |||||||||
Infogroup Inc., L+550, 1.50% LIBOR Floor, 5/26/2018(n) | 3 Month LIBOR | Media: Advertising, Printing & Publishing | 15,537 | 15,287 | 15,517 | |||||||||
Intertain Group Ltd., L+650, 1.00% LIBOR Floor, 4/8/2022(h)(n) | 1 Month LIBOR | Hotel, Gaming & Leisure | 1,713 | 1,686 | 1,730 | |||||||||
Ipsen International GmbH, L+800, 1.00% LIBOR Floor, 9/30/2019(h)(j) | 1 Month LIBOR | Capital Equipment | 1,380 | 1,386 | 1,387 | |||||||||
Ipsen, Inc., L+700, 1.00% LIBOR Floor, 9/30/2019(j) | 1 Month LIBOR | Capital Equipment | 8,095 | 8,009 | 8,095 | |||||||||
ITC Service Group Acquisition LLC, L+950, 0.50% LIBOR Floor, 5/26/2021(j) | 1 Month LIBOR | High Tech Industries | 11,250 | 11,049 | 11,081 | |||||||||
Labvantage Solutions Inc., L+800, 1.00% LIBOR Floor, 12/29/2020(n) | 3 Month LIBOR | High Tech Industries | 4,813 | 4,771 | 4,813 | |||||||||
Labvantage Solutions Ltd., E+800, 1.00% EURIBOR Floor, 12/29/2020(h) | 3 Month EURIBOR | High Tech Industries | € | 4,409 | 4,913 | 4,697 | ||||||||
Liaison Acquisition, LLC, L+525, 1.00% LIBOR Floor, 2/8/2023 | 3 Month LIBOR | High Tech Industries | 5,000 | 4,928 | 4,925 | |||||||||
Lift Brands, Inc., L+800, 1.00% LIBOR Floor, 12/23/2019(n) | 3 Month LIBOR | Services: Consumer | 9,484 | 9,386 | 9,413 | |||||||||
LTCG Holdings Corp., L+500, 1.00% LIBOR Floor, 6/6/2020(o) | 1 Month LIBOR | Services: Business | 5,911 | 5,528 | 5,527 | |||||||||
Ministry Brands, LLC, L+500, 1.00% LIBOR Floor, 12/2/2022(e)(n) | 1 Month LIBOR | Services: Business | 4,997 | 4,801 | 4,872 | |||||||||
Murray Energy Corp., L+725, 1.00% LIBOR Floor, 4/16/2020(o) | 3 Month LIBOR | Metals & Mining | 3,670 | 3,563 | 3,574 | |||||||||
Nathan's Famous Inc., 10.00%, 3/15/2020(h)(n) | None | Beverage, Food & Tobacco | 6,000 | 6,000 | 6,473 | |||||||||
Navex Global, Inc., L+425, 1.00% LIBOR Floor, 11/19/2021(o) | 1 Month LIBOR | High Tech Industries | 13,685 | 13,728 | 13,719 | |||||||||
Nextech Systems, LLC, L+725, 1.00% LIBOR Floor, 6/22/2021(j)(n) | 3 Month LIBOR | High Tech Industries | 15,442 | 14,894 | 15,134 | |||||||||
Nielsen & Bainbridge, LLC, L+500, 1.00% LIBOR Floor, 8/15/2020(o) | 2 Month LIBOR | Consumer Goods: Durable | 16,022 | 15,943 | 15,982 | |||||||||
NWN Acquisition Holding Company LLC, L+1000, 1.00% LIBOR Floor, 10/16/2020(j) | 3 Month LIBOR | High Tech Industries | 13,608 | 13,273 | 13,301 | |||||||||
Oasis Outsourcing Holdings, Inc., L+475, 1.00% LIBOR Floor, 12/26/2021(o) | 1 Month LIBOR | Services: Business | 9,389 | 9,447 | 9,448 | |||||||||
Onex TSG Holdings II Corp., L+400, 1.00% LIBOR Floor, 7/29/2022(o) | 1 Month LIBOR | Healthcare & Pharmaceuticals | 3,418 | 3,440 | 3,441 | |||||||||
Opal Acquisition, Inc., L+400, 1.00% LIBOR Floor, 11/27/2020(o) | 3 Month LIBOR | Healthcare & Pharmaceuticals | 10,288 | 9,656 | 9,710 | |||||||||
Orbcomm Inc., 8.00%, 4/1/2024(i)(n) | None | Telecommunications | 9,911 | 9,911 | 10,010 | |||||||||
See accompanying notes to consolidated financial statements.
6
CĪON Investment Corporation
Consolidated Schedule of Investments (unaudited)
March 31, 2017
(in thousands)
Portfolio Company(a) | Index Rate(b) | Industry | Principal/ Par Amount/ Units(d) | Cost(r) | Fair Value(c) | ||||||||
Pelican Products, Inc., L+425, 1.00% LIBOR Floor, 4/10/2020(o) | 3 Month LIBOR | Chemicals, Plastics & Rubber | 2,497 | 2,500 | 2,499 | ||||||||
Petroflow Energy Corporation, L+800, 1.00% LIBOR Floor, 6/29/2019(s) | 1 Month LIBOR | Energy: Oil & Gas | 4,969 | 4,716 | 4,758 | ||||||||
Photonis Technologies SAS, L+750, 1.00% LIBOR Floor, 9/18/2019(h)(o) | 3 Month LIBOR | Aerospace & Defense | 6,433 | 5,406 | 5,982 | ||||||||
Plano Molding Company, LLC, L+750, 1.00% LIBOR Floor, 5/12/2021(n) | 2 Month LIBOR | Consumer Goods: Non-Durable | 8,818 | 8,754 | 8,501 | ||||||||
PSC Industrial Holdings Corp., L+475, 1.00% LIBOR Floor, 12/5/2020(o) | 3 Month LIBOR | Services: Business | 4,888 | 4,644 | 4,692 | ||||||||
Retriever Medical/Dental Payments LLC, L+475, 1.00% LIBOR Floor, 2/3/2023 | 3 Month LIBOR | Services: Business | 5,000 | 4,892 | 4,888 | ||||||||
Rimini Street, Inc., 15.00%, 6/24/2020(m)(s) | None | High Tech Industries | 19,695 | 19,504 | 19,300 | ||||||||
Russell Investments US Institutional Holdco, Inc., L+575, 1.00% LIBOR Floor, 6/1/2023(o) | 1 Month LIBOR | Banking, Finance, Insurance & Real Estate | 3,990 | 4,047 | 4,051 | ||||||||
SG Acquisition, Inc., L+500, 1.00% LIBOR Floor, 3/29/2024(i)(o) | 3 Month LIBOR | Banking, Finance, Insurance & Real Estate | 3,545 | 3,510 | 3,519 | ||||||||
Scientific Games International, Inc., L+400, 0.75% LIBOR Floor, 10/1/2021(h)(o) | 2 Month LIBOR | Hotel, Gaming & Leisure | 8,266 | 8,365 | 8,380 | ||||||||
Sequoia Healthcare Management, LLC, 16.00%, 7/17/2019(n)(s) | 1 Month LIBOR | Healthcare & Pharmaceuticals | 6,327 | 6,237 | 6,216 | ||||||||
Shift PPC LLC, L+600, 1.00% LIBOR Floor, 12/22/2021 | 1 Month LIBOR | High Tech Industries | 4,941 | 4,825 | 4,817 | ||||||||
SI Organization, Inc., L+475, 1.00% LIBOR Floor, 11/23/2019(o) | 3 Month LIBOR | Services: Business | 7,734 | 7,846 | 7,832 | ||||||||
SmartBear Software Inc., L+750, 1.00% LIBOR Floor, 12/30/2020(n) | 3 Month LIBOR | High Tech Industries | 18,470 | 18,172 | 18,608 | ||||||||
Southcross Holdings Borrower LP, 9.00%, 4/13/2023(s) | None | Energy: Oil & Gas | 174 | 153 | 157 | ||||||||
Spinal USA, Inc. / Precision Medical Inc., L+950, 1.00% LIBOR Floor, 1/21/2020(n) | 3 Month LIBOR | Healthcare & Pharmaceuticals | 12,250 | 12,173 | 12,128 | ||||||||
Spinal USA, Inc. / Precision Medical Inc., L+950, 1.00% LIBOR Floor, 7/21/2020(s) | 3 Month LIBOR | Healthcare & Pharmaceuticals | 252 | 250 | 250 | ||||||||
Sprint Industrial Holdings, LLC, L+575, 1.25% LIBOR Floor, 5/14/2019(n) | 3 Month LIBOR | Energy: Oil & Gas | 7,287 | 6,873 | 5,866 | ||||||||
STG-Fairway Acquisitions, Inc., L+525, 1.00% LIBOR Floor, 6/30/2022(o) | 3 Month LIBOR | Services: Business | 3,929 | 3,811 | 3,801 | ||||||||
Studio Movie Grill Holdings, LLC, L+725, 1.00% LIBOR Floor, 9/30/2020(e)(n) | 3 Month LIBOR | Hotel, Gaming & Leisure | 15,143 | 15,013 | 15,143 | ||||||||
Survey Sampling International, LLC, L+500, 1.00% LIBOR Floor, 12/16/2020(o) | 3 Month LIBOR | Services: Business | 7,840 | 7,879 | 7,879 | ||||||||
Telestream Holdings Corp., L+677, 1.00% LIBOR Floor, 1/15/2020(j)(n) | 3 Month LIBOR | High Tech Industries | 8,706 | 8,496 | 8,531 | ||||||||
Tenere Inc., L+1000, 1.00% LIBOR Floor, 12/23/2021(n) | 3 Month LIBOR | Capital Equipment | 31,920 | 31,348 | 31,323 | ||||||||
Therapure Biopharma Inc., L+875, 0.50% LIBOR Floor, 12/1/2021(h) | 1 Month LIBOR | Healthcare & Pharmaceuticals | 15,000 | 14,928 | 15,225 | ||||||||
TIBCO Software Inc., L+550, 1.00% LIBOR Floor, 12/4/2020(o) | 1 Month LIBOR | High Tech Industries | 17,168 | 17,339 | 17,382 | ||||||||
Vince, LLC, L+500, 1.00% LIBOR Floor, 11/27/2019(h)(o) | 3 Month LIBOR | Retail | 1,127 | 1,071 | 1,070 | ||||||||
VRC Companies, LLC, L+650, 1.00% LIBOR Floor, 3/31/2023 | 6 Month LIBOR | Services: Business | 1,512 | 1,478 | 1,478 | ||||||||
WD Wolverine Holdings, LLC, L+550, 1.00% LIBOR Floor, 8/16/2022(o) | 3 Month LIBOR | Healthcare & Pharmaceuticals | 12,500 | 12,226 | 12,211 | ||||||||
Western Dental Services, Inc., L+650, 1.00% LIBOR Floor, 11/1/2018(o) | 1 Month LIBOR | Healthcare & Pharmaceuticals | 5,586 | 5,573 | 5,579 | ||||||||
Worley Claims Services, LLC, L+800, 1.00% LIBOR Floor, 10/31/2020(n) | 1 Month LIBOR | Services: Business | 20,064 | 19,885 | 19,763 | ||||||||
Total Senior Secured First Lien Debt | 872,344 | 866,480 | |||||||||||
See accompanying notes to consolidated financial statements.
7
CĪON Investment Corporation
Consolidated Schedule of Investments (unaudited)
March 31, 2017
(in thousands)
Portfolio Company(a) | Index Rate(b) | Industry | Principal/ Par Amount/ Units(d) | Cost(r) | Fair Value(c) | |||||||||
Senior Secured Second Lien Debt - 43.9% | ||||||||||||||
ABG Intermediate Holdings 2 LLC, L+850, 1.00% LIBOR Floor, 5/27/2022(m)(n) | 3 Month LIBOR | Retail | 18,666 | 18,375 | 18,945 | |||||||||
Access CIG, LLC, L+875, 1.00% LIBOR Floor, 10/17/2022(m) | 3 Month LIBOR | Services: Business | 16,030 | 15,473 | 15,549 | |||||||||
ALM Media, LLC, L+800, 1.00% LIBOR Floor, 7/30/2021(n) | 3 Month LIBOR | Media: Advertising, Printing & Publishing | 10,344 | 10,214 | 9,568 | |||||||||
American Residential Services LLC, L+800, 1.00% LIBOR Floor, 12/31/2021(n) | 3 Month LIBOR | Construction & Building | 4,933 | 4,893 | 4,958 | |||||||||
Asurion, LLC, L+750, 1.00% LIBOR Floor, 3/3/2021(o) | 1 Month LIBOR | Services: Consumer | 7,891 | 7,996 | 8,006 | |||||||||
Confie Seguros Holding II Co., L+900, 1.25% LIBOR Floor, 5/8/2019 | 3 Month LIBOR | Banking, Finance, Insurance & Real Estate | 13,827 | 13,413 | 13,775 | |||||||||
Conisus, LLC, L+875, 1.00% LIBOR Floor, 6/23/2021 | 3 Month LIBOR | Healthcare & Pharmaceuticals | 11,750 | 9,687 | 8,930 | |||||||||
Drew Marine Group, Inc., L+700, 1.00% LIBOR Floor, 5/19/2021(h)(n) | 3 Month LIBOR | Chemicals, Plastics & Rubber | 9,500 | 9,461 | 9,215 | |||||||||
Elements Behavioral Health, Inc., L+1200, 1.00% LIBOR Floor, 2/11/2020(s) | 3 Month LIBOR | Healthcare & Pharmaceuticals | 5,891 | 5,859 | 4,889 | |||||||||
Emerald 3 Ltd., L+700, 1.00% LIBOR Floor, 5/16/2022(h)(n) | 3 Month LIBOR | Environmental Industries | 3,000 | 2,979 | 2,738 | |||||||||
Evergreen Skills Lux S.À.R.L., L+825, 1.00% LIBOR Floor, 4/28/2022(h) | 1 Month LIBOR | High Tech Industries | 10,000 | 6,974 | 6,906 | |||||||||
Flexera Software LLC, L+700, 1.00% LIBOR Floor, 4/2/2021 | 1 Month LIBOR | High Tech Industries | 9,385 | 9,140 | 9,362 | |||||||||
Genex Holdings, Inc., L+775, 1.00% LIBOR Floor, 5/30/2022(n) | 1 Month LIBOR | Services: Business | 11,410 | 11,331 | 11,253 | |||||||||
Global Tel*Link Corp., L+775, 1.25% LIBOR Floor, 11/23/2020 | 3 Month LIBOR | Telecommunications | 9,500 | 9,491 | 9,488 | |||||||||
GOBP Holdings, Inc., L+825, 1.00% LIBOR Floor, 10/21/2022(o) | 3 Month LIBOR | Retail | 4,000 | 4,022 | 4,015 | |||||||||
Institutional Shareholder Services Inc., L+850, 1.00% LIBOR Floor, 4/30/2022(n) | 3 Month LIBOR | Services: Business | 10,648 | 10,540 | 10,755 | |||||||||
Mergermarket USA, Inc., L+650, 1.00% LIBOR Floor, 2/4/2022(n)(o) | 3 Month LIBOR | Services: Business | 10,380 | 10,277 | 10,302 | |||||||||
Ministry Brands, LLC, L+925, 1.00% LIBOR Floor, 6/2/2023(n) | 1 Month LIBOR | Services: Business | 7,000 | 6,900 | 6,930 | |||||||||
Mississippi Sand, LLC, L+1000, 1.00% LIBOR Floor, 11/21/2019 | 3 Month LIBOR | Metals & Mining | 13,196 | 10,979 | 11,712 | |||||||||
Mitchell International, Inc., L+750, 1.00% LIBOR Floor, 10/11/2021(m)(n) | 3 Month LIBOR | High Tech Industries | 14,909 | 14,496 | 15,015 | |||||||||
MSC.Software Corp., L+750, 1.00% LIBOR Floor, 6/1/2021(m) | 1 Month LIBOR | High Tech Industries | 15,000 | 14,840 | 15,019 | |||||||||
MWI Holdings, Inc., L+925, 1.00% LIBOR Floor, 12/28/2020(n) | 3 Month LIBOR | Construction & Building | 10,000 | 9,788 | 10,050 | |||||||||
Navex Global, Inc., L+875, 1.00% LIBOR Floor, 11/18/2022(m)(n) | 6 Month LIBOR | High Tech Industries | 10,278 | 10,149 | 10,227 | |||||||||
Niacet Corp., E+875, 1.00% EURIBOR Floor, 8/1/2024(h) | 3 Month EURIBOR | Chemicals, Plastics & Rubber | € | 7,489 | 7,927 | 7,819 | ||||||||
Onex Carestream Finance LP, L+850, 1.00% LIBOR Floor, 12/7/2019(o) | 3 Month LIBOR | Healthcare & Pharmaceuticals | 13,636 | 12,264 | 12,289 | |||||||||
Onex TSG Holdings II Corp., L+850, 1.00% LIBOR Floor, 7/31/2023(n) | 1 Month LIBOR | Healthcare & Pharmaceuticals | 12,249 | 12,140 | 12,111 | |||||||||
Patterson Medical Supply, Inc., L+850, 1.00% LIBOR Floor, 8/28/2023(n) | 2 Month LIBOR | Healthcare & Pharmaceuticals | 13,500 | 13,380 | 13,365 | |||||||||
Pelican Products, Inc., L+825, 1.00% LIBOR Floor, 4/11/2021(m)(o) | 3 Month LIBOR | Chemicals, Plastics & Rubber | 11,469 | 11,449 | 11,426 | |||||||||
PetroChoice Holdings, Inc., L+875, 1.00% LIBOR Floor, 8/21/2023(n) | 1 Month LIBOR | Chemicals, Plastics & Rubber | 15,000 | 14,738 | 14,738 | |||||||||
PetVet Care Centers, LLC, L+850, 1.00% LIBOR Floor, 6/17/2021(n) | 3 Month LIBOR | Healthcare & Pharmaceuticals | 13,500 | 13,114 | 13,230 | |||||||||
PFS Holding Corp., L+725, 1.00% LIBOR Floor, 1/31/2022(o) | 1 Month LIBOR | Retail | 4,998 | 4,652 | 4,651 | |||||||||
Premiere Global Services, Inc., L+950, 1.00% LIBOR Floor, 6/6/2022(n) | 3 Month LIBOR | Telecommunications | 3,000 | 2,886 | 2,940 | |||||||||
PSC Industrial Holdings Corp., L+825, 1.00% LIBOR Floor, 12/5/2021(n) | 3 Month LIBOR | Services: Business | 10,000 | 9,849 | 9,350 | |||||||||
Securus Technologies Holdings, Inc., L+775, 1.25% LIBOR Floor, 4/30/2021(o) | 3 Month LIBOR | Telecommunications | 5,500 | 5,484 | 5,527 | |||||||||
SMG, L+825, 1.00% LIBOR Floor, 2/27/2021(n) | 3 Month LIBOR | Hotel, Gaming & Leisure | 6,142 | 6,142 | 6,134 | |||||||||
Sterling Midco Holdings, Inc., L+775, 1.00% LIBOR Floor, 6/19/2023(n) | 3 Month LIBOR | Services: Business | 10,462 | 10,434 | 10,305 | |||||||||
See accompanying notes to consolidated financial statements.
8
CĪON Investment Corporation
Consolidated Schedule of Investments (unaudited)
March 31, 2017
(in thousands)
Portfolio Company(a) | Index Rate(b) | Industry | Principal/ Par Amount/ Units(d) | Cost(r) | Fair Value(c) | ||||||||
STG-Fairway Acquisitions, Inc., L+925, 1.00% LIBOR Floor, 6/30/2023(n) | 3 Month LIBOR | Services: Business | 10,000 | 9,872 | 9,775 | ||||||||
Survey Sampling International, LLC, L+900, 1.00% LIBOR Floor, 12/16/2021(m) | 3 Month LIBOR | Services: Business | 15,000 | 14,773 | 14,700 | ||||||||
Telecommunications Management, LLC, L+800, 1.00% LIBOR Floor, 10/30/2020(n) | 3 Month LIBOR | Media: Broadcasting & Subscription | 1,606 | 1,575 | 1,614 | ||||||||
TexOak Petro Holdings LLC, 8.00%, 12/29/2019(s) | None | Energy: Oil & Gas | 6,852 | 1,820 | 2,929 | ||||||||
TMK Hawk Parent, Corp., L+750, 1.00% LIBOR Floor, 10/1/2022(n) | 1 Month LIBOR | Beverage, Food & Tobacco | 15,000 | 14,885 | 14,925 | ||||||||
TouchTunes Interactive Networks, Inc., L+825, 1.00% LIBOR Floor, 5/29/2022 | 3 Month LIBOR | Hotel, Gaming & Leisure | 6,000 | 5,945 | 5,925 | ||||||||
U.S. Renal Care, Inc., L+800, 1.00% LIBOR Floor, 12/29/2023(n) | 3 Month LIBOR | Healthcare & Pharmaceuticals | 10,000 | 9,824 | 9,000 | ||||||||
Wand Intermediate I LP, L+725, 1.00% LIBOR Floor, 9/19/2022(n) | 3 Month LIBOR | Automotive | 16,000 | 15,875 | 16,120 | ||||||||
Winebow Holdings, Inc., L+750, 1.00% LIBOR Floor, 1/2/2022(n) | 1 Month LIBOR | Beverage, Food & Tobacco | 12,823 | 12,555 | 12,182 | ||||||||
Zywave Inc., L+900, 1.00% LIBOR Floor, 11/17/2023 | 3 Month LIBOR | High Tech Industries | 5,000 | 4,928 | 4,975 | ||||||||
Total Senior Secured Second Lien Debt | 443,788 | 443,637 | |||||||||||
Collateralized Securities and Structured Products - Debt - 3.8% | |||||||||||||
Deutsche Bank AG Frankfurt CRAFT 2013-1A Class Credit Linked Note, L+925, 4/17/2020(h) | 3 Month LIBOR | Diversified Financials | 2,000 | 2,020 | 2,000 | ||||||||
Deutsche Bank AG Frankfurt CRAFT 2013-1X Class Credit Linked Note, L+925, 4/17/2020(h) | 3 Month LIBOR | Diversified Financials | 610 | 616 | 610 | ||||||||
Deutsche Bank AG Frankfurt CRAFT 2014-1 Class Credit Linked Note, L+965, 5/15/2019(h) | 3 Month LIBOR | Diversified Financials | 5,400 | 5,400 | 5,314 | ||||||||
Deutsche Bank AG Frankfurt CRAFT 2015-2 Class Credit Linked Note, L+925, 1/16/2022(h) | 3 Month LIBOR | Diversified Financials | 15,500 | 15,500 | 15,136 | ||||||||
Great Lakes CLO 2014-1, Ltd. Class E Notes, L+525, 4/15/2025(g)(h) | 3 Month LIBOR | Diversified Financials | 5,000 | 4,626 | 4,518 | ||||||||
Ivy Hill Middle Market Credit Fund VII, Ltd. Class E Notes, L+565, 10/20/2025(g)(h) | 3 Month LIBOR | Diversified Financials | 2,000 | 1,881 | 1,852 | ||||||||
JFIN CLO 2014, Ltd. Class E Notes, L+500, 4/20/2025(g)(h) | 3 Month LIBOR | Diversified Financials | 2,500 | 2,350 | 2,335 | ||||||||
NXT Capital CLO 2014-1, LLC Class E Notes, L+550, 4/23/2026(g)(h) | 3 Month LIBOR | Diversified Financials | 7,500 | 7,105 | 6,821 | ||||||||
Total Collateralized Securities and Structured Products - Debt | 39,498 | 38,586 | |||||||||||
Collateralized Securities and Structured Products - Equity - 3.1% | |||||||||||||
Anchorage Capital CLO 2012-1, Ltd. Subordinated Notes, 7.45% Estimated Yield, 1/13/2025(h) | (f) | Diversified Financials | 4,000 | 2,787 | 2,402 | ||||||||
APIDOS CLO XVI Subordinated Notes, 0.00% Estimated Yield, 1/19/2025(h) | (f) | Diversified Financials | 9,000 | 4,470 | 4,071 | ||||||||
CENT CLO 19 Ltd. Subordinated Notes, 10.50% Estimated Yield, 10/29/2025(h) | (f) | Diversified Financials | 2,000 | 1,308 | 1,154 | ||||||||
Dryden XXIII Senior Loan Fund Subordinated Notes, 0.00% Estimated Yield, 7/17/2023(h) | (f) | Diversified Financials | 9,250 | 1,308 | — | ||||||||
Galaxy XV CLO Ltd. Class A Subordinated Notes, 13.94% Estimated Yield, 4/15/2025(h) | (f) | Diversified Financials | 4,000 | 2,347 | 2,367 | ||||||||
Ivy Hill Middle Market Credit Fund VII, Ltd. Subordinated Notes, 10.29% Estimated Yield, 10/20/2025(h) | (f) | Diversified Financials | 2,000 | 1,626 | 1,509 | ||||||||
Ivy Hill Middle Market Credit Fund VIII, Ltd. Subordinated Loan, 10.35% Estimated Yield, 2/2/2026(e)(h) | (f) | Diversified Financials | 10,000 | 9,937 | 9,762 | ||||||||
Ivy Hill Middle Market Credit Fund IX, Ltd. Subordinated Notes, 15.54% Estimated Yield, 10/18/2025(h) | (f) | Diversified Financials | 8,146 | 5,998 | 6,179 | ||||||||
Ivy Hill Middle Market Credit Fund X, Ltd. Subordinated Notes, 11.20% Estimated Yield, 7/24/2027(h) | (f) | Diversified Financials | 4,760 | 3,879 | 3,715 | ||||||||
Total Collateralized Securities and Structured Products - Equity | 33,660 | 31,159 | |||||||||||
Unsecured Debt - 0.4% | |||||||||||||
Radio One, Inc., 9.25%, 2/15/2020 | None | Media: Broadcasting & Subscription | 4,000 | 3,836 | 3,890 | ||||||||
Total Unsecured Debt | 3,836 | 3,890 | |||||||||||
Equity - 0.4% | |||||||||||||
Mooregate ITC Acquisition, LLC, Class A Units(p) | High Tech Industries | 500 Units | 563 | 550 | |||||||||
See accompanying notes to consolidated financial statements.
9
CĪON Investment Corporation
Consolidated Schedule of Investments (unaudited)
March 31, 2017
(in thousands)
Portfolio Company(a) | Industry | Principal/ Par Amount/ Units(d) | Cost(r) | Fair Value(c) | ||||||||
NS NWN Acquisition, LLC(p) | High Tech Industries | 346 Units | 393 | 338 | ||||||||
NSG Co-Invest (Bermuda), LP(h)(p) | Consumer Goods: Durable | 1,575 Units | 1,000 | 1,100 | ||||||||
Southcross Holdings GP, LLC, Units(p) | Energy: Oil & Gas | 188 Units | — | — | ||||||||
Southcross Holdings LP, Class A-II Units(p) | Energy: Oil & Gas | 188 Units | 75 | 82 | ||||||||
Speed Commerce Investment Part, LLC(p) | High Tech Industries | 629 Units | 2,640 | 1,500 | ||||||||
Tenere Inc. Warrant(p) | Capital Equipment | N/A | 161 | 166 | ||||||||
TexOak Petro Holdings, LLC(p) | Energy: Oil & Gas | 60,000 Units | — | — | ||||||||
Total Equity | 4,832 | 3,736 | ||||||||||
Short Term Investments - 6.9%(k) | ||||||||||||
First American Treasury Obligations Fund, Class Z Shares, 0.61%(l) | 70,300 | 70,300 | ||||||||||
Total Short Term Investments | 70,300 | 70,300 | ||||||||||
TOTAL INVESTMENTS - 144.3% | $ | 1,468,258 | 1,457,788 | |||||||||
LIABILITIES IN EXCESS OF OTHER ASSETS - (44.3%) | (447,778 | ) | ||||||||||
NET ASSETS - 100% | $ | 1,010,010 | ||||||||||
Counterparty | Instrument | Maturity Date | Nominal Amount (d) | Cost(p) | Fair Value(c) | |||||||||
Derivative Asset - 0.0% | ||||||||||||||
Total Return Swap | ||||||||||||||
Citibank, N.A. | See Note 7 | 4/18/2017 | $ | 13,790 | N/A | $ | 134 | |||||||
a. | All of the Company’s investments are issued by eligible U.S. portfolio companies, as defined in the Investment Company Act of 1940, as amended, or the 1940 Act, except for investments specifically identified as non-qualifying per note h. below. Except for CION / Capitala Senior Loan Fund I, LLC, or CCSLF, the Company does not control and is not an affiliate of any of the portfolio companies in its investment portfolio. Unless specifically identified in note s. below, investments do not contain a paid-in-kind, or PIK, interest provision. |
b. | The 1, 2, 3, and 6 month London Interbank Offered Rate, or LIBOR, rates were 0.98%, 1.03%, 1.15%, and 1.42%, respectively, as of March 31, 2017. The actual LIBOR rate for each loan listed may not be the applicable LIBOR rate as of March 31, 2017, as the loan may have been priced or repriced based on a LIBOR rate prior to or subsequent to March 31, 2017. The 3 month Euro Interbank Offered Rate, or EURIBOR, rate was (0.36%) as of March 31, 2017. |
c. | Fair value determined in good faith by the Company’s board of directors (see Note 9). |
d. | Denominated in U.S. dollars unless otherwise noted. |
e. | As discussed in Note 11, on March 31, 2017, the Company was committed, upon the satisfaction of certain conditions, to fund an additional $4,127 and $1,111 to Studio Movie Grill Holdings, LLC and Ivy Hill Middle Market Credit Fund VIII, Ltd., respectively. On May 10, 2017, the Company was committed, upon the satisfaction of certain conditions, to fund an additional $4,127, $1,111, and $180 to Studio Movie Grill Holdings, LLC, Ivy Hill Middle Market Credit Fund VIII, Ltd., and Ministry Brands, LLC, respectively. |
f. | The CLO subordinated notes are considered equity positions in the CLO vehicles and are not rated. Equity investments are entitled to recurring distributions, which are generally equal to the remaining cash flow of the payments made by the underlying vehicle's securities less contractual payments to debt holders and expenses. The estimated yield indicated is based upon a current projection of the amount and timing of these recurring distributions and the estimated amount of repayment of principal upon termination. Such projections are periodically reviewed and adjusted, and the estimated yield may not ultimately be realized. |
g. | Great Lakes CLO 2014-1 Class E Notes, Ivy Hill Middle Market Credit Fund VII Class E Notes and NXT Capital CLO 2014-1 Class E Notes were rated Ba2 on Moody's credit scale as of March 31, 2017. JFIN CLO 2014 Class E Notes were rated BB on S&P's credit scale as of March 31, 2017. |
h. | The investment or a portion thereof is not a qualifying asset under the 1940 Act. A business development company may not acquire any asset other than qualifying assets, unless, at the time the acquisition is made, qualifying assets represent at least 70% of the company’s total assets as defined under Section 55 of the 1940 Act. As of March 31, 2017, 88.9% of the Company’s total assets represented qualifying assets. In addition, as described in Note 7, the Company calculates its compliance with the qualifying asset test on a “look through” basis by treating each loan underlying the total return swap as either a qualifying asset or non-qualifying asset based on whether the obligor is an eligible portfolio company. On this basis, 88.9% of the Company’s total assets represented qualifying assets as of March 31, 2017. |
i. | Position or a portion thereof unsettled as of March 31, 2017. |
See accompanying notes to consolidated financial statements.
10
CĪON Investment Corporation
Consolidated Schedule of Investments (unaudited)
March 31, 2017
(in thousands)
j. | In addition to the interest earned based on the stated interest rate of this loan, which is the amount reflected in this schedule, the Company may be entitled to receive additional amounts as a result of an arrangement between the Company and other lenders in the syndication in exchange for lower payment priority. |
k. | Short term investments represent an investment in a fund that invests in highly liquid investments with average original maturity dates of three months or less. |
l. | 7-day effective yield as of March 31, 2017. |
m. | Security or a portion thereof was pledged as collateral supporting the amounts outstanding, if any, under the revolving credit facility with East West Bank as of March 31, 2017 (see Note 8). |
n. | Investment or a portion thereof held within the Company’s wholly-owned consolidated subsidiary, 34th Street Funding, LLC, or 34th Street, and was pledged as collateral supporting the amounts outstanding under the credit facility with JPMorgan Chase Bank, National Association, or JPM, as of March 31, 2017 (see Note 8). |
o. | Investment or a portion thereof held within the Company’s wholly-owned consolidated subsidiary, Flatiron Funding II, LLC, or Flatiron Funding II, and was pledged as collateral supporting the amounts outstanding under the credit facility with Citibank N.A., or Citibank, as of March 31, 2017 (see Note 8). |
p. | Non-income producing security. |
q. | Investment was on non-accrual status as of March 31, 2017. |
r. | Represents amortized cost for debt securities and cost for equity investments. |
s. | For the three months ended March 31, 2017, the following investments contain a PIK interest provision whereby the issuer has either the option or the obligation to make interest payments with the issuance of additional securities: |
Interest Rate | Interest Amount | |||||||||||||||||||
Portfolio Company | Investment Type | Cash | PIK | All-in-Rate | Cash | PIK | Total | |||||||||||||
Elements Behavioral Health, Inc. | Senior Secured Second Lien Debt | — | 13.00% | 13.00% | $ | — | $ | 188 | $ | 188 | ||||||||||
Petroflow Energy Corp. | Senior Secured First Lien Debt | 3.00% | 6.00% | 9.00% | $ | 37 | $ | 74 | $ | 111 | ||||||||||
Rimini Street, Inc. | Senior Secured First Lien Debt | 12.00% | 3.00% | 15.00% | $ | 580 | $ | 143 | $ | 723 | ||||||||||
Sequoia Healthcare Management, LLC | Senior Secured First Lien Debt | 12.00% | 4.00% | 16.00% | $ | 153 | $ | 65 | $ | 218 | ||||||||||
Southcross Holdings Borrower LP | Senior Secured First Lien Debt | 3.50% | 5.50% | 9.00% | $ | — | $ | 3 | $ | 3 | ||||||||||
Spinal USA, Inc. / Precision Medical Inc. | Senior Secured First Lien Debt | — | 10.50% | 10.50% | $ | — | $ | 130 | $ | 130 | ||||||||||
TexOak Petro Holdings LLC | Senior Secured Second Lien Debt | — | 8.00% | 8.00% | $ | 10 | $ | 126 | $ | 136 | ||||||||||
See accompanying notes to consolidated financial statements.
11
CĪON Investment Corporation
Consolidated Schedule of Investments
December 31, 2016
(in thousands)
Portfolio Company(a) | Index Rate(b) | Industry | Principal/ Par Amount/ Units(d) | Cost(p) | Fair Value(c) | |||||||||||
Senior Secured First Lien Debt - 49.0% | ||||||||||||||||
AbelConn, LLC / Atrenne Computing Solutions, LLC / Airco Industries, LLC, L+850, 1.00% LIBOR Floor, 7/17/2019(j) | 3 Month LIBOR | Aerospace & Defense | $ | 22,112 | $ | 21,702 | $ | 21,780 | ||||||||
Adams Publishing Group, LLC, L+700, 1.00% LIBOR Floor, 11/3/2020(n) | 3 Month LIBOR | Media: Advertising, Printing & Publishing | 3,892 | 3,818 | 3,833 | |||||||||||
American Clinical Solutions LLC, L+950, 1.00% LIBOR Floor, 6/11/2020 | 3 Month LIBOR | Healthcare & Pharmaceuticals | 9,034 | 8,908 | 8,492 | |||||||||||
American Media, Inc., L+750, 1.00% LIBOR Floor, 8/24/2020(n) | 3 Month LIBOR | Media: Advertising, Printing & Publishing | 11,467 | 11,150 | 11,123 | |||||||||||
American Media, Inc., 0.50% Unfunded, 8/24/2020(e) | None | Media: Advertising, Printing & Publishing | 505 | (15 | ) | (15 | ) | |||||||||
American Media, Inc., 7.50%, 8/24/2020(e) | None | Media: Advertising, Printing & Publishing | 206 | (6 | ) | (6 | ) | |||||||||
American Teleconferencing Services, Ltd., L+650, 1.00% LIBOR Floor, 12/8/2021(n) | 3 Month LIBOR | Telecommunications | 19,248 | 17,475 | 18,863 | |||||||||||
AMPORTS, Inc., L+500, 1.00% LIBOR Floor, 5/19/2020(j) | 3 Month LIBOR | Automotive | 19,100 | 18,743 | 18,718 | |||||||||||
Blue Ribbon, LLC, L+400, 1.00% LIBOR Floor, 11/15/2021(i) | 3 Month LIBOR | Beverage, Food & Tobacco | 9,975 | 9,975 | 9,972 | |||||||||||
CF Entertainment Inc., L+1100, 1.00% LIBOR Floor, 6/26/2020(n) | 3 Month LIBOR | Media: Diversified & Production | 17,094 | 17,057 | 17,094 | |||||||||||
Dodge Data & Analytics, LLC / Skyline Data News and Analytics, LLC, L+875, 1.00% LIBOR Floor, 10/31/2019(n) | 3 Month LIBOR | Construction & Building | 10,387 | 10,241 | 10,218 | |||||||||||
ECI Acquisition Holdings, Inc., L+625, 1.00% LIBOR Floor, 3/11/2019(n) | 3 Month LIBOR | High Tech Industries | 8,517 | 8,493 | 8,517 | |||||||||||
Elemica, Inc., L+800, 1.00% LIBOR Floor, 7/7/2021(n) | 1 Month LIBOR | High Tech Industries | 17,413 | 17,005 | 16,977 | |||||||||||
Elemica, Inc., 0.50% Unfunded, 7/7/2021(e) | None | High Tech Industries | 2,500 | (57 | ) | (62 | ) | |||||||||
EnTrans International, LLC, L+750, 1.00% LIBOR Floor, 6/4/2020 | 3 Month LIBOR | Capital Equipment | 13,594 | 9,977 | 10,331 | |||||||||||
F+W Media, Inc., L+950, 1.25% LIBOR Floor, 6/30/2019(n) | 3 Month LIBOR | Media: Diversified & Production | 7,280 | 7,092 | 6,006 | |||||||||||
Forbes Media LLC, L+675, 1.00% LIBOR Floor, 9/12/2019(j) | 1 Month LIBOR | Media: Advertising, Printing & Publishing | 15,000 | 14,621 | 14,400 | |||||||||||
Ignite Restaurant Group, Inc., L+700, 1.00% LIBOR Floor, 2/13/2019(n) | 3 Month LIBOR | Beverage, Food & Tobacco | 10,482 | 10,400 | 10,167 | |||||||||||
Infinity Sales Group, LLC, L+1050, 1.00% LIBOR Floor, 11/21/2018(n) | 1 Month LIBOR | Services: Business | 8,214 | 7,550 | 7,372 | |||||||||||
Infogroup Inc., L+550, 1.50% LIBOR Floor, 5/26/2018(n) | 3 Month LIBOR | Media: Advertising, Printing & Publishing | 15,578 | 15,277 | 15,451 | |||||||||||
InterGen N.V., L+450, 1.00% LIBOR Floor, 6/12/2020(h)(i) | 3 Month LIBOR | Energy: Electricity | 1,182 | 1,156 | 1,153 | |||||||||||
Intertain Group Ltd., L+650, 1.00% LIBOR Floor, 4/8/2022(h)(n) | 3 Month LIBOR | Hotel, Gaming & Leisure | 1,765 | 1,736 | 1,780 | |||||||||||
Ipsen International GmbH, L+800, 1.00% LIBOR Floor, 9/30/2019(h)(j) | 1 Month LIBOR | Capital Equipment | 1,422 | 1,429 | 1,429 | |||||||||||
Ipsen, Inc., L+700, 1.00% LIBOR Floor, 9/30/2019(j) | 1 Month LIBOR | Capital Equipment | 8,095 | 8,002 | 8,035 | |||||||||||
ITC Service Group Acquisition LLC, L+950, 0.50% LIBOR Floor, 5/26/2021(j) | 1 Month LIBOR | High Tech Industries | 11,250 | 11,035 | 11,081 | |||||||||||
KPC Health Care, Inc., L+925, 1.00% LIBOR Floor, 8/28/2020(n) | 3 Month LIBOR | Healthcare & Pharmaceuticals | 7,544 | 7,401 | 7,809 | |||||||||||
Labvantage Solutions Inc., L+800, 1.00% LIBOR Floor, 12/29/2020(n) | 3 Month LIBOR | High Tech Industries | 4,875 | 4,829 | 4,863 | |||||||||||
Labvantage Solutions Ltd., E+800, 1.00% EURIBOR Floor, 12/29/2020(h) | 3 Month EURIBOR | High Tech Industries | € | 4,495 | 5,005 | 4,728 | ||||||||||
Lift Brands, Inc., L+800, 1.00% LIBOR Floor, 12/23/2019(n) | 3 Month LIBOR | Services: Consumer | 9,548 | 9,438 | 9,477 | |||||||||||
Ministry Brands, LLC, L+500, 1.00% LIBOR Floor, 12/2/2022(e) | 3 Month LIBOR | Services: Business | 9,994 | 9,587 | 9,894 | |||||||||||
Nathan's Famous Inc., 10.00%, 3/15/2020(h)(n) | None | Beverage, Food & Tobacco | 6,000 | 6,000 | 6,540 | |||||||||||
Nextech Systems, LLC, L+725, 1.00% LIBOR Floor, 6/22/2021(j)(n) | 1 Month LIBOR | High Tech Industries | 15,642 | 15,062 | 15,330 | |||||||||||
NWN Acquisition Holding Company LLC, L+1000, 1.00% LIBOR Floor, 10/16/2020(j) | 3 Month LIBOR | High Tech Industries | 13,717 | 13,357 | 13,271 | |||||||||||
Pacific Coast Holding Investment LLC, L+970, 2.00% LIBOR Floor, 2/14/2017 | 1 Month LIBOR | Healthcare & Pharmaceuticals | 5,250 | 5,242 | 5,250 | |||||||||||
Petroflow Energy Corporation, L+800, 1.00% LIBOR Floor, 6/29/2019(q) | 3 Month LIBOR | Energy: Oil & Gas | 4,895 | 4,618 | 4,601 | |||||||||||
See accompanying notes to consolidated financial statements.
12
CĪON Investment Corporation
Consolidated Schedule of Investments
December 31, 2016
(in thousands)
Portfolio Company(a) | Index Rate(b) | Industry | Principal/ Par Amount/ Units(d) | Cost(p) | Fair Value(c) | ||||||||
Plano Molding Company, LLC, L+700, 1.00% LIBOR Floor, 5/12/2021(n) | 2 Month LIBOR | Consumer Goods: Non-Durable | 8,840 | 8,772 | 8,611 | ||||||||
Rimini Street, Inc., 15.00%, 6/24/2020(m)(q) | None | High Tech Industries | 19,822 | 19,556 | 19,426 | ||||||||
Sequoia Healthcare Management, LLC, 16.00%, 7/17/2019(n)(q) | None | Healthcare & Pharmaceuticals | 6,511 | 6,405 | 6,397 | ||||||||
Shift PPC LLC, L+600, 1.00% LIBOR Floor, 12/22/2021 | 3 Month LIBOR | High Tech Industries | 9,500 | 9,266 | 9,265 | ||||||||
SmartBear Software Inc., L+750, 1.00% LIBOR Floor, 12/30/2020(n) | 3 Month LIBOR | High Tech Industries | 18,588 | 18,271 | 18,727 | ||||||||
Southcross Holdings Borrower LP, 9.00%, 4/13/2023(q) | None | Energy: Oil & Gas | 172 | 151 | 135 | ||||||||
Spinal USA, Inc. / Precision Medical Inc., L+950, 1.00% LIBOR Floor, 1/21/2020(n) | 3 Month LIBOR | Healthcare & Pharmaceuticals | 12,281 | 12,194 | 12,158 | ||||||||
Spinal USA, Inc. / Precision Medical Inc., L+950, 1.00% LIBOR Floor, 7/21/2020(q) | 3 Month LIBOR | Healthcare & Pharmaceuticals | 128 | 126 | 127 | ||||||||
Sprint Industrial Holdings, LLC, L+575, 1.25% LIBOR Floor, 5/14/2019(n) | 3 Month LIBOR | Energy: Oil & Gas | 7,306 | 6,849 | 5,406 | ||||||||
Studio Movie Grill Holdings, LLC, L+725, 1.00% LIBOR Floor, 9/30/2020(e)(n) | 1 Month LIBOR | Hotel, Gaming & Leisure | 15,143 | 15,004 | 15,143 | ||||||||
Telestream Holdings Corp., L+677, 1.00% LIBOR Floor, 1/15/2020(j)(n) | 3 Month LIBOR | High Tech Industries | 7,154 | 7,027 | 7,011 | ||||||||
Tenere Inc., L+1000, 1.00% LIBOR Floor, 12/23/2021 | 3 Month LIBOR | Capital Equipment | 32,000 | 31,219 | 31,199 | ||||||||
Therapure Biopharma Inc., L+875, 0.50% LIBOR Floor, 12/1/2021(h) | 1 Month LIBOR | Healthcare & Pharmaceuticals | 15,000 | 14,925 | 14,925 | ||||||||
WD Wolverine Holdings, LLC, L+550, 1.00% LIBOR Floor, 10/17/2023(i) | 1 Month LIBOR | Healthcare & Pharmaceuticals | 2,000 | 1,960 | 1,946 | ||||||||
Worley Claims Services, LLC, L+800, 1.00% LIBOR Floor, 10/31/2020(n) | 1 Month LIBOR | Services: Business | 20,115 | 19,925 | 20,015 | ||||||||
Zywave Inc., L+500, 1.00% LIBOR Floor, 11/17/2022 | 3 Month LIBOR | High Tech Industries | 5,000 | 4,951 | 4,950 | ||||||||
Total Senior Secured First Lien Debt | 489,904 | 489,913 | |||||||||||
Senior Secured Second Lien Debt - 43.4% | |||||||||||||
ABG Intermediate Holdings 2 LLC, L+850, 1.00% LIBOR Floor, 5/27/2022(e)(m)(n) | 3 Month LIBOR | Retail | 18,666 | 18,365 | 18,852 | ||||||||
Access CIG, LLC, L+875, 1.00% LIBOR Floor, 10/17/2022(m) | 3 Month LIBOR | Services: Business | 16,030 | 15,460 | 15,549 | ||||||||
ALM Media, LLC, L+800, 1.00% LIBOR Floor, 7/30/2021(n) | 3 Month LIBOR | Media: Advertising, Printing & Publishing | 10,344 | 10,205 | 9,568 | ||||||||
American Residential Services LLC, L+800, 1.00% LIBOR Floor, 12/31/2021(n) | 3 Month LIBOR | Construction & Building | 4,933 | 4,889 | 4,983 | ||||||||
AmWINS Group, LLC, L+850, 1.00% LIBOR Floor, 9/4/2020(n) | 1 Month LIBOR | Banking, Finance, Insurance & Real Estate | 3,825 | 3,852 | 3,878 | ||||||||
Confie Seguros Holding II Co., L+900, 1.25% LIBOR Floor, 5/8/2019 | 1 Month LIBOR | Banking, Finance, Insurance & Real Estate | 13,827 | 13,365 | 13,758 | ||||||||
Conisus, LLC, L+875, 1.00% LIBOR Floor, 6/23/2021 | 3 Month LIBOR | Healthcare & Pharmaceuticals | 11,750 | 9,604 | 9,517 | ||||||||
Drew Marine Group, Inc., L+700, 1.00% LIBOR Floor, 5/19/2021(h) | 3 Month LIBOR | Chemicals, Plastics & Rubber | 9,500 | 9,460 | 9,120 | ||||||||
EISI LLC, L+850, 1.00% LIBOR Floor, 9/23/2020(m)(n) | 3 Month LIBOR | High Tech Industries | 20,000 | 19,761 | 19,400 | ||||||||
Elements Behavioral Health, Inc., L+1200, 1.00% LIBOR Floor, 2/11/2020(q) | 3 Month LIBOR | Healthcare & Pharmaceuticals | 5,701 | 5,668 | 4,561 | ||||||||
Emerald 3 Ltd., L+700, 1.00% LIBOR Floor, 5/16/2022(h)(n) | 3 Month LIBOR | Environmental Industries | 3,000 | 2,978 | 2,595 | ||||||||
Flexera Software LLC, L+700, 1.00% LIBOR Floor, 4/2/2021 | 1 Month LIBOR | High Tech Industries | 9,385 | 9,128 | 9,291 | ||||||||
Genex Holdings, Inc., L+775, 1.00% LIBOR Floor, 5/30/2022(n) | 1 Month LIBOR | Services: Business | 11,410 | 11,331 | 11,011 | ||||||||
Global Tel*Link Corp., L+775, 1.25% LIBOR Floor, 11/23/2020 | 3 Month LIBOR | Telecommunications | 9,500 | 9,488 | 9,254 | ||||||||
Infiltrator Water Technologies, LLC, L+875, 1.00% LIBOR Floor, 5/26/2023(n) | 3 Month LIBOR | Construction & Building | 13,917 | 13,732 | 13,986 | ||||||||
Institutional Shareholder Services Inc., L+850, 1.00% LIBOR Floor, 4/30/2022(i)(n) | 2 Month LIBOR | Services: Business | 10,648 | 10,534 | 10,542 | ||||||||
Mergermarket USA, Inc., L+650, 1.00% LIBOR Floor, 2/4/2022(n) | 3 Month LIBOR | Services: Business | 3,380 | 3,328 | 3,304 | ||||||||
Ministry Brands, LLC, L+925, 1.00% LIBOR Floor, 6/2/2023(e) | 3 Month LIBOR | Services: Business | 5,488 | 5,385 | 5,406 | ||||||||
Mississippi Sand, LLC, L+1000, 1.00% LIBOR Floor, 11/21/2019 | 3 Month LIBOR | Metals & Mining | 13,196 | 10,899 | 11,349 | ||||||||
See accompanying notes to consolidated financial statements.
13
CĪON Investment Corporation
Consolidated Schedule of Investments
December 31, 2016
(in thousands)
Portfolio Company(a) | Index Rate(b) | Industry | Principal/ Par Amount/ Units(d) | Cost(p) | Fair Value(c) | ||||||||
Mitchell International, Inc., L+750, 1.00% LIBOR Floor, 10/11/2021(m)(n) | 1 Month LIBOR | High Tech Industries | 14,909 | 14,476 | 14,825 | ||||||||
MSC.Software Corp., L+750, 1.00% LIBOR Floor, 6/1/2021(m) | 3 Month LIBOR | High Tech Industries | 15,000 | 14,832 | 15,019 | ||||||||
MWI Holdings, Inc., L+925, 1.00% LIBOR Floor, 12/28/2020(n) | 3 Month LIBOR | Construction & Building | 10,000 | 9,773 | 9,950 | ||||||||
Navex Global, Inc., L+875, 1.00% LIBOR Floor, 11/18/2022(m)(n) | 12 Month LIBOR | High Tech Industries | 16,245 | 16,031 | 15,920 | ||||||||
Onex TSG Holdings II Corp., L+850, 1.00% LIBOR Floor, 7/31/2023(n) | 3 Month LIBOR | Healthcare & Pharmaceuticals | 12,249 | 12,136 | 12,065 | ||||||||
Patterson Medical Supply, Inc., L+850, 1.00% LIBOR Floor, 8/28/2023(n) | 2 Month LIBOR | Healthcare & Pharmaceuticals | 13,500 | 13,378 | 13,095 | ||||||||
Pelican Products, Inc., L+825, 1.00% LIBOR Floor, 4/11/2021(m) | 3 Month LIBOR | Chemicals, Plastics & Rubber | 3,469 | 3,478 | 3,396 | ||||||||
PetroChoice Holdings, Inc., L+875, 1.00% LIBOR Floor, 8/21/2023(n) | 1 Month LIBOR | Chemicals, Plastics & Rubber | 15,000 | 14,729 | 14,737 | ||||||||
PetVet Care Centers, LLC, L+850, 1.00% LIBOR Floor, 6/17/2021 | 3 Month LIBOR | Healthcare & Pharmaceuticals | 13,500 | 13,097 | 13,095 | ||||||||
Pike Corp., L+850, 1.00% LIBOR Floor, 6/22/2022(n) | 1 Month LIBOR | Energy: Electricity | 12,500 | 12,354 | 12,562 | ||||||||
Premiere Global Services, Inc., L+950, 1.00% LIBOR Floor, 6/6/2022 | 3 Month LIBOR | Telecommunications | 3,000 | 2,882 | 2,895 | ||||||||
PSC Industrial Holdings Corp., L+825, 1.00% LIBOR Floor, 12/5/2021(n) | 3 Month LIBOR | Services: Business | 10,000 | 9,842 | 9,450 | ||||||||
Securus Technologies Holdings, Inc., L+775, 1.25% LIBOR Floor, 4/30/2021 | 3 Month LIBOR | Telecommunications | 4,500 | 4,479 | 4,399 | ||||||||
SMG, L+825, 1.00% LIBOR Floor, 2/27/2021(n) | 3 Month LIBOR | Hotel, Gaming & Leisure | 6,142 | 6,142 | 6,126 | ||||||||
Sterling Midco Holdings, Inc., L+775, 1.00% LIBOR Floor, 6/19/2023(n) | 3 Month LIBOR | Services: Business | 10,462 | 10,432 | 10,226 | ||||||||
STG-Fairway Acquisitions, Inc., L+925, 1.00% LIBOR Floor, 6/30/2023(n) | 3 Month LIBOR | Services: Business | 10,000 | 9,869 | 9,400 | ||||||||
Survey Sampling International, LLC, L+900, 1.00% LIBOR Floor, 12/16/2021(m) | 3 Month LIBOR | Services: Business | 15,000 | 14,763 | 14,700 | ||||||||
Telecommunications Management, LLC, L+800, 1.00% LIBOR Floor, 10/30/2020(n) | 3 Month LIBOR | Media: Broadcasting & Subscription | 1,606 | 1,573 | 1,564 | ||||||||
TexOak Petro Holdings LLC, 8.00%, 12/29/2019(q) | None | Energy: Oil & Gas | 6,728 | 1,549 | 2,590 | ||||||||
TMK Hawk Parent, Corp., L+750, 1.00% LIBOR Floor, 10/1/2022(n) | 3 Month LIBOR | Beverage, Food & Tobacco | 15,000 | 14,880 | 14,925 | ||||||||
TouchTunes Interactive Networks, Inc, L+825, 1.00% LIBOR Floor, 5/29/2022 | 3 Month LIBOR | Hotel, Gaming & Leisure | 6,000 | 5,943 | 5,925 | ||||||||
U.S. Renal Care, Inc., L+800, 1.00% LIBOR Floor, 12/29/2023(n) | 3 Month LIBOR | Healthcare & Pharmaceuticals | 10,000 | 9,819 | 8,900 | ||||||||
Wand Intermediate I LP, L+725, 1.00% LIBOR Floor, 9/19/2022(n) | 3 Month LIBOR | Automotive | 16,000 | 15,881 | 15,680 | ||||||||
Winebow Holdings, Inc., L+750, 1.00% LIBOR Floor, 1/2/2022(n) | 1 Month LIBOR | Beverage, Food & Tobacco | 12,823 | 12,544 | 12,054 | ||||||||
Zywave Inc., L+900, 1.00% LIBOR Floor, 11/17/2023 | 3 Month LIBOR | High Tech Industries | 5,000 | 4,926 | 4,925 | ||||||||
Total Senior Secured Second Lien Debt | 437,240 | 434,347 | |||||||||||
Collateralized Securities and Structured Products - Debt - 3.8% | |||||||||||||
Deutsche Bank AG Frankfurt CRAFT 2013-1A Class Credit Linked Note, L+925, 4/17/2020(h) | 3 Month LIBOR | Diversified Financials | 2,000 | 2,022 | 1,980 | ||||||||
Deutsche Bank AG Frankfurt CRAFT 2013-1X Class Credit Linked Note, L+925, 4/17/2020(h) | 3 Month LIBOR | Diversified Financials | 610 | 616 | 604 | ||||||||
Deutsche Bank AG Frankfurt CRAFT 2014-1 Class Credit Linked Note, L+965, 5/15/2019(h) | 3 Month LIBOR | Diversified Financials | 5,400 | 5,400 | 5,292 | ||||||||
Deutsche Bank AG Frankfurt CRAFT 2015-2 Class Credit Linked Note, L+925, 1/16/2022(h) | 3 Month LIBOR | Diversified Financials | 15,500 | 15,500 | 14,880 | ||||||||
Great Lakes CLO 2014-1, Ltd. Class E Notes, L+525, 4/15/2025(g)(h) | 3 Month LIBOR | Diversified Financials | 5,000 | 4,615 | 4,484 | ||||||||
Ivy Hill Middle Market Credit Fund VII, Ltd. Class E Notes, L+565, 10/20/2025(g)(h) | 3 Month LIBOR | Diversified Financials | 2,000 | 1,879 | 1,799 | ||||||||
JFIN CLO 2014, Ltd. Class E Notes, L+500, 4/20/2025(g)(h) | 3 Month LIBOR | Diversified Financials | 2,500 | 2,345 | 2,303 | ||||||||
NXT Capital CLO 2014-1, LLC Class E Notes, L+550, 4/23/2026(g)(h) | 3 Month LIBOR | Diversified Financials | 7,500 | 7,094 | 6,772 | ||||||||
Total Collateralized Securities and Structured Products - Debt | 39,471 | 38,114 | |||||||||||
See accompanying notes to consolidated financial statements.
14
CĪON Investment Corporation
Consolidated Schedule of Investments
December 31, 2016
(in thousands)
Portfolio Company(a) | Index Rate(b) | Industry | Principal/ Par Amount/ Units(d) | Cost(p) | Fair Value(c) | |||||||||
Collateralized Securities and Structured Products - Equity - 3.5% | ||||||||||||||
Anchorage Capital CLO 2012-1, Ltd. Subordinated Notes, 4.57% Estimated Yield, 1/13/2025(h) | (f) | Diversified Financials | 4,000 | 2,882 | 2,622 | |||||||||
APIDOS CLO XVI Subordinated Notes, 3.28% Estimated Yield, 1/19/2025(h) | (f) | Diversified Financials | 9,000 | 4,704 | 3,099 | |||||||||
CENT CLO 19 Ltd. Subordinated Notes, 8.68% Estimated Yield, 10/29/2025(h) | (f) | Diversified Financials | 2,000 | 1,330 | 1,182 | |||||||||
Dryden XXIII Senior Loan Fund Subordinated Notes, 1.40% Estimated Yield, 7/17/2023(h) | (f) | Diversified Financials | 9,250 | 4,726 | 4,135 | |||||||||
Galaxy XV CLO Ltd. Class A Subordinated Notes, 8.72% Estimated Yield, 4/15/2025(h) | (f) | Diversified Financials | 4,000 | 2,424 | 2,323 | |||||||||
Ivy Hill Middle Market Credit Fund VII, Ltd. Subordinated Notes, 8.80% Estimated Yield, 10/20/2025(h) | (f) | Diversified Financials | 2,000 | 1,654 | 1,478 | |||||||||
Ivy Hill Middle Market Credit Fund VIII, Ltd. Subordinated Loan, 10.35% Estimated Yield, 2/2/2026(e)(h) | (f) | Diversified Financials | 10,000 | 9,940 | 9,773 | |||||||||
Ivy Hill Middle Market Credit Fund IX, Ltd. Subordinated Notes, 14.59% Estimated Yield, 10/18/2025(h) | (f) | Diversified Financials | 8,146 | 6,106 | 6,239 | |||||||||
Ivy Hill Middle Market Credit Fund X, Ltd. Subordinated Notes, 11.50% Estimated Yield, 7/24/2027(h) | (f) | Diversified Financials | 4,760 | 3,947 | 3,797 | |||||||||
Total Collateralized Securities and Structured Products - Equity | 37,713 | 34,648 | ||||||||||||
Unsecured Debt - 1.7% | ||||||||||||||
American Tire Distributors, Inc., 10.25%, 3/1/2022 | None | Automotive | 5,000 | 4,871 | 4,794 | |||||||||
Flex Acquisition Company, Inc., L+700, 1.00% LIBOR Floor, 12/29/2017 | 1 Month LIBOR | Containers, Packaging & Glass | 3,833 | 3,814 | 3,845 | |||||||||
Radio One, Inc., 9.25%, 2/15/2020 | None | Media: Broadcasting & Subscription | 9,000 | 8,605 | 8,212 | |||||||||
Total Unsecured Debt | 17,290 | 16,851 | ||||||||||||
Equity - 0.5% | ||||||||||||||
Mooregate ITC Acquisition, LLC, Class A Units(o) | High Tech Industries | 500 Units | 563 | 538 | ||||||||||
NS NWN Acquisition, LLC(o) | High Tech Industries | 346 Units | 393 | 337 | ||||||||||
NSG Co-Invest (Bermuda), LP(h)(o) | Consumer Goods: Durable | 1,575 Units | 1,000 | 1,000 | ||||||||||
Southcross Holdings GP, LLC, Units(o) | Energy: Oil & Gas | 188 Units | — | — | ||||||||||
Southcross Holdings LP, Class A-II Units(o) | Energy: Oil & Gas | 188 Units | 75 | 71 | ||||||||||
Speed Commerce Investment Part, LLC(o) | High Tech Industries | 629 Units | 2,640 | 3,000 | ||||||||||
Tenere Inc. Warrant(o) | Capital Equipment | N/A | 161 | 161 | ||||||||||
TexOak Petro Holdings, LLC(o) | Energy: Oil & Gas | 60,000 Units | — | — | ||||||||||
Total Equity | 4,832 | 5,107 | ||||||||||||
Short Term Investments - 7.1%(k) | ||||||||||||||
First American Treasury Obligations Fund, Class Z Shares, 0.39%(l) | 70,498 | 70,498 | ||||||||||||
Total Short Term Investments | 70,498 | 70,498 | ||||||||||||
TOTAL INVESTMENTS - 109.0% | $ | 1,096,948 | 1,089,478 | |||||||||||
LIABILITIES IN EXCESS OF OTHER ASSETS - (9.0%) | (89,715 | ) | ||||||||||||
NET ASSETS - 100% | $ | 999,763 | ||||||||||||
See accompanying notes to consolidated financial statements.
15
CĪON Investment Corporation
Consolidated Schedule of Investments
December 31, 2016
(in thousands)
Counterparty | Instrument | Maturity Date | Notional Amount (d) | Cost(p) | Fair Value(c) | |||||||||||
Derivative Asset - 0.0% | ||||||||||||||||
Credit Default Swap | ||||||||||||||||
JPMorgan Chase Bank, N.A. | Deutsche Bank AG Credit Default Swap | 3/20/2017 | € | 22,000 | $ | 229 | $ | 46 | ||||||||
Derivative Liability - (1.5%) | ||||||||||||||||
Total Return Swap | ||||||||||||||||
Citibank, N.A. | See Note 7 | 2/18/2017 | $ | 407,847 | N/A | $ | (15,402 | ) | ||||||||
a. | All of the Company’s investments are issued by eligible U.S. portfolio companies, as defined in the 1940 Act, except for investments specifically identified as non-qualifying per note h. below. Except for CCSLF, the Company does not control and is not an affiliate of any of the portfolio companies in its investment portfolio. Unless specifically identified in note q. below, investments do not contain a PIK interest provision. |
b. | The 1, 2, 3 and 12 month LIBOR rates were 0.77%, 0.82%, 1.00% and 1.69%, respectively, as of December 31, 2016. The actual LIBOR rate for each loan listed may not be the applicable LIBOR rate as of December 31, 2016, as the loan may have been priced or repriced based on a LIBOR rate prior to or subsequent to December 31, 2016. The 3 month EURIBOR rate was (0.34%) as of December 31, 2016. |
c. | Fair value determined in good faith by the Company’s board of directors (see Note 9). |
d. | Denominated in U.S. dollars unless otherwise noted. |
e. | As discussed in Note 11, the Company was committed, upon the satisfaction of certain conditions, to fund an additional $1,119, $711, $2,500, $1,111, $5,274 and $4,127 as of December 31, 2016 to ABG Intermediate Holdings 2 LLC, American Media, Inc., Elemica Holdings, Inc., Ivy Hill Middle Market Credit Fund VIII, Ltd., Ministry Brands, LLC and Studio Movie Grill Holdings, LLC, respectively. As of March 9, 2017, the Company was committed, upon the satisfaction of certain conditions, to fund an additional $1,119, $415, $10,000, $2,500, $1,111 and $4,127 to ABG Intermediate Holdings 2 LLC, American Media, Inc., CF Entertainment Inc., Elemica Holdings, Inc., Ivy Hill Middle Market Credit Fund VIII, Ltd. and Studio Movie Grill Holdings, LLC, respectively. |
f. | The CLO subordinated notes are considered equity positions in the CLO vehicles and are not rated. Equity investments are entitled to recurring distributions, which are generally equal to the remaining cash flow of the payments made by the underlying vehicle's securities less contractual payments to debt holders and expenses. The estimated yield indicated is based upon a current projection of the amount and timing of these recurring distributions and the estimated amount of repayment of principal upon termination. Such projections are periodically reviewed and adjusted, and the estimated yield may not ultimately be realized. |
g. | Great Lakes CLO 2014-1 Class E Notes, Ivy Hill Middle Market Credit Fund VII Class E Notes and NXT Capital CLO 2014-1 Class E Notes were rated Ba2 on Moody's credit scale as of December 31, 2016. JFIN CLO 2014 Class E Notes were rated BB on S&P's credit scale as of December 31, 2016. |
h. | The investment is not a qualifying asset under the 1940 Act. A business development company may not acquire any asset other than qualifying assets, unless, at the time the acquisition is made, qualifying assets represent at least 70% of the company’s total assets as defined under Section 55 of the 1940 Act. As of December 31, 2016, 90.5% of the Company’s total assets represented qualifying assets. In addition, as described in Note 7, the Company calculates its compliance with the qualifying asset test on a “look through” basis by treating each loan underlying the total return swap as either a qualifying asset or non-qualifying asset based on whether the obligor is an eligible portfolio company. On this basis, 89.1% of the Company’s total assets represented qualifying assets as of December 31, 2016. |
i. | Position or a portion thereof unsettled as of December 31, 2016. |
j. | In addition to the interest earned based on the stated interest rate of this loan, which is the amount reflected in this schedule, the Company may be entitled to receive additional amounts as a result of an arrangement between the Company and other lenders in the syndication in exchange for lower payment priority. |
k. | Short term investments represent an investment in a fund that invests in highly liquid investments with average original maturity dates of three months or less. |
l. | 7-day effective yield as of December 31, 2016. |
m. | Investment or a portion thereof was pledged as collateral supporting the amounts outstanding, if any, under the revolving credit facility with East West Bank as of December 31, 2016 (see Note 8). |
n. | Investment or a portion thereof held within 34th Street and was pledged as collateral supporting the amounts outstanding under the credit facility with JPM as of December 31, 2016 (see Note 8). |
o. | Non-income producing security. |
p. | Represents amortized cost for debt investments, cost for equity investments and premium paid for derivatives. |
See accompanying notes to consolidated financial statements.
16
CĪON Investment Corporation
Consolidated Schedule of Investments
December 31, 2016
(in thousands)
q. | For the year ended December 31, 2016, the following investments contain a PIK interest provision whereby the issuer has either the option or the obligation to make interest payments with the issuance of additional securities: |
Interest Rate | Interest Amount | |||||||||||||||||||
Portfolio Company | Investment Type | Cash | PIK | All-in-Rate | Cash | PIK | All-in-Rate | |||||||||||||
Elements Behavioral Health, Inc. | Senior Secured Second Lien Debt | — | 13.00% | 13.00% | $ | — | $ | 700 | $ | 700 | ||||||||||
Petroflow Energy Corp. | Senior Secured First Lien Debt | 3.00% | 6.00% | 9.00% | $ | 14 | $ | 99 | $ | 113 | ||||||||||
Rimini Street, Inc. | Senior Secured First Lien Debt | 12.00% | 3.00% | 15.00% | $ | 1,286 | $ | 164 | $ | 1,450 | ||||||||||
Sequoia Healthcare Management, LLC | Senior Secured First Lien Debt | 12.00% | 4.00% | 16.00% | $ | 206 | $ | 68 | $ | 274 | ||||||||||
Smile Brands Group, Inc.(r) | Senior Secured First Lien Debt | 7.50% | 1.50% | 9.00% | $ | 187 | $ | 34 | $ | 221 | ||||||||||
Southcross Holdings Borrower LP(s) | Senior Secured First Lien Debt | 3.50% | 5.50% | 9.00% | $ | 2 | $ | 6 | $ | 8 | ||||||||||
Spinal USA, Inc. / Precision Medical Inc. | Senior Secured First Lien Debt | — | 10.50% | 10.50% | $ | — | $ | 3 | $ | 3 | ||||||||||
TexOak Petro Holdings LLC | Senior Secured Second Lien Debt | — | 8.00% | 8.00% | $ | — | $ | 181 | $ | 181 | ||||||||||
r. | Outstanding principal and accrued interest of the underlying loan was fully repaid on August 17, 2016. |
s. | Prior to December 31, 2016, the underlying loan was assigned to the Company and removed from the TRS. |
See accompanying notes to consolidated financial statements.
17
CĪON Investment Corporation
Notes to Consolidated Financial Statements (unaudited)
March 31, 2017
(in thousands, except share and per share amounts)
Note 1. Organization and Principal Business
CĪON Investment Corporation, or the Company, was incorporated under the general corporation laws of the State of Maryland on August 9, 2011. On December 17, 2012, the Company successfully raised gross proceeds from unaffiliated outside investors of at least $2,500, or the minimum offering requirement, and commenced operations. The Company is an externally managed, non-diversified closed-end management investment company that has elected to be regulated as a business development company, or BDC, under the 1940 Act. The Company elected to be treated for federal income tax purposes as a regulated investment company, or RIC, as defined under Subchapter M of the Internal Revenue Code of 1986, as amended, or the Code.
The Company’s investment objective is to generate current income and, to a lesser extent, capital appreciation for investors. The Company’s portfolio is comprised primarily of investments in senior secured debt, including first lien loans, second lien loans and unitranche loans, and, to a lesser extent, collateralized securities, structured products and other similar securities, unsecured debt, including corporate bonds and long-term subordinated loans, referred to as mezzanine loans, and equity, of private and thinly traded U.S. middle-market companies.
The Company is managed by CION Investment Management, LLC, or CIM, a registered investment adviser and an affiliate of the Company. CIM oversees the management of the Company’s activities and is responsible for making investment decisions for the Company’s investment portfolio. The Company and CIM have engaged Apollo Investment Management, L.P., or AIM, a subsidiary of Apollo Global Management, LLC, or, together with its subsidiaries, Apollo, a leading global alternative investment manager, to act as the Company’s investment sub-adviser. On November 1, 2016, the board of directors of the Company, including a majority of the board of directors who are not interested persons, approved the renewal of the investment sub-advisory agreement with AIM for a period of twelve months commencing December 17, 2016.
Note 2. Summary of Significant Accounting Policies
Basis of Presentation and Consolidation
The accompanying unaudited consolidated financial statements of the Company have been prepared in accordance with U.S. generally accepted accounting principles, or GAAP, for interim financial information and pursuant to the instructions for Form 10-Q and Article 10 of Regulation S-X. Accordingly, they do not include all of the information and footnotes required by GAAP for complete financial statements. In the opinion of management, all adjustments (consisting of normal recurring adjustments) considered necessary for a fair presentation have been included. For a more complete discussion of significant accounting policies and certain other information, the Company’s interim unaudited consolidated financial statements should be read in conjunction with its audited consolidated financial statements as of December 31, 2016 and for the year then ended included in the Company’s Annual Report on Form 10-K. Operating results for interim periods are not necessarily indicative of the results that may be expected for the full year ending December 31, 2017. The consolidated balance sheet and the consolidated schedule of investments as of December 31, 2016 are derived from the 2016 audited consolidated financial statements and include the accounts of the Company’s wholly-owned subsidiaries.
The Company is considered an investment company as defined in Accounting Standards Update Topic 946, Financial Services - Investment Companies, or ASU 946. Accordingly, the required disclosures as outlined in ASU 946 are included in the Company’s consolidated financial statements.
The Company evaluates subsequent events through the date that the consolidated financial statements are issued.
Recently Announced Accounting Standards
In August 2016, the Financial Accounting Standards Board, or the FASB, issued ASU 2016-15, Statement of Cash Flows: Classification of Certain Cash Receipts and Cash Payments (a consensus of the Emerging Issues Task Force), or ASU 2016-15, which intends to reduce diversity in practice in how certain cash receipts and payments are classified in the statement of cash flows, including debt prepayment or extinguishment costs, the settlement of contingent liabilities arising from a business combination, proceeds from insurance settlements and distributions from certain equity method investments. ASU 2016-15 is effective for interim and annual periods beginning after December 15, 2017. Early adoption is permitted. The adoption of this guidance may impact the presentation of cash flows, but will not otherwise have a material impact on the Company's consolidated balance sheets or statements of operations.
In January 2017, the FASB issued ASU 2017-01, Business Combinations: Clarifying the Definition of a Business, or ASU 2017-01, which clarifies the definition of a business with the objective of adding guidance to assist companies with evaluating whether transactions should be accounted for as acquisitions (or disposals) of assets or businesses. ASU 2017-01 is expected to reduce the number of transactions that need to be further evaluated as businesses. ASU 2017-01 is effective for interim and annual periods beginning after December 15, 2017. Early adoption is permitted for certain types of transactions. The Company will apply this guidance to its assessment of applicable transactions consummated after the adoption date.
Cash and Cash Equivalents
Cash and cash equivalents include cash in banks and highly liquid investments with original maturity dates of three months or less. The Company’s cash and cash equivalents are held principally at one financial institution and at times may exceed insured limits. The Company periodically evaluates the creditworthiness of this institution and has not experienced any losses on such deposits.
18
CĪON Investment Corporation
Notes to Consolidated Financial Statements (unaudited)
March 31, 2017
(in thousands, except share and per share amounts)
Foreign Currency Translations
The accounting records of the Company are maintained in U.S. dollars. All assets and liabilities denominated in foreign currencies are translated into U.S. dollars based on the foreign exchange rate on the date of valuation. The Company does not isolate that portion of the results of operations resulting from changes in foreign exchange rates on investments from the fluctuations arising from changes in market prices of securities held. Changes in the relationship of foreign currencies to the U.S. dollar can significantly affect the value of these investments and therefore the earnings of the Company.
Short Term Investments
Short term investments include an investment in a U.S. Treasury obligations fund, which seeks to provide current income and daily liquidity by purchasing U.S. Treasury securities and repurchase agreements that are collateralized by such securities. The Company had $70,300 and $70,498 of such investments at March 31, 2017 and December 31, 2016, respectively, which are included in investments, at fair value on the accompanying consolidated balance sheets and on the consolidated schedules of investments.
Offering and Organizational Costs
Offering costs include, among other things, legal fees and other costs pertaining to the preparation of the Company’s registration statements in connection with the continuous public offerings of the Company’s shares. Certain initial offering costs that were funded by CIG on behalf of the Company were submitted by CIG for reimbursement upon meeting the minimum offering requirement on December 17, 2012. These costs were capitalized and amortized over a twelve month period as an adjustment to capital in excess of par value. All other offering costs are expensed as incurred by the Company.
Organizational costs include, among other things, the cost of organizing the Company as a Maryland corporation, including the cost of legal services and other fees pertaining to the organization of the Company. All organizational costs were funded by CIG and its affiliates and there was no liability for these organizational costs to the Company until CIG and its affiliates submitted such costs for reimbursement.
Income Taxes
The Company elected to be treated for federal income tax purposes as a RIC under Subchapter M of the Code. To qualify and maintain qualification as a RIC, the Company must, among other things, meet certain source of income and asset diversification requirements and distribute to shareholders, for each taxable year, at least 90% of the Company’s “investment company taxable income”, which is generally equal to the sum of the Company’s net ordinary income plus the excess, if any, of realized net short-term capital gains over realized net long-term capital losses. If the Company continues to qualify as a RIC and continues to satisfy the annual distribution requirement, the Company will not be subject to corporate level federal income taxes on any income that the Company distributes to its shareholders. The Company intends to make distributions in an amount sufficient to maintain RIC status each year and to avoid any federal income taxes on income. The Company will also be subject to nondeductible federal excise taxes if the Company does not distribute at least 98.0% of net ordinary income, 98.2% of capital gains, if any, and any recognized and undistributed income from prior years for which it paid no federal income taxes.
Two of the Company’s wholly-owned consolidated subsidiaries, View ITC, LLC and View Rise, LLC, or collectively the Taxable Subsidiaries, have elected to be treated as taxable entities for U.S. federal income tax purposes. The Taxable Subsidiaries are not consolidated with the Company for income tax purposes and may generate income tax expense or benefit, and the related tax assets and liabilities, as a result of its ownership of certain portfolio investments. The income tax expense or benefit, if any, and related tax assets and liabilities, where material, are reflected in the Company’s consolidated financial statements. There were no deferred tax assets or liabilities as of March 31, 2017.
Book/tax differences relating to permanent differences are reclassified among the Company’s capital accounts, as appropriate. Additionally, the tax character of distributions is determined in accordance with income tax regulations that may differ from GAAP (see Note 5).
Uncertainty in Income Taxes
The Company evaluates its tax positions to determine if the tax positions taken meet the minimum recognition threshold for the purposes of measuring and recognizing tax liabilities in the consolidated financial statements. Recognition of a tax benefit or liability with respect to an uncertain tax position is required only when the position is “more likely than not” to be sustained assuming examination by the taxing authorities. The Company recognizes interest and penalties, if any, related to unrecognized tax benefits as income tax expense in the consolidated statements of operations. The Company did not have any uncertain tax positions during the periods presented herein.
The Company is subject to examination by U.S. federal, New York State, New York City and Maryland income tax jurisdictions for 2013, 2014, and 2015.
Use of Estimates
The preparation of the consolidated financial statements in conformity with GAAP requires the Company to make estimates and assumptions that affect the reported amounts of assets and liabilities at the date of the consolidated financial statements and the reported amounts of revenues and expenses during the reporting period. Actual results may materially differ from those estimates.
19
CĪON Investment Corporation
Notes to Consolidated Financial Statements (unaudited)
March 31, 2017
(in thousands, except share and per share amounts)
Valuation of Portfolio Investments
The fair value of the Company’s investments is determined quarterly in good faith by the Company’s board of directors pursuant to its consistently applied valuation procedures and valuation process in accordance with Accounting Standards Codification Topic 820, Fair Value Measurements and Disclosure, or ASC 820. ASC 820 defines fair value as the price that would be received from the sale of an asset or paid to transfer a liability in an orderly transaction between market participants at the measurement date. ASC 820 also establishes a three-tier fair value hierarchy that prioritizes and ranks the level of market price observability of inputs used in measuring investments at fair value. Inputs used to measure these fair values are classified into the following hierarchy:
Level 1 - | Quoted prices in active markets for identical assets or liabilities, accessible by the Company at the measurement date. |
Level 2 - | Quoted prices for similar assets or liabilities in active markets, or quoted prices for identical or similar assets or liabilities in markets that are not active, or other observable inputs other than quoted prices. |
Level 3 - | Unobservable inputs for the asset or liability. The inputs used in the determination of fair value may require significant management judgment or estimation. Such information may be the result of consensus pricing information or broker quotes that include a disclaimer that the broker would not be held to such a price in an actual transaction. The non-binding nature of consensus pricing and/or quotes accompanied by the disclaimer would result in classification as a Level 3 asset, assuming no additional corroborating evidence. |
Market price observability is affected by a number of factors, including the type of investment and the characteristics specific to the investment. Investments with readily available active quoted prices or for which fair value can be measured from actively quoted prices generally will have a higher degree of market price observability and a lesser degree of judgment used in measuring fair value.
Based on the observability of the inputs used in the valuation techniques, the Company is required to provide disclosures on fair value measurements according to the fair value hierarchy. The level in the fair value hierarchy for each fair value measurement has been determined based on the lowest level of input that is significant to the fair value measurement. Our assessment of the significance of a particular input to the fair value measurement in its entirety requires judgment and considers factors specific to each investment. The level assigned to the investment valuations may not be indicative of the risk or liquidity associated with investing in such investments. Because of the inherent uncertainties of valuation, the values reflected in the financial statements may differ materially from the value that would be received upon an actual sale of such investments. In addition, changes in the market environment and other events that may occur over the life of the investments may cause the gains or losses that the Company ultimately realizes on these investments to materially differ from the valuations currently assigned.
The Company’s investments, excluding short term investments, consist primarily of debt securities that are traded on a private over-the-counter market for institutional investments. CIM attempts to obtain market quotations from at least two brokers or dealers for each investment (if available, otherwise from a principal market maker or a primary market dealer or other independent pricing service). CIM utilizes mid-market pricing to determine fair value unless a different point within the range is more representative. Because of the private nature of this marketplace (meaning actual transactions are not publicly reported) and the non-binding nature of consensus pricing and/or quotes, the Company believes that these valuation inputs result in Level 3 classification within the fair value hierarchy.
Notwithstanding the foregoing, if in the reasonable judgment of CIM, the price of any investment held by the Company and determined in the manner described above does not accurately reflect the fair value of such investment, CIM will value such investment at a price that reflects such investment’s fair value and report such change in the valuation to the board of directors or its designee as soon as practicable. Investments that carry certain restrictions on sale will typically be valued at a discount from the public market value of the investment.
Any investments that are not publicly traded or for which a market price is not otherwise readily available are valued at a price that reflects its fair value. With respect to such investments, the investments are reviewed and valued using one or more of the following types of analyses:
i. | Market comparable statistics and public trading multiples discounted for illiquidity, minority ownership and other factors for companies with similar characteristics. |
ii. | Valuations implied by third-party investments in the applicable portfolio companies. |
iii. | Discounted cash flow analysis, including a terminal value or exit multiple. |
Determination of fair value involves subjective judgments and estimates. Accordingly, these notes to the Company’s consolidated financial statements refer to the uncertainty with respect to the possible effect of such valuations, and any change in such valuations, on the Company’s consolidated financial statements. Below is a description of factors that the Company’s board of directors may consider when valuing the Company’s equity and debt investments where a market price is not readily available:
• | the size and scope of a portfolio company and its specific strengths and weaknesses; |
• | prevailing interest rates for like securities; |
• | expected volatility in future interest rates; |
• | leverage; |
20
CĪON Investment Corporation
Notes to Consolidated Financial Statements (unaudited)
March 31, 2017
(in thousands, except share and per share amounts)
• | call features, put features and other relevant terms of the debt; |
• | the borrower’s ability to adequately service its debt; |
• | the fair market value of the portfolio company in relation to the face amount of its outstanding debt; |
• | the quality of collateral securing the Company’s debt investments; |
• | multiples of earnings before interest, taxes, depreciation and amortization, or EBITDA, cash flows, net income, revenues or, in some cases, book value or liquidation value; and |
• | other factors deemed applicable. |
All of these factors may be subject to adjustment based upon the particular circumstances of a portfolio company or the Company’s actual investment position. For example, adjustments to EBITDA may take into account compensation to previous owners, or acquisition, recapitalization, and restructuring expenses or other related or non-recurring items. The choice of analyses and the weight assigned to such factors may vary across investments and may change within an investment if events occur that warrant such a change.
The discounted cash flow model deemed appropriate by CIM is prepared for the applicable investments and reviewed by the Company’s valuation committee consisting of senior management. Such models are prepared at least quarterly or on an as needed basis. The model uses the estimated cash flow projections for the underlying investments and an appropriate discount rate is determined based on the latest financial information available for the borrower, prevailing market trends, comparable analysis and other inputs. The model, key assumptions, inputs, and results are reviewed by the Company’s valuation committee with final approval from the board of directors.
Consistent with the Company’s valuation policy, the Company evaluates the source of inputs, including any markets in which the Company’s investments are trading, in determining fair value.
The Company periodically benchmarks the broker quotes from the brokers or dealers against the actual prices at which the Company purchases and sells its investments. Based on the results of the benchmark analysis and the experience of the Company’s management in purchasing and selling these investments, the Company believes that these quotes are reliable indicators of fair value. The Company may also use other methods to determine fair value for securities for which it cannot obtain market quotations through brokers or dealers, including the use of an independent valuation firm. The Company’s valuation committee and board of directors review and approve the valuation determinations made with respect to these investments in a manner consistent with the Company’s valuation process.
The value of the total return swap, or TRS, was primarily based on the increase or decrease in the value of the loans underlying the TRS, as determined by the Company. The loans underlying the TRS were valued in the same manner as loans owned by the Company. As in all cases, the level in the fair value hierarchy for each instrument is determined based on the lowest level of inputs that are significant to the fair value measurement. The Company classified the TRS as Level 3 within the fair value hierarchy based on the lowest level of significant inputs. For additional information on the TRS, see Note 7.
Revenue Recognition
Securities transactions are accounted for on the trade date. The Company records interest and dividend income on an accrual basis beginning on the trade settlement date or the ex-dividend date, respectively, to the extent that the Company expects to collect such amounts. For investments in equity tranches of collateralized loan obligations, the Company records income based on the effective interest rate determined using the amortized cost and estimated cash flows, which is updated periodically. Loan origination fees, original issue discounts, and market discounts/premiums are recorded and such amounts are amortized as adjustments to interest income over the respective term of the loan using the effective interest method. The Company records prepayment premiums on loans and debt securities as interest income when it receives such amounts. In addition, the Company may generate revenue in the form of commitment, structuring or diligence fees, monitoring fees, fees for providing managerial assistance and possibly consulting fees and performance-based fees. Any such fees generated in connection with investments are recognized when earned.
The Company may have investments in its investment portfolio that contain a PIK interest provision. PIK interest is accrued as interest income if the portfolio company valuation indicates that such PIK interest is collectible and recorded as interest receivable up to the interest payment date. On the interest payment dates, the Company will capitalize the accrued interest receivable attributable to PIK as additional principal due from the borrower. Additional PIK securities typically have the same terms, including maturity dates and interest rates, as the original securities. In order to maintain RIC status, substantially all of this income must be paid out to shareholders in the form of distributions, even if the Company has not collected any cash. For additional information on investments that contain a PIK interest provision, see the consolidated schedules of investments as of March 31, 2017 and December 31, 2016.
Loans and debt securities, including those that are individually identified as being impaired under Accounting Standards Codification 310, Receivables, or ASC 310, are generally placed on non-accrual status immediately if, in the opinion of management, principal or interest is not likely to be paid in accordance with the terms of the debt agreement, or when principal or interest is past due 90 days or more. Interest accrued but not collected at the date a loan or security is placed on non-accrual status is reversed against interest income. Interest income is recognized on non-accrual loans or debt securities only to the extent received in cash. However, where there is doubt regarding the ultimate collectibility of principal, cash receipts, whether designated as principal or interest, are thereafter applied to reduce the carrying value of the loan or debt security. Loans or securities are restored to accrual status only when interest and principal payments are brought current and future payments are reasonably assured.
21
CĪON Investment Corporation
Notes to Consolidated Financial Statements (unaudited)
March 31, 2017
(in thousands, except share and per share amounts)
Net Realized Gains or Losses and Net Change in Unrealized Appreciation or Depreciation
Gains or losses on the sale of investments are calculated by using the weighted-average method. The Company measures realized gains or losses by the difference between the net proceeds from the repayment or sale and the weighted-average amortized cost of the investment, without regard to unrealized appreciation or depreciation previously recognized, but considering unamortized upfront fees and prepayment penalties. Net change in unrealized appreciation or depreciation reflects the change in portfolio investment values during the reporting period, including any reversal of previously recorded unrealized appreciation or depreciation when gains or losses are realized.
Derivative Instrument
The Company recognizes all derivative instruments as assets or liabilities at fair value in its consolidated financial statements. Derivative contracts entered into by the Company are not designated as hedging instruments, and as a result, the Company presents changes in fair value through current period earnings.
Derivative instruments are measured in terms of the notional contract amount and derive their value based upon one or more underlying instruments. Derivative instruments are subject to various risks similar to non-derivative instruments including market, credit, liquidity and operational risks. For additional information on the Company's derivative instruments, see Note 7.
Capital Gains Incentive Fee
Pursuant to the terms of the investment advisory agreement the Company entered into with CIM, the incentive fee on capital gains earned on liquidated investments of the Company’s investment portfolio during operations is determined and payable in arrears as of the end of each calendar year. Such fee equals 20% of the Company’s incentive fee capital gains (i.e., the Company’s realized capital gains on a cumulative basis from inception, calculated as of the end of each calendar year, computed net of all realized capital losses and unrealized capital depreciation on a cumulative basis), less the aggregate amount of any previously paid capital gains incentive fees. On a cumulative basis and to the extent that all realized capital losses and unrealized capital depreciation exceed realized capital gains as well as the aggregate realized net capital gains for which a fee has previously been paid, the Company would not be required to pay CIM a capital gains incentive fee. On a quarterly basis, the Company accrues for the capital gains incentive fee by calculating such fee as if it were due and payable as of the end of such period.
CIM did not take any incentive fees with respect to the Company’s TRS. For purposes of computing the capital gains incentive fee, CIM became entitled to a capital gains incentive fee upon the termination of the TRS, at which point all gains and losses of the underlying loans constituting the reference assets of the TRS were realized. However, realized losses exceeded realized gains on the underlying loans, resulting in no capital gains incentive fees on the TRS. Any net unrealized gains on the TRS were reflected in total assets on the Company’s consolidated balance sheets and included in the computation of the base management fee. Any net unrealized losses on the TRS were reflected in total liabilities on the Company’s consolidated balance sheets and excluded in the computation of the base management fee.
While the investment advisory agreement with CIM neither includes nor contemplates the inclusion of unrealized gains in the calculation of the capital gains incentive fee, pursuant to an interpretation of the American Institute for Certified Public Accountants, or AICPA, Technical Practice Aid for investment companies, the Company accrues capital gains incentive fees on unrealized gains. This accrual reflects the incentive fees that would be payable to CIM if the Company’s entire investment portfolio was liquidated at its fair value as of the balance sheet date even though CIM is not entitled to an incentive fee with respect to unrealized gains unless and until such gains are actually realized.
Net Increase (Decrease) in Net Assets per Share
Net increase (decrease) in net assets per share is calculated based upon the daily weighted average number of shares of common stock outstanding during the reporting period.
Distributions
Distributions to shareholders are recorded as of the record date. The amount to be paid as a distribution is determined by the board of directors on a monthly basis. Net realized capital gains, if any, are distributed at least annually.
22
CĪON Investment Corporation
Notes to Consolidated Financial Statements (unaudited)
March 31, 2017
(in thousands, except share and per share amounts)
Note 3. Share Transactions
The Company’s initial continuous public offering commenced on July 2, 2012 and ended on December 31, 2015. The Company’s follow-on continuous public offering commenced on January 25, 2016.
The following table summarizes transactions with respect to shares of the Company’s common stock during the three months ended March 31, 2017 and 2016:
Three Months Ended March 31, | |||||||||||||
2017 | 2016 | ||||||||||||
Shares | Amount | Shares | Amount | ||||||||||
Gross shares/proceeds from the offering | 1,308,726 | $ | 12,383 | 49,722 | $ | 474 | |||||||
Reinvestment of distributions | 1,088,626 | 9,926 | 1,131,095 | 9,683 | |||||||||
Total gross shares/proceeds | 2,397,352 | 22,309 | 1,180,817 | 10,157 | |||||||||
Sales commissions and dealer manager fees | — | (448 | ) | — | (50 | ) | |||||||
Net shares/proceeds | 2,397,352 | 21,861 | 1,180,817 | 10,107 | |||||||||
Share repurchase program | (814,223 | ) | (7,370 | ) | (272,148 | ) | (2,437 | ) | |||||
Net shares/proceeds from share transactions | 1,583,129 | $ | 14,491 | 908,669 | $ | 7,670 | |||||||
During the three months ended March 31, 2017 and 2016, the Company sold 2,397,352 and 1,180,817 shares, respectively, at an average price per share of $9.31 and $8.60, respectively.
Since commencing its initial continuous public offering on July 2, 2012 and through March 31, 2017, the Company sold 111,370,686 shares of common stock for net proceeds of $1,132,506 at an average price per share of $10.17. The net proceeds include gross proceeds received from reinvested shareholder distributions of $94,399, for which the Company issued 10,370,290 shares of common stock, and gross proceeds paid for shares of common stock tendered for repurchase of $32,784, for which the Company repurchased 3,641,315 shares of common stock.
During the period from April 1, 2017 to May 10, 2017, the Company sold 683,900 shares of common stock pursuant to its follow-on continuous public offering for gross proceeds of $6,513 at an average price per share of $9.52. The Company also received gross proceeds of $3,030 from reinvested shareholder distributions, for which the Company issued 331,868 shares of common stock, and paid $10,372 for shares of common stock tendered for repurchase, for which the Company repurchased 1,137,234 shares of common stock.
Since commencing its initial continuous public offering on July 2, 2012 and through May 10, 2017, the Company sold 111,249,220 shares of common stock for net proceeds of $1,131,677 at an average price per share of $10.17. The net proceeds include gross proceeds received from reinvested shareholder distributions of $97,429, for which the Company issued 10,702,158 shares of common stock, and gross proceeds paid for shares of common stock tendered for repurchase of $43,156, for which the Company repurchased 4,778,549 shares of common stock.
To ensure that the offering price per share, net of sales commissions and dealer manager fees, equaled or exceeded the net asset value per share on each subscription closing date and distribution reinvestment date, certain of the Company’s directors increased the offering price per share of common stock on certain dates. Due to a decline in the Company’s net asset value per share to an amount more than 2.5% below the Company’s then-current net offering price, certain of the Company’s directors decreased the offering price per share of common stock on certain dates.
23
CĪON Investment Corporation
Notes to Consolidated Financial Statements (unaudited)
March 31, 2017
(in thousands, except share and per share amounts)
The changes to our offering price per share since the commencement of our initial continuous public offering and the associated approval and effective dates of such changes were as follows:
Approval Date | Effective Date | New Offering Price Per Share | ||
December 28, 2012 | January 2, 2013 | $10.04 | ||
January 31, 2013 | February 1, 2013 | $10.13 | ||
March 14, 2013 | March 18, 2013 | $10.19 | ||
May 15, 2013 | May 16, 2013 | $10.24 | ||
August 15, 2013 | August 16, 2013 | $10.32 | ||
February 4, 2014 | February 5, 2014 | $10.45 | ||
October 6, 2015 | October 7, 2015 | $10.20 | ||
November 24, 2015 | November 25, 2015 | $10.05 | ||
December 22, 2015 | December 23, 2015 | $9.95 | ||
March 8, 2016 | March 9, 2016 | $9.40 | ||
March 15, 2016 | March 16, 2016 | $9.45 | ||
March 22, 2016 | March 23, 2016 | $9.50 | ||
March 29, 2016 | March 30, 2016 | $9.55 | ||
April 5, 2016 | April 6, 2016 | $9.60 | ||
April 26, 2016 | April 27, 2016 | $9.65 | ||
May 3, 2016 | May 4, 2016 | $9.70 | ||
May 10, 2016 | May 11, 2016 | $9.75 | ||
May 31, 2016 | June 1, 2016 | $9.80 | ||
July 19, 2016 | July 20, 2016 | $9.85 | ||
July 26, 2016 | July 27, 2016 | $9.90 | ||
August 9, 2016 | August 10, 2016 | $9.95 | ||
August 23, 2016 | August 24, 2016 | $10.00 | ||
October 4, 2016 | October 5, 2016 | $10.05 | ||
October 11, 2016 | October 12, 2016 | $10.10 | ||
January 3, 2017 | January 4, 2017 | $9.57(1) | ||
January 24, 2017 | January 25, 2017 | $9.60 | ||
March 7, 2017 | March 8, 2017 | $9.65 | ||
(1) | On December 28, 2016, the Company entered into an amended and restated follow-on dealer manager agreement pursuant to which, among other things, the dealer manager fee was reduced to up to 2% and selling commissions were reduced to up to 3%. As a result, the Company adjusted its public offering price from $10.10 per share to $9.57 per share in order to maintain its net offering price of $9.09 per share (net of selling commissions and dealer manager fees). |
Share Repurchase Program
Beginning in the first quarter of 2014, the Company began offering, and on a quarterly basis thereafter it intends to continue offering, to repurchase shares on such terms as may be determined by the Company’s board of directors in its complete and absolute discretion unless, in the judgment of the independent directors of the Company’s board of directors, such repurchases would not be in the best interests of the Company’s shareholders or would violate applicable law.
The Company limits the number of shares to be repurchased during any calendar year to the number of shares it can repurchase with the proceeds it receives from the issuance of shares pursuant to its fifth amended and restated distribution reinvestment plan. At the discretion of the Company’s board of directors, it may also use cash on hand, cash available from borrowings and cash from liquidation of investments as of the end of the applicable period to repurchase shares. In addition, the Company limits the number of shares to be repurchased in any calendar year to 15% of the weighted average number of shares outstanding in the prior calendar year, or 3.75% in each quarter, though the actual number of shares that it offers to repurchase may be less in light of the limitations noted above. The Company currently offers to repurchase such shares at a price equal to the estimated net asset value per share on each date of repurchase.
On November 2, 2015, the Company amended the terms of the quarterly share repurchase program, effective as of the Company’s quarterly repurchase offer for the fourth quarter of 2015, which commenced in November 2015 and was completed in January 2016. Under the amended share repurchase program, the Company offered to repurchase shares of common stock at a price per share of $8.96, which was (i) not less than the net asset value per share immediately prior to January 4, 2016 and (ii) not more than 2.5% greater than the net asset value per share as of such date.
24
CĪON Investment Corporation
Notes to Consolidated Financial Statements (unaudited)
March 31, 2017
(in thousands, except share and per share amounts)
On January 22, 2016, the Company further amended the terms of the quarterly share repurchase program, effective as of the Company’s quarterly repurchase offer for the first quarter of 2016, which commenced in February 2016 and was completed in April 2016. Under the further amended share repurchase program, the Company offered to repurchase shares of common stock at a price equal to 90% of the public offering price in effect on each date of repurchase.
On December 8, 2016, the Company further amended the terms of the quarterly share repurchase program, effective as of the Company's quarterly repurchase offer for the fourth quarter of 2016, which commenced in November 2016 and was completed in January 2017. Under the further amended share and repurchase program, the Company will offer to repurchase shares of common stock at a price equal to the estimated net asset value per share determined on each date of repurchase.
Any periodic repurchase offers are subject in part to the Company’s available cash and compliance with the BDC and RIC qualification and diversification rules promulgated under the 1940 Act and the Code, respectively. While the Company conducts quarterly tender offers as described above, it is not required to do so and may suspend or terminate the share repurchase program at any time, upon 30 days’ notice.
The following table summarizes the share repurchases completed during the three months ended March 31, 2017:
Three Months Ended | Repurchase Date | Shares Repurchased | Percentage of Shares Tendered That Were Repurchased | Repurchase Price Per Share | Aggregate Consideration for Repurchased Shares | ||||||||||
March 31, 2017 | January 4, 2017 | 814,223 | 100 | % | 9.05 | $ | 7,370 | ||||||||
Total | 814,223 | $ | 7,370 | ||||||||||||
Note 4. Transactions with Related Parties
For the three months ended March 31, 2017 and 2016, fees and other expenses incurred by the Company related to CIM and its affiliates were as follows:
Three Months Ended March 31, | |||||||||||||
Entity | Capacity | Description | 2017 | 2016 | |||||||||
CION Securities, LLC | Dealer manager | Dealer manager fees(1) | $ | 210 | $ | 15 | |||||||
CIM | Investment adviser | Management fees(2) | 6,482 | 4,512 | |||||||||
ICON Capital, LLC | Administrative services provider | Administrative services expense(2) | 346 | 292 | |||||||||
CIG | Sponsor | Recoupment of expense support(2) | — | 119 | |||||||||
$ | 7,038 | $ | 4,938 | ||||||||||
(1) | Amounts charged directly to equity. |
(2) | Amounts charged directly to operations. |
On December 28, 2016, the Company entered into an amended and restated follow-on dealer manager agreement with CIM and CION Securities, LLC (formerly, ICON Securities, LLC), or CION Securities, in connection with the Company's follow-on continuous public offering. Under the amended and restated dealer manager agreement, the dealer manager fee was reduced from up to 3% to up to 2% of gross offering proceeds and selling commissions to the selling dealers were reduced from up to 7% to up to 3% of gross offering proceeds. Such costs are charged against capital in excess of par value when incurred. Since commencing its initial continuous public offering on July 2, 2012 and through May 10, 2017, the Company paid or accrued sales commissions of $63,624 to the selling dealers and dealer manager fees of $31,317 to CION Securities.
The Company has entered into an investment advisory agreement with CIM. On November 1, 2016, the board of directors of the Company, including a majority of the board of directors who are not interested persons, approved the renewal of the investment advisory agreement for a period of twelve months commencing December 17, 2016. Pursuant to the investment advisory agreement, CIM is paid an annual base management fee equal to 2.0% of the average value of the Company’s gross assets, less cash and cash equivalents, and an incentive fee based on the Company’s performance, as described below. The base management fee is payable quarterly in arrears and is calculated based on the two most recently completed calendar quarters. The incentive fee consists of two parts. The first part, which is referred to as the subordinated incentive fee on income, is calculated and payable quarterly in arrears based on “pre-incentive fee net investment income” for the immediately preceding quarter and is subject to a hurdle rate, measured quarterly and expressed as a rate of return on adjusted capital, as defined in the investment advisory agreement, equal to 1.875% per quarter, or an annualized rate of 7.5%. The second part of the incentive fee, which is referred to as the incentive fee on capital gains, is described in Note 2. Refer to Note 7 for a discussion of CIM’s entitlement to receive incentive fees and the Company's accrual of the incentive fee on capital gains with respect to the TRS.
The Company accrues the capital gains incentive fee based on net realized gains and net unrealized appreciation; however, under the terms of the investment advisory agreement, the fee payable to CIM is based on net realized gains and unrealized depreciation and no such fee is payable with respect to unrealized appreciation unless and until such appreciation is actually realized. For the three months ended March 31, 2017, the Company had no liability for and did not record any capital gains incentive fees.
25
CĪON Investment Corporation
Notes to Consolidated Financial Statements (unaudited)
March 31, 2017
(in thousands, except share and per share amounts)
With respect to the TRS, CIM became entitled to receive a capital gains incentive fee upon the termination of the TRS, at which point all net gains and losses of the underlying loans constituting the reference assets of the TRS were realized. See Note 2 and Note 7 for an additional discussion of CIM’s entitlement to receive payment of incentive fees and the Company’s accrual of the incentive fee on capital gains with respect to the TRS.
The Company entered into an administration agreement with CIM’s affiliate, ICON Capital, LLC, or ICON Capital, pursuant to which ICON Capital furnishes the Company with administrative services including accounting, investor relations and other administrative services necessary to conduct its day-to-day operations. On November 1, 2016, the board of directors of the Company, including a majority of the board of directors who are not interested persons, approved the renewal of the administration agreement for a period of twelve months commencing December 17, 2016. ICON Capital is reimbursed for administrative expenses it incurs on the Company’s behalf in performing its obligations, provided that such reimbursement will be for the lower of ICON Capital’s actual costs or the amount that the Company would be required to pay for comparable administrative services in the same geographic location. Such costs will be reasonably allocated to the Company on the basis of assets, revenues, time records or other reasonable methods. The Company will not reimburse ICON Capital for any services for which it receives a separate fee or for rent, depreciation, utilities, capital equipment or other administrative items allocated to a person with a controlling interest in ICON Capital.
Under the terms of the investment advisory agreement, CIM and certain of its affiliates, which includes CIG, are entitled to receive reimbursement of up to 1.5% of the gross proceeds raised until all offering and organizational costs have been reimbursed. The Company’s payment of offering and organizational costs will not exceed 1.5% of the actual gross proceeds raised from the offerings (without giving effect to any potential expense support from CIG and its affiliates). If the Company sells the maximum number of shares at its latest public offering price of $9.65 per share, the Company estimates that it may incur up to approximately $29,830 of expenses. With respect to any reimbursements for offering and organizational costs, the Company will interpret the 1.5% limit based on actual gross proceeds raised at the time of such reimbursement. In addition, the Company will not issue any of its shares or other securities for services or for property other than cash or securities except as a dividend or distribution to its security holders or in connection with a reorganization.
From inception through December 31, 2012, CIG and its affiliates incurred offering, organizational and other pre-effective costs of $2,012. Of these costs, $1,812 represented offering and organizational costs, all of which have been submitted to the Company for reimbursement. The Company paid $450 in October 2013, $550 in March 2014, $592 in May 2014 and $420 in March 2015. No additional material offering, organizational or other pre-effective costs have been incurred by CIG or its affiliates subsequent to December 31, 2012.
Reinvestment of shareholder distributions and share repurchases are excluded from the gross proceeds from the Company’s offerings for purposes of determining the total amount of offering and organizational costs that can be paid by the Company. As of March 31, 2017, the Company raised gross offering proceeds of $1,070,891, of which it can pay up to $16,063 in offering and organizational costs (which represents 1.5% of the actual gross offering proceeds raised). Through March 31, 2017, the Company paid $9,540 of such costs, leaving an additional $6,523 that can be paid. As of May 10, 2017, the Company raised gross offering proceeds of $1,077,404, of which it can pay up to $16,161 in offering and organizational costs (which represents 1.5% of the actual gross offering proceeds raised). Through May 10, 2017, the Company paid $9,582 of such costs, leaving an additional $6,579 that can be paid.
On January 30, 2013, the Company entered into the expense support and conditional reimbursement agreement with CIG, whereby CIG agreed to provide expense support to the Company in an amount that is sufficient to: (1) ensure that no portion of the Company’s distributions to shareholders will be paid from its offering proceeds or borrowings, and/or (2) reduce the Company’s operating expenses until it has achieved economies of scale sufficient to ensure that it bears a reasonable level of expense in relation to its investment income. On December 13, 2013 and January 16, 2015, the Company and CIG amended the expense support and conditional reimbursement agreement to extend the termination date of such agreement from January 30, 2014 to January 30, 2015 and from January 30, 2015 to December 31, 2015, respectively. On December 16, 2015 and December 14, 2016, the Company further amended and restated the expense support and conditional reimbursement agreement for purposes of including AIM as a party to the agreement and extending the termination date from December 31, 2016 to December 31, 2017, respectively. Commencing with the quarter beginning January 1, 2016, CIG and AIM each agreed to provide expense support to the Company for 50% of its expenses as described above.
For the three months ended March 31, 2017 and 2016, the Company did not receive any expense support from CIG or AIM.
Pursuant to the expense support and conditional reimbursement agreement, the Company will have a conditional obligation to reimburse CIG for any amounts funded by CIG under such agreement (i) if expense support amounts funded by CIG exceed operating expenses incurred during any fiscal quarter, (ii) if the sum of the Company’s net investment income for tax purposes, net capital gains and the amount of any dividends and other distributions paid to the Company on account of investments in portfolio companies (to the extent not included in net investment income or net capital gains for tax purposes) exceeds the distributions paid by the Company to shareholders, and (iii) during any fiscal quarter occurring within three years of the date on which CIG funded such amount. Pursuant to the second amended and restated expense support and conditional reimbursement agreement, the Company will have a conditional obligation to reimburse CIG and AIM for any amounts funded by CIG and AIM under the same circumstances described above. The obligation to reimburse CIG and AIM for any expense support provided by CIG and AIM under such agreement is further conditioned by the following: (i) in the period in which reimbursement is sought, the ratio of operating expenses to average net assets, when considering the reimbursement, cannot exceed the ratio of operating expenses to average net assets, as defined, for the period when the expense support was provided; (ii) in the period when reimbursement is sought, the annualized distribution rate cannot fall below the annualized distribution rate for the period when the expense support was provided; and (iii) the expense support can only be reimbursed within three years from the date the expense support was provided.
26
CĪON Investment Corporation
Notes to Consolidated Financial Statements (unaudited)
March 31, 2017
(in thousands, except share and per share amounts)
Expense support, if any, will be determined as appropriate to meet the objectives of the expense support and conditional reimbursement agreement. During the three months ended March 31, 2016, the Company recorded obligations to repay expense support from CIG of $119. The Company did not record any obligation to repay expense support from CIG during the three months ended March 31, 2017. During the three months ended March 31, 2016, the Company repaid expense support to CIG of $480. The Company did not repay any expense support to CIG or AIM during the three months ended March 31, 2017. The Company may or may not be requested to reimburse any future expense support provided by CIG or AIM.
The Company, AIM, or CIG may terminate the expense support and conditional reimbursement agreement at any time. CIG and AIM have indicated that they expect to continue such expense support until they believe that the Company has achieved economies of scale sufficient to ensure that it bears a reasonable level of expenses in relation to its income. If the Company terminates the investment advisory agreement with CIM and/or the investment sub-advisory agreement with AIM, the Company may be required to repay CIG and AIM all unreimbursed expense support funded by CIG and AIM within three years of the date of termination. The specific amount of expense support provided by CIG and AIM, if any, will be determined at the end of each quarter. There can be no assurance that the expense support and conditional reimbursement agreement will remain in effect or that CIG and AIM will support any portion of the Company’s expenses in future quarters.
As of March 31, 2017 and December 31, 2016, the total liability payable to CIM and its affiliates was $6,873 and $6,508, respectively, which primarily related to fees earned by CIM during the three months ended March 31, 2017 and December 31, 2016, respectively.
Because CIM’s senior management team is comprised of substantially the same personnel as the senior management team of the Company’s affiliate, ICON Capital, which is the investment manager to certain equipment finance funds, or equipment funds, such members of senior management provide investment advisory and management services to the equipment funds in addition to the Company. In the event that CIM undertakes to provide investment advisory services to other clients in the future, it will strive to allocate investment opportunities in a fair and equitable manner consistent with the Company’s investment objective and strategies so that the Company will not be disadvantaged in relation to any other client of the investment adviser or its senior management team. However, it is currently possible that some investment opportunities will be provided to the equipment funds or other clients of CIM rather than to the Company.
Indemnifications
The investment advisory agreement, the investment sub-advisory agreement, the administration agreement and the dealer manager agreement each provide certain indemnifications from the Company to the other relevant parties to such agreements. The Company’s maximum exposure under these agreements is unknown. However, the Company has not experienced claims or losses pursuant to these agreements and believes the risk of loss related to such indemnifications to be remote.
Note 5. Distributions
The Company’s board of directors authorizes and declares on a monthly basis a weekly distribution amount per share of common stock. During the year ended December 31, 2016 and the three months ended March 31, 2017, the Company’s board of directors declared distributions for 52 and 13 record dates, respectively. Declared distributions are paid monthly.
The following table presents cash distributions per share that were declared during the year ended December 31, 2016 and the three months ended March 31, 2017:
Distributions | ||||||||
Three Months Ended | Per Share | Amount | ||||||
2016 | ||||||||
March 31, 2016 (thirteen record dates) | $ | 0.1829 | $ | 19,004 | ||||
June 30, 2016 (thirteen record dates) | 0.1829 | 19,167 | ||||||
September 30, 2016 (thirteen record dates) | 0.1829 | 19,480 | ||||||
December 31, 2016 (thirteen record dates) | 0.1829 | 19,808 | ||||||
Total distributions for the year ended December 31, 2016 | $ | 0.7316 | $ | 77,459 | ||||
2017 | ||||||||
March 31, 2017 (thirteen record dates) | $ | 0.1829 | $ | 20,123 | ||||
Total distributions for the three months ended March 31, 2017 | $ | 0.1829 | $ | 20,123 | ||||
On March 23, 2017, the Company’s board of directors declared four weekly cash distributions of $0.014067 per share, which were paid on April 26, 2017 to shareholders of record on April 4, April 11, April 18, and April 25, 2017. On April 18, 2017, the Company’s board of directors declared five weekly cash distributions of $0.014067 per share, payable on May 31, 2017 to shareholders of record on May 2, May 9, May 16, May 23, and May 30, 2017.
27
CĪON Investment Corporation
Notes to Consolidated Financial Statements (unaudited)
March 31, 2017
(in thousands, except share and per share amounts)
The Company has adopted an “opt in” distribution reinvestment plan for shareholders. As a result, if the Company makes a distribution, shareholders will receive distributions in cash unless they specifically “opt in” to the fifth amended and restated distribution reinvestment plan so as to have their cash distributions reinvested in additional shares of the Company’s common stock.
On November 2, 2015, the Company further amended and restated its distribution reinvestment plan pursuant to the third amended and restated distribution reinvestment plan, or the Third Amended DRIP. The Third Amended DRIP was effective as of, and first applied to the reinvestment of cash distributions paid on or after, the closing of the Company’s initial continuous public offering on December 31, 2015. Under the Third Amended DRIP, cash distributions to participating shareholders were reinvested in additional shares of common stock at a purchase price determined by the Company’s board of directors or a committee thereof, in its sole discretion, that was (i) not less than the net asset value per share determined in good faith by the board of directors or a committee thereof, in their sole discretion, immediately prior to the payment of the distribution, or the NAV Per Share, and (ii) not more than 2.5% greater than the NAV Per Share as of such date.
On January 22, 2016, the Company further amended and restated its distribution reinvestment plan pursuant to the fourth amended and restated distribution reinvestment plan, or the Fourth Amended DRIP. The Fourth Amended DRIP became effective as of, and first applied to the reinvestment of cash distributions paid on, March 30, 2016. Under the Fourth Amended DRIP, cash distributions to participating shareholders were reinvested in additional shares of common stock at a purchase price equal to 90% of the public offering price per share in effect as of the date of issuance.
On December 8, 2016, the Company further amended and restated its distribution reinvestment plan pursuant to the fifth amended and restated distribution reinvestment plan, or the Fifth Amended DRIP. The Fifth Amended DRIP became effective as of, and first applied to the reinvestment of cash distributions paid on, February 1, 2017. Under the Fifth Amended DRIP, cash distributions to participating shareholders will be reinvested in additional shares of common stock at a purchase price equal to the estimated net asset value per share of common stock as of the date of issuance.
The Company may fund its cash distributions to shareholders from any sources of funds available to the Company, including offering proceeds, borrowings, net investment income from operations, capital gains proceeds from the sale of assets, non-capital gains proceeds from the sale of assets, dividends or other distributions paid to it on account of preferred and common equity investments in portfolio companies and expense support from CIG and AIM, which is subject to recoupment. The Company has not established limits on the amount of funds it may use from available sources to make distributions. Through December 31, 2014, a portion of the Company’s distributions resulted from expense support from CIG, and future distributions may result from expense support from CIG and AIM, each of which is subject to repayment by the Company within three years. For the years ended December 31, 2015 and 2016, none of the Company's distributions resulted from expense support from CIG or AIM. The purpose of this arrangement is to avoid such distributions being characterized as a return of capital. Shareholders should understand that any such distributions are not based on the Company’s investment performance, and can only be sustained if the Company achieves positive investment performance in future periods and/or CIG and AIM continue to provide such expense support. Shareholders should also understand that the Company’s future repayments of expense support will reduce the distributions that they would otherwise receive. There can be no assurance that the Company will achieve such performance in order to sustain these distributions, or be able to pay distributions at all. CIG and AIM have no obligation to provide expense support to the Company in future periods.
The following table reflects the sources of cash distributions on a GAAP basis that the Company has declared on its shares of common stock during the three months ended March 31, 2017 and 2016:
Three Months Ended March 31, | ||||||||||||||||||||||
2017 | 2016 | |||||||||||||||||||||
Source of Distribution | Per Share | Amount | Percentage | Per Share | Amount | Percentage | ||||||||||||||||
Net investment income | $ | 0.1390 | $ | 15,289 | 76.0 | % | $ | 0.1008 | $ | 10,475 | 55.1 | % | ||||||||||
Net realized gain on total return swap | ||||||||||||||||||||||
Net interest and other income from TRS portfolio | 0.0301 | 3,316 | 16.5 | % | 0.0789 | 8,193 | 43.1 | % | ||||||||||||||
Net gain on TRS loan sales(1) | 0.0058 | 634 | 3.1 | % | 0.0016 | 169 | 0.9 | % | ||||||||||||||
Net realized gain on investments and foreign currency | 0.0080 | 884 | 4.4 | % | — | — | — | |||||||||||||||
Distributions in excess of net investment income(2) | — | — | — | 0.0016 | 167 | 0.9 | % | |||||||||||||||
Total distributions | $ | 0.1829 | $ | 20,123 | 100.0 | % | $ | 0.1829 | $ | 19,004 | 100.0 | % | ||||||||||
(1) | During the three months ended March 31, 2017, the Company realized losses of $21,146 primarily due to the purchase of loans by Flatiron Funding II, LLC that were previously held in the TRS and are not currently deductible on a tax-basis. See Note 8 for an additional discussion over this purchase. |
(2) | Distributions in excess of net investment income represent certain expenses, which are not deductible on a tax-basis. Unearned capital gains incentive fees and certain offering expenses reduce GAAP basis net investment income, but do not reduce tax basis net investment income. These tax-related adjustments represent additional net investment income available for distribution for tax purposes. |
It is the Company's policy to comply with all requirements of the Code applicable to RICs and to distribute substantially all of its taxable income to its shareholders. In addition, by distributing during each calendar year substantially all of its net investment income, net realized capital gains and certain other amounts, if any, the Company intends not to be subject to corporate level federal income tax or federal excise taxes. Accordingly, no federal income tax provision was required.
28
CĪON Investment Corporation
Notes to Consolidated Financial Statements (unaudited)
March 31, 2017
(in thousands, except share and per share amounts)
Income and capital gain distributions are determined in accordance with the Code and federal tax regulations, which may differ from amounts determined in accordance with GAAP. These book/tax differences, which could be material, are primarily due to differing treatments of income and gains on various investments held by the Company. Permanent book/tax differences result in reclassifications to capital in excess of par value, accumulated undistributed net investment income, accumulated undistributed realized gain on investments, and accumulated undistributed realized gain on total return swap. During 2016, permanent book/tax differences primarily due to the treatment of the TRS and non-deductible offering costs resulted in a net decrease in distributions in excess of net investment income, a net decrease in accumulated realized gains and a net decrease to capital in excess of par value. These reclassifications had no effect on net assets.
The determination of the tax attributes of the Company’s distributions is made annually as of the end of the Company’s fiscal year based upon the Company’s taxable income for the full year and distributions paid for the full year. The tax characteristics of distributions to shareholders are reported to shareholders annually on Form 1099-DIV. Except for long term capital gains of $906, all distributions for 2016 were characterized as ordinary income distributions for federal income tax purposes.
The tax components of accumulated earnings for the current year will be determined at year end. As of December 31, 2016, the components of accumulated earnings on a tax basis were as follows:
December 31, 2016 | |||
Undistributed ordinary income | $ | 3,847 | |
Undistributed long term capital gains | 924 | ||
Net unrealized depreciation on investments and total return swap | (26,398 | ) | |
Total accumulated earnings | $ | (21,627 | ) |
As of March 31, 2017, the aggregate gross unrealized appreciation for all securities in which there was an excess of value over tax cost was $10,365; the aggregate gross unrealized depreciation for all securities in which there was an excess of tax cost over value was $45,326; the net unrealized depreciation was $34,961; and the aggregate cost of securities for Federal income tax purposes was $1,492,749.
As of December 31, 2016, the aggregate gross unrealized appreciation for all securities in which there was an excess of value over tax cost was $9,389; the aggregate gross unrealized depreciation for all securities in which there was an excess of tax cost over value was $20,202; the net unrealized depreciation was $10,813; and the aggregate cost of securities for Federal income tax purposes was $1,100,291.
Note 6. Investments
The composition of the Company’s investment portfolio as of March 31, 2017 and December 31, 2016 at amortized cost and fair value was as follows:
March 31, 2017 | December 31, 2016 | |||||||||||||||||||||
Cost(1) | Fair Value | Percentage of Investment Portfolio | Cost(1) | Fair Value | Percentage of Investment Portfolio | |||||||||||||||||
Senior secured first lien debt | $ | 872,344 | $ | 866,480 | 62.4 | % | $ | 489,904 | $ | 489,913 | 48.1 | % | ||||||||||
Senior secured second lien debt | 443,788 | 443,637 | 32.0 | % | 437,240 | 434,347 | 42.6 | % | ||||||||||||||
Collateralized securities and structured products - debt | 39,498 | 38,586 | 2.8 | % | 39,471 | 38,114 | 3.7 | % | ||||||||||||||
Collateralized securities and structured products - equity | 33,660 | 31,159 | 2.2 | % | 37,713 | 34,648 | 3.4 | % | ||||||||||||||
Unsecured debt | 3,836 | 3,890 | 0.3 | % | 17,290 | 16,851 | 1.7 | % | ||||||||||||||
Equity | 4,832 | 3,736 | 0.3 | % | 4,832 | 5,107 | 0.5 | % | ||||||||||||||
Subtotal/total percentage | 1,397,958 | 1,387,488 | 100.0 | % | 1,026,450 | 1,018,980 | 100.0 | % | ||||||||||||||
Short term investments(2) | 70,300 | 70,300 | 70,498 | 70,498 | ||||||||||||||||||
Total investments | $ | 1,468,258 | $ | 1,457,788 | $ | 1,096,948 | $ | 1,089,478 | ||||||||||||||
(1) | Cost represents the original cost adjusted for the amortization of premiums and/or accretion of discounts, as applicable, for debt investments and cost for equity investments. |
(2) | Short term investments represent an investment in a fund that invests in highly liquid investments with average original maturity dates of three months or less. |
29
CĪON Investment Corporation
Notes to Consolidated Financial Statements (unaudited)
March 31, 2017
(in thousands, except share and per share amounts)
The following tables show the composition of the Company’s investment portfolio by industry classification and geographic dispersion, and the percentage, by fair value, of the total investment portfolio assets in such industries and geographies as of March 31, 2017 and December 31, 2016:
March 31, 2017 | December 31, 2016 | |||||||||||||
Industry Classification | Investments at Fair Value | Percentage of Investment Portfolio | Investments at Fair Value | Percentage of Investment Portfolio | ||||||||||
High Tech Industries | $ | 232,438 | 16.8 | % | $ | 217,339 | 21.3 | % | ||||||
Services: Business | 215,543 | 15.5 | % | 126,869 | 12.5 | % | ||||||||
Healthcare & Pharmaceuticals | 185,075 | 13.4 | % | 118,337 | 11.6 | % | ||||||||
Diversified Financials | 69,745 | 5.0 | % | 72,762 | 7.1 | % | ||||||||
Media: Advertising, Printing & Publishing | 66,594 | 4.8 | % | 54,354 | 5.3 | % | ||||||||
Telecommunications | 62,358 | 4.5 | % | 35,411 | 3.5 | % | ||||||||
Chemicals, Plastics & Rubber | 61,121 | 4.4 | % | 27,253 | 2.7 | % | ||||||||
Beverage, Food & Tobacco | 55,977 | 4.0 | % | 53,658 | 5.3 | % | ||||||||
Capital Equipment | 55,487 | 4.0 | % | 51,155 | 5.0 | % | ||||||||
Media: Diversified & Production | 51,607 | 3.7 | % | 23,100 | 2.3 | % | ||||||||
Hotel, Gaming & Leisure | 47,973 | 3.5 | % | 28,974 | 2.8 | % | ||||||||
Retail | 46,470 | 3.4 | % | 18,852 | 1.9 | % | ||||||||
Construction & Building | 42,106 | 3.0 | % | 39,137 | 3.8 | % | ||||||||
Automotive | 34,790 | 2.5 | % | 39,192 | 3.9 | % | ||||||||
Services: Consumer | 30,476 | 2.2 | % | 9,477 | 0.9 | % | ||||||||
Aerospace & Defense | 27,822 | 2.0 | % | 21,780 | 2.1 | % | ||||||||
Banking, Finance, Insurance & Real Estate | 21,345 | 1.5 | % | 17,636 | 1.7 | % | ||||||||
Energy: Oil & Gas | 18,846 | 1.4 | % | 12,803 | 1.3 | % | ||||||||
Consumer Goods: Durable | 17,082 | 1.2 | % | 1,000 | 0.1 | % | ||||||||
Metals & Mining | 15,286 | 1.1 | % | 11,349 | 1.1 | % | ||||||||
Media: Broadcasting & Subscription | 12,429 | 0.9 | % | 9,776 | 1.0 | % | ||||||||
Consumer Goods: Non-Durable | 8,501 | 0.6 | % | 8,611 | 0.8 | % | ||||||||
Forest Products & Paper | 5,679 | 0.4 | % | — | — | |||||||||
Environmental Industries | 2,738 | 0.2 | % | 2,595 | 0.3 | % | ||||||||
Energy: Electricity | — | — | 13,715 | 1.3 | % | |||||||||
Containers, Packaging & Glass | — | — | 3,845 | 0.4 | % | |||||||||
Subtotal/total percentage | 1,387,488 | 100.0 | % | 1,018,980 | 100.0 | % | ||||||||
Short term investments | 70,300 | 70,498 | ||||||||||||
Total investments | $ | 1,457,788 | $ | 1,089,478 | ||||||||||
March 31, 2017 | December 31, 2016 | |||||||||||||
Geographic Dispersion(1) | Investments at Fair Value | Percentage of Investment Portfolio | Investments at Fair Value | Percentage of Investment Portfolio | ||||||||||
United States | $ | 1,280,653 | 92.3 | % | $ | 916,260 | 89.9 | % | ||||||
Cayman Islands | 39,864 | 2.9 | % | 43,234 | 4.2 | % | ||||||||
Germany | 24,447 | 1.8 | % | 24,185 | 2.4 | % | ||||||||
Netherlands | 17,034 | 1.2 | % | 10,273 | 1.0 | % | ||||||||
Canada | 16,955 | 1.2 | % | 16,705 | 1.6 | % | ||||||||
Cyprus | 4,697 | 0.3 | % | 4,728 | 0.5 | % | ||||||||
United Kingdom | 2,738 | 0.2 | % | 2,595 | 0.3 | % | ||||||||
Bermuda | 1,100 | 0.1 | % | 1,000 | 0.1 | % | ||||||||
Subtotal/total percentage | 1,387,488 | 100.0 | % | 1,018,980 | 100.0 | % | ||||||||
Short term investments | 70,300 | 70,498 | ||||||||||||
Total investments | $ | 1,457,788 | $ | 1,089,478 | ||||||||||
(1) | The geographic dispersion is determined by the portfolio company's country of domicile. |
As of March 31, 2017, investments on non-accrual status represented 0.2% of total investments on a fair value basis. As of December 31, 2016, there were no investments on non-accrual status.
30
CĪON Investment Corporation
Notes to Consolidated Financial Statements (unaudited)
March 31, 2017
(in thousands, except share and per share amounts)
Except for CCSLF, the Company does not “control” and is not an “affiliate” of any of its portfolio companies, each as defined in the 1940 Act. In general, under the 1940 Act, the Company would be presumed to “control” a portfolio company or issuer if the Company owned 25% or more of its voting securities and would be an “affiliate” of a portfolio company or issuer if the Company owned 5% or more of its voting securities.
The Company’s investment portfolio may contain senior secured investments that are in the form of lines of credit, revolving credit facilities, or unfunded commitments, which may require the Company to provide funding when requested in accordance with the terms of the underlying agreements. As of March 31, 2017 and December 31, 2016, the Company’s unfunded commitments amounted to $90,268 and $65,096, respectively. As of May 10, 2017, the Company’s unfunded commitments amounted to $86,953. Since these commitments may expire without being drawn upon, unfunded commitments do not necessarily represent future cash requirements or future earning assets for the Company. Refer to Note 11 for further details on the Company’s unfunded commitments.
Note 7. Derivative Instruments
In the normal course of business and subject to the requirements of the 1940 Act, the Company enters into derivative instruments as part of its investment strategy.
Credit Default Swap
A credit default swap contract represents an agreement in which one party, the protection buyer, pays a fixed fee, the premium, in return for a payment by the other party, the protection seller, contingent upon a specified default event relating to the underlying reference asset or pool of assets. The valuation of the swap for the approximate net amount to be received or paid (i.e., the fair value) is marked to market either by using pricing vendor quotations, counterparty prices or model prices, and such valuations are based on the fair value of the underlying security, current credit spreads for the referenced obligation of the underlying issuer relative to the terms of the contract, current interest rates, interest accrual through the valuation date and certain other factors. Entering into swaps involves varying degrees of risk, including the possibility that there is no liquid market for the contracts, the counterparty to the swap may default on its obligation to perform and there may be unfavorable changes in the credit spreads of the underlying financial instruments. Credit default swaps are included in the consolidated balance sheets as derivative assets or derivative liabilities.
On October 14, 2016, the Company entered into a credit default swap with JPMorgan Chase Bank N.A. with a base notional amount of €22,000, to purchase protection with respect to Deutsche Bank AG exposure. As of December 31, 2016, the fair value of the credit default swap was $46, which is presented as derivative asset on the consolidated balance sheet. The swap terminated on March 20, 2017.
Total Return Swap
On December 17, 2012, the Company, through its wholly-owned consolidated subsidiary, Flatiron Funding, LLC, or Flatiron, entered into a TRS with Citibank, N.A., or Citibank. Effective December 9, 2013, Flatiron and Citibank amended the TRS to, among other things, increase the maximum aggregate market value of the portfolio of loans subject to the TRS (determined at the time each such loan became subject to the TRS) from $150,000 to $225,000, and increase the interest rate payable by Flatiron to Citibank with respect to each loan included in the TRS by increasing the spread over the floating rate index specified for each such loan from 1.25% to 1.35% per year. Between February 18, 2014 and March 22, 2016, Flatiron and Citibank further amended the TRS on seven occasions to increase the maximum aggregate market value of the portfolio of loans subject to the TRS from $225,000 to $800,000. Effective October 2, 2015, Flatiron and Citibank amended the TRS to extend the termination or call date from December 17, 2015 to March 17, 2016 and to provide that the floating rate index specified for each loan included in the TRS would not be less than zero. On December 22, 2015, Flatiron and Citibank further amended the TRS to reduce the ramp-down period from 90 days to 30 days prior to the termination date, which represented the period when reinvestment was no longer permitted under the terms of the TRS. Effective February 18, 2016, Flatiron and Citibank further amended the TRS to extend the termination or call date from March 17, 2016 to February 18, 2017, and increase the interest rate payable by Flatiron to Citibank with respect to each loan included in the TRS by increasing the spread over the floating rate index specified for each such loan from 1.35% to 1.40% per year. Effective February 18, 2017, Flatiron and Citibank further amended the TRS to extend the termination or call date from February 18, 2017 to April 18, 2017. On April 18, 2017, the TRS expired in accordance with its terms. The agreements between Flatiron and Citibank, which collectively established the TRS, are referred to herein as the TRS Agreement.
31
CĪON Investment Corporation
Notes to Consolidated Financial Statements (unaudited)
March 31, 2017
(in thousands, except share and per share amounts)
Prior to April 18, 2017, any termination prior to the call date would have resulted in payment of an early termination fee to Citibank based on the maximum portfolio amount of the TRS. Under the terms of the TRS, the early termination fee would have equaled the present value of a stream of monthly payments that would have been owed by Flatiron to Citibank for the period from the termination date through and including the call date. Such monthly payments would have equaled the product of 80% of the maximum portfolio amount, multiplied by the spread over the floating index rate. The Company estimates the early termination fee would have been approximately $448 at March 31, 2017. Through February 18, 2017, Flatiron was subject to a minimum usage fee in connection with the TRS. As of March 31, 2017 and December 31, 2016, Flatiron owed Citibank a minimum usage fee of $381 and $176, respectively.
A TRS is a contract in which one party agrees to make periodic payments to another party based on the change in the market value of and interest payments from the assets underlying the TRS in return for periodic payments based on a fixed or variable interest rate. A TRS effectively adds leverage to a portfolio by providing investment exposure to a security or market without owning or taking physical custody of such security or investing directly in such market. Because of the unique structure of a TRS, a TRS typically offers lower financing costs than are offered through more traditional borrowing arrangements.
The TRS with Citibank enabled the Company, through its ownership of Flatiron, to obtain the economic benefit of owning the loans subject to the TRS, without actually owning them, in return for an interest-type payment to Citibank. As such, the TRS was analogous to Flatiron borrowing funds to acquire loans and incurring interest expense to a lender. Under the terms of the TRS Agreement, each asset underlying the TRS constituted a separate total return swap transaction, although all calculations and payments required to be made under the TRS Agreement were calculated and treated on an aggregate basis, based upon all such transactions.
The obligations of Flatiron under the TRS were non-recourse to the Company and the Company’s exposure under the TRS was limited to the value of the Company’s investment in Flatiron, which generally equaled the value of cash collateral provided by Flatiron under the TRS. Pursuant to the terms of the TRS, Flatiron could have selected loans with a maximum aggregate market value (determined at the time each such loan became subject to the TRS) of $800,000. Flatiron was required to initially cash collateralize a specified percentage of each loan (generally 25% of the market value of such loan) included under the TRS in accordance with margin requirements described in the TRS Agreement. Under the terms of the TRS, Flatiron agreed not to draw upon, or post as collateral, such cash collateral in respect of other financings or operating requirements prior to the termination of the TRS. Neither the cash collateral required to be posted with Citibank nor any other assets of Flatiron were available to pay the debts of the Company.
Unless otherwise specified, each individual loan must have met the obligation criteria described in the TRS Agreement, which included requirements that the loan be rated by Moody’s and S&P, be part of a loan facility of at least $125 million and have at least two bid quotations from a nationally-recognized pricing service. Under the terms of the TRS, Citibank, as calculation agent, determined whether there was a failure to satisfy the obligation criteria for each loan in the TRS. If such failure continued for 30 days following the delivery of notice thereof, then Citibank had the right, but not the obligation, to remove the underlying loan from the TRS either through a sale negotiated by the Company or the price determined by Citibank. Citibank also determined whether there was a failure to satisfy the portfolio criteria in the TRS, which included limits on issuer and industry concentration as well as Moody’s and S&P credit metrics. If such failure continued for 30 days following the delivery of notice thereof, then Citibank had the right, but not the obligation, to terminate the TRS. Flatiron received from Citibank all interest and fees payable in respect of the loans included in the TRS. Flatiron paid to Citibank interest at a rate equal to, in respect of each loan included in the TRS, the floating rate index specified for such loan, which would not be less than zero, plus 1.40% per year. In addition, upon the termination or repayment of any loan subject to the TRS, Flatiron either received from Citibank the appreciation in the value of such loan or paid to Citibank any depreciation in the value of such loan.
Under the terms of the TRS, Flatiron may have been required to post additional cash collateral, on a dollar-for-dollar basis, in the event of depreciation in the value of the underlying loans after such value decreased below a specified amount. The limit on the additional collateral that Flatiron may have been required to post pursuant to the TRS was equal to the difference between the full notional amount of the loans underlying the TRS and the amount of cash collateral already posted by Flatiron. The amount of collateral required to be posted by Flatiron was determined primarily on the basis of the aggregate value of the underlying loans.
The Company had no contractual obligation to post any such additional collateral or to make any interest payments to Citibank on behalf of Flatiron. The Company could have, but was not obligated to, increase its investment in Flatiron for the purpose of funding any additional collateral or payment obligations for which Flatiron became obligated during the term of the TRS. If the Company did not make any such additional investment in Flatiron and Flatiron failed to meet its obligations under the TRS, then Citibank had the right to terminate the TRS and seize the cash collateral posted by Flatiron under the TRS. In the event of an early termination of the TRS, Flatiron would have been required to pay an early termination fee.
32
CĪON Investment Corporation
Notes to Consolidated Financial Statements (unaudited)
March 31, 2017
(in thousands, except share and per share amounts)
The value of the TRS was based on the increase or decrease in the value of the loans underlying the TRS, as determined by the Company. The loans underlying the TRS were valued in the same manner as loans owned by the Company. As of March 31, 2017 and December 31, 2016, the fair value of the TRS was $134 and ($15,402), respectively. The fair value of the TRS is reflected as unrealized appreciation (depreciation) on total return swap on the Company’s consolidated balance sheets. The change in value of the TRS is reflected in the Company’s consolidated statements of operations as net change in unrealized appreciation (depreciation) on total return swap. As of March 31, 2017 and December 31, 2016, Flatiron had selected 5 and 51 underlying loans with a total notional amount of $13,790 and $407,847, respectively. For the same periods, Flatiron posted $20,081 and $143,335 in cash collateral held by Citibank (of which only $20,081 and $131,073 was required to be posted), which is reflected in due from counterparty on the Company’s consolidated balance sheets.
Payable or receivable on total return swap is composed of any amounts due from Citibank that consist of earned but not yet collected net interest and fees and net gains on sales and principal repayments of the underlying loans of the TRS. As of March 31, 2017 and December 31, 2016, the (payable)/receivable on total return swap consisted of the following:
March 31, 2017 | December 31, 2016 | ||||||
Interest and other income from TRS portfolio | $ | 7,385 | $ | 5,620 | |||
Interest and other expense from TRS portfolio | (2,995 | ) | (1,928 | ) | |||
Net (loss) gain on TRS loan sales | (17,077 | ) | 495 | ||||
(Payable)/receivable on total return swap | $ | (12,687 | ) | $ | 4,187 | ||
Realized gains and losses on the TRS are composed of any gains or losses on loans underlying the TRS as well as net interest and fees earned during the period. For the three months ended March 31, 2017 and 2016, the net realized (loss) gain on the TRS consisted of the following:
Three Months Ended March 31, | ||||||||
2017 | 2016 | |||||||
Interest and other income from TRS portfolio | $ | 6,082 | $ | 11,646 | ||||
Interest and other expense from TRS portfolio | (2,767 | ) | (3,453 | ) | ||||
Net (loss) gain on TRS loan sales | (17,584 | ) | 169 | |||||
Net realized (loss) gain (1) | $ | (14,269 | ) | $ | 8,362 | |||
(1) | Net realized (loss) gain is reflected in net realized (loss) gain on total return swap on the Company's consolidated statements of operations. |
In connection with the TRS, Flatiron was required to comply with various covenants and reporting requirements as defined in the TRS Agreement. As of and for the three months ended March 31, 2017, Flatiron was in compliance with all covenants and reporting requirements.
CIM did not take any incentive fees with respect to the Company’s TRS. For purposes of computing the capital gains incentive fee, CIM became entitled to a capital gains incentive fee upon the termination of the TRS, at which point all gains and losses of the underlying loans constituting the reference assets of the TRS were realized. However, realized losses exceeded realized gains on the underlying loans, resulting in no capital gains incentive fees on the TRS. For purposes of computing the subordinated incentive fee on income, CIM was not entitled to a subordinated incentive fee on income with respect to the TRS. The net unrealized appreciation on the TRS, if any, was reflected in total assets on the Company’s consolidated balance sheets and included in the computation of the base management fee. The base management fee did not include any net unrealized depreciation on the TRS as such amounts were not included in total assets.
While the investment advisory agreement with CIM neither includes nor contemplates the inclusion of unrealized gains in the calculation of the capital gains incentive fee, pursuant to an interpretation of the AICPA Technical Practice Aid for investment companies, the Company accrues capital gains incentive fees on unrealized gains. This accrual reflects the incentive fees that would be payable to CIM if the Company’s entire investment portfolio was liquidated at its fair value as of the balance sheet date even though CIM is not entitled to an incentive fee with respect to unrealized gains unless and until such gains are actually realized.
For purposes of the asset coverage ratio test applicable to the Company as a BDC, the Company treated the outstanding notional amount of the TRS, less the total amount of cash collateral posted by Flatiron under the TRS, as a senior security for the life of that instrument.
Further, for purposes of Section 55(a) under the 1940 Act, the Company treated each loan underlying the TRS as a qualifying asset if the obligor on such loan was an eligible portfolio company and as a non-qualifying asset if the obligor was not an eligible portfolio company.
On March 29, 2017, Flatiron Funding II, LLC, or Flatiron Funding II, a newly-formed, wholly-owned, consolidated, special purpose financing subsidiary of the Company, purchased certain loans underlying the TRS with a notional value of $363,860. See Note 8 for additional information on Flatiron Funding II.
33
CĪON Investment Corporation
Notes to Consolidated Financial Statements (unaudited)
March 31, 2017
(in thousands, except share and per share amounts)
The following is a summary of the underlying loans subject to the TRS as of March 31, 2017:
Underlying Loans(a) | Index Rate(b) | Industry | Notional Amount | Fair Value(c) | Unrealized Appreciation / (Depreciation) | |||||||||||
Senior Secured First Lien Debt | ||||||||||||||||
Advanced Integration Technology LP, L+550, 1.00% LIBOR Floor, 4/3/2023(d) | 1 Month LIBOR | Aerospace & Defense | $ | 4,000 | $ | 4,035 | $ | 35 | ||||||||
American Residential Services, LLC, L+400, 1.00% LIBOR Floor, 6/30/2022(d) | 1 Month LIBOR | Construction & Building | 2,865 | 2,888 | 23 | |||||||||||
Navex Global, Inc., L+425, 1.00% LIBOR Floor, 11/19/2021(d) | 1 Month LIBOR | High Tech Industries | 4,347 | 4,386 | 39 | |||||||||||
SG Acquisition, Inc., L+500, 1.00% LIBOR Floor, 3/29/2024(d) | 3 Month LIBOR | Banking, Finance, Insurance & Real Estate | 662 | 661 | (1 | ) | ||||||||||
WD Wolverine Holdings, LLC, L+550, 1.00% LIBOR Floor, 8/16/2022(d) | 3 Month LIBOR | Healthcare & Pharmaceuticals | 1,916 | 1,954 | 38 | |||||||||||
Total Senior Secured First Lien Debt | $ | 13,790 | $ | 13,924 | $ | 134 | ||||||||||
Total | $ | 13,790 | $ | 13,924 | $ | 134 | ||||||||||
a. | All of the underlying loans subject to the TRS are issued by eligible U.S. portfolio companies, as defined in the 1940 Act. The Company does not control and is not an affiliate of any of the companies that are issuers of the underlying loans subject to the TRS. |
b. | The 1 and 3 month LIBOR rates were 0.98% and 1.15%, respectively, as of March 31, 2017. The actual LIBOR rate for each loan listed may not be the applicable LIBOR rate as of March 31, 2017, as the loan may have been priced or repriced based on a LIBOR rate prior to or subsequent to March 31, 2017. |
c. | Fair value determined in good faith by the Company’s board of directors (see Note 9). |
d. | Position or a portion thereof unsettled as of March 31, 2017. |
34
CĪON Investment Corporation
Notes to Consolidated Financial Statements (unaudited)
March 31, 2017
(in thousands, except share and per share amounts)
The following is a summary of the underlying loans subject to the TRS as of December 31, 2016:
Underlying Loans(a) | Index Rate(b) | Industry | Notional Amount | Fair Value(c) | Unrealized Appreciation / (Depreciation) | |||||||||||
Senior Secured First Lien Debt | ||||||||||||||||
Academy, Ltd., L+400, 1.00% LIBOR Floor, 7/1/2022 | Various | Retail | $ | 14,564 | $ | 13,653 | $ | (911 | ) | |||||||
Access CIG, LLC, L+500, 1.00% LIBOR Floor, 10/18/2021 | 3 Month LIBOR | Services: Business | 6,751 | 6,798 | 47 | |||||||||||
ALM Media, LLC, L+450, 1.00% LIBOR Floor, 7/31/2020 | 3 Month LIBOR | Media: Advertising, Printing & Publishing | 7,679 | 7,328 | (351 | ) | ||||||||||
Alvogen Pharma US, Inc., L+500, 1.00% LIBOR Floor, 4/1/2022 | 3 Month LIBOR | Healthcare & Pharmaceuticals | 9,430 | 9,150 | (280 | ) | ||||||||||
American Dental Partners, Inc., L+475, 1.00% LIBOR Floor, 8/29/2021 | 3 Month LIBOR | Healthcare & Pharmaceuticals | 12,158 | 12,219 | 61 | |||||||||||
American Energy - Marcellus, LLC, L+425, 1.00% LIBOR Floor, 8/4/2020 | 3 Month LIBOR | Energy: Oil & Gas | 4,254 | 2,370 | (1,884 | ) | ||||||||||
American Residential Services, LLC, L+450, 1.00% LIBOR Floor, 6/30/2021 | 3 Month LIBOR | Construction & Building | 14,067 | 14,269 | 202 | |||||||||||
Aquilex, LLC, L+400, 1.00% LIBOR Floor, 12/31/2020 | 3 Month LIBOR | Chemicals, Plastics & Rubber | 1,810 | 1,778 | (32 | ) | ||||||||||
Avaya Inc., L+525, 1.00% LIBOR Floor, 5/29/2020 | 3 Month LIBOR | Telecommunications | 14,542 | 12,798 | (1,744 | ) | ||||||||||
Azure Midstream Energy, LLC, L+650, 1.00% LIBOR Floor, 11/15/2018 | 1 Month LIBOR | Energy: Oil & Gas | 2,375 | 2,200 | (175 | ) | ||||||||||
Caraustar Industries, Inc., L+675, 1.25% LIBOR Floor, 5/1/2019 | 3 Month LIBOR | Forest Products & Paper | 11,954 | 12,521 | 567 | |||||||||||
Central Security Group, Inc., L+563, 1.00% LIBOR Floor, 10/6/2020 | 1 Month LIBOR | Services: Consumer | 12,915 | 13,058 | 143 | |||||||||||
Charming Charlie, LLC, L+800, 1.00% LIBOR Floor, 12/24/2019 | 3 Month LIBOR | Retail | 7,723 | 4,314 | (3,409 | ) | ||||||||||
CSP Technologies North America, LLC, L+600, 1.00% LIBOR Floor, 1/29/2022 | 3 Month LIBOR | Chemicals, Plastics & Rubber | 13,385 | 13,590 | 205 | |||||||||||
CT Technologies Intermediate Holdings, Inc., L+425, 1.00% LIBOR Floor, 12/1/2021 | 1 Month LIBOR | Healthcare & Pharmaceuticals | 14,681 | 14,160 | (521 | ) | ||||||||||
David's Bridal, Inc., L+400, 1.25% LIBOR Floor, 10/11/2019 | 3 Month LIBOR | Retail | 3,339 | 3,095 | (244 | ) | ||||||||||
DBRS, Inc., L+525, 1.00% LIBOR Floor, 3/4/2022(d) | 3 Month LIBOR | Services: Business | 12,874 | 12,094 | (780 | ) | ||||||||||
EIG Investors Corp., L+548, 1.00% LIBOR Floor, 11/9/2019(d) | 3 Month LIBOR | Services: Business | 1,773 | 1,772 | (1 | ) | ||||||||||
Emmis Operating Company, L+600, 1.00% LIBOR Floor, 6/10/2021 | 3 Month LIBOR | Media: Broadcasting & Subscription | 7,508 | 7,075 | (433 | ) | ||||||||||
Evergreen Skills Lux S.À.R.L., L+475, 1.00% LIBOR Floor, 4/28/2021(d) | 6 Month LIBOR | High Tech Industries | 7,174 | 6,821 | (353 | ) | ||||||||||
Global Cash Access, Inc., L+525, 1.00% LIBOR Floor, 12/18/2020 | 2 Month LIBOR | Hotel, Gaming & Leisure | 10,483 | 10,406 | (77 | ) | ||||||||||
Healogics, Inc., L+425, 1.00% LIBOR Floor, 7/1/2021 | 3 Month LIBOR | Healthcare & Pharmaceuticals | 4,829 | 4,520 | (309 | ) | ||||||||||
IMG Worldwide Holdings, LLC, L+425, 1.00% LIBOR Floor, 5/6/2021 | 3 Month LIBOR | Media: Diversified & Production | 7,111 | 7,277 | 166 | |||||||||||
LTCG Holdings Corp., L+500, 1.00% LIBOR Floor, 6/6/2020 | 1 Month LIBOR | Services: Business | 5,882 | 5,409 | (473 | ) | ||||||||||
Murray Energy Corp., L+725, 1.00% LIBOR Floor, 4/16/2020 | 3 Month LIBOR | Metals & Mining | 3,588 | 3,528 | (60 | ) | ||||||||||
Navex Global, Inc, L+475, 1.00% LIBOR Floor, 11/19/2021 | 6 Month LIBOR | High Tech Industries | 13,597 | 13,617 | 20 | |||||||||||
Nielsen & Bainbridge, LLC, L+500, 1.00% LIBOR Floor, 8/15/2020 | 6 Month LIBOR | Consumer Goods: Durable | 15,843 | 15,942 | 99 | |||||||||||
Oasis Outsourcing Holdings, Inc., L+475, 1.00% LIBOR Floor, 12/26/2021 | 1 Month LIBOR | Services: Business | 9,319 | 9,472 | 153 | |||||||||||
Onex TSG Holdings II Corp., L+400, 1.00% LIBOR Floor, 7/29/2022 | 3 Month LIBOR | Healthcare & Pharmaceuticals | 3,408 | 3,441 | 33 | |||||||||||
Opal Acquisition, Inc., L+400, 1.00% LIBOR Floor, 11/27/2020 | 3 Month LIBOR | Healthcare & Pharmaceuticals | 10,236 | 9,802 | (434 | ) | ||||||||||
Pelican Products, Inc., L+425, 1.00% LIBOR Floor, 4/10/2020 | 3 Month LIBOR | Chemicals, Plastics & Rubber | 2,493 | 2,503 | 10 | |||||||||||
Photonis Technologies SAS, L+750, 1.00% LIBOR Floor, 9/18/2019(d) | 3 Month LIBOR | Aerospace & Defense | 6,337 | 5,564 | (773 | ) | ||||||||||
PSC Industrial Holdings Corp., L+475, 1.00% LIBOR Floor, 12/5/2020 | 3 Month LIBOR | Services: Business | 4,851 | 4,741 | (110 | ) | ||||||||||
Scientific Games International, Inc., L+500, 1.00% LIBOR Floor, 10/1/2021(d) | Various | Hotel, Gaming & Leisure | 10,400 | 10,665 | 265 | |||||||||||
SESAC Holdco II LLC, L+425, 1.00% LIBOR Floor, 2/7/2019 | 1 Month LIBOR | Media: Broadcasting & Subscription | 2,935 | 2,938 | 3 | |||||||||||
SG Acquisition, Inc., L+525, 1.00% LIBOR Floor, 8/19/2021 | 3 Month LIBOR | Banking, Finance, Insurance & Real Estate | 11,414 | 11,547 | 133 | |||||||||||
SI Organization, Inc., L+475, 1.00% LIBOR Floor, 11/23/2019 | 3 Month LIBOR | Services: Business | 7,746 | 7,866 | 120 | |||||||||||
STG-Fairway Acquisitions, Inc., L+525, 1.00% LIBOR Floor, 6/30/2022 | 3 Month LIBOR | Services: Business | 3,845 | 3,840 | (5 | ) | ||||||||||
Survey Sampling International, LLC, L+500, 1.00% LIBOR Floor, 12/16/2020 | 3 Month LIBOR | Services: Business | 7,781 | 7,899 | 118 | |||||||||||
TIBCO Software Inc., L+550, 1.00% LIBOR Floor, 12/4/2020 | 1 Month LIBOR | High Tech Industries | 16,827 | 17,319 | 492 | |||||||||||
Travel Leaders Group, LLC, L+600, 1.00% LIBOR Floor, 12/7/2020 | 1 Month LIBOR | Services: Consumer | 5,169 | 5,176 | 7 | |||||||||||
Vince, LLC, L+500, 1.00% LIBOR Floor, 11/27/2019(d) | 3 Month LIBOR | Retail | 1,124 | 1,093 | (31 | ) | ||||||||||
Western Dental Services, Inc., L+650, 1.00% LIBOR Floor, 11/1/2018 | 3 Month LIBOR | Healthcare & Pharmaceuticals | 5,573 | 5,566 | (7 | ) | ||||||||||
Total Senior Secured First Lien Debt | 351,747 | 341,194 | (10,553 | ) | ||||||||||||
35
CĪON Investment Corporation
Notes to Consolidated Financial Statements (unaudited)
March 31, 2017
(in thousands, except share and per share amounts)
Underlying Loans(a) | Index Rate(b) | Industry | Notional Amount | Fair Value(c) | Unrealized Appreciation / (Depreciation) | |||||||||||
Senior Secured Second Lien Debt | ||||||||||||||||
Asurion, LLC, L+750, 1.00% LIBOR Floor, 3/3/2021 | 1 Month LIBOR | Services: Consumer | 7,772 | 8,044 | 272 | |||||||||||
Evergreen Skills Lux S.À.R.L., L+825, 1.00% LIBOR Floor, 4/28/2022(d) | 6 Month LIBOR | High Tech Industries | 9,798 | 7,594 | (2,204 | ) | ||||||||||
GOBP Holdings, Inc., L+825, 1.00% LIBOR Floor, 10/21/2022 | 3 Month LIBOR | Retail | 3,940 | 4,010 | 70 | |||||||||||
Mergermarket USA, Inc., L+650, 1.00% LIBOR Floor, 2/4/2022 | 3 Month LIBOR | Services: Business | 6,965 | 6,842 | (123 | ) | ||||||||||
Onex Carestream Finance LP, L+850, 1.00% LIBOR Floor, 12/7/2019 | 3 Month LIBOR | Healthcare & Pharmaceuticals | 13,600 | 11,318 | (2,282 | ) | ||||||||||
Pelican Products, Inc., L+825, 1.00% LIBOR Floor, 4/11/2021 | 3 Month LIBOR | Chemicals, Plastics & Rubber | 8,050 | 7,830 | (220 | ) | ||||||||||
PFS Holding Corp., L+725, 1.00% LIBOR Floor, 1/31/2022 | 1 Month LIBOR | Retail | 4,973 | 4,636 | (337 | ) | ||||||||||
Securus Technologies Holdings, Inc., L+775, 1.25% LIBOR Floor, 4/30/2021 | 3 Month LIBOR | Telecommunications | 1,002 | 977 | (25 | ) | ||||||||||
Total Senior Secured Second Lien Debt | 56,100 | 51,251 | (4,849 | ) | ||||||||||||
Total | $ | 407,847 | $ | 392,445 | $ | (15,402 | ) | |||||||||
(a) | All of the underlying loans subject to the TRS are issued by eligible U.S. portfolio companies, as defined in the 1940 Act, except for investments specifically identified as non-qualifying per note (d) below. The Company does not control and is not an affiliate of any of the companies that are issuers of the underlying loans subject to the TRS. |
(b) | The 1, 2, 3, and 6 month LIBOR rates were 0.77%, 0.82%, 1.00% and 1.32%, respectively, as of December 31, 2016. The actual LIBOR rate for each loan listed may not be the applicable LIBOR rate as of December 31, 2016, as the loan may have been priced or repriced based on a LIBOR rate prior to or subsequent to December 31, 2016. |
(c) | Fair value determined in good faith by the Company’s board of directors (see Note 9). |
(d) | All or a portion of the underlying loan subject to the TRS is not a qualifying asset under the 1940 Act. A business development company may not acquire any asset other than qualifying assets, unless, at the time the acquisition is made, qualifying assets represent at least 70% of the company’s total assets as defined under Section 55 of the 1940 Act. As of December 31, 2016, 90.5% of the Company’s total assets represented qualifying assets. In addition, as described in this Note 7, the Company calculates its compliance with the qualifying asset test on a “look through” basis by treating each loan underlying the TRS as either a qualifying asset or non-qualifying asset based on whether the obligor is an eligible portfolio company. On this basis, 89.1% of the Company’s total assets represented qualifying assets as of December 31, 2016. |
(e) | For the year ended December 31, 2016, the following underlying loans subject to the TRS contain a PIK interest provision whereby the issuer has either the option or the obligation to make interest payments with the issuance of additional securities: |
Interest Rate | Interest Amount | |||||||||||||||||||
Issuer of Underlying Loan | Investment Type | Cash | PIK | All-in-Rate | Cash | PIK | All-in-Rate | |||||||||||||
Smile Brands Group, Inc.(f) | Senior Secured First Lien Debt | 7.50% | 1.50% | 9.00% | $ | 233 | $ | 41 | $ | 274 | ||||||||||
Southcross Holdings Borrower LP(g) | Senior Secured First Lien Debt | 3.50% | 5.50% | 9.00% | $ | 1 | $ | 1 | $ | 2 | ||||||||||
(f) | Outstanding principal and accrued interest of the underlying loan was fully repaid on August 17, 2016. |
(g) | Prior to December 31, 2016, the underlying loan was assigned to the Company and removed from the TRS. |
Note 8. Credit Facilities
Citibank Credit Facility
On March 29, 2017, Flatiron Funding II entered into a senior secured credit facility with Citibank. The senior secured credit facility with Citibank, or the Citibank Credit Facility, provides for a revolving credit facility in an aggregate principal amount of $325,000 subject to compliance with a borrowing base. On March 29, 2017, Flatiron Funding II drew down $231,698 of borrowings under the Citibank Credit Facility.
Advances under the Citibank Credit Facility bear interest at a floating rate equal to (1) the higher of (a) the Citibank prime rate, (b) the federal funds rate plus 1.5% or (c) the three-month LIBOR plus 1.0%, plus (2) a spread of (a) 2% per year during the period from and including March 29, 2017 and the earlier of March 29, 2019 and the date the Citibank Credit Facility matures, or (b) 3% per year during the period from the date the Citibank Credit Facility matures until all obligations under the Citibank Credit Facility have been paid in full. Interest is payable quarterly in arrears. All advances under the Citibank Credit Facility will mature, and all accrued and unpaid interest thereunder will be due and payable, by no later than March 30, 2020. Flatiron Funding II may prepay advances pursuant to the terms and conditions of the credit and security agreement, subject to a 0.75% or 0.50% premium if the amount of the Citibank Credit Facility is reduced or terminated on or prior to March 29, 2018 or March 29, 2019, respectively. In addition, Flatiron Funding II will be subject to a non-usage fee of 0.75% per year (subject to an increase to 2% in certain circumstances) on the amount, if any, of the aggregate principal amount available under the Citibank Credit Facility that has not been borrowed. The non-usage fees, if any, are payable quarterly in arrears. Flatiron Funding II incurred certain customary costs and expenses in connection with obtaining the Citibank Credit Facility.
The Company incurred debt issuance costs of $1,816 in connection with obtaining the Citibank Credit Facility, which were recorded as a direct reduction to the outstanding balance of the Citibank Credit Facility, which is included in the Company’s consolidated balance sheet as of March 31, 2017 and will amortize to interest expense over the term of the Citibank Credit Facility. At March 31, 2017, the unamortized portion of the debt issuance costs was $1,811.
36
CĪON Investment Corporation
Notes to Consolidated Financial Statements (unaudited)
March 31, 2017
(in thousands, except share and per share amounts)
Flatiron Funding II purchased loans and other corporate debt securities with a fair value of $354,967 on the closing date pursuant to master participation and assignment agreements between Flatiron Funding II and each of 15th Street Loan Funding LLC and 15th Street Loan Funding 2 LLC, each a special purpose subsidiary of Citibank. 15th Street Loan Funding LLC and 15th Street Loan Funding 2 LLC held loans and other corporate debt securities in connection with the TRS Agreement between Citibank and Flatiron. Flatiron Funding II’s obligations to Citibank under the Citibank Credit Facility are secured by a first priority security interest in all of the assets of Flatiron Funding II. The obligations of Flatiron Funding II under the Citibank Credit Facility are non-recourse to the Company, and the Company’s exposure under the Citibank Credit Facility is limited to the value of the Company’s investment in Flatiron Funding II.
In connection with the Citibank Credit Facility, Flatiron Funding II has made certain representations and warranties and is required to comply with various covenants, reporting requirements and other customary requirements for similar facilities. From the inception of the Citibank Credit Facility on March 29, 2017 to March 31, 2017, Flatiron Funding II was in compliance with all covenants and reporting requirements.
For the period from March 29, 2017 through March 31, 2017, the components of interest expense, average borrowings, and weighted average interest rate for the Citibank Credit Facility were as follows:
Stated interest expense | $ | 61 | ||||
Non-usage fee | 6 | |||||
Amortization of deferred financing costs | 5 | |||||
Total interest expense | $ | 72 | ||||
Weighted average interest rate(1) | 3.45 | % | ||||
Average borrowings | $ | 231,698 | ||||
(1) | Includes the stated interest expense and non-usage fee on the unused portion of the Citibank Credit Facility and is annualized for periods covering less than one year. |
JPM Credit Facility
On August 26, 2016, 34th Street Funding, LLC, or 34th Street, a newly-formed, wholly-owned, consolidated, special purpose financing subsidiary of the Company, entered into a senior secured credit facility with JPMorgan Chase Bank, National Association, or JPM. The senior secured credit facility with JPM, or the JPM Credit Facility, provides for borrowings in an aggregate principal amount of $150,000, of which $25,000 may be funded as a revolving credit facility, subject to conditions described in the JPM Credit Facility. On August 26, 2016, 34th Street drew down $57,000 of borrowings under the JPM Credit Facility.
On September 30, 2016, 34th Street amended and restated the JPM Credit Facility, or the Amended JPM Credit Facility, with JPM. Under the Amended JPM Credit Facility, the aggregate principal amount available for borrowings was increased from $150,000 to $225,000, of which $25,000 may be funded as a revolving credit facility, subject to conditions described in the Amended JPM Credit Facility. On September 30, 2016, 34th Street drew down $167,423 of additional borrowings under the Amended JPM Credit Facility, a portion of which was used to purchase the portfolio of loans from Credit Suisse Park View BDC, Inc. No other material terms of the JPM Credit Facility were revised in connection with the Amended JPM Credit Facility.
Advances under the Amended JPM Credit Facility bear interest at a floating rate equal to the three-month LIBOR, plus a spread of 3.50% per year. Interest is payable quarterly in arrears. All advances under the Amended JPM Credit Facility will mature, and all accrued and unpaid interest thereunder will be due and payable, by no later than August 23, 2020. 34th Street may prepay advances pursuant to the terms and conditions of the Amended JPM Credit Facility, subject to a 1% premium in certain circumstances. In addition, 34th Street will be subject to a non-usage fee of 0.5% and 1.0% per year on the amount, if any, of the aggregate principal amount available under the Amended JPM Credit Facility that has not been borrowed during the period from the closing date and ending on, but excluding, May 23, 2017, or the Ramp-Up Period, and from the termination of the Ramp-Up Period and ending on, but excluding, August 23, 2019, respectively. The non-usage fees, if any, are payable quarterly in arrears.
The Company contributed loans and other corporate debt securities to 34th Street in exchange for 100% of the membership interests of 34th Street, and may contribute additional loans and other corporate debt securities to 34th Street in the future. 34th Street’s obligations to JPM under the Amended JPM Credit Facility are secured by a first priority security interest in all of the assets of 34th Street. The obligations of 34th Street under the Amended JPM Credit Facility are non-recourse to the Company, and the Company’s exposure under the Amended JPM Credit Facility is limited to the value of the Company’s investment in 34th Street.
In connection with the Amended JPM Credit Facility, 34th Street has made certain representations and warranties and is required to comply with various covenants, reporting requirements and other customary requirements for similar facilities. As of and for the three months ended March 31, 2017, 34th Street was in compliance with all covenants and reporting requirements.
The Company incurred debt issuance costs of $3,514 in connection with obtaining and amending the JPM Credit Facility, which were recorded as a direct reduction to the outstanding balance of the Amended JPM Credit Facility, which is included in the Company’s consolidated balance sheets and will amortize to interest expense over the term of the Amended JPM Credit Facility. At March 31, 2017, the unamortized portion of the debt issuance costs was $2,994.
37
CĪON Investment Corporation
Notes to Consolidated Financial Statements (unaudited)
March 31, 2017
(in thousands, except share and per share amounts)
For the three months ended March 31, 2017, the components of interest expense, average borrowings, and weighted average interest rate for the Amended JPM Credit Facility were as follows:
Stated interest expense | $ | 2,535 | ||
Non-usage fee | 1 | |||
Amortization of deferred financing costs | 218 | |||
Total interest expense | $ | 2,754 | ||
Weighted average interest rate(1) | 4.48 | % | ||
Average borrowings | $ | 224,423 | ||
(1) | Includes the stated interest expense and non-usage fee on the unused portion of the Amended JPM Credit Facility and is annualized for periods covering less than one year. |
East West Bank Credit Facility
On April 30, 2015, the Company entered into a revolving credit facility, or the EWB Credit Facility, with East West Bank, or EWB. The EWB Credit Facility provided for borrowings in an aggregate principal amount of up to $40,000, subject to certain conditions, and the Company was required to maintain $2,000 in a demand deposit account with EWB at all times. As of and for the three months ended March 31, 2017, the Company was in compliance with all covenants and reporting requirements under the EWB Credit Facility. On April 27, 2017, the EWB Credit Facility expired in accordance with its terms. There were no outstanding borrowings under the EWB Credit Facility as of April 27, 2017.
Advances under the EWB Credit Facility bore interest at a floating rate equal to (i) the greater of 3.25% per year or the variable rate of interest per year announced by EWB as its prime rate, which was 4.00% at March 31, 2017, plus (ii) a spread of 0.75%. Interest was payable quarterly in arrears. Each advance under the EWB Credit Facility was due and payable on the earlier of 90 days from the date such advance was made by EWB, or April 27, 2017. The Company could have prepaid any advance without penalty or premium. The Company was subject to a non-usage fee of 0.50% per year on the average amount, if any, of the aggregate principal amount available under the EWB Credit Facility that was not borrowed, payable at the end of each quarter. The non-usage fee, if any, was payable quarterly in arrears. The Company’s obligations to EWB under the EWB Credit Facility were secured by a first priority security interest in certain eligible investments in which the Company had a beneficial interest, as updated from time to time.
On January 28, 2016, the Company entered into the first amendment to the EWB Credit Facility with EWB. Under the original EWB Credit Facility, the borrowing base was the lesser of (i) the average monthly net proceeds received by the Company from the sale of its equity securities during the trailing three month period ending on the last day of the immediately preceding calendar month; or (ii) 50% of collateral securing the EWB Credit Facility. Under the first amendment, during the period commencing on January 30, 2016 through July 31, 2016, (i) the trailing equity component of the borrowing base was removed; (ii) the borrowing base was decreased to 40% of the collateral securing the EWB Credit Facility; and (iii) the required minimum fair market value of the collateral securing the EWB Credit Facility was increased from two to two and one-half times all outstanding advances under the EWB Credit Facility. Prior to entering into the second amendment to the EWB Credit Facility (as described below), these amended provisions were scheduled to revert back to their original terms on July 31, 2016.
On April 21, 2016, the Company entered into the second amendment to the EWB Credit Facility with EWB. Under the second amendment, the date after which the amended provisions of the first amendment reverted back to their original terms was extended from July 31, 2016 to September 30, 2016 and the maturity date of the EWB Credit Facility was extended from April 29, 2016 to April 27, 2017.
The Company incurred costs of $278 in connection with obtaining the EWB Credit Facility, which the Company initially recorded as prepaid expenses and other assets on the Company’s consolidated balance sheets and amortized to interest expense over the initial life of the EWB Credit Facility. On April 21, 2016, the Company incurred additional costs of $200 in connection with the second amendment to the EWB Credit Facility, which the Company initially recorded as prepaid expenses and other assets on the Company’s consolidated balance sheets and amortizes to interest expense over the life of the EWB Credit Facility pursuant to the second amendment.
For the three months ended March 31, 2017 and 2016, the components of interest expense and average borrowings for the EWB Credit Facility were as follows:
Three Months Ended March 31, | |||||||
2017 | 2016 | ||||||
Amortization of deferred financing costs | $ | 50 | $ | 69 | |||
Non-usage fee | 50 | 51 | |||||
Total interest expense | $ | 100 | $ | 120 | |||
Average borrowings | $ | — | $ | — | |||
38
CĪON Investment Corporation
Notes to Consolidated Financial Statements (unaudited)
March 31, 2017
(in thousands, except share and per share amounts)
Note 9. Fair Value of Financial Instruments
The following table presents fair value measurements of the Company’s portfolio investments and TRS as of March 31, 2017 and December 31, 2016, according to the fair value hierarchy:
March 31, 2017 | December 31, 2016 | ||||||||||||||||||||||||||||||
Level 1 | Level 2 | Level 3 | Total | Level 1 | Level 2 | Level 3 | Total | ||||||||||||||||||||||||
Senior secured first lien debt | $ | — | $ | — | $ | 866,480 | $ | 866,480 | $ | — | $ | — | $ | 489,913 | $ | 489,913 | |||||||||||||||
Senior secured second lien debt | — | — | 443,637 | 443,637 | — | — | 434,347 | 434,347 | |||||||||||||||||||||||
Collateralized securities and structured products - debt | — | — | 38,586 | 38,586 | — | — | 38,114 | 38,114 | |||||||||||||||||||||||
Collateralized securities and structured products - equity | — | — | 31,159 | 31,159 | — | — | 34,648 | 34,648 | |||||||||||||||||||||||
Unsecured debt | — | — | 3,890 | 3,890 | — | — | 16,851 | 16,851 | |||||||||||||||||||||||
Equity | — | — | 3,736 | 3,736 | — | — | 5,107 | 5,107 | |||||||||||||||||||||||
Short term investments | 70,300 | — | — | 70,300 | 70,498 | — | — | 70,498 | |||||||||||||||||||||||
Total Investments | $ | 70,300 | $ | — | $ | 1,387,488 | $ | 1,457,788 | $ | 70,498 | $ | — | $ | 1,018,980 | $ | 1,089,478 | |||||||||||||||
Total return swap | $ | — | $ | — | $ | 134 | $ | 134 | $ | — | $ | — | $ | (15,402 | ) | $ | (15,402 | ) | |||||||||||||
Credit default swap | — | — | — | — | — | 46 | — | 46 | |||||||||||||||||||||||
Total Derivatives | $ | — | $ | — | $ | 134 | $ | 134 | $ | — | $ | 46 | $ | (15,402 | ) | $ | (15,356 | ) | |||||||||||||
Total Investments and Derivatives | $ | 70,300 | $ | — | $ | 1,387,622 | $ | 1,457,922 | $ | 70,498 | $ | 46 | $ | 1,003,578 | $ | 1,074,122 | |||||||||||||||
The following tables provide a reconciliation of the beginning and ending balances for investments that use Level 3 inputs for the three months ended March 31, 2017 and 2016:
Three Months Ended March 31, 2017 | |||||||||||||||||||||||||||||||
Senior Secured First Lien Debt | Senior Secured Second Lien Debt | Collateralized Securities and Structured Products - Debt | Collateralized Securities and Structured Products - Equity | Unsecured Debt | Equity | Total Return Swap | Total | ||||||||||||||||||||||||
Beginning balance, December 31, 2016 | $ | 489,913 | $ | 434,347 | $ | 38,114 | $ | 34,648 | $ | 16,851 | $ | 5,107 | $ | (15,402 | ) | $ | 1,003,578 | ||||||||||||||
Investments purchased | 445,482 | 62,497 | — | — | 1,089 | — | — | 509,068 | |||||||||||||||||||||||
Net realized gain (loss) | 217 | 637 | — | — | 115 | — | (14,269 | ) | (13,300 | ) | |||||||||||||||||||||
Net change in unrealized (depreciation) appreciation | (5,873 | ) | 2,742 | 445 | 564 | 493 | (1,371 | ) | 15,536 | 12,536 | |||||||||||||||||||||
Accretion of discount | 1,194 | 567 | 27 | — | 29 | — | — | 1,817 | |||||||||||||||||||||||
Sales and principal repayments | (64,453 | ) | (57,153 | ) | — | (4,053 | ) | (14,687 | ) | — | 14,269 | (126,077 | ) | ||||||||||||||||||
Ending balance, March 31, 2017 | $ | 866,480 | $ | 443,637 | $ | 38,586 | $ | 31,159 | $ | 3,890 | $ | 3,736 | $ | 134 | $ | 1,387,622 | |||||||||||||||
Change in net unrealized (depreciation) appreciation on investments still held as of March 31, 2017(1) | $ | (5,439 | ) | $ | 2,871 | $ | 445 | $ | 564 | $ | 446 | $ | (1,371 | ) | $ | (200 | ) | $ | (2,684 | ) | |||||||||||
(1) | Included in net change in unrealized appreciation on investments in the consolidated statements of operations except where related to the total return swap, which is included in net change in unrealized appreciation (depreciation) on total return swap. |
39
CĪON Investment Corporation
Notes to Consolidated Financial Statements (unaudited)
March 31, 2017
(in thousands, except share and per share amounts)
Three Months Ended March 31, 2016 | |||||||||||||||||||||||||||
Senior Secured First Lien Debt | Senior Secured Second Lien Debt | Collateralized Securities and Structured Products - Debt | Collateralized Securities and Structured Products - Equity | Unsecured Debt | Total Return Swap | Total | |||||||||||||||||||||
Beginning balance, December 31, 2015 | $ | 104,187 | $ | 453,713 | $ | 41,663 | $ | 24,604 | $ | 26,740 | $ | (34,900 | ) | $ | 616,007 | ||||||||||||
Investments purchased | 30,419 | 3,884 | — | — | 2,704 | — | 37,007 | ||||||||||||||||||||
Net realized gain (loss) | 45 | (64 | ) | — | — | 11 | 8,362 | 8,354 | |||||||||||||||||||
Net change in unrealized (depreciation) appreciation | (1,189 | ) | (6,298 | ) | (2,951 | ) | (1,999 | ) | (168 | ) | (1,608 | ) | (14,213 | ) | |||||||||||||
Accretion of discount | 166 | 185 | 27 | — | 31 | — | 409 | ||||||||||||||||||||
Sales and principal repayments | (7,680 | ) | (10,462 | ) | — | (812 | ) | (2,715 | ) | (8,362 | ) | (30,031 | ) | ||||||||||||||
Ending balance, March 31, 2016 | $ | 125,948 | $ | 440,958 | $ | 38,739 | $ | 21,793 | $ | 26,603 | $ | (36,508 | ) | $ | 617,533 | ||||||||||||
Change in net unrealized (depreciation) appreciation on investments still held as of March 31, 2016(1) | $ | (1,185 | ) | $ | (6,707 | ) | $ | (2,951 | ) | $ | (1,999 | ) | $ | (168 | ) | $ | (1,490 | ) | $ | (14,500 | ) | ||||||
(1) | Included in net change in unrealized appreciation on investments in the consolidated statements of operations except where related to the total return swap, which is included in net change in unrealized appreciation (depreciation) on total return swap. |
Significant Unobservable Inputs
The valuation techniques and significant unobservable inputs used in recurring Level 3 fair value measurements of investments as of March 31, 2017 and December 31, 2016 were as follows:
March 31, 2017 | ||||||||||||||||
Fair Value | Valuation Techniques/ Methodologies | Unobservable Inputs | Range | Weighted Average(1) | ||||||||||||
Senior secured first lien debt | $ | 538,344 | Discounted Cash Flow | Discount Rates | 5.1% | — | 34.3% | 10.3% | ||||||||
314,998 | Broker Quotes | Broker Quotes | N/A | N/A | ||||||||||||
13,138 | Market Comparable Approach | EBITDA Multiple | 5.0x | — | 9.0x | 7.75x | ||||||||||
Senior secured second lien debt | 242,370 | Discounted Cash Flow | Discount Rates | 8.6% | — | 21.7% | 10.9% | |||||||||
198,338 | Broker Quotes | Broker Quotes | N/A | N/A | ||||||||||||
2,929 | Market Comparable Approach | EBITDA Multiple | 6.50x | — | 9.50x | 7.80x | ||||||||||
Collateralized securities and structured products - debt | 38,586 | Discounted Cash Flow | Discount Rates | 7.5% | — | 11.0% | 10.1% | |||||||||
Collateralized securities and structured products - equity | 31,159 | Discounted Cash Flow | Discount Rates | 9.2% | — | 17.0% | 13.6% | |||||||||
Unsecured debt | 3,890 | Broker Quotes | Broker Quotes | N/A | N/A | |||||||||||
Equity | 1,988 | Market Comparable Approach | EBITDA Multiple | 3.75x | — | 10.00x | 6.99x | |||||||||
1,500 | Revenue Multiple | 0.50x | — | 0.75x | 0.75x | |||||||||||
166 | Options Pricing Model | Expected Volatility | 29.0% | — | 31.0% | 29.8% | ||||||||||
82 | Broker Quotes | Broker Quotes | N/A | N/A | ||||||||||||
Total return swap | 77 | Broker Quotes | Broker Quotes | N/A | N/A | |||||||||||
57 | Discounted Cash Flow | Discount Rates | 5.1% | — | 6.5% | 5.9% | ||||||||||
Total | $ | 1,387,622 | ||||||||||||||
(1) | Weighted average amounts are based on the estimated fair values. |
40
CĪON Investment Corporation
Notes to Consolidated Financial Statements (unaudited)
March 31, 2017
(in thousands, except share and per share amounts)
December 31, 2016 | ||||||||||||||||
Fair Value | Valuation Techniques/ Methodologies | Unobservable Inputs | Range | Weighted Average(1) | ||||||||||||
Senior secured first lien debt | $ | 417,736 | Discounted Cash Flow | Discount Rates | 6.0% | - | 21.3% | 16.5% | ||||||||
61,846 | Broker Quotes | Broker Quotes | N/A | N/A | ||||||||||||
10,331 | Market Comparable Approach | EBITDA Multiple | 4.00x | - | 6.00x | 4.78x | ||||||||||
Senior secured second lien debt | 291,189 | Discounted Cash Flow | Discount Rates | 8.5% | - | 20.6% | 10.5% | |||||||||
129,219 | Broker Quotes | Broker Quotes | N/A | N/A | ||||||||||||
13,939 | Market Comparable Approach | EBITDA Multiple | 6.50x | - | 9.50x | 8.09x | ||||||||||
Revenue Multiple | 0.65x | - | 0.90x | 0.65x | ||||||||||||
Collateralized securities and structured products - debt | 38,114 | Discounted Cash Flow | Discount Rates | 7.8% | - | 11.0% | 10.1% | |||||||||
Collateralized securities and structured products - equity | 34,648 | Discounted Cash Flow | Discount Rates | 9.3% | - | 17.0% | 13.8% | |||||||||
Unsecured debt | 16,851 | Broker Quotes | Broker Quotes | N/A | N/A | |||||||||||
Equity | 4,946 | Market Comparable Approach | EBITDA Multiple | 3.75x | - | 10.50x | 7.23x | |||||||||
161 | Options Pricing Model | Expected Volatility | N/A | 36.2% | ||||||||||||
Total return swap | (1,002 | ) | Discounted Cash Flow | Discount Rates | 5.1% | - | 14.6% | 7.3% | ||||||||
(14,400 | ) | Broker Quotes | Broker Quotes | N/A | N/A | |||||||||||
Total | $ | 1,003,578 | ||||||||||||||
(1) | Weighted average amounts are based on the estimated fair values. |
The significant unobservable inputs used in the fair value measurement of the Company’s senior secured first lien debt, senior secured second lien debt, collateralized securities and structured products, unsecured debt, equity, and total return swap are discount rates, EBITDA multiples, revenue multiples, broker quotes and expected volatility. A significant increase or decrease in discount rates would result in a significantly lower or higher fair value measurement, respectively. A significant increase or decrease in the EBITDA multiples, revenue multiples, broker quotes and expected volatility would result in a significantly higher or lower fair value measurement, respectively.
Note 10. General and Administrative Expense
General and administrative expense consisted of the following items for the three months ended March 31, 2017 and 2016:
Three Months Ended March 31, | |||||||
2017 | 2016 | ||||||
Professional fees | $ | 568 | $ | 552 | |||
Transfer agent expense | 314 | 342 | |||||
Valuation expense | 199 | 99 | |||||
Dues and subscriptions | 170 | 247 | |||||
Printing and marketing expense | 106 | 90 | |||||
Insurance expense | 103 | 82 | |||||
Director fees and expenses | 86 | 67 | |||||
Due diligence fees | 55 | 162 | |||||
Other expenses | 145 | 112 | |||||
Total general and administrative expense | $ | 1,746 | $ | 1,753 | |||
Note 11. Commitments and Contingencies
The Company entered into certain contracts with other parties that contain a variety of indemnifications. The Company’s maximum exposure under these arrangements is unknown. However, the Company has not experienced claims or losses pursuant to these contracts and believes the risk of loss related to such indemnifications to be remote.
41
CĪON Investment Corporation
Notes to Consolidated Financial Statements (unaudited)
March 31, 2017
(in thousands, except share and per share amounts)
As of March 31, 2017 and December 31, 2016, the Company’s unfunded commitments were as follows:
Unfunded Commitments | March 31, 2017(1) | December 31, 2016(1) | ||||||
CCSLF(2)(3) | $ | 40,000 | $ | 40,000 | ||||
CenturyLink, Inc.(5)(3) | 18,030 | — | ||||||
CF Entertainment Inc.(3) | 10,000 | — | ||||||
Air Methods Corp.(5) | 8,414 | — | ||||||
Uno Parent, Inc.(5) | 5,079 | — | ||||||
Studio Movie Grill Holdings, LLC(3) | 4,127 | 4,127 | ||||||
Elemica Holdings, Inc.(3) | 2,500 | 2,500 | ||||||
Ivy Hill Middle Market Credit Fund VIII, Ltd.(3) | 1,111 | 1,111 | ||||||
American Media, Inc.(3) | 1,007 | 711 | ||||||
Tennessee Merger Sub, Inc.(4) | — | 10,254 | ||||||
Ministry Brands, LLC(3) | — | 5,274 | ||||||
ABG Intermediate Holdings 2 LLC | — | 1,119 | ||||||
Total | $ | 90,268 | $ | 65,096 | ||||
(1) | Unless otherwise noted, the funding criteria for these unfunded commitments had not been met at the date indicated. |
(2) | On June 24, 2015, the Company entered into a joint venture with Capitala Finance Corp., or Capitala, to create CCSLF. All portfolio and other material decisions regarding CCSLF must be submitted to its board of managers, which is comprised of four members, two of whom were selected by the Company and the other two were selected by Capitala. Further, all portfolio and other material decisions require the affirmative vote of at least one member from the Company and one member from Capitala. |
(3) | As of May 10, 2017, the Company's unfunded commitments were to portfolio companies CF Entertainment Inc., Studio Movie Grill Holdings, LLC, Elemica Holdings, Inc., Ivy Hill Middle Market Credit Fund VIII, Ltd., American Media, Inc., and Ministry Brands, LLC, in the amount of $5,000, $4,127, $2,500, $1,111, $1,007, and $180, respectively, and also included unfunded commitments of $40,000 and $18,030 to CCSLF and CenturyLink, Inc., respectively. In addition, subsequent to March 31, 2017, the Company entered into unfunded commitments of $11,720 and $3,278 with PetSmart, Inc. and Moss Holdings, Inc., respectively. |
(4) | As of December 31, 2016, such commitment was subject to the execution of a definitive loan agreement and the consummation of the underlying corporate transaction, and conditional upon receipt of all necessary shareholder, regulatory and other applicable approvals. Prior to March 31, 2017, the unfunded commitment was terminated. |
(5) | As of March 31, 2017, such commitment was subject to the execution of a definitive loan agreement and the consummation of the underlying corporate transaction, and conditional upon receipt of all necessary shareholder, regulatory and other applicable approvals. Prior to May 10, 2017, the unfunded commitments to Air Methods Corp. and Uno Parent, Inc. were terminated. |
Unfunded commitments to provide funds to companies are not recorded on the Company’s consolidated balance sheets. Since these commitments may expire without being drawn upon, unfunded commitments do not necessarily represent future cash requirements or future earning assets for the Company. The Company intends to use cash on hand, short-term investments, proceeds from borrowings, and other liquid assets to fund these commitments should the need arise. For information on the companies to which the Company is committed to fund additional amounts as of March 31, 2017 and December 31, 2016, refer to the table above and the consolidated schedules of investments.
The Company will fund its unfunded commitments from the same sources it uses to fund its investment commitments that are funded at the time they are made (i.e., advances from its credit facilities and/or cash flows from operations). The Company will not fund its unfunded commitments from future net proceeds generated by securities offerings. The Company follows a process to manage its liquidity and ensure that it has available capital to fund its unfunded commitments. Specifically, the Company prepares detailed analyses of the level of its unfunded commitments relative to its then available liquidity on a daily basis. These analyses are reviewed and discussed on a weekly basis by the Company’s executive officers and senior members of CIM (including members of the investment committee) and are updated on a “real time” basis in order to ensure that the Company has adequate liquidity to satisfy its unfunded commitments.
The Company does not include its unfunded capital commitment to CCSLF as a senior security for the asset coverage ratio, as the capital commitments cannot be drawn without an affirmative vote by one of the Company’s representatives on CCSLF’s board of managers.
42
CĪON Investment Corporation
Notes to Consolidated Financial Statements (unaudited)
March 31, 2017
(in thousands, except share and per share amounts)
Note 12. Fee Income
Fee income consists of commitment fees and amendment fees. The following table summarizes the Company’s fee income for the three months ended March 31, 2017 and 2016:
Three Months Ended March 31, | |||||||
2017 | 2016 | ||||||
Commitment fees | $ | 292 | $ | 151 | |||
Amendment fees | 255 | 41 | |||||
Total | $ | 547 | $ | 192 | |||
For the three months ended March 31, 2017 and 2016, all fee income was non-recurring.
43
CĪON Investment Corporation
Notes to Consolidated Financial Statements (unaudited)
March 31, 2017
(in thousands, except share and per share amounts)
Note 13. Financial Highlights
The following is a schedule of financial highlights as of and for the three months ended March 31, 2017 and 2016:
Three Months Ended March 31, | ||||||||
2017 | 2016 | |||||||
Per share data:(1) | ||||||||
Net asset value at beginning of period | $ | 9.11 | $ | 8.71 | ||||
Results of operations: | ||||||||
Net investment income(2) | 0.15 | 0.10 | ||||||
Net realized loss and net change in unrealized depreciation on investments(3) | (0.02 | ) | (0.12 | ) | ||||
Net realized gain and net change in unrealized appreciation on total return swap | 0.01 | 0.06 | ||||||
Net increase in net assets resulting from operations(3) | 0.14 | 0.04 | ||||||
Shareholder distributions: | ||||||||
Distributions from net investment income | (0.14 | ) | (0.10 | ) | ||||
Distributions from net realized gains | (0.04 | ) | (0.08 | ) | ||||
Distributions in excess of net investment income(4) | — | — | ||||||
Net decrease in net assets from shareholders' distributions | (0.18 | ) | (0.18 | ) | ||||
Capital share transactions: | ||||||||
Issuance of common stock above net asset value(5) | — | — | ||||||
Repurchases of common stock(6) | — | — | ||||||
Net increase in net assets resulting from capital share transactions | — | — | ||||||
Net asset value at end of period | $ | 9.07 | $ | 8.57 | ||||
Shares of common stock outstanding at end of period | 111,370,686 | 104,723,030 | ||||||
Total investment return-net asset value(7) | 1.60 | % | 0.49 | % | ||||
Net assets at beginning of period | $ | 999,763 | $ | 904,326 | ||||
Net assets at end of period | $ | 1,010,010 | $ | 897,608 | ||||
Average net assets | $ | 1,003,153 | $ | 893,069 | ||||
Ratio/Supplemental data: | ||||||||
Ratio of net investment income to average net assets(8) | 1.65 | % | 1.17 | % | ||||
Ratio of gross operating expenses to average net assets(9) | 1.15 | % | 0.76 | % | ||||
Ratio of expenses (before recoupment of expense support) to average net assets(10) | 1.15 | % | 0.75 | % | ||||
Ratio of net expense recoupments to average net assets(11) | — | 0.01 | % | |||||
Ratio of net operating expenses to average net assets | 1.15 | % | 0.76 | % | ||||
Portfolio turnover rate(12) | 12.50 | % | 3.31 | % | ||||
Asset coverage ratio(13) | 3.16 | 2.83 | ||||||
(1) | The per share data for the three months ended March 31, 2017 and 2016 was derived by using the weighted average shares of common stock outstanding during each period. |
(2) | Net investment income per share includes expense support recoupments to CIG of less than $0.01 per share for the three months ended March 31, 2016. |
(3) | The amount shown for net realized loss and net change in unrealized depreciation on investments is the balancing figure derived from the other figures in the schedule. The amount shown at this caption for a share outstanding throughout the period may not agree with the change in the aggregate gains and losses in portfolio securities for the period because of the timing of sales and repurchases of the Company’s shares in relation to fluctuating market values for the portfolio. As a result, net increase in net assets resulting from operations in this schedule may vary from the consolidated statements of operations. |
(4) | Distributions in excess of net investment income represent certain expenses, which are not deductible on a tax-basis. Unearned capital gains incentive fees and certain offering expenses reduce GAAP basis net investment income, but do not reduce tax basis net investment income. These tax-related adjustments represent additional net investment income available for distribution for tax purposes. Distributions in excess of net investment income were less than $0.01 per share during the three months ended March 31, 2016. There were no distributions in excess of net investment income during the three months ended March 31, 2017. |
44
CĪON Investment Corporation
Notes to Consolidated Financial Statements (unaudited)
March 31, 2017
(in thousands, except share and per share amounts)
(5) | The continuous issuance of shares of common stock may cause an incremental increase in net asset value per share due to the sale of shares at the then prevailing public offering price and the receipt of net proceeds per share by the Company in excess of net asset value per share on each subscription closing date. The per share impact of the continuous issuance of shares of common stock was an increase to net asset value of less than $0.01 per share during the three months ended March 31, 2017 and 2016. |
(6) | Repurchases of common stock may cause an incremental decrease in net asset value per share due to the repurchase of shares at a price in excess of net asset value per share on each repurchase date. The per share impact of repurchases of common stock was a decrease to net asset value of less than $0.01 per share during the three months ended March 31, 2017 and 2016. |
(7) | Total investment return-net asset value is a measure of the change in total value for shareholders who held the Company’s common stock at the beginning and end of the period, including distributions paid or payable during the period. Total investment return-net asset value is based on (i) the beginning period net asset value per share on the first day of the period, (ii) the net asset value per share on the last day of the period of (A) one share plus (B) any fractional shares issued in connection with the reinvestment of monthly distributions, and (iii) the value of distributions payable, if any, on the last day of the period. The total investment return-net asset value calculation assumes that monthly cash distributions are reinvested in accordance with the Company's distribution reinvestment plan then in effect as described in Note 5. The total investment return-net asset value does not consider the effect of the sales load from the sale of the Company’s common stock. The total investment return-net asset value includes the effect of the issuance of shares at a net offering price that is greater than net asset value per share, which causes an increase in net asset value per share. Total returns covering less than a full year are not annualized. |
(8) | Excluding the impact of the recoupment of expense support by CIG during the period, the ratio of net investment income to average net assets would have been 1.65% and 1.19% for the three months ended March 31, 2017 and 2016, respectively. |
(9) | Ratio of gross operating expenses to average net assets does not include expense support provided by CIG and/or AIM, if any. |
(10) | The ratio of gross expense recoupments to CIG to average net assets for the three months ended March 31, 2017 and 2016 was 0.00% and 0.01%, respectively. |
(11) | In order to record an obligation to reimburse CIG for expense support provided, the ratio of gross operating expenses to average net assets, when considering the recoupment, in the period in which recoupment is sought, cannot exceed the ratio of gross operating expenses to average net assets for the period when the expense support was provided. For purposes of this calculation, gross operating expenses include all expenses borne by the Company, except for offering and organizational costs, base management fees, incentive fees, administrative services expenses, other general and administrative expenses owed to CIM and its affiliates and interest expense. For the three months ended March 31, 2017 and 2016, the ratio of gross operating expenses to average net assets, when considering recoupment of expense support to CIG, was 0.15%. |
(12) | Portfolio turnover rate is calculated using the lesser of year-to-date sales or purchases over the average of the invested assets at fair value, excluding short term investments, and is not annualized. |
(13) | Asset coverage ratio is equal to (i) the sum of (a) net assets at the end of the period and (b) total senior securities outstanding at the end of the period (excluding unfunded commitments), divided by (ii) total senior securities outstanding at the end of the period. For purposes of the asset coverage ratio test applicable to the Company as a BDC, the Company treats the outstanding TRS notional amount at the end of the period, less the total amount of cash collateral posted by Flatiron under the TRS, as senior securities. |
45
Item 2. Management’s Discussion and Analysis of Financial Condition and Results of Operations
As used in this Quarterly Report on Form 10-Q, “we,” “us,” “our” or similar terms include CĪON Investment Corporation and its consolidated subsidiaries.
The following discussion should be read in conjunction with our unaudited consolidated financial statements and related notes appearing elsewhere in this Quarterly Report on Form 10-Q and the audited consolidated financial statements and related notes included in our Annual Report on Form 10-K for the year ended December 31, 2016. In addition to historical information, the following discussion and other parts of this Quarterly Report on Form 10-Q contain forward-looking information that involves risks and uncertainties. Amounts and percentages presented herein may have been rounded for presentation and all dollar amounts, excluding share and per share amounts, are presented in thousands unless otherwise noted.
Forward-Looking Statements
Some of the statements within this Quarterly Report on Form 10-Q constitute forward-looking statements because they relate to future events or our future performance or financial condition. The forward-looking statements contained in this Quarterly Report on Form 10-Q may include statements as to:
• | our future operating results; |
• | our business prospects and the prospects of our portfolio companies; |
• | the impact of the investments that we expect to make; |
• | the ability of our portfolio companies to achieve their objectives; |
• | our current and expected financings and investments; |
• | the adequacy of our cash resources, financing sources and working capital; |
• | the use of borrowed money to finance a portion of our investments; |
• | the timing of cash flows, if any, from the operations of our portfolio companies; |
• | our contractual arrangements and relationships with third parties; |
• | the actual and potential conflicts of interest with CIM and Apollo and their respective affiliates; |
• | the ability of CIM and AIM to locate suitable investments for us and the ability of CIM to monitor and administer our investments; |
• | the ability of CIM and AIM and their respective affiliates to attract and retain highly talented professionals; |
• | the dependence of our future success on the general economy and its impact on the industries in which we invest; |
• | the effects of a changing interest rate environment; |
• | our ability to source favorable private investments; |
• | our tax status; |
• | the effect of changes to tax legislation and our tax position; |
• | the tax status of the companies in which we invest; and |
• | the timing and amount of distributions and dividends from the companies in which we invest. |
In addition, words such as “anticipate,” “believe,” “expect” and “intend” indicate a forward-looking statement, although not all forward-looking statements include these words. The forward-looking statements contained in this Quarterly Report on Form 10-Q involve risks and uncertainties. Our actual results could differ materially from those implied or expressed in the forward-looking statements for any reason, including the factors set forth in “Risk Factors” in Item 1A of Part II of this Quarterly Report on Form 10-Q. Other factors that could cause actual results to differ materially include:
• | changes in the economy; |
• | risks associated with possible disruption in our operations or the economy generally due to terrorism or natural disasters; and |
• | future changes in laws or regulations and conditions in our operating areas. |
We have based the forward-looking statements on information available to us on the date of this Quarterly Report on Form 10-Q. Except as required by the federal securities laws, we undertake no obligation to revise or update any forward-looking statements, whether as a result of new information, future events or otherwise. You are advised to review any additional disclosures that we may make directly to you or through reports that we in the future may file with the SEC, including annual reports on Form 10-K, quarterly reports on Form 10-Q and current reports on Form 8-K. The forward-looking statements contained in this Quarterly Report on Form 10-Q are excluded from the safe harbor protection provided by Section 27A of the Securities Act of 1933, as amended, and Section 21E of the Securities Exchange Act of 1934, as amended.
46
Overview
We were incorporated under the general corporation laws of the State of Maryland on August 9, 2011 and commenced operations on December 17, 2012 upon raising proceeds of $2,500 from persons not affiliated with us, CIM or Apollo. We are an externally managed, non-diversified closed-end management investment company that has elected to be regulated as a BDC under the 1940 Act. We elected to be treated for federal income tax purposes as a RIC, as defined under Subchapter M of the Code.
Our investment objective is to generate current income and, to a lesser extent, capital appreciation for investors. Our portfolio is comprised primarily of investments in senior secured debt, including first lien loans, second lien loans and unitranche loans, and, to a lesser extent, collateralized securities, structured products and other similar securities, unsecured debt, including corporate bonds and long-term subordinated loans, referred to as mezzanine loans, and equity, of private and thinly traded U.S. middle-market companies. In connection with our debt investments, we may receive equity interests such as warrants or options as additional consideration. We may also purchase minority interests in the form of common or preferred equity in our target companies, either in conjunction with one of our debt investments or through a co-investment with a financial sponsor.
We are managed by CIM, our affiliate and a registered investment adviser. CIM oversees the management of our activities and is responsible for making investment decisions for our portfolio. We and CIM have engaged AIM to act as our investment sub-adviser. On November 1, 2016, our board of directors, including a majority of directors who are not interested persons, approved the renewal of the investment advisory agreement with CIM and the investment sub-advisory agreement with AIM, each for a period of twelve months commencing December 17, 2016.
We seek to meet our investment objective by utilizing the experienced management teams of both CIM and AIM, which includes their access to the relationships and human capital of Apollo, CIG and ICON Capital, in sourcing, evaluating and structuring transactions, as well as monitoring and servicing our investments. We focus primarily on the senior secured debt of private and thinly-traded U.S. middle-market companies, which we define as companies that generally possess annual EBITDA of $50 million or less, with experienced management teams, significant free cash flow, strong competitive positions and potential for growth.
Revenue
We primarily generate revenue in the form of interest income on the debt securities that we hold and capital gains on debt or other equity interests that we acquire in portfolio companies. The majority of our senior debt investments bear interest at a floating rate. Interest on debt securities is generally payable quarterly or monthly. In some cases, some of our investments may provide for deferred interest payments or PIK interest. The principal amount of the debt securities and any accrued, but unpaid, interest generally will become due at the maturity date. In addition, we may generate revenue in the form of commitment, structuring or diligence fees, monitoring fees, fees for providing managerial assistance and possibly consulting fees and performance-based fees. Any such fees generated in connection with our investments will be recognized when earned.
Operating Expenses
Our primary operating expenses are the payment of advisory fees and other expenses under the investment advisory and administration agreements. Our investment advisory fee compensates CIM for its work in identifying, evaluating, negotiating, executing, monitoring and servicing our investments. CIM is responsible for compensating AIM for its services pursuant to the investment sub-advisory agreement. We bear all other expenses of our operations and transactions.
Portfolio Investment Activity for the Three Months Ended March 31, 2017 and 2016
The following table summarizes our investment activity, excluding short term investments and PIK securities, for the three months ended March 31, 2017 and 2016:
Three Months Ended March 31, | ||||||||||||||||||||||||
2017 | 2016 | |||||||||||||||||||||||
Net Investment Activity | Investment Portfolio | Total Return Swap | Total | Investment Portfolio | Total Return Swap | Total | ||||||||||||||||||
Purchases and drawdowns | ||||||||||||||||||||||||
Senior secured first lien debt | $ | 445,074 | $ | 49,590 | $ | 494,664 | $ | 30,419 | $ | 22,815 | $ | 53,234 | ||||||||||||
Senior secured second lien debt | 62,176 | — | 62,176 | 3,884 | — | 3,884 | ||||||||||||||||||
Unsecured debt | 1,089 | — | 1,089 | 2,704 | — | 2,704 | ||||||||||||||||||
Sales and principal repayments | (140,346 | ) | (428,106 | ) | (568,452 | ) | (21,669 | ) | (19,147 | ) | (40,816 | ) | ||||||||||||
Net portfolio activity | $ | 367,993 | $ | (378,516 | ) | $ | (10,523 | ) | $ | 15,338 | $ | 3,668 | $ | 19,006 | ||||||||||
47
The following table summarizes the composition of our investment portfolio at amortized cost and fair value and our underlying TRS loans portfolio at notional amount and fair value as of March 31, 2017 and December 31, 2016:
March 31, 2017 | |||||||||||||||||||||||||||||||||
Investment Portfolio | Total Return Swap | Total | |||||||||||||||||||||||||||||||
Investments Cost(1) | Investments Fair Value | Percentage of Investment Portfolio | Notional Amount of Underlying TRS Loans | Fair Value of Underlying TRS Loans | Percentage of Underlying TRS Loans | Cost/Notional Amount(1) | Fair Value | Percentage | |||||||||||||||||||||||||
Senior secured first lien debt | $ | 872,344 | $ | 866,480 | 62.4 | % | $ | 13,790 | $ | 13,924 | 100.0 | % | $ | 886,134 | $ | 880,404 | 62.8 | % | |||||||||||||||
Senior secured second lien debt | 443,788 | 443,637 | 32.0 | % | — | — | — | 443,788 | 443,637 | 31.7 | % | ||||||||||||||||||||||
Collateralized securities and structured products - debt | 39,498 | 38,586 | 2.8 | % | — | — | — | 39,498 | 38,586 | 2.7 | % | ||||||||||||||||||||||
Collateralized securities and structured products - equity | 33,660 | 31,159 | 2.2 | % | — | — | — | 33,660 | 31,159 | 2.2 | % | ||||||||||||||||||||||
Unsecured debt | 3,836 | 3,890 | 0.3 | % | — | — | — | 3,836 | 3,890 | 0.3 | % | ||||||||||||||||||||||
Equity | 4,832 | 3,736 | 0.3 | % | — | — | — | 4,832 | 3,736 | 0.3 | % | ||||||||||||||||||||||
Subtotal/total percentage | 1,397,958 | 1,387,488 | 100.0 | % | 13,790 | 13,924 | 100.0 | % | 1,411,748 | 1,401,412 | 100.0 | % | |||||||||||||||||||||
Short term investments(2) | 70,300 | 70,300 | — | — | 70,300 | 70,300 | |||||||||||||||||||||||||||
Total investments | $ | 1,468,258 | $ | 1,457,788 | $ | 13,790 | $ | 13,924 | $ | 1,482,048 | $ | 1,471,712 | |||||||||||||||||||||
Number of portfolio companies | 142 | 5 | 143(3) | ||||||||||||||||||||||||||||||
Average annual EBITDA of portfolio companies | $97.2 million | $55.8 million | $96.8 million | ||||||||||||||||||||||||||||||
Median annual EBITDA of portfolio companies | $48.9 million | $43.1 million | $48.9 million | ||||||||||||||||||||||||||||||
Purchased at a weighted average price of par | 94.82 | % | 99.43 | % | 94.86 | % | |||||||||||||||||||||||||||
Gross annual portfolio yield based upon the purchase price(4) | 9.36 | % | 6.16% | 9.33 | % | ||||||||||||||||||||||||||||
(1) | Represents amortized cost for debt investments and cost for equity investments. Amortized cost represents the original cost adjusted for the amortization of premiums and/or accretion of discounts, as applicable, on our investments. |
(2) | Short term investments represent an investment in a fund that invests in highly liquid investments with average original maturity dates of three months or less. |
(3) | The sum of investment portfolio and TRS portfolio companies does not equal the total number of portfolio companies. This is due to 4 portfolio companies being in both the investment and TRS portfolios. |
(4) | The gross annual portfolio yield does not represent and may be higher than an actual investment return to shareholders because it excludes our expenses and all sales commissions and dealer manager fees and does not consider the cost of leverage |
48
December 31, 2016 | ||||||||||||||||||||||||||||||||
Investment Portfolio | Total Return Swap | Total | ||||||||||||||||||||||||||||||
Investments Cost(1) | Investments Fair Value | Percentage of Investment Portfolio | Notional Amount of Underlying TRS Loans | Fair Value of Underlying TRS Loans | Percentage of Underlying TRS Loans | Cost/Notional Amount(1) | Fair Value | Percentage | ||||||||||||||||||||||||
Senior secured first lien debt | $ | 489,904 | $ | 489,913 | 48.1 | % | $ | 351,747 | $ | 341,194 | 86.9 | % | $ | 841,651 | $ | 831,107 | 58.9 | % | ||||||||||||||
Senior secured second lien debt | 437,240 | 434,347 | 42.6 | % | 56,100 | 51,251 | 13.1 | % | 493,340 | 485,598 | 34.4 | % | ||||||||||||||||||||
Collateralized securities and structured products - debt | 39,471 | 38,114 | 3.7 | % | — | — | — | 39,471 | 38,114 | 2.7 | % | |||||||||||||||||||||
Collateralized securities and structured products - equity | 37,713 | 34,648 | 3.4 | % | — | — | — | 37,713 | 34,648 | 2.5 | % | |||||||||||||||||||||
Unsecured debt | 17,290 | 16,851 | 1.7 | % | — | — | — | 17,290 | 16,851 | 1.1 | % | |||||||||||||||||||||
Equity | 4,832 | 5,107 | 0.5 | % | 4,832 | 5,107 | 0.4 | % | ||||||||||||||||||||||||
Subtotal/total percentage | 1,026,450 | 1,018,980 | 100.0 | % | 407,847 | 392,445 | 100.0 | % | 1,434,297 | 1,411,425 | 100.0 | % | ||||||||||||||||||||
Short term investments(2) | 70,498 | 70,498 | — | — | 70,498 | 70,498 | ||||||||||||||||||||||||||
Total investments | $ | 1,096,948 | $ | 1,089,478 | $ | 407,847 | $ | 392,445 | $ | 1,504,795 | $ | 1,481,923 | ||||||||||||||||||||
Number of portfolio companies | 103 | 49 | 141(3) | |||||||||||||||||||||||||||||
Average annual EBITDA of portfolio companies | $49.9 million | $200.7 million | $94.7 million | |||||||||||||||||||||||||||||
Median annual EBITDA of portfolio companies | $42.7 million | $66.0 million | $50.4 million | |||||||||||||||||||||||||||||
Purchased at a weighted average price of par | 95.87 | % | 98.96 | % | 96.73 | % | ||||||||||||||||||||||||||
Gross annual portfolio yield based upon the purchase price(4) | 9.99 | % | 6.73 | % | 9.07 | % | ||||||||||||||||||||||||||
(1) | Represents amortized cost for debt investments and cost for equity investments. Amortized cost represents the original cost adjusted for the amortization of premiums and/or accretion of discounts, as applicable, on our investments. |
(2) | Short term investments represent an investment in a fund that invests in highly liquid investments with average original maturity dates of three months or less. |
(3) | The sum of investment portfolio and TRS portfolio companies does not equal the total number of portfolio companies. This is due to 11 portfolio companies being in both the investment and TRS portfolios. |
(4) | The gross annual portfolio yield does not represent and may be higher than an actual investment return to shareholders because it excludes our expenses and all sales commissions and dealer manager fees and does not consider the cost of leverage. |
The following table summarizes the composition of our investment portfolio and our underlying TRS loans portfolio by the type of interest rate as of March 31, 2017 and December 31, 2016, excluding short term investments of $70,300 and $70,498, respectively:
March 31, 2017 | |||||||||||||||||||||||||||||||||
Investment Portfolio | Total Return Swap | Total | |||||||||||||||||||||||||||||||
Interest Rate Allocation | Investments Cost | Investments Fair Value | Percentage of Investment Portfolio | Notional Amount of Underlying TRS Loans | Fair Value of Underlying TRS Loans | Percentage of Underlying TRS Loans | Cost/Notional Amount | Fair Value | Percentage | ||||||||||||||||||||||||
Floating interest rate investments | $ | 1,312,332 | $ | 1,303,886 | 94.0 | % | $ | 13,790 | $ | 13,924 | 100.0 | % | $ | 1,326,122 | $ | 1,317,810 | 94.0 | % | |||||||||||||||
Fixed interest rate investments | 47,134 | 48,707 | 3.5 | % | — | — | — | 47,134 | 48,707 | 3.5 | % | ||||||||||||||||||||||
Other income producing investments | 33,660 | 31,159 | 2.2 | % | — | — | — | 33,660 | 31,159 | 2.2 | % | ||||||||||||||||||||||
Non-income producing equity | 4,832 | 3,736 | 0.3 | % | — | — | — | 4,832 | 3,736 | 0.3 | % | ||||||||||||||||||||||
Total investments | $ | 1,397,958 | $ | 1,387,488 | 100.0 | % | $ | 13,790 | $ | 13,924 | 100.0 | % | $ | 1,411,748 | $ | 1,401,412 | 100.0 | % | |||||||||||||||
49
December 31, 2016 | |||||||||||||||||||||||||||||||||
Investment Portfolio | Total Return Swap | Total | |||||||||||||||||||||||||||||||
Interest Rate Allocation | Investments Cost | Investments Fair Value | Percentage of Investment Portfolio | Notional Amount of Underlying TRS Loans | Fair Value of Underlying TRS Loans | Percentage of Underlying TRS Loans | Cost/Notional Amount | Fair Value | Percentage | ||||||||||||||||||||||||
Floating interest rate investments | $ | 936,846 | $ | 931,214 | 91.4 | % | $ | 407,847 | $ | 392,445 | 100.0 | % | $ | 1,344,693 | $ | 1,323,659 | 93.8 | % | |||||||||||||||
Fixed interest rate investments | 47,059 | 48,011 | 4.7 | % | — | — | — | 47,059 | 48,011 | 3.4 | % | ||||||||||||||||||||||
Other income producing investments | 37,713 | 34,648 | 3.4 | % | — | — | — | 37,713 | 34,648 | 2.4 | % | ||||||||||||||||||||||
Non-income producing equity | 4,832 | 5,107 | 0.5 | % | — | — | — | 4,832 | 5,107 | 0.4 | % | ||||||||||||||||||||||
Total investments | $ | 1,026,450 | $ | 1,018,980 | 100.0 | % | $ | 407,847 | $ | 392,445 | 100.0 | % | $ | 1,434,297 | $ | 1,411,425 | 100.0 | % | |||||||||||||||
The following table shows the composition of our investment portfolio and our underlying TRS loans portfolio by industry classification and the percentage, by fair value, of the total assets in such industries as of March 31, 2017 and December 31, 2016:
March 31, 2017 | |||||||||||||||||||||
Investment Portfolio | Total Return Swap | Total | |||||||||||||||||||
Industry Classification | Investments Fair Value | Percentage of Investment Portfolio | Fair Value of Underlying TRS Loans | Percentage of Underlying TRS Loans | Fair Value | Percentage | |||||||||||||||
High Tech Industries | $ | 232,438 | 16.8 | % | $ | 4,386 | 31.5 | % | $ | 236,824 | 16.9 | % | |||||||||
Services: Business | 215,543 | 15.5 | % | — | — | 215,543 | 15.4 | % | |||||||||||||
Healthcare & Pharmaceuticals | 185,075 | 13.4 | % | 1,954 | 14.0 | % | 187,029 | 13.3 | % | ||||||||||||
Diversified Financials | 69,745 | 5.0 | % | — | — | 69,745 | 5.0 | % | |||||||||||||
Media: Advertising, Printing & Publishing | 66,594 | 4.8 | % | — | — | 66,594 | 4.8 | % | |||||||||||||
Telecommunications | 62,358 | 4.5 | % | — | — | 62,358 | 4.4 | % | |||||||||||||
Chemicals, Plastics & Rubber | 61,121 | 4.4 | % | — | — | 61,121 | 4.4 | % | |||||||||||||
Beverage, Food & Tobacco | 55,977 | 4.0 | % | — | — | 55,977 | 4.0 | % | |||||||||||||
Capital Equipment | 55,487 | 4.0 | % | — | — | 55,487 | 3.9 | % | |||||||||||||
Media: Diversified & Production | 51,607 | 3.7 | % | — | — | 51,607 | 3.7 | % | |||||||||||||
Hotel, Gaming & Leisure | 47,973 | 3.5 | % | — | — | 47,973 | 3.4 | % | |||||||||||||
Retail | 46,470 | 3.4 | % | — | — | 46,470 | 3.3 | % | |||||||||||||
Construction & Building | 42,106 | 3.0 | % | 2,888 | 20.7 | % | 44,994 | 3.2 | % | ||||||||||||
Automotive | 34,790 | 2.5 | % | — | — | 34,790 | 2.5 | % | |||||||||||||
Aerospace & Defense | 27,822 | 2.0 | % | 4,035 | 29.0 | % | 31,857 | 2.3 | % | ||||||||||||
Services: Consumer | 30,476 | 2.2 | % | — | — | 30,476 | 2.2 | % | |||||||||||||
Banking, Finance, Insurance & Real Estate | 21,345 | 1.5 | % | 661 | 4.8 | % | 22,006 | 1.6 | % | ||||||||||||
Energy: Oil & Gas | 18,846 | 1.4 | % | — | — | 18,846 | 1.3 | % | |||||||||||||
Consumer Goods: Durable | 17,082 | 1.2 | % | — | — | 17,082 | 1.2 | % | |||||||||||||
Metals & Mining | 15,286 | 1.1 | % | — | — | 15,286 | 1.1 | % | |||||||||||||
Media: Broadcasting & Subscription | 12,429 | 0.9 | % | — | — | 12,429 | 0.9 | % | |||||||||||||
Consumer Goods: Non-Durable | 8,501 | 0.6 | % | — | — | 8,501 | 0.6 | % | |||||||||||||
Forest Products & Paper | 5,679 | 0.4 | % | — | — | 5,679 | 0.4 | % | |||||||||||||
Environmental Industries | 2,738 | 0.2 | % | — | — | 2,738 | 0.2 | % | |||||||||||||
Subtotal/total percentage | 1,387,488 | 100.0 | % | 13,924 | 100.0 | % | 1,401,412 | 100.0 | % | ||||||||||||
Short term investments | 70,300 | — | 70,300 | ||||||||||||||||||
Total investments | $ | 1,457,788 | $ | 13,924 | $ | 1,471,712 | |||||||||||||||
50
December 31, 2016 | |||||||||||||||||||||
Investment Portfolio | Total Return Swap | Total | |||||||||||||||||||
Industry Classification | Investments Fair Value | Percentage of Investment Portfolio | Fair Value of Underlying TRS Loans | Percentage of Underlying TRS Loans | Fair Value | Percentage | |||||||||||||||
High Tech Industries | $ | 217,339 | 21.3 | % | $ | 45,351 | 11.6 | % | $ | 262,690 | 18.6 | % | |||||||||
Services: Business | 126,869 | 12.5 | % | 66,733 | 17.0 | % | 193,602 | 13.7 | % | ||||||||||||
Healthcare & Pharmaceuticals | 118,337 | 11.6 | % | 70,176 | 17.9 | % | 188,513 | 13.4 | % | ||||||||||||
Diversified Financials | 72,762 | 7.1 | % | — | — | 72,762 | 5.2 | % | |||||||||||||
Media: Advertising, Printing & Publishing | 54,354 | 5.3 | % | 7,328 | 1.9 | % | 61,682 | 4.4 | % | ||||||||||||
Beverage, Food & Tobacco | 53,658 | 5.3 | % | — | — | 53,658 | 3.8 | % | |||||||||||||
Construction & Building | 39,137 | 3.8 | % | 14,269 | 3.6 | % | 53,406 | 3.8 | % | ||||||||||||
Chemicals, Plastics & Rubber | 27,253 | 2.7 | % | 25,701 | 6.5 | % | 52,954 | 3.7 | % | ||||||||||||
Capital Equipment | 51,155 | 5.0 | % | — | — | 51,155 | 3.6 | % | |||||||||||||
Hotel, Gaming & Leisure | 28,974 | 2.8 | % | 21,071 | 5.4 | % | 50,045 | 3.5 | % | ||||||||||||
Retail | 18,852 | 1.9 | % | 30,801 | 7.8 | % | 49,653 | 3.5 | % | ||||||||||||
Telecommunications | 35,411 | 3.5 | % | 13,775 | 3.5 | % | 49,186 | 3.5 | % | ||||||||||||
Automotive | 39,192 | 3.9 | % | — | — | 39,192 | 2.8 | % | |||||||||||||
Services: Consumer | 9,477 | 0.9 | % | 26,278 | 6.7 | % | 35,755 | 2.5 | % | ||||||||||||
Media: Diversified & Production | 23,100 | 2.3 | % | 7,277 | 1.8 | % | 30,377 | 2.1 | % | ||||||||||||
Banking, Finance, Insurance & Real Estate | 17,636 | 1.7 | % | 11,547 | 2.9 | % | 29,183 | 2.1 | % | ||||||||||||
Aerospace & Defense | 21,780 | 2.1 | % | 5,564 | 1.4 | % | 27,344 | 1.9 | % | ||||||||||||
Media: Broadcasting & Subscription | 9,776 | 1.0 | % | 10,013 | 2.6 | % | 19,789 | 1.4 | % | ||||||||||||
Energy: Oil & Gas | 12,803 | 1.3 | % | 4,570 | 1.2 | % | 17,373 | 1.2 | % | ||||||||||||
Consumer Goods: Durable | 1,000 | 0.1 | % | 15,942 | 4.1 | % | 16,942 | 1.2 | % | ||||||||||||
Metals & Mining | 11,349 | 1.1 | % | 3,528 | 0.9 | % | 14,877 | 1.1 | % | ||||||||||||
Energy: Electricity | 13,715 | 1.3 | % | — | — | 13,715 | 1.0 | % | |||||||||||||
Forest Products & Paper | — | — | 12,521 | 3.2 | % | 12,521 | 0.9 | % | |||||||||||||
Consumer Goods: Non-Durable | 8,611 | 0.8 | % | — | — | 8,611 | 0.6 | % | |||||||||||||
Containers, Packaging & Glass | 3,845 | 0.4 | % | — | — | 3,845 | 0.3 | % | |||||||||||||
Environmental Industries | 2,595 | 0.3 | % | — | — | 2,595 | 0.2 | % | |||||||||||||
Subtotal/total percentage | 1,018,980 | 100.0 | % | 392,445 | 100.0 | % | 1,411,425 | 100.0 | % | ||||||||||||
Short term investments | 70,498 | — | 70,498 | ||||||||||||||||||
Total investments | $ | 1,089,478 | $ | 392,445 | $ | 1,481,923 | |||||||||||||||
Except for CCSLF, we do not “control” and are not an “affiliate” of any of our portfolio companies or any of the companies of the loans underlying the TRS, each as defined in the 1940 Act. In general, under the 1940 Act, we would be presumed to “control” a portfolio company or issuer if we owned 25% or more of its voting securities and would be an “affiliate” of a portfolio company or issuer if we owned 5% or more of its voting securities.
Our investment portfolio may contain senior secured investments that are in the form of lines of credit, revolving credit facilities, or unfunded commitments, which may require us to provide funding when requested in accordance with the terms of the underlying agreements. As of March 31, 2017 and December 31, 2016, our unfunded commitments amounted to $90,268 and $65,096, respectively. As of May 10, 2017, our unfunded commitments amounted to $86,953. Since these commitments may expire without being drawn upon, unfunded commitments do not necessarily represent future cash requirements or future earning assets for us. For additional information on our unfunded commitments, refer to Note 11 to our consolidated financial statements included in this report.
Investment Portfolio Asset Quality
CIM uses an investment rating system to characterize and monitor our expected level of returns on each investment in our portfolio. These ratings are just one of several factors that CIM uses to monitor our portfolio, are not in and of themselves determinative of fair value or revenue recognition and are presented for indicative purposes. CIM rates the credit risk of all investments on a scale of 1 to 5 no less frequently than quarterly. This system is intended primarily to reflect the underlying risk of a portfolio investment relative to our initial cost basis in respect of such portfolio investment (i.e., at the time of acquisition), although it may also take into account under certain circumstances the performance of the portfolio company’s business, the collateral coverage of the investment and other relevant factors.
51
The following is a description of the conditions associated with each investment rating used in this ratings system:
Investment Rating | Description | |
1 | Indicates the least amount of risk to our initial cost basis. The trends and risk factors for this investment since origination or acquisition are generally favorable, which may include the performance of the portfolio company or a potential exit. | |
2 | Indicates a level of risk to our initial cost basis that is similar to the risk to our initial cost basis at the time of origination or acquisition. This portfolio company is generally performing in accordance with our analysis of its business and the full return of principal and interest or dividend is expected. | |
3 | Indicates that the risk to our ability to recoup the cost of such investment has increased since origination or acquisition, but full return of principal and interest or dividend is expected. A portfolio company with an investment rating of 3 requires closer monitoring. | |
4 | Indicates that the risk to our ability to recoup the cost of such investment has increased significantly since origination or acquisition, including as a result of factors such as declining performance and noncompliance with debt covenants, and we expect some loss of interest, dividend or capital appreciation, but still expect an overall positive internal rate of return on the investment. | |
5 | Indicates that the risk to our ability to recoup the cost of such investment has increased materially since origination or acquisition and the portfolio company likely has materially declining performance. Loss of interest or dividend and some loss of principal investment is expected, which would result in an overall negative internal rate of return on the investment. | |
For investments rated 3, 4, or 5, CIM enhances its level of scrutiny over the monitoring of such portfolio company.
The following table summarizes the composition of our investment portfolio and our underlying TRS loans portfolio based on the 1 to 5 investment rating scale at fair value as of March 31, 2017 and December 31, 2016, excluding short term investments of $70,300 and $70,498, respectively:
March 31, 2017 | |||||||||||||||||||||
Investment Portfolio | Total Return Swap | Total | |||||||||||||||||||
Investment Rating | Investments Fair Value | Percentage of Investment Portfolio | Fair Value of Underlying TRS Loans | Percentage of Underlying TRS Loans | Fair Value | Percentage | |||||||||||||||
1 | $ | — | — | $ | — | — | $ | — | — | ||||||||||||
2 | 1,247,137 | 89.9 | % | 13,924 | 100.0 | % | 1,261,061 | 90.0 | % | ||||||||||||
3 | 105,640 | 7.6 | % | — | — | 105,640 | 7.5 | % | |||||||||||||
4 | 24,930 | 1.8 | % | — | — | 24,930 | 1.8 | % | |||||||||||||
5 | 9,781 | 0.7 | % | — | — | 9,781 | 0.7 | % | |||||||||||||
$ | 1,387,488 | 100.0 | % | $ | 13,924 | 100.0 | % | $ | 1,401,412 | 100.0 | % | ||||||||||
December 31, 2016 | |||||||||||||||||||||
Investment Portfolio | Total Return Swap | Total | |||||||||||||||||||
Investment Rating | Investments Fair Value | Percentage of Investment Portfolio | Fair Value of Underlying TRS Loans | Percentage of Underlying TRS Loans | Fair Value | Percentage | |||||||||||||||
1 | $ | — | — | $ | — | — | $ | — | — | ||||||||||||
2 | 963,477 | 94.6 | % | 342,620 | 87.3 | % | 1,306,097 | 92.5 | % | ||||||||||||
3 | 50,942 | 5.0 | % | 34,657 | 8.8 | % | 85,599 | 6.1 | % | ||||||||||||
4 | 4,561 | 0.4 | % | 12,798 | 3.3 | % | 17,359 | 1.2 | % | ||||||||||||
5 | — | — | 2,370 | 0.6 | % | 2,370 | 0.2 | % | |||||||||||||
$ | 1,018,980 | 100.0 | % | $ | 392,445 | 100.0 | % | $ | 1,411,425 | 100.0 | % | ||||||||||
The amount of the investment portfolio and underlying TRS loans in each rating category may vary substantially from period to period resulting primarily from changes in the composition of each portfolio as a result of new investment, repayment and exit activities. In addition, changes in the rating of investments may be made to reflect our expectation of performance and changes in investment values.
52
Current Investment Portfolio
As of May 10, 2017, our investment portfolio, excluding our short term investments, consisted of interests in 148 portfolio companies (67% in senior secured first lien debt, 28% in senior secured second lien debt, 4% in collateralized securities and structured products (comprised of 1% invested in rated debt, 1% invested in non-rated debt and 2% invested in non-rated equity of such securities and products), and 1% in equity) with a total fair value of $1,414,165 with an average and median portfolio company annual EBITDA of $97.0 million and $45.2 million, respectively, at initial investment. As of March 10, 2017, investments in our portfolio, excluding our short term investments, were purchased at a weighted average price of 95.56% of par value. Our estimated gross annual portfolio yield was 9.29% based upon the purchase price of such investments. The estimated gross portfolio yield does not represent and may be higher than an actual investment return to shareholders because it excludes our expenses and all sales commissions and dealer manager fees. For the quarter ended March 31, 2017, our total investment return-net asset value was 1.60%. Total investment return-net asset value does not represent and may be higher than an actual investment return to shareholders because it excludes all sales commissions and dealer manager fees. Total investment return-net asset value is a measure of the change in total value for shareholders who held our common stock at the beginning and end of the period, including distributions paid or payable during the period, and is described further in Note 13 of our consolidated financial statements.
As of May 10, 2017, our only short term investment was an investment in a U.S. Treasury Obligations Fund of $81,743
Results of Operations for the Three Months Ended March 31, 2017 and 2016
Our results of operations for the three months ended March 31, 2017 and 2016 were as follows:
Three Months Ended March 31, | |||||||
2017 | 2016 | ||||||
Investment income | $ | 28,045 | $ | 17,271 | |||
Net operating expenses | 11,500 | 6,796 | |||||
Net investment income | 16,545 | 10,475 | |||||
Net realized gain (loss) on investments and foreign currency | 884 | (8 | ) | ||||
Net change in unrealized depreciation on investments | (2,817 | ) | (12,605 | ) | |||
Net realized (loss) gain on total return swap | (14,269 | ) | 8,362 | ||||
Net change in unrealized appreciation (depreciation) on total return swap | 15,536 | (1,608 | ) | ||||
Net increase in net assets resulting from operations | $ | 15,879 | $ | 4,616 | |||
Investment Income
For the three months ended March 31, 2017 and 2016, we generated investment income of $28,045 and $17,271, respectively, consisting primarily of interest income on investments in senior secured debt, collateralized securities, structured products, and unsecured debt of 153 and 85 portfolio companies held during each respective period. Our average investment portfolio size, excluding our short term investments and TRS, increased $550,760, from $652,474 for the three months ended March 31, 2016 to $1,203,234 for the three months ended March 31, 2017, as we deployed the net proceeds from our credit facilities and the net proceeds from our follow-on continuous public offering, which commenced on January 25, 2016. We expect our investment portfolio to continue to grow due to the anticipated equity available to us for investment from our follow-on continuous public offering. As a result, we believe that reported investment income for the three months ended March 31, 2017 and 2016 is not representative of our stabilized or future performance. Interest income earned by loans underlying the TRS is not included in investment income in the consolidated statements of operations, but rather it is recorded as part of net realized (loss) gain on total return swap. We did not extend the termination date of the TRS beyond April 18, 2017.
53
Operating Expenses
The composition of our operating expenses for the three months ended March 31, 2017 and 2016 was as follows:
Three Months Ended March 31, | |||||||
2017 | 2016 | ||||||
Management fees | $ | 6,482 | $ | 4,512 | |||
Administrative services expense | 346 | 292 | |||||
General and administrative | 1,746 | 1,753 | |||||
Interest expense | 2,926 | 120 | |||||
Total operating expenses | 11,500 | 6,677 | |||||
Recoupment of expense support from CIG | — | 119 | |||||
Net operating expenses | $ | 11,500 | $ | 6,796 | |||
During the three months ended March 31, 2017, the increase in management fees was a direct result of the increase in our net assets, while the increase in interest expense was primarily the result of entering into the JPM Credit Facility on August 26, 2016.
The composition of our general and administrative expenses for the three months ended March 31, 2017 and 2016 was as follows:
Three Months Ended March 31, | |||||||
2017 | 2016 | ||||||
Professional fees | $ | 568 | $ | 552 | |||
Transfer agent expense | 314 | 342 | |||||
Valuation expense | 199 | 99 | |||||
Dues and subscriptions | 170 | 247 | |||||
Printing and marketing expense | 106 | 90 | |||||
Insurance expense | 103 | 82 | |||||
Director fees and expenses | 86 | 67 | |||||
Due diligence fees | 55 | 162 | |||||
Other expenses | 145 | 112 | |||||
Total general and administrative expense | $ | 1,746 | $ | 1,753 | |||
Expense Support and Recoupment of Expense Support
Our affiliate, CIG, agreed to provide expense support to us commencing with the quarter ended December 31, 2012 for certain expenses pursuant to the expense support and conditional reimbursement agreement. We further amended and restated the expense support and conditional reimbursement agreement on December 16, 2015 and December 14, 2016 for purposes of including AIM as a party to the expense support and conditional reimbursement agreement and extending the termination date from December 31, 2016 to December 31, 2017, respectively. Commencing with the quarter beginning January 1, 2016, CIG and AIM each agreed to provide expense support to us for 50% of certain expenses pursuant to the expense support and conditional reimbursement agreement. Refer to the discussion under “Related Party Transactions” below for further details about the expense support and conditional reimbursement agreement. Also, see Note 4 to our consolidated financial statements for additional disclosure regarding expense support from CIG and AIM.
For the three months ended March 31, 2017, CIG and AIM did not provide any expense support or recoup any previously provided expense support. For the three months ended March 31, 2016, CIG recouped $119 of expense support made during the three months ended December 31, 2014 in connection with the expense support and conditional reimbursement agreement.
Recoupment of such support will be determined as appropriate to meet the objectives of the expense support and conditional reimbursement agreement. As a result, we may or may not be requested to reimburse CIG and AIM for any expense support that may be received from CIG and AIM in the future.
Net Investment Income
Our net investment income totaled $16,545 and $10,475 for the three months ended March 31, 2017 and 2016, respectively. The increase in net investment income was primarily due to an increase in the size of our investment portfolio relative to our expenses as we continued to achieve economies of scale due to proceeds received from our follow-on our continuous public offering and our credit facilities.
54
Net Realized Gain (Loss) on Investments and Foreign Currency
Our net realized gain (loss) on investments totaled $884 and ($8) for the three months ended March 31, 2017 and 2016, respectively. This change was mainly due to an increase in sales and principal repayment activity during the three months ended March 31, 2017 compared to the three months ended March 31, 2016. During the three months ended March 31, 2017, we received sale proceeds of $30,903 and principal repayments of $109,443, resulting in net realized gains of $740. During the three months ended March 31, 2016, we received sale proceeds of $10,920 and principal repayments of $10,749, resulting in net realized losses of $8.
Net Change in Unrealized Depreciation on Investments
The net change in unrealized depreciation on our investments totaled ($2,817) and ($12,605) for the three months ended March 31, 2017 and 2016, respectively. This change was driven primarily by a tightening of credit spreads during the three months ended March 31, 2017 compared to a widening of credit spreads during the three months ended March 31, 2016 that negatively impacted the fair value of certain investments.
Net Realized (Loss) Gain on TRS
Our net realized (loss) gain on the TRS totaled ($14,269) and $8,362 for the three months ended March 31, 2017 and 2016, respectively. The components of net realized (loss) gain on the TRS are summarized below:
Three Months Ended March 31, | |||||||
2017 | 2016 | ||||||
Interest and other income from TRS portfolio | $ | 6,082 | $ | 11,646 | |||
Interest and other expense from TRS portfolio | (2,767 | ) | (3,453 | ) | |||
Net (loss) gain on TRS loan sales | (17,584 | ) | 169 | ||||
Total | $ | (14,269 | ) | $ | 8,362 | ||
Net Change in Unrealized Appreciation (Depreciation) on TRS
The net change in unrealized appreciation (depreciation) on the TRS totaled $15,536 and ($1,608) for the three months ended March 31, 2017 and 2016, respectively. This change was driven primarily by a reversal of previous unrealized depreciation on the loans underlying the TRS upon the purchase of the loans by Flatiron Funding II on March 29, 2017.
Net Increase in Net Assets Resulting from Operations
For the three months ended March 31, 2017 and 2016, we recorded a net increase in net assets resulting from operations of $15,879 and $4,616, respectively, as a result of our operating activity for the respective periods.
55
Net Asset Value per Share, Annual Investment Return and Total Return Since Inception
Our net asset value per share was $9.07 and $9.11 on March 31, 2017 and December 31, 2016, respectively. After considering (i) the overall changes in net asset value per share, (ii) paid distributions of approximately $0.1829 per share during the three months ended March 31, 2017, and (iii) the assumed reinvestment of those distributions in accordance with our distribution reinvestment plan then in effect, the total investment return was 1.60% for the three month period ended March 31, 2017. Total investment return-net asset value does not represent and may be higher than an actual return to shareholders because it excludes all sales commissions and dealer manager fees. Total investment return-net asset value is a measure of the change in total value for shareholders who held our common stock at the beginning and end of the period, including distributions paid or payable during the period, and is described further in Note 13 to our consolidated financial statements included in this report.
Initial shareholders who subscribed to the offering in December 2012 with an initial investment of $10,000 and an initial purchase price equal to $9.00 per share (public offering price net of sales load) have seen an annualized return of 8.25% and a cumulative total return of 40.54% through March 31, 2017 (see chart below). Initial shareholders who subscribed to the offering in December 2012 with an initial investment of $10,000 and an initial purchase price equal to $10.00 per share (the initial public offering price including sales load) have seen an annualized return of 5.63% and a cumulative total return of 26.48% through March 31, 2017. Over the same time period, the S&P/LSTA Leveraged Loan Index, a primary measure of senior debt covering the U.S. leveraged loan market, which currently consists of approximately 1,000 credit facilities throughout numerous industries, recorded an annualized return of 4.18% and a cumulative total return of 19.21%. In addition, the BofA Merrill Lynch US High Yield Index, a primary measure of short-term US dollar denominated below investment grade corporate debt publicly issued in the US domestic market, recorded an annualized return of 5.71% and a cumulative total return of 26.91% over the same period.
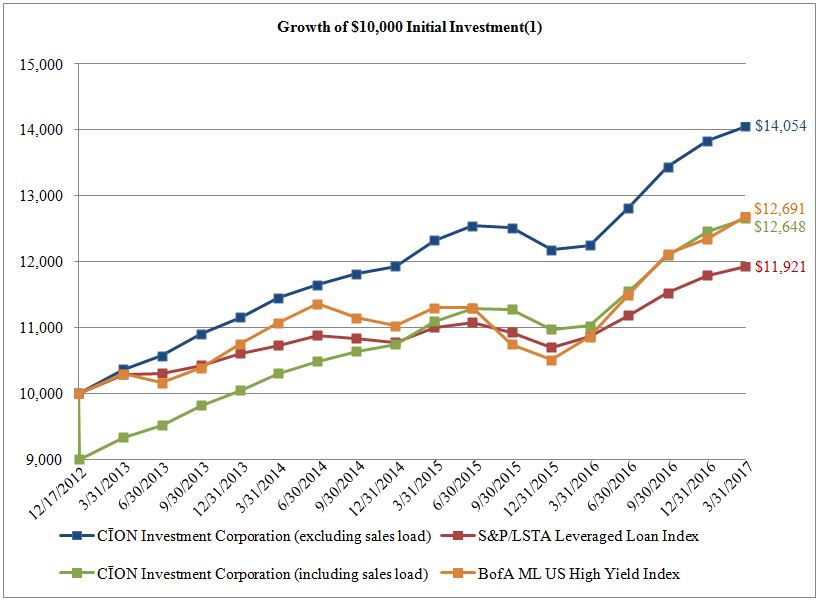
(1) Cumulative performance: December 17, 2012 to March 31, 2017
The calculations for the Growth of $10,000 Initial Investment are based upon (i) an initial investment of $10,000 in our common stock at the beginning of the period, at a share price of $10.00 per share (including sales load) and $9.00 per share (excluding sales load), (ii) assumes reinvestment of monthly distributions in accordance with our distribution reinvestment plan then in effect, (iii) the sale of the entire investment position at the net asset value per share on the last day of the period, and (iv) the distributions declared and payable to shareholders, if any, on the last day of the period.
56
Financial Condition, Liquidity and Capital Resources
We generate cash primarily from the net proceeds from our follow-on continuous public offering and from cash flows from interest, fees and dividends earned from our investments as well as principal repayments and proceeds from sales of our investments. We also employ leverage to seek to enhance our returns as market conditions permit and at the discretion of CIM, but in no event will leverage employed exceed 50% of the value of our total assets, as required by the 1940 Act. We are engaged in a follow-on continuous public offering of shares of our common stock. Our initial continuous public offering commenced on July 2, 2012 and ended on December 31, 2015. Our follow-on continuous public offering commenced on January 25, 2016. We accept subscriptions on a continuous basis and issue shares at weekly closings at prices that, after deducting selling commissions and dealer manager fees, are at or above our net asset value per share.
We will sell our shares on a continuous basis at our latest public offering price of $9.65 per share; however, to the extent that our net asset value fluctuates, we will sell at a price necessary to ensure that shares are sold at a price, after deduction of selling commissions and dealer manager fees, that is above and within 2.5% of net asset value per share.
Since commencing our initial continuous public offering on July 2, 2012 and through March 31, 2017, we sold 111,370,686 shares of common stock for net proceeds of $1,132,506 at an average price per share of $10.17. The net proceeds include gross proceeds received from reinvested shareholder distributions of $94,399, for which we issued 10,370,290 shares of common stock, and gross proceeds paid for shares of common stock tendered for repurchase of $32,784, for which we repurchased 3,641,315 shares of common stock. Since commencing our initial continuous public offering on July 2, 2012 and through March 31, 2017, sales commissions and dealer manager fees related to the sale of our common stock were $63,492 and $31,205, respectively.
As of May 10, 2017, we sold 111,249,220 shares of common stock for net proceeds of $1,131,677 at an average price per share of $10.17. The net proceeds include gross proceeds received from reinvested shareholder distributions of $97,429, for which we issued 10,702,158 shares of common stock, and gross proceeds paid for shares of common stock tendered for repurchase of $43,156, for which we repurchased 4,778,549 shares of common stock. Since commencing our initial continuous public offering on July 2, 2012 and through May 10, 2017, sales commissions and dealer manager fees related to the sale of our common stock were $63,624 and $31,317, respectively.
The net proceeds from our follow-on continuous public offering will be invested primarily in cash, cash equivalents, U.S. government securities, repurchase agreements and high-quality debt instruments maturing in one year or less prior to being invested in debt securities of private U.S. middle-market companies.
As of March 31, 2017 and December 31, 2016, we had $70,300 and $70,498 in short term investments, respectively, invested in a fund that primarily invests in U.S. government securities.
Total Return Swap
As of March 31, 2017, the notional amount available under the TRS was $786,210. Subsequent to the TRS expiration date of April 18, 2017, the notional amount available under the TRS was $0. For a detailed discussion of our TRS, refer to Note 7 to our consolidated financial statements included in this report.
Citibank Credit Facility
As of March 31, 2017 and May 10, 2017, our outstanding borrowings under the Citibank Credit Facility were $231,698 and the aggregate principal amount available in connection with the Citibank Credit Facility was $93,302. For a detailed discussion of our Citibank Credit Facility, refer to Note 8 to our consolidated financial statements included in this report.
JPM Credit Facility
As of March 31, 2017 and May 10, 2017, our outstanding borrowings under the JPM Credit Facility were $224,423 and the aggregate principal amount available in connection with the JPM Credit Facility was $577. For a detailed discussion of our JPM Credit Facility, refer to Note 8 to our consolidated financial statements included in this report.
East West Bank Credit Facility
As of March 31, 2017, we had no outstanding borrowings under the EWB Credit Facility and the aggregate principal amount available in connection with the EWB Credit Facility was $40,000. The EWB Credit Facility expired on April 27, 2017. We had no outstanding borrowings under the EWB Credit Facility as of April 27, 2017. For a detailed discussion of our EWB Credit Facility, refer to Note 8 to our consolidated financial statements included in this report.
Unfunded Commitments
As of March 31, 2017 and May 10, 2017, our unfunded commitments amounted to $90,268 and $86,953, respectively. For a detailed discussion of our unfunded commitments, refer to Note 11 to our consolidated financial statements included in this report.
57
RIC Status and Distributions
Our total investment portfolio includes loans and other securities on our consolidated balance sheets and loans underlying the TRS. Accordingly, we treat net interest and other income earned on all investments, including the loans underlying the TRS, as a component of investment company taxable income when determining our sources of distributions. The sources of our distributions for the three months ended March 31, 2017 were as follows:
Three Months Ended March 31, 2017 | |||||||||||||||
Investment Portfolio | Total Return Swap Portfolio | Total Investment Portfolio | Percentage | ||||||||||||
Net investment income | $ | 15,433 | $ | 3,316 | $ | 18,749 | 93.2 | % | |||||||
Capital gains from the sale of assets(1)(2) | 740 | 634 | 1,374 | 6.8 | % | ||||||||||
Total | $ | 16,173 | $ | 3,950 | $ | 20,123 | 100.0 | % | |||||||
(1) | For the three months ended March 31, 2017, we estimate that we had capital gains of $693 classified as long-term. The final determination of the tax attributes of our distributions is made annually as of the end of the year. |
(2) | During the three months ended March 31, 2017, the Company realized losses of $21,146 in our total return swap portfolio, which are not currently deductible on a tax-basis. |
For an additional discussion of our RIC status and distributions, refer to Note 2 and Note 5, respectively, to our consolidated financial statements included in this report.
Recent Accounting Pronouncements
See Note 2 to our consolidated financial statements included in this report for a discussion of certain recent accounting pronouncements that are applicable to us.
Critical Accounting Policies
Our consolidated financial statements are prepared in conformity with GAAP, which requires us to make estimates and assumptions that affect the reported amounts of assets and liabilities at the date of the consolidated financial statements and the reported amounts of revenues and expenses during the reporting periods. Critical accounting policies are those that require the application of management’s most difficult, subjective or complex judgments, often because of the need to make estimates about the effect of matters that are inherently uncertain and that may change in subsequent periods. In preparing the consolidated financial statements, we also utilize available information, including our past history, industry standards and the current economic environment, among other factors, in forming our estimates and judgments, giving due consideration to materiality. Actual results may differ from these estimates. In addition, other companies may utilize different estimates, which may impact the comparability of our results of operations to those of companies in similar businesses.
Valuation of Portfolio Investments
The value of our assets is determined quarterly and at such other times that an event occurs that materially affects the valuation. The valuation is made pursuant to Section 2(a)(41) of the 1940 Act, which requires that we value our assets as follows: (i) the market price for those securities for which a market quotation is readily available, and (ii) for all other securities and assets, at fair value, as determined in good faith by our board of directors. As a BDC, Section 2(a)(41) of the 1940 Act requires the board of directors to determine in good faith the fair value of portfolio securities for which a market price is not readily available, and it does so in conjunction with the application of our valuation procedures by CIM.
There is no single standard for determining fair value in good faith. As a result, determining fair value requires that judgment be applied to the specific facts and circumstances of each asset while employing a valuation process that is consistently followed. Determinations of fair value involve subjective judgments and estimates. Accordingly, the notes to our consolidated financial statements refer to the uncertainty with respect to the possible effect of such valuations, and any change in such valuations in our consolidated financial statements.
58
Valuation Methods
With respect to investments for which market quotations are not readily available, we undertake a multi-step valuation process each quarter, as described below:
• | our quarterly valuation process begins with each portfolio company or investment being initially valued by certain of CIM’s investment professionals and certain members of its management team, with such valuation taking into account information received from various sources, including independent valuation firms and AIM, if applicable; |
• | preliminary valuation conclusions are then documented and discussed with CIM’s valuation committee; |
• | CIM’s valuation committee reviews the preliminary valuation, and, if applicable, delivers such preliminary valuation to an independent valuation firm for its review; |
• | CIM’s valuation committee, or its designee, and, if appropriate, the relevant investment professionals meet with the independent valuation firm to discuss the preliminary valuation; |
• | designated members of CIM’s management team respond and supplement the preliminary valuation to reflect any comments provided by the independent valuation firm; |
• | our audit committee meets with members of CIM’s management team and the independent valuation firm to discuss the assistance provided and the results of the independent valuation firm’s review; and |
• | our board of directors discusses the valuation and determines the fair value of each investment in our portfolio in good faith based on various statistical and other factors, including the input and recommendation of CIM, the audit committee and any third-party valuation firm, if applicable. |
In addition to the foregoing, certain investments for which a market price is not readily available are evaluated on a quarterly basis by an independent valuation firm and certain other investments are on a rotational basis reviewed once over a twelve-month period by an independent valuation firm. Finally, certain investments are not evaluated by an independent valuation firm unless the net asset value and other aspects of such investments in the aggregate exceed certain thresholds.
Given the expected types of investments, excluding short term investments that are classified as Level 1, management expects our portfolio holdings to be classified as Level 3. Due to the uncertainty inherent in the valuation process, particularly for Level 3 investments, such fair value estimates may differ significantly from the values that would have been used had an active market for the investments existed. In addition, changes in the market environment and other events that may occur over the life of the investments may cause the gains or losses that we ultimately realize on these investments to materially differ from the valuations currently assigned. Inputs used in the valuation process are subject to variability in the future and can result in materially different fair values.
For an additional discussion of our investment valuation process, refer to Note 2 to our consolidated financial statements included in this report.
Related Party Transactions
For a discussion of our relationship with related parties including CION Securities, CIM, ICON Capital, and CIG and amounts incurred under agreements with such related parties, refer to Note 4 to our consolidated financial statements included in this report.
Contractual Obligations
On December 17, 2012, Flatiron entered into a TRS with Citibank, which expired on April 18, 2017. See Note 7 to our consolidated financial statements for a more detailed description of the TRS.
On March 29, 2017, Flatiron Funding II entered into the Citibank Credit Facility with Citibank. See Note 8 to our consolidated financial statements for a more detailed description of the Citibank Credit Facility.
On August 26, 2016, 34th Street entered into the JPM Credit Facility with JPM, as amended and restated on September 30, 2016. See Note 8 to our consolidated financial statements for a more detailed description of the JPM Credit Facility.
On April 30, 2015, we entered into the EWB Credit Facility with EWB, which expired on April 27, 2017. See Note 8 to our consolidated financial statements for a more detailed description of the EWB Credit Facility.
59
Commitments and Contingencies and Off-Balance Sheet Arrangements
Commitments and Contingencies
We have entered into certain contracts with other parties that contain a variety of indemnifications. Our maximum exposure under these arrangements is unknown. However, we have not experienced claims or losses pursuant to these contracts and believe the risk of loss related to such indemnifications to be remote.
Our investment portfolio may contain debt investments that are in the form of lines of credit, revolving credit facilities, or other unfunded commitments, which may require us to provide funding when requested in accordance with the terms of the underlying agreement. For further details on such debt investments, refer to Note 11 to our consolidated financial statements included in this report.
Off-Balance Sheet Arrangements
We currently have no off-balance sheet arrangements except for those discussed in Note 11 to our consolidated financial statements included in this report.
60
Item 3. Quantitative and Qualitative Disclosures About Market Risk
We are subject to financial market risks, including changes in interest rates. As of March 31, 2017, 95.4% of our portfolio investments and underlying loans subject to the TRS paid variable interest rates. A rise in the general level of interest rates can be expected to lead to higher interest rates applicable to our debt investments, especially to the extent that we hold variable rate investments, and to declines in the value of any fixed rate investments we may hold. To the extent that a majority of our investments may be in variable rate investments, an increase in interest rates could make it easier for us to meet or exceed our incentive fee hurdle rate, as defined in our investment advisory agreement, and may result in a substantial increase in our net investment income, and also to the amount of incentive fees payable to CIM with respect to our pre-incentive fee net investment income.
Under the terms of the TRS with Citibank, we paid fees to Citibank at a floating rate based primarily on LIBOR (and in limited cases the prime rate), plus a spread of 1.40% per year, in exchange for the right to receive the economic benefit of a pool of loans. Pursuant to the terms of the EWB Credit Facility, borrowings were at a floating rate of 0.75% plus the greater of 3.25% or the variable rate of interest per year announced by EWB as its prime rate, which was 4.00% at March 31, 2017. Under the terms of the JPM Credit Facility, advances bear interest at a floating rate equal to the three-month LIBOR, plus a spread of 3.50% per year. Under the terms of the Citibank Credit Facility, advances bear interest at a floating rate equal to (1) the higher of (a) the Citibank prime rate, (b) the federal funds rate plus 1.5% or (c) the three-month LIBOR plus 1.0%, plus (2) a spread of (a) 2% per year during the period from and including March 29, 2017 and the earlier of March 29, 2019 and the date the Citibank Credit Facility matures, or (b) 3% per year during the period from the date the Citibank Credit Facility matures until all obligations under the Citibank Credit Facility have been paid in full. In addition, in the future we may seek to borrow funds in order to make additional investments. Our net investment income will depend, in part, upon the difference between the rate at which we borrow funds and the rate at which we invest those funds. As a result, we would be subject to risks relating to changes in market interest rates. In periods of rising interest rates when we have debt outstanding, our cost of funds would increase, which could reduce our net investment income, especially to the extent we hold fixed rate investments. We expect that our long-term investments will be financed primarily with equity and long-term debt. Our interest rate risk management techniques may include various interest rate hedging activities to the extent permitted by the 1940 Act. Adverse developments resulting from changes in interest rates could have a material adverse effect on our business, financial condition and results of operations.
The following table shows the effect over a twelve month period of changes in interest rates on our net interest income, excluding short term investments, assuming no changes in our investment portfolio, the TRS Agreement, the EWB Credit Facility, the JPM Credit Facility, or the Citibank Credit Facility in effect as of March 31, 2017:
Change in Interest Rates | Increase in Net Interest Income(1) | Percentage Change in Net Interest Income | |||||
Down 100 basis points | $ | 2,633 | 2.6 | % | |||
Down 50 basis points | 611 | 0.6 | % | ||||
Current base interest rate | — | — | |||||
Up 50 basis points | 4,479 | 4.4 | % | ||||
Up 100 basis points | 9,088 | 8.9 | % | ||||
Up 200 basis points | 18,306 | 17.9 | % | ||||
Up 300 basis points | 27,524 | 26.9 | % | ||||
(1) | Pursuant to the TRS, we received from Citibank all interest payable in respect of the loans subject to the TRS and paid to Citibank interest at a rate equal to the floating rate index specified for each loan (typically LIBOR of varying maturities), which was not less than zero, plus 1.40% per year on the full notional amount of the loans subject to the TRS. As of March 31, 2017, all of the loans subject to the TRS paid variable interest rates. This table assumes no change in defaults or prepayments by portfolio companies over the next twelve months. |
The interest rate sensitivity analysis presented above does not consider the potential impact of the changes in fair value of our fixed rate debt investments and the net asset value of our common stock in the event of sudden increases in interest rates. Approximately 2.1% of our portfolio investments and none of our underlying loans subject to the TRS paid fixed interest rates as of March 31, 2017. Rising market interest rates will most likely lead to fair value declines for fixed interest rate investments and a decline in the net asset value of our common stock, while declining market interest rates will most likely lead to an increase in the fair value of fixed interest rate investments and an increase in the net asset value of our common stock.
In addition, we may have risk regarding portfolio valuation as discussed in Note 2 to our consolidated financial statements included in this report.
Item 4. Controls and Procedures
Evaluation of disclosure controls and procedures
In connection with the preparation of this Quarterly Report on Form 10-Q for the three months ended March 31, 2017, we carried out an evaluation, under the supervision and with the participation of our management, including our Co-Chief Executive Officers and our Chief Financial Officer, of the effectiveness of the design and operation of our disclosure controls and procedures as of the end of the period covered by this report pursuant to Rule 13a-15(b) and Rule 15d-15(b) of the Securities Exchange Act of 1934, as amended. Based on the foregoing evaluation, the Co-Chief Executive Officers and the Chief Financial Officer concluded that our disclosure controls and procedures were effective.
61
In designing and evaluating our disclosure controls and procedures, we recognized that disclosure controls and procedures, no matter how well conceived and operated, can provide only reasonable, not absolute, assurance that the objectives of the disclosure controls and procedures are met. Our disclosure controls and procedures have been designed to meet reasonable assurance standards. Disclosure controls and procedures cannot detect or prevent all error and fraud. Some inherent limitations in disclosure controls and procedures include costs of implementation, faulty decision-making, simple error and mistake. Additionally, controls can be circumvented by the individual acts of some persons, by collusion of two or more people, or by management override of the controls. The design of any system of controls is based, in part, upon certain assumptions about the likelihood of future events, and there can be no assurance that any design will succeed in achieving its stated goals under all anticipated and unanticipated future conditions. Over time, controls may become inadequate because of changes in conditions, or the degree of compliance with established policies or procedures.
Evaluation of internal control over financial reporting
There have been no changes in our internal control over financial reporting during the three months ended March 31, 2017 that have materially affected, or are reasonably likely to materially affect, our internal control over financial reporting.
62
PART II - OTHER INFORMATION
Item 1. Legal Proceedings
We are not currently subject to any material legal proceedings, nor, to our knowledge, is any material legal proceeding threatened against us. From time to time, we may be party to certain legal proceedings in the ordinary course of business, including proceedings relating to the enforcement of our rights under contracts with our portfolio companies and other third parties. While the outcome of these legal proceedings cannot be predicted with certainty, we do not expect that any such proceedings will have a material effect upon our financial condition or results of operations.
Item 1A. Risk Factors
There have been no material changes from the risk factors disclosed in “Item 1A. Risk Factors” of our Annual Report on Form 10-K for the year ended December 31, 2016.
Item 2. Unregistered Sales of Equity Securities and Use of Proceeds
Our registration statement on Form N-2, as amended, in connection with our follow-on continuous public offering was declared effective by the SEC on January 25, 2016 (SEC File No. 333-203683). Our follow-on continuous public offering commenced on January 25, 2016.
We did not engage in any unregistered sales of equity securities during the three months ended March 31, 2017.
The table below provides information concerning our repurchases of shares of our common stock during the three months ended March 31, 2017 pursuant to our share repurchase program.
Period | Total Number of Shares Purchased | Average Price Paid per Share | Total Number of Shares Purchased as Part of Publicly Announced Plans or Programs | Maximum Number of Shares That May Yet Be Purchased Under the Plans or Programs | |||||||||
January 1 to January 31, 2017 | 814,223 | $ | 9.05 | 814,223 | (1 | ) | |||||||
February 1 to February 28, 2017 | — | — | — | — | |||||||||
March 1 to March 31, 2017 | — | — | — | — | |||||||||
Total | 814,223 | $ | 9.05 | 814,223 | (1 | ) | |||||||
(1) | A description of the maximum number of shares of our common stock that may be repurchased is set forth in a detailed discussion of the terms of our share repurchase program in Note 3 to our unaudited consolidated financial statements contained in this Quarterly Report on Form 10-Q. |
Item 3. Defaults Upon Senior Securities
Not applicable.
Item 4. Mine Safety Disclosures
Not applicable.
Item 5. Other Information
Not applicable.
63
Item 6. Exhibits
Exhibit Number | Description of Document | |
2.1 | Purchase and Sale Agreement, dated as of September 30, 2016, by and between Park South Funding, LLC and Credit Suisse Alternative Capital, LLC (Incorporated by reference to Exhibit 2.1 to Registrant’s Current Report on Form 8-K filed with the SEC on October 4, 2016 (File No. 814-00941)). | |
3.1 | Articles of Amendment and Restatement of the Articles of Incorporation of CĪON Investment Corporation (Incorporated by reference to Exhibit (A)(2) to Pre-Effective Amendment No. 4 to Registrant’s Registration Statement on Form N-2 filed with the SEC on June 29, 2012 (File No. 333-178646)). | |
3.2 | Second Articles of Amendment and Restatement of the Articles of Incorporation of CĪON Investment Corporation (Incorporated by reference to Exhibit 3.1 to Registrant’s Current Report on Form 8-K filed with the SEC on August 27, 2012 (File No. 814-00941)). | |
3.3 | Form of Third Articles of Amendment and Restatement of the Articles of Incorporation of CĪON Investment Corporation (Incorporated by reference to Appendix A to Registrant’s Definitive Proxy Statement on Schedule 14A filed with the SEC on April 4, 2017 (File No. 814-00941)). | |
3.4 | Bylaws of CĪON Investment Corporation (Incorporated by reference to Exhibit (B) to Pre-Effective Amendment No. 4 to Registrant’s Registration Statement on Form N-2 filed with the SEC on June 29, 2012 (File No. 333-178646)). | |
4.1 | Form of Follow-On Subscription Agreement (Incorporated by reference to Appendix A to Post-Effective Amendment No. 4 to Registrant’s Registration Statement on Form N-2 filed with the SEC on April 26, 2017 (File No. 333-203683)). | |
4.2 | Fifth Amended and Restated Distribution Reinvestment Plan of CĪON Investment Corporation (Incorporated by reference to Exhibit 4.1 to Registrant’s Current Report on Form 8-K filed with the SEC on December 8, 2016 (File No. 814-00941)). | |
10.1 | Investment Advisory Agreement by and between CĪON Investment Corporation and CION Investment Management, LLC (Incorporated by reference to Exhibit (G)(1) to Pre-Effective Amendment No. 4 to Registrant’s Registration Statement on Form N-2 filed with the SEC on June 29, 2012 (File No. 333-178646)). | |
10.2 | Investment Sub-Advisory Agreement by and among CION Investment Management, LLC, CĪON Investment Corporation and Apollo Investment Management, L.P. (Incorporated by reference to Exhibit (G)(2) to Pre-Effective Amendment No. 4 to Registrant’s Registration Statement on Form N-2 filed with the SEC on June 29, 2012 (File No. 333-178646)). | |
10.3 | Administration Agreement by and between CĪON Investment Corporation and ICON Capital Corp. (Incorporated by reference to Exhibit (K)(2) to Pre-Effective Amendment No. 4 to Registrant’s Registration Statement on Form N-2 filed with the SEC on June 29, 2012 (File No. 333-178646)). | |
10.4 | Custody Agreement by and between CĪON Investment Corporation and U.S. Bank National Association (Incorporated by reference to Exhibit (J) to Pre-Effective Amendment No. 4 to Registrant’s Registration Statement on Form N-2 filed with the SEC on June 29, 2012 (File No. 333-178646)). | |
10.5 | Escrow Agreement by and among CĪON Investment Corporation, UMB Bank, N.A., and ICON Securities Corp. (Incorporated by reference to Exhibit (K)(1) to Pre-Effective Amendment No. 4 to Registrant’s Registration Statement on Form N-2 filed with the SEC on June 29, 2012 (File No. 333-178646)). | |
10.6 | Dealer Manager Agreement by and among CĪON Investment Corporation, CION Investment Management, LLC and ICON Securities Corp. (Incorporated by reference to Exhibit (H)(1) to Pre-Effective Amendment No. 4 to Registrant’s Registration Statement on Form N-2 filed with the SEC on June 29, 2012 (File No. 333-178646)). | |
10.7 | ISDA 2002 Master Agreement, together with the Schedule thereto and Credit Support Annex to such Schedule, each dated as of December 17, 2012, by and between Flatiron Funding, LLC and Citibank, N.A. (Incorporated by reference to Exhibit 10.1 to the Registrant’s Current Report on Form 8-K filed with the SEC on December 19, 2012 (File No. 814-00941)). | |
10.8 | Thirteenth Amended and Restated Confirmation Letter Agreement, dated as of February 18, 2017, by and between Flatiron Funding, LLC and Citibank, N.A. (Incorporated by reference to Exhibit 10.1 to the Registrant’s Current Report on Form 8-K filed with the SEC on February 23, 2017 (File No. 814-00941)). | |
10.9 | Third Amended and Restated Expense Support and Conditional Reimbursement Agreement, dated as of December 14, 2016, by and among CĪON Investment Corporation, Apollo Investment Management, L.P. and CION Investment Group, LLC (Incorporated by reference to Exhibit 10.1 to Registrant’s Current Report on Form 8-K filed with the SEC on December 14, 2016 (File No. 814-00941)). | |
10.10 | Amended and Restated Follow-On Dealer Manager Agreement, dated as of December 28, 2016, by and among CĪON Investment Corporation, CION Investment Management, LLC and CION Securities, LLC (Incorporated by reference to Exhibit 10.1 to Registrant’s Current Report on Form 8-K filed with the SEC on January 4, 2017 (File No. 814-00941)). | |
10.11 | Form of Follow-On Selected Dealer Agreement (Incorporated by reference to Exhibit (H)(4) to Registrant’s Registration Statement on Form N-2 filed with the SEC on April 28, 2015 (File No. 333-203683)). | |
10.12 | Loan and Security Agreement, dated as of April 30, 2015, by and between CĪON Investment Corporation and East West Bank (Incorporated by reference to Exhibit 10.1 to Registrant’s Current Report on Form 8-K filed with the SEC on May 6, 2015 (File No. 814-00941)). | |
10.13 | First Amendment to Loan and Security Agreement, dated as of January 28, 2016, by and between CĪON Investment Corporation and East West Bank (Incorporated by reference to Exhibit 10.1 to Registrant’s Current Report on Form 8-K filed with the SEC on February 3, 2016 (File No. 814-00941)). | |
10.14 | Second Amendment to Loan and Security Agreement, dated as of April 21, 2016, by and between CĪON Investment Corporation and East West Bank (Incorporated by reference to Exhibit 10.1 to Registrant’s Current Report on Form 8-K filed with the SEC on April 27, 2016 (File No. 814-00941)). | |
10.15 | Custody Control Agreement, dated as of April 30, 2015, by and among CĪON Investment Corporation, East West Bank and U.S. Bank National Association (Incorporated by reference to Exhibit 10.2 to Registrant’s Current Report on Form 8-K filed with the SEC on May 6, 2015 (File No. 814-00941)). | |
64
Exhibit Number | Description of Document | |
10.16 | Limited Liability Company Agreement of CION / Capitala Senior Loan Fund I, LLC, dated as of June 24, 2015, by and between CĪON Investment Corporation and Capitala Finance Corp. (Incorporated by reference to Exhibit 10.1 to Registrant’s Current Report on Form 8-K filed with the SEC on June 26, 2015 (File No. 814-00941)). | |
10.17 | Loan and Security Agreement, dated as of August 26, 2016, by and among 34th Street Funding, LLC, JPMorgan Chase Bank, National Association, U.S. Bank National Association and CION Investment Management, LLC (Incorporated by reference to Exhibit 10.1 to Registrant’s Current Report on Form 8-K filed with the SEC on September 1, 2016 (File No. 814-00941)). | |
10.18 | Sale and Contribution Agreement, dated as of August 26, 2016, by and between 34th Street Funding, LLC and CĪON Investment Corporation (Incorporated by reference to Exhibit 10.2 to Registrant’s Current Report on Form 8-K filed with the SEC on September 1, 2016 (File No. 814-00941)). | |
10.19 | Master Participation Agreement, dated as of August 26, 2016, by and between 34th Street Funding, LLC and CĪON Investment Corporation (Incorporated by reference to Exhibit 10.3 to Registrant’s Current Report on Form 8-K filed with the SEC on September 1, 2016 (File No. 814-00941)). | |
10.20 | Portfolio Management Agreement, dated as of August 26, 2016, by and between 34th Street Funding, LLC and CION Investment Management, LLC (Incorporated by reference to Exhibit 10.4 to Registrant’s Current Report on Form 8-K filed with the SEC on September 1, 2016 (File No. 814-00941)). | |
10.21 | Guarantee of CĪON Investment Corporation dated as of August 26, 2016 (Incorporated by reference to Exhibit 10.5 to Registrant’s Current Report on Form 8-K filed with the SEC on September 1, 2016 (File No. 814-00941)). | |
10.22 | Amended and Restated Loan and Security Agreement, dated as of September 30, 2016, by and among 34th Street Funding, LLC, JPMorgan Chase Bank, National Association, U.S. Bank National Association and CION Investment Management, LLC (Incorporated by reference to Exhibit 10.1 to Registrant’s Current Report on Form 8-K filed with the SEC on October 4, 2016 (File No. 814-00941)). | |
10.23 | Release and Termination Agreement, dated as of September 30, 2016, by and among CĪON Investment Corporation, 34th Street Funding, LLC and JPMorgan Chase Bank, National Association (Incorporated by reference to Exhibit 10.2 to Registrant’s Current Report on Form 8-K filed with the SEC on October 4, 2016 (File No. 814-00941)). | |
10.24 | Amended and Restated Portfolio Management Agreement, dated as of September 30, 2016, by and among 34th Street Funding, LLC, CION Investment Management, LLC and JPMorgan Chase Bank, National Association (Incorporated by reference to Exhibit 10.3 to Registrant’s Current Report on Form 8-K filed with the SEC on October 4, 2016 (File No. 814-00941)). | |
10.25 | Credit and Security Agreement, dated as of March 29, 2017, by and among Flatiron Funding II, LLC, CION Investment Management, LLC, CĪON Investment Corporation, Citibank, N.A. and U.S. Bank National Association (Incorporated by reference to Exhibit 10.1 to Registrant’s Current Report on Form 8-K filed with the SEC on April 4, 2017 (File No. 814-00941)). | |
10.26 | Account Control Agreement, dated as of March 29, 2017, by and among Flatiron Funding II, LLC, CION Investment Management, LLC and U.S. Bank National Association (Incorporated by reference to Exhibit 10.2 to Registrant’s Current Report on Form 8-K filed with the SEC on April 4, 2017 (File No. 814-00941)). | |
10.27 | Master Participation and Assignment Agreement, dated as of March 29, 2017, by and between 15th Street Loan Funding LLC and Flatiron Funding II, LLC (Incorporated by reference to Exhibit 10.3 to Registrant’s Current Report on Form 8-K filed with the SEC on April 4, 2017 (File No. 814-00941)). | |
10.28 | Master Participation and Assignment Agreement, dated as of March 29, 2017, by and between 15th Street Loan Funding 2 LLC and Flatiron Funding II, LLC (Incorporated by reference to Exhibit 10.4 to Registrant’s Current Report on Form 8-K filed with the SEC on April 4, 2017 (File No. 814-00941)). | |
31.1 | Rule 13a-14(a)/15d-14(a) Certification of Co-Chief Executive Officer. | |
31.2 | Rule 13a-14(a)/15d-14(a) Certification of Co-Chief Executive Officer. | |
31.3 | Rule 13a-14(a)/15d-14(a) Certification of Chief Financial Officer. | |
32.1 | Certification of Co-Chief Executive Officer pursuant to 18 U.S.C. §1350, as adopted pursuant to Section 906 of the Sarbanes-Oxley Act of 2002. | |
32.2 | Certification of Co-Chief Executive Officer pursuant to 18 U.S.C. §1350, as adopted pursuant to Section 906 of the Sarbanes-Oxley Act of 2002. | |
32.3 | Certification of Chief Financial Officer pursuant to 18 U.S.C. §1350, as adopted pursuant to Section 906 of the Sarbanes-Oxley Act of 2002. | |
65
SIGNATURES
Pursuant to the requirements of the Securities Exchange Act of 1934, the registrant has duly caused this report to be signed on its behalf by the undersigned, thereunto duly authorized.
Date: May 12, 2017
CĪON Investment Corporation
(Registrant)
By: /s/ Michael A. Reisner |
Michael A. Reisner |
Co-Chief Executive Officer |
(Principal Executive Officer) |
By: /s/ Mark Gatto |
Mark Gatto |
Co-Chief Executive Officer |
(Principal Executive Officer) |
By: /s/ Keith S. Franz |
Keith S. Franz |
Chief Financial Officer |
(Principal Financial and Accounting Officer) |
66