Attached files
| file | filename |
|---|---|
| EX-99.1 - EXHIBIT 99.1 - KEMET CORP | fy2017_q4x8kxex99d1.htm |
| 8-K - 8-K - KEMET CORP | fy2017_q4x8kearningsreleas.htm |

Earnings Conference Call
May 10, 2017
Quarter Ended March 31, 2017

Cautionary Statement
Certain statements included herein contain forward-looking statements within the meaning of federal securities laws about KEMET
Corporation's (the "Company") financial condition and results of operations that are based on management's current expectations,
estimates and projections about the markets in which the Company operates, as well as management's beliefs and assumptions. Words
such as "expects," "anticipates," "believes," "estimates," variations of such words and other similar expressions are intended to identify
such forward-looking statements. These statements are not guarantees of future performance and involve certain risks, uncertainties
and assumptions, which are difficult to predict. Therefore, actual outcomes and results may differ materially from what is expressed or
forecasted in, or implied by, such forward-looking statements. Readers are cautioned not to place undue reliance on these forward-
looking statements, which reflect management's judgment only as of the date hereof. The Company undertakes no obligation to update
publicly any of these forward-looking statements to reflect new information, future events or otherwise.
Factors that may cause actual outcomes and results to differ materially from those expressed in, or implied by, these forward-looking
statements include, but are not necessarily limited to, the following: (i) adverse economic conditions could impact our ability to realize
operating plans if the demand for our products declines, and such conditions could adversely affect our liquidity and ability to continue
to operate and cause a write down of long-lived assets or goodwill; (ii) an increase in the cost or a decrease in the availability of our
principal or single-sourced purchased raw materials; (iii) changes in the competitive environment; (iv) uncertainty of the timing of customer
product qualifications in heavily regulated industries; (v) economic, political, or regulatory changes in the countries in which we operate;
(vi) difficulties, delays or unexpected costs in completing the restructuring plans; (vii) acquisitions and other strategic transactions expose
us to a variety of risks; (viii) acquisition of TOKIN may not achieve all of the anticipated results; (ix) our business could be negatively
impacted by increased regulatory scrutiny and litigation; (x) difficulties associated with retaining, attracting and training effective
employees and management; (xi) the need to develop innovative products to maintain customer relationships and offset potential price
erosion in older products; (xii) exposure to claims alleging product defects; (xiii) the impact of laws and regulations that apply to our
business, including those relating to environmental matters; (xiv) the impact of international laws relating to trade, export controls and
foreign corrupt practices; (xv) changes impacting international trade and corporate tax provisions related to the global manufacturing
and sales of our products may have an adverse effect on our financial condition and results of operations; (xvi) volatility of financial and
credit markets affecting our access to capital; (xvii) the need to reduce the total costs of our products to remain competitive; (xviii) potential
limitation on the use of net operating losses to offset possible future taxable income; (xix) restrictions in our debt agreements that limit
our flexibility in operating our business; (xx) disruption to our information technology systems to function properly or control unauthorized
access to our systems may cause business disruptions; (xxi) additional exercise of the warrant by K Equity, LLC which could potentially
result in the existence of a significant stockholder who could seek to influence our corporate decisions; and (xxii) fluctuation in distributor
sales could adversely affect our results of operations.
2

Income Statement Highlights
U.S. GAAP (Unaudited)
3
For the Quarters Ended
(Amounts in thousands, except percentages and per share data) Mar 2017 Dec 2016 Mar 2016
Net sales $ 197,519 $ 188,029 $ 183,926
Gross margin $ 49,839 $ 47,337 $ 42,013
Gross margin as a percentage of net sales 25.2% 25.2% 22.8%
Selling, general and administrative $ 29,317 $ 26,665 $ 25,790
SG&A as a percentage of net sales 14.8% 14.2% 14.0%
Operating income (loss) $ 8,742 $ 13,850 $ 8,603
Net income (loss) $ 52,914 $ 12,278 $ (15,173)
Per share data:
Net income (loss) per basic share $ 1.13 $ 0.26 $ (0.33)
Net income (loss) per diluted share $ 0.93 $ 0.22 $ (0.33)
Weighted avg. shares - basic 46,803 46,606 46,160
Weighted avg. shares - diluted 57,130 55,296 46,160

Income Statement Highlights
Non-GAAP (Unaudited)
4
For the Quarters Ended
(Amounts in thousands, except percentages and per share data) Mar 2017 Dec 2016 Mar 2016
Net sales $ 197,519 $ 188,029 $ 183,926
Adjusted gross margin $ 50,230 $ 47,645 $ 42,751
Gross margin as a percentage of net sales 25.4% 25.3% 23.2%
Adjusted selling, general and administrative $ 25,848 $ 23,649 $ 23,499
Adjusted SG&A as a percentage of net sales 13.1% 12.6% 12.8%
Adjusted operating income (loss) $ 17,912 $ 16,983 $ 12,907
Adjusted net income (loss) $ 7,845 $ 5,810 $ 1,812
Adjusted EBITDA $ 27,230 $ 26,841 $ 23,042
Per share data:
Adjusted net income (loss) - basic $ 0.17 $ 0.13 $ 0.04
Adjusted net income (loss) - diluted $ 0.14 $ 0.11 $ 0.04
Weighted avg. shares - basic 46,803 46,606 46,160
Weighted avg. shares - diluted 57,130 55,296 50,056
Income Statement Highlights
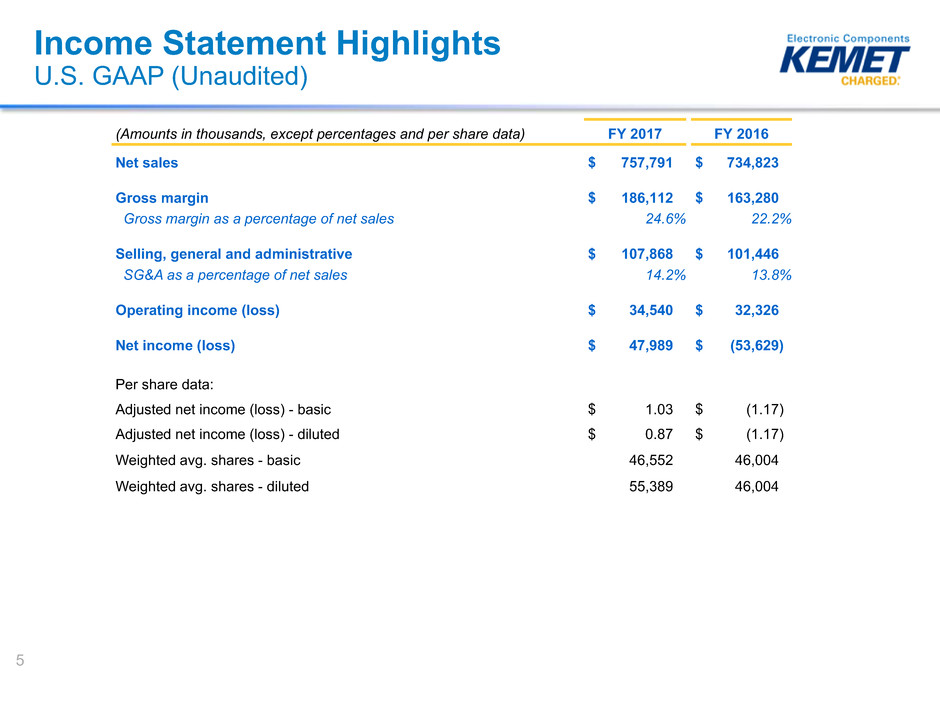
U.S. GAAP (Unaudited)
5
(Amounts in thousands, except percentages and per share data) FY 2017 FY 2016
Net sales $ 757,791 $ 734,823
Gross margin $ 186,112 $ 163,280
Gross margin as a percentage of net sales 24.6% 22.2%
Selling, general and administrative $ 107,868 $ 101,446
SG&A as a percentage of net sales 14.2% 13.8%
Operating income (loss) $ 34,540 $ 32,326
Net income (loss) $ 47,989 $ (53,629)
Per share data:
Adjusted net income (loss) - basic $ 1.03 $ (1.17)
Adjusted net income (loss) - diluted $ 0.87 $ (1.17)
Weighted avg. shares - basic 46,552 46,004
Weighted avg. shares - diluted 55,389 46,004
Income Statement Highlights
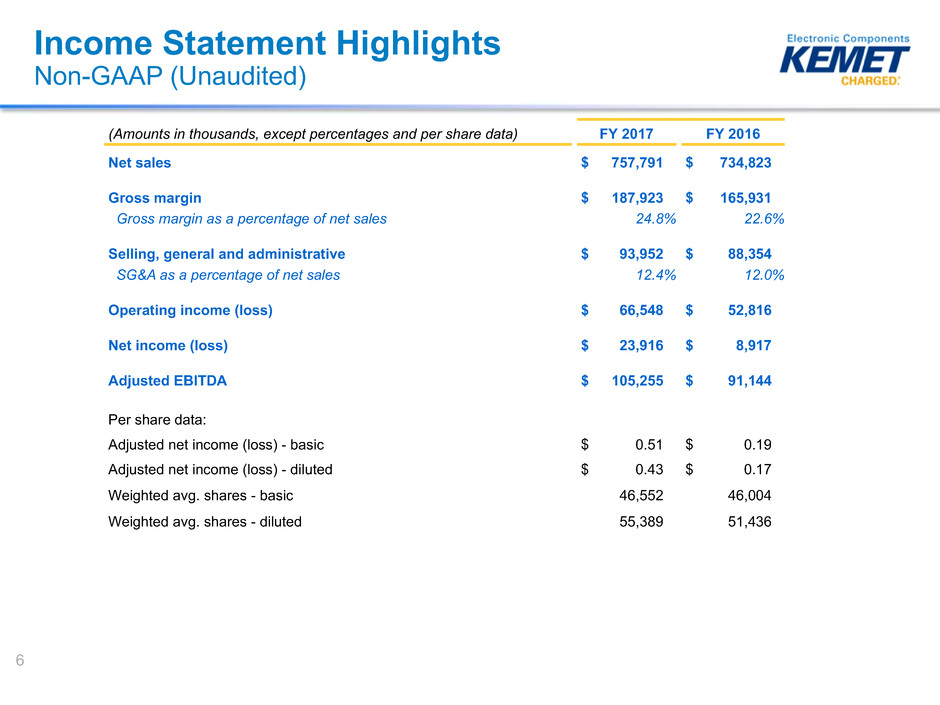
Non-GAAP (Unaudited)
6
(Amounts in thousands, except percentages and per share data) FY 2017 FY 2016
Net sales $ 757,791 $ 734,823
Gross margin $ 187,923 $ 165,931
Gross margin as a percentage of net sales 24.8% 22.6%
Selling, general and administrative $ 93,952 $ 88,354
SG&A as a percentage of net sales 12.4% 12.0%
Operating income (loss) $ 66,548 $ 52,816
Net income (loss) $ 23,916 $ 8,917
Adjusted EBITDA $ 105,255 $ 91,144
Per share data:
Adjusted net income (loss) - basic $ 0.51 $ 0.19
Adjusted net income (loss) - diluted $ 0.43 $ 0.17
Weighted avg. shares - basic 46,552 46,004
Weighted avg. shares - diluted 55,389 51,436

Financial Highlights
(Unaudited)
(1) Calculated as accounts receivable, net, plus inventories, net, less accounts payable
(2) Current quarter's accounts receivable divided by annualized current quarter's net sales multiplied by 365
(3) Current quarter's accounts payable divided by annualized current quarter's cost of goods sold multiplied
by 3657
(Amounts in millions, except DSO and DPO) Mar 2017 Dec 2016 FX Impact
Cash, cash equivalents $ 109.8 $ 87.4 $ 0.2
Capital expenditures $ 10.6 $ 4.7
Short-term debt $ 2.0 $ —
Long-term debt 387.3 386.9
Debt premium (1.1) (0.7)
Total debt $ 388.2 $ 386.2 $ —
Equity $ 154.7 $ 90.4 $ (2.7)
Net working capital (1) $ 170.8 $ 174.7 $ 0.4
Days in receivables (DSO)(2) 43 40
Days in payables (DPO)(3) 43 40
Financial Trends
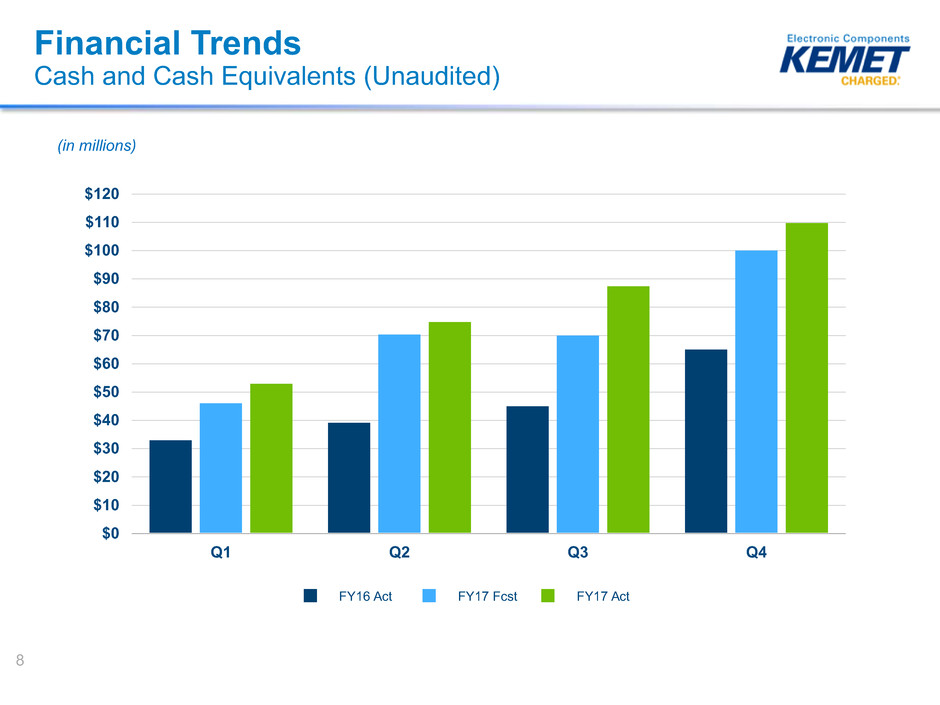
Cash and Cash Equivalents (Unaudited)
FY16 Act FY17 Fcst FY17 Act
$120
$110
$100
$90
$80
$70
$60
$50
$40
$30
$20
$10
$0
Q1 Q2 Q3 Q4
8
(in millions)
Cost Rationalization Drives Margin Improvement
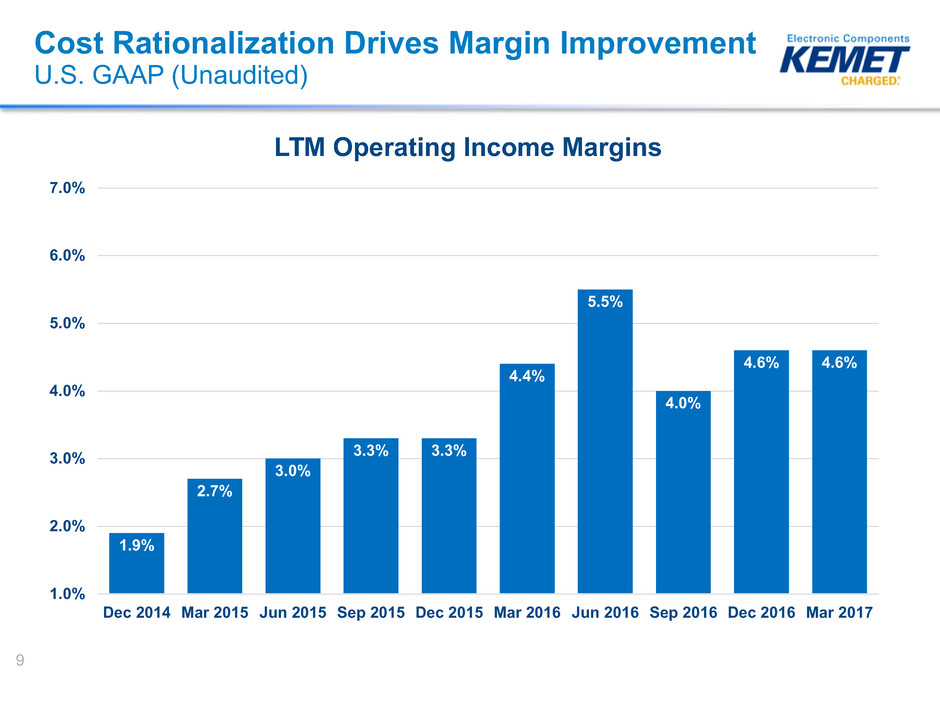
U.S. GAAP (Unaudited)
LTM Operating Income Margins
7.0%
6.0%
5.0%
4.0%
3.0%
2.0%
1.0%
Dec 2014 Mar 2015 Jun 2015 Sep 2015 Dec 2015 Mar 2016 Jun 2016 Sep 2016 Dec 2016 Mar 2017
1.9%
2.7%
3.0%
3.3% 3.3%
4.4%
5.5%
4.0%
4.6% 4.6%
9

Cost Rationalization Drives Margin Improvement
Non-GAAP (Unaudited)
LTM Adjusted EBITDA Margins
14.5%
14.0%
13.5%
13.0%
12.5%
12.0%
11.5%
11.0%
10.5%
Dec 2014 Mar 2015 Jun 2015 Sep 2015 Dec 2015 Mar 2016 Jun 2016 Sep 2016 Dec 2016 Mar 2017
11.2% 11.1%
11.5%
11.8%
11.6%
12.4%
13.0%
13.3%
13.6%
13.9%
10
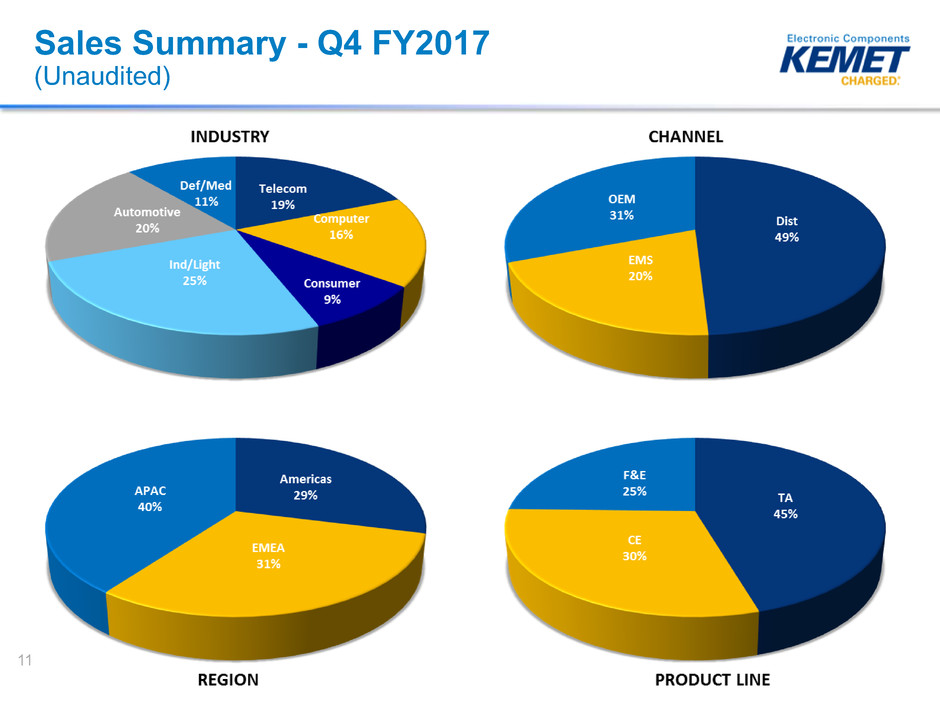
Sales Summary - Q4 FY2017
(Unaudited)
11
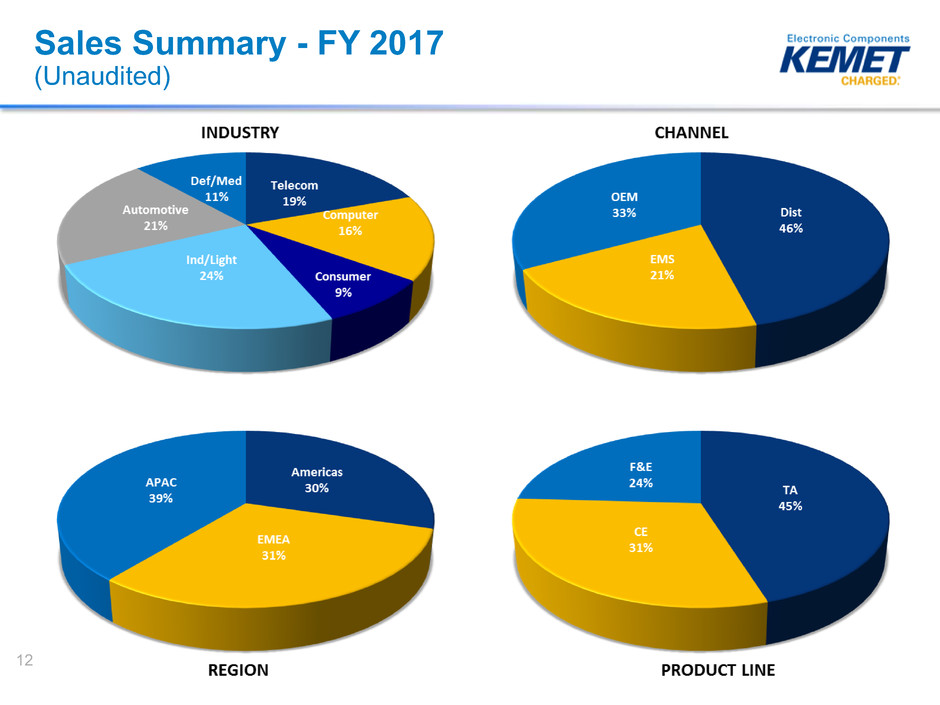
Sales Summary - FY 2017
(Unaudited)
12

Appendix

Adjusted Gross Margin
Non-GAAP (Unaudited)
14
For the Quarters Ended Fiscal Year
(Amounts in thousands, except percentages) Mar 2017 Dec 2016 Mar 2016 2017 2016
Net sales $ 197,519 $ 188,029 $ 183,926 $ 757,791 $ 734,823
Cost of sales $ 147,680 $ 140,692 $ 141,913 $ 571,679 $ 571,543
Gross margin (U.S. GAAP) $ 49,839 $ 47,337 $ 42,013 $ 186,112 $ 163,280
Gross margin as a percentage of net sales 25.2% 25.2% 22.8% 24.6% 22.2%
Adjustments:
Stock-based compensation expense 391 308 278 1,384 1,418
Plant start-up costs — — 319 427 861
Plant shut-down costs — — 141 — 372
Adjusted gross margin (non-GAAP) $ 50,230 $ 47,645 $ 42,751 $ 187,923 $ 165,931
Adjusted gross margin as a percentage of net sales 25.4% 25.3% 23.2% 24.8% 22.6%

Adjusted Selling, General & Administrative
Expenses
Non-GAAP (Unaudited)
15
For the Quarters Ended Fiscal Year
(Amounts in thousands, except percentages) Mar 2017 Dec 2016 Mar 2016 2017 2016
Net sales $ 197,519 $ 188,029 $ 183,926 $ 757,791 $ 734,823
Selling, general and administrative expenses (U.S.
GAAP) $ 29,317 $ 26,665 $ 25,790 $ 107,868 $ 101,446
Selling, general, and administrative as a percentage of net sales 14.8% 14.2% 14.0% 14.2% 13.8%
Less adjustments:
ERP integration costs/IT transition costs 1,760 1,734 859 7,045 5,677
Stock-based compensation expense 806 785 685 3,130 3,162
Legal expenses related to antitrust class actions 406 293 482 2,640 3,041
NEC TOKIN investment related expenses 497 204 265 1,101 900
Pension plan adjustment — — — — 312
Adjusted selling, general and administrative
expenses (non-GAAP) $ 25,848 $ 23,649 $ 23,499 $ 93,952 $ 88,354
Adjusted selling, general, and administrative as a percentage of net sales 13.1% 12.6% 12.8% 12.4% 12.0%

Adjusted Operating Income
Non-GAAP (Unaudited)
16
For the Quarters Ended Fiscal Year
(Amounts in thousands) Mar 2017 Dec 2016 Mar 2016 2017 2016
Operating income (loss) (U.S. GAAP) $ 8,742 $ 13,850 $ 8,603 $ 34,540 $ 32,326
Adjustments:
ERP integration costs/IT transition costs 1,760 1,734 859 7,045 5,677
Stock-based compensation expense 1,249 1,139 1,013 4,720 4,774
Restructuring charges 1,087 (369) 617 5,404 4,178
Legal expenses related to antitrust class actions 406 293 482 2,640 3,041
NEC TOKIN investment related expenses 497 204 265 1,101 900
Net (gain) loss on sales and disposals of assets 85 132 608 392 375
Plant start-up costs — — 319 427 861
Plant shut-down costs — — 141 — 372
Pension plan adjustment — — — — 312
Write down of long-lived assets 4,086 — — 10,279 —
Adjusted operating income (loss) (non-GAAP) $ 17,912 $ 16,983 $ 12,907 $ 66,548 $ 52,816

Adjusted Net Income (Loss) and Adjusted
EBITDA
Non-GAAP (Unaudited)
17
For the Quarters Ended Fiscal Year
(Amounts in thousands) Mar 2017 Dec 2016 Mar 2016 2017 2016
Net income (loss) (U.S. GAAP) $ 52,914 $ 12,278 $ (15,173) $ 47,989 $ (53,629)
Adjustments:
Change in value of NEC TOKIN options (14,200) (6,900) — (10,700) 26,300
Net foreign exchange (gain) loss 1,507 (2,621) 122 (3,758) (3,036)
ERP integration costs/IT transition costs 1,760 1,734 859 7,045 5,677
Stock-based compensation 1,249 1,139 1,013 4,720 4,774
Income tax effect of non-GAAP adjustments (374) (396) 546 (741) 652
Restructuring charges 1,087 (369) 617 5,404 4,178
Legal expenses related to antitrust class actions 406 293 482 2,640 3,041
NEC TOKIN investment related expenses 497 204 265 1,101 900
Amortization included in interest expense 200 183 210 761 859
Equity (gain) loss from NEC TOKIN (41,372) 133 11,648 (41,643) 16,406
Net (gain) loss on sales and disposals of assets 85 132 608 392 375
Write down of long-lived assets 4,086 — — 10,279 —
Income tax effect of pension curtailment — — 155 — 875
Plant start-up costs — — 319 427 861
Plant shut-down costs — — 141 — 372
Pension plan adjustment — — — — 312
Adjusted net income (loss) (non-GAAP) $ 7,845 $ 5,810 $ 1,812 $ 23,916 $ 8,917
Adjusted net income (loss) per share - basic $ 0.17 $ 0.13 $ 0.04 $ 0.51 $ 0.19
Adjusted net income (loss) per share - diluted $ 0.14 $ 0.11 $ 0.04 $ 0.43 $ 0.17
Adjusted EBITDA (non-GAAP) $ 27,230 $ 26,841 $ 23,042 $ 105,255 $ 91,144
Weighted avg. shares - basic 46,803 46,606 46,160 46,552 46,004
Weighted avg. shares - diluted 57,130 55,296 50,056 55,389 51,436

Adjusted EBITDA Reconciliation
Non-GAAP (Unaudited)
18
For the Quarters Ended Fiscal Year
(Amounts in thousands) Mar 2017 Dec 2016 Mar 2016 2017 2016
Net income (loss) (U.S. GAAP) $ 52,914 $ 12,278 $ (15,173) $ 47,989 $ (53,629)
Interest expense, net 9,994 9,913 9,925 39,731 39,591
Income tax expense (benefit) (150) 1,810 2,056 4,290 6,006
Depreciation and amortization 9,367 9,095 10,160 37,338 39,016
EBITDA (non-GAAP) 72,125 33,096 6,968 129,348 30,984
Excluding the following items
Change in value of NEC TOKIN options (14,200) (6,900) — (10,700) 26,300
Net foreign exchange (gain) loss 1,507 (2,621) 122 (3,758) (3,036)
ERP integration costs/IT transition costs 1,760 1,734 859 7,045 5,677
Stock-based compensation 1,249 1,139 1,013 4,720 4,774
Restructuring charges 1,087 (369) 617 5,404 4,178
Legal expenses related to antitrust class actions 406 293 482 2,640 3,041
NEC TOKIN investment related expenses 497 204 265 1,101 900
Equity (gain) loss from NEC TOKIN (41,372) 133 11,648 (41,643) 16,406
Net (gain) loss on sales and disposals of assets 85 132 608 392 375
Write down of long-lived assets 4,086 — — 10,279 —
Plant start-up costs — — 319 427 861
Plant shut-down costs — — 141 — 372
Pension plan adjustment — — — — 312
Adjusted EBITDA (non-GAAP) $ 27,230 $ 26,841 $ 23,042 $ 105,255 $ 91,144
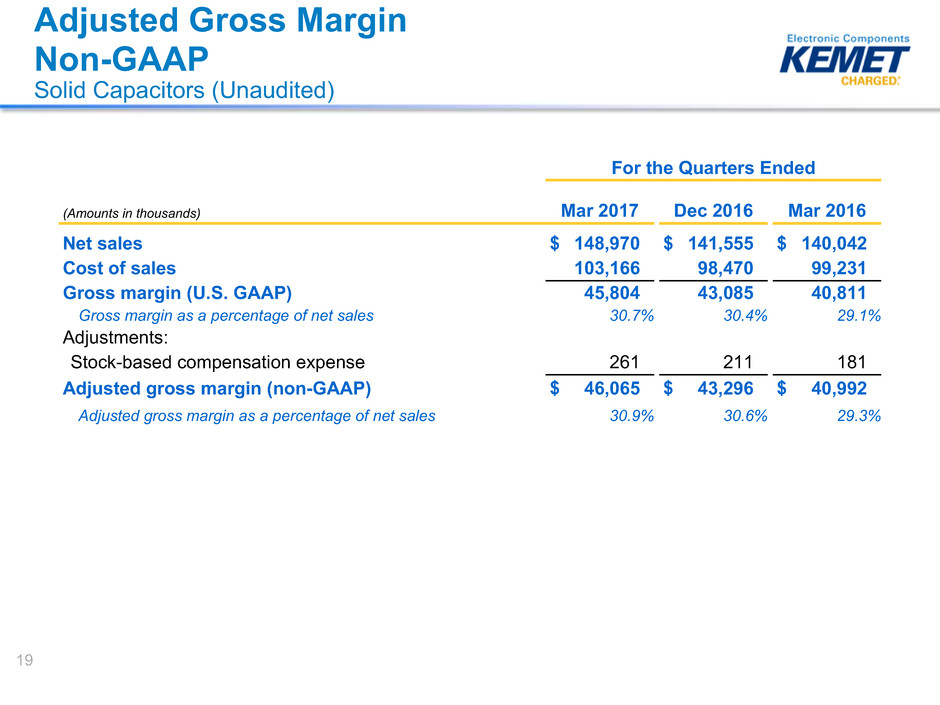
Adjusted Gross Margin
Non-GAAP
Solid Capacitors (Unaudited)
19
For the Quarters Ended
(Amounts in thousands) Mar 2017 Dec 2016 Mar 2016
Net sales $ 148,970 $ 141,555 $ 140,042
Cost of sales 103,166 98,470 99,231
Gross margin (U.S. GAAP) 45,804 43,085 40,811
Gross margin as a percentage of net sales 30.7% 30.4% 29.1%
Adjustments:
Stock-based compensation expense 261 211 181
Adjusted gross margin (non-GAAP) $ 46,065 $ 43,296 $ 40,992
Adjusted gross margin as a percentage of net sales 30.9% 30.6% 29.3%

Adjusted Gross Margin
Non-GAAP
Film & Electrolytics (Unaudited)
20
For the Quarters Ended
(Amounts in thousands) Mar 2017 Dec 2016 Mar 2016
Net sales $ 48,549 $ 46,474 $ 43,884
Cost of sales 44,514 42,222 42,682
Gross margin (U.S. GAAP) 4,035 4,252 1,202
Gross margin as a percentage of net sales 8.3% 9.1 % 2.7%
Adjustments:
Stock-based compensation expense 130 97 97
Plant start-up costs — — 319
Plant shut-down costs — — 141
Adjusted gross margin (non-GAAP) $ 4,165 $ 4,349 $ 1,759
Adjusted gross margin as a percentage of net sales 8.6% 9.4 % 4.0%

Adjusted Operating Income (Loss)
Non-GAAP
Solid Capacitors (Unaudited)
21
For the Quarters Ended
(Amounts in thousands) Mar 2017 Dec 2016 Mar 2016
Net sales $ 148,970 $ 141,555 $ 140,042
Operating income (loss) (U.S. GAAP) 38,941 37,264 34,538
Adjustments:
Stock-based compensation expense 261 211 181
Restructuring charges 767 (128) 360
Gain on sales and disposals of assets 76 67 507
Adjusted operating income (loss) (non-GAAP) $ 40,045 $ 37,414 $ 35,586
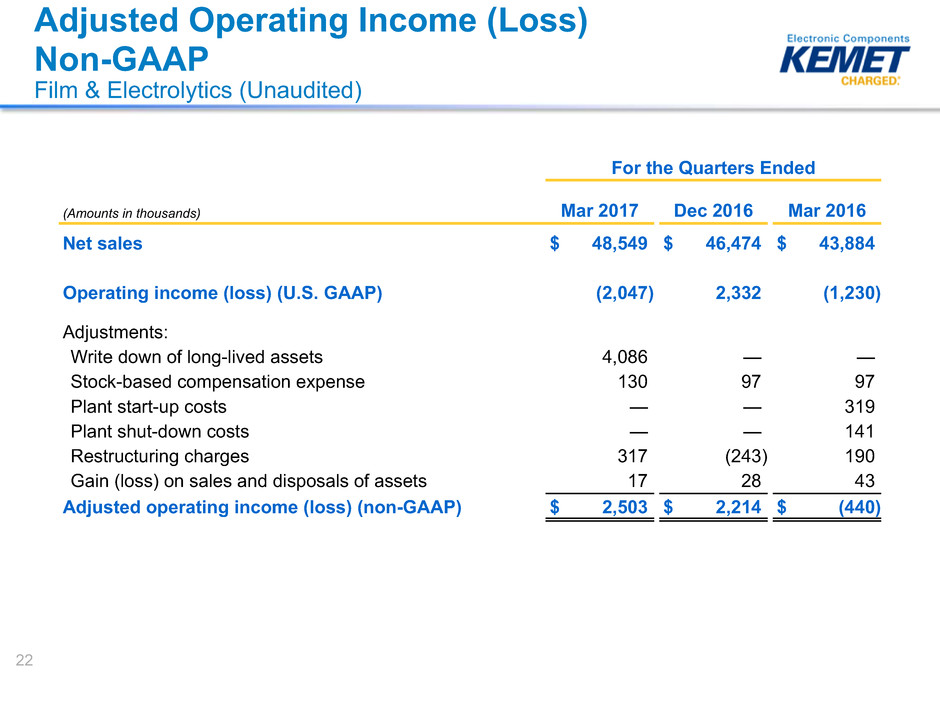
Adjusted Operating Income (Loss)
Non-GAAP
Film & Electrolytics (Unaudited)
22
For the Quarters Ended
(Amounts in thousands) Mar 2017 Dec 2016 Mar 2016
Net sales $ 48,549 $ 46,474 $ 43,884
Operating income (loss) (U.S. GAAP) (2,047) 2,332 (1,230)
Adjustments:
Write down of long-lived assets 4,086 — —
Stock-based compensation expense 130 97 97
Plant start-up costs — — 319
Plant shut-down costs — — 141
Restructuring charges 317 (243) 190
Gain (loss) on sales and disposals of assets 17 28 43
Adjusted operating income (loss) (non-GAAP) $ 2,503 $ 2,214 $ (440)

23
Adjusted EBITDA Reconciliation
Non-GAAP (Unaudited)
Quarter Ended LTM
(Amounts in thousands, except percentages) Mar 2014 Jun 2014 Sep 2014 Dec 2014 Dec 2014
Net Sales $ 215,821 $ 212,881 $ 215,293 $ 201,310 $ 845,305
Net income (loss) (U.S. GAAP) (14,447) (3,540) 6,330 2,914 (8,743)
Income tax expense (benefit) (2,811) 1,282 2,583 1,359 2,413
Interest expense, net 10,658 10,453 10,284 9,933 41,328
Depreciation and amortization 12,175 10,797 10,177 9,720 42,869
EBITDA (non-GAAP) 5,575 18,992 29,374 23,926 77,867
Excluding the following items (non-GAAP):
Change in value of NEC TOKIN options (1,777) (4,100) (6,600) (2,500) (14,977)
Equity (gain) loss from NEC TOKIN 4,127 1,675 (232) (1,367) 4,203
Restructuring charges 5,954 1,830 1,687 6,063 15,534
ERP integration costs / IT transition costs 837 895 409 671 2,812
Stock-based compensation expense 579 994 958 1,232 3,763
Legal expenses related to antitrust class actions — — — 409 409
Net foreign exchange (gain) loss (449) 527 (1,351) (1,257) (2,530)
NEC TOKIN investment-related expenses 618 580 487 485 2,170
Plant start-up costs 669 1,647 1,114 1,144 4,574
Plant shut-down costs 2,668 889 — — 3,557
Net (gain) loss on sales and disposals of assets (39) 365 (550) (574) (798)
(Income) loss from discontinued operations (103) (6,943) 1,400 164 (5,482)
(Gain) loss on early extinguishment of debt — — — (1,003) (1,003)
Professional fees related to financing activities — — — 1,142 1,142
Inventory revaluation — 2,676 (821) (927) 928
Write down of long-lived assets 1,118 — — — 1,118
Infrastructure tax 1,079 — — — 1,079
Adjusted EBITDA (non-GAAP) $ 20,856 $ 20,027 $ 25,875 $ 27,608 $ 94,366
Adjusted EBITDA Margin 9.7% 9.4% 12.0% 13.7% 11.2%

24
Adjusted EBITDA Reconciliation
Non-GAAP (Unaudited)
Quarter Ended LTM
(Amounts in thousands, except percentages) Sep 2014 Dec 2014 Mar 2015 Jun 2015 Jun 2015
Net Sales $ 215,293 $ 201,310 $ 193,708 $ 187,590 $ 797,901
Net income (loss) (U.S. GAAP) 6,330 2,914 (19,847) (37,050) (47,653)
Income tax expense (benefit) 2,583 1,359 3 (248) 3,697
Interest expense, net 10,284 9,933 10,016 10,010 40,243
Depreciation and amortization 10,177 9,720 10,074 9,917 39,888
EBITDA (non-GAAP) 29,374 23,926 246 (17,371) 36,175
Excluding the following items (non-GAAP):
Change in value of NEC TOKIN options (6,600) (2,500) 11,100 29,200 31,200
Equity (gain) loss from NEC TOKIN (232) (1,367) 2,093 (1,585) (1,091)
Restructuring charges 1,687 6,063 3,437 1,824 13,011
ERP integration costs / IT transition costs 409 671 1,273 4,369 6,722
Stock-based compensation expense 958 1,232 1,328 1,279 4,797
Legal expenses related to antitrust class actions — 409 435 718 1,562
Net foreign exchange (gain) loss (1,351) (1,257) (2,168) 1,049 (3,727)
NEC TOKIN investment-related expenses 487 485 226 224 1,422
Plant start-up costs 1,114 1,144 651 195 3,104
Net (gain) loss on sales and disposals of assets (550) (574) 538 (58) (644)
Pension plan adjustment — — — 312 312
(Income) loss from discontinued operations 1,400 164 — — 1,564
(Gain) loss on early extinguishment of debt — (1,003) — — (1,003)
Professional fees related to financing activities — 1,142 — — 1,142
Inventory revaluation (821) (927) (928) — (2,676)
Adjusted EBITDA (non-GAAP) $ 25,875 $ 27,608 $ 18,231 $ 20,156 $ 91,870
Adjusted EBITDA Margin 12.0% 13.7% 9.4% 10.7% 11.5%
25
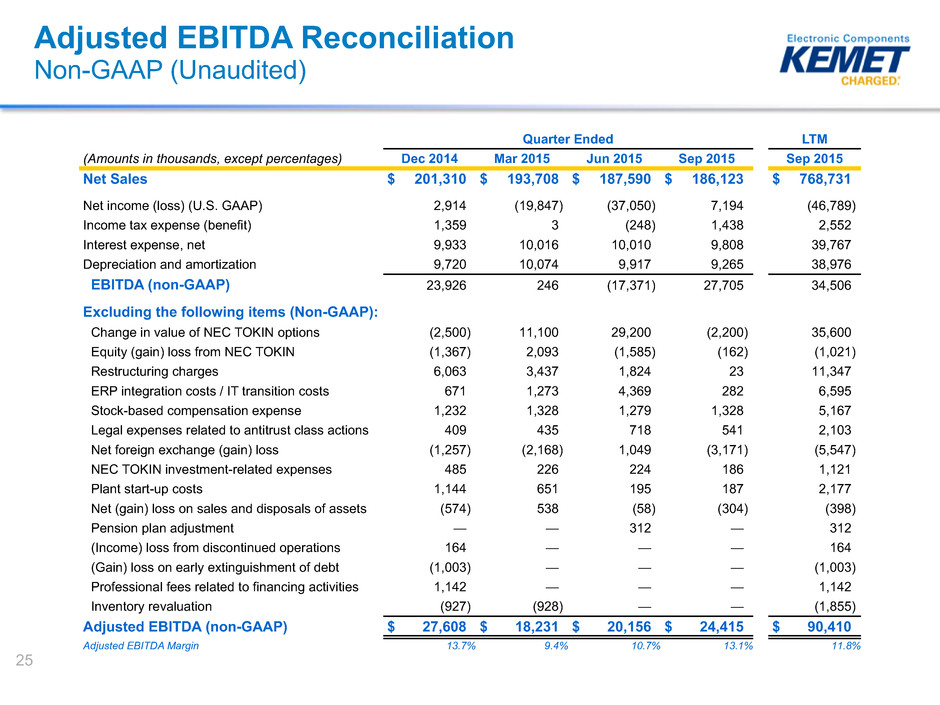
Adjusted EBITDA Reconciliation
Non-GAAP (Unaudited)
Quarter Ended LTM
(Amounts in thousands, except percentages) Dec 2014 Mar 2015 Jun 2015 Sep 2015 Sep 2015
Net Sales $ 201,310 $ 193,708 $ 187,590 $ 186,123 $ 768,731
Net income (loss) (U.S. GAAP) 2,914 (19,847) (37,050) 7,194 (46,789)
Income tax expense (benefit) 1,359 3 (248) 1,438 2,552
Interest expense, net 9,933 10,016 10,010 9,808 39,767
Depreciation and amortization 9,720 10,074 9,917 9,265 38,976
EBITDA (non-GAAP) 23,926 246 (17,371) 27,705 34,506
Excluding the following items (Non-GAAP):
Change in value of NEC TOKIN options (2,500) 11,100 29,200 (2,200) 35,600
Equity (gain) loss from NEC TOKIN (1,367) 2,093 (1,585) (162) (1,021)
Restructuring charges 6,063 3,437 1,824 23 11,347
ERP integration costs / IT transition costs 671 1,273 4,369 282 6,595
Stock-based compensation expense 1,232 1,328 1,279 1,328 5,167
Legal expenses related to antitrust class actions 409 435 718 541 2,103
Net foreign exchange (gain) loss (1,257) (2,168) 1,049 (3,171) (5,547)
NEC TOKIN investment-related expenses 485 226 224 186 1,121
Plant start-up costs 1,144 651 195 187 2,177
Net (gain) loss on sales and disposals of assets (574) 538 (58) (304) (398)
Pension plan adjustment — — 312 — 312
(Income) loss from discontinued operations 164 — — — 164
(Gain) loss on early extinguishment of debt (1,003) — — — (1,003)
Professional fees related to financing activities 1,142 — — — 1,142
Inventory revaluation (927) (928) — — (1,855)
Adjusted EBITDA (non-GAAP) $ 27,608 $ 18,231 $ 20,156 $ 24,415 $ 90,410
Adjusted EBITDA Margin 13.7% 9.4% 10.7% 13.1% 11.8%

26
Adjusted EBITDA Reconciliation
Non-GAAP (Unaudited)
Quarter Ended LTM
(Amounts in thousands, except percentages) Mar 2015 Jun 2015 Sep 2015 Dec 2015 Dec 2015
Net Sales $ 193,708 $ 187,590 $ 186,123 $ 177,184 $ 744,605
Net income (loss) (U.S. GAAP) (19,847) (37,050) 7,194 (8,600) (58,303)
Income tax expense (benefit) 3 (248) 1,438 2,760 3,953
Interest expense, net 10,016 10,010 9,808 9,848 39,682
Depreciation and amortization 10,074 9,917 9,265 9,674 38,930
EBITDA (non-GAAP) 246 (17,371) 27,705 13,682 24,262
Excluding the following items (Non-GAAP):
Change in value of NEC TOKIN options 11,100 29,200 (2,200) (700) 37,400
Equity (gain) loss from NEC TOKIN 2,093 (1,585) (162) 6,505 6,851
Restructuring charges 3,437 1,824 23 1,714 6,998
ERP integration costs / IT transition costs 1,273 4,369 282 167 6,091
Stock-based compensation expense 1,328 1,279 1,328 1,154 5,089
Legal expenses related to antitrust class actions 435 718 541 1,300 2,994
Net foreign exchange (gain) loss (2,168) 1,049 (3,171) (1,036) (5,326)
NEC TOKIN investment-related expenses 226 224 186 225 861
Plant start-up costs 651 195 187 160 1,193
Plant shut-down costs — — — 231 231
Net (gain) loss on sales and disposals of assets 538 (58) (304) 129 305
Pension plan adjustment — 312 — — 312
Inventory revaluation (928) — — — (928)
Adjusted EBITDA (non-GAAP) $ 18,231 $ 20,156 $ 24,415 $ 23,531 $ 86,333
Adjusted EBITDA Margin 9.4% 10.7% 13.1% 13.3% 11.6%

27
Adjusted EBITDA Reconciliation
Non-GAAP (Unaudited)
Quarter Ended LTM
(Amounts in thousands, except percentages) Sep 2015 Dec 2015 Mar 2016 Jun 2016 Jun 2016
Net Sales $ 186,123 $ 177,184 $ 183,926 $ 184,935 $ 732,168
Net income (loss) (U.S. GAAP) 7,194 (8,600) (15,173) (12,205) (28,784)
Income tax expense (benefit) 1,438 2,760 2,056 1,800 8,054
Interest expense, net 9,808 9,848 9,925 9,920 39,501
Depreciation and amortization 9,265 9,674 10,160 9,436 38,535
EBITDA (non-GAAP) 27,705 13,682 6,968 8,951 57,306
Excluding the following items (Non-GAAP):
Change in value of NEC TOKIN options (2,200) (700) — 12,000 9,100
Equity (gain) loss from NEC TOKIN (162) 6,505 11,648 (223) 17,768
Restructuring charges 23 1,714 617 688 3,042
ERP integration costs / IT transition costs 282 167 859 1,768 3,076
Stock-based compensation expense 1,328 1,154 1,013 1,228 4,723
Legal expenses related to antitrust class actions 541 1,300 482 1,175 3,498
Net foreign exchange (gain) loss (3,171) (1,036) 122 (1,920) (6,005)
NEC TOKIN investment-related expenses 186 225 265 206 882
Plant start-up costs 187 160 319 308 974
Plant shut-down costs — 231 141 — 372
Net (gain) loss on sales and disposals of assets (304) 129 608 91 524
Adjusted EBITDA (non-GAAP) $ 24,415 $ 23,531 $ 23,042 $ 24,272 $ 95,260
Adjusted EBITDA Margin 13.1% 13.3% 12.5% 13.1% 13.0%

28
Adjusted EBITDA Reconciliation
Non-GAAP (Unaudited)
Quarter Ended LTM
(Amounts in thousands, except percentages) Dec 2015 Mar 2016 Jun 2016 Sep 2016 Sep 2016
Net Sales $ 177,184 $ 183,926 $ 184,935 $ 187,308 $ 733,353
Net income (loss) (U.S. GAAP) (8,600) (15,173) (12,205) (4,998) (40,976)
Income tax expense (benefit) 2,760 2,056 1,800 830 7,446
Interest expense, net 9,848 9,925 9,920 9,904 39,597
Depreciation and amortization 9,674 10,160 9,436 9,440 38,710
EBITDA (non-GAAP) 13,682 6,968 8,951 15,176 44,777
Excluding the following items (non-GAAP):
Change in value of NEC TOKIN options (700) — 12,000 (1,600) 9,700
Equity (gain) loss from NEC TOKIN 6,505 11,648 (223) (181) 17,749
Restructuring charges 1,714 617 688 3,998 7,017
ERP integration costs / IT transition costs 167 859 1,768 1,783 4,577
Stock-based compensation expense 1,154 1,013 1,228 1,104 4,499
Legal expenses related to antitrust class actions 1,300 482 1,175 766 3,723
Net foreign exchange (gain) loss (1,036) 122 (1,920) (724) (3,558)
NEC TOKIN investment-related expenses 225 265 206 194 890
Plant start-up costs 160 319 308 119 906
Plant shut-down costs 231 141 — — 372
Net (gain) loss on sales and disposals of assets 129 608 91 84 912
Write down of long-lived assets — — — 6,193 6,193
Adjusted EBITDA (non-GAAP) $ 23,531 $ 23,042 $ 24,272 $ 26,912 $ 97,757
Adjusted EBITDA Margin 13.3% 12.5% 13.1% 14.4% 13.3%

29
Adjusted EBITDA Reconciliation
Non-GAAP (Unaudited)
Quarter Ended LTM
(Amounts in thousands, except percentages) Mar 2016 Jun 2016 Sep 2016 Dec 2016 Dec 2016
Net Sales $ 183,926 $ 184,935 $ 187,308 $ 188,029 $ 744,198
Net income (loss) (U.S. GAAP) (15,173) (12,205) (4,998) 12,278 (20,098)
Income tax expense (benefit) 2,056 1,800 830 1,810 6,496
Interest expense, net 9,925 9,920 9,904 9,913 39,662
Depreciation and amortization 10,160 9,436 9,440 9,095 38,131
EBITDA (non-GAAP) 6,968 8,951 15,176 33,096 64,191
Excluding the following items (non-GAAP):
Change in value of NEC TOKIN options — 12,000 (1,600) (6,900) 3,500
Equity (gain) loss from NEC TOKIN 11,648 (223) (181) 133 11,377
Restructuring charges 617 688 3,998 (369) 4,934
ERP integration costs / IT transition costs 859 1,768 1,783 1,734 6,144
Stock-based compensation expense 1,013 1,228 1,104 1,139 4,484
Legal expenses related to antitrust class actions 482 1,175 766 293 2,716
Net foreign exchange (gain) loss 122 (1,920) (724) (2,621) (5,143)
NEC TOKIN investment-related expenses 265 206 194 204 869
Plant start-up costs 319 308 119 — 746
Plant shut-down costs 141 — — — 141
Net (gain) loss on sales and disposals of assets 608 91 84 132 915
Write down of long-lived assets — — 6,193 — 6,193
Adjusted EBITDA (non-GAAP) $ 23,042 $ 24,272 $ 26,912 $ 26,841 $ 101,067
Adjusted EBITDA Margin 12.5% 13.1% 14.4% 14.3% 13.6%
30
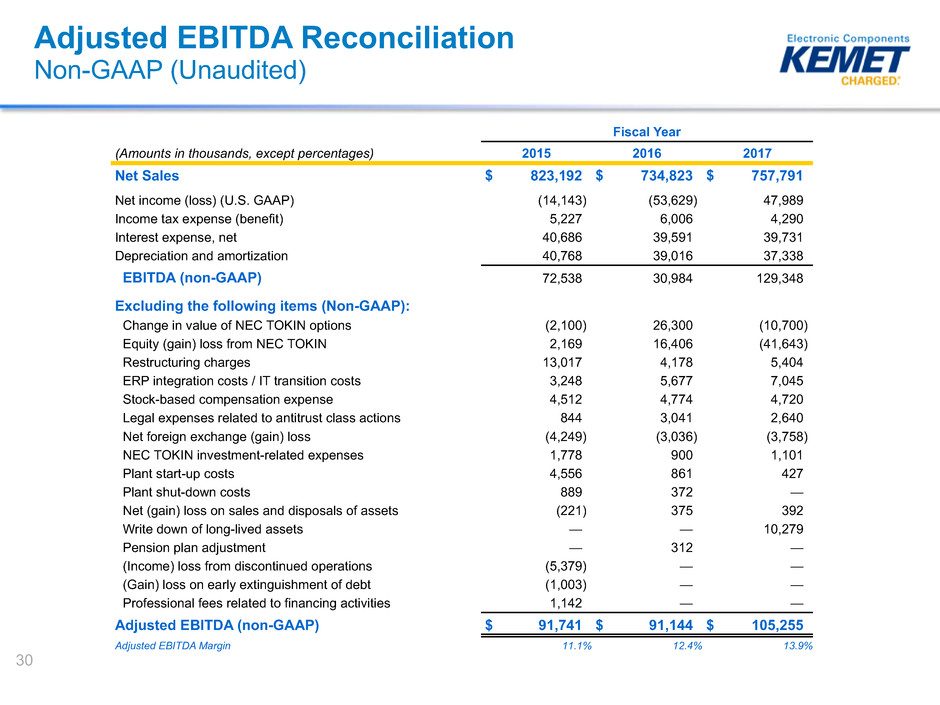
Adjusted EBITDA Reconciliation
Non-GAAP (Unaudited)
Fiscal Year
(Amounts in thousands, except percentages) 2015 2016 2017
Net Sales $ 823,192 $ 734,823 $ 757,791
Net income (loss) (U.S. GAAP) (14,143) (53,629) 47,989
Income tax expense (benefit) 5,227 6,006 4,290
Interest expense, net 40,686 39,591 39,731
Depreciation and amortization 40,768 39,016 37,338
EBITDA (non-GAAP) 72,538 30,984 129,348
Excluding the following items (Non-GAAP):
Change in value of NEC TOKIN options (2,100) 26,300 (10,700)
Equity (gain) loss from NEC TOKIN 2,169 16,406 (41,643)
Restructuring charges 13,017 4,178 5,404
ERP integration costs / IT transition costs 3,248 5,677 7,045
Stock-based compensation expense 4,512 4,774 4,720
Legal expenses related to antitrust class actions 844 3,041 2,640
Net foreign exchange (gain) loss (4,249) (3,036) (3,758)
NEC TOKIN investment-related expenses 1,778 900 1,101
Plant start-up costs 4,556 861 427
Plant shut-down costs 889 372 —
Net (gain) loss on sales and disposals of assets (221) 375 392
Write down of long-lived assets — — 10,279
Pension plan adjustment — 312 —
(Income) loss from discontinued operations (5,379) — —
(Gain) loss on early extinguishment of debt (1,003) — —
Professional fees related to financing activities 1,142 — —
Adjusted EBITDA (non-GAAP) $ 91,741 $ 91,144 $ 105,255
Adjusted EBITDA Margin 11.1% 12.4% 13.9%
Non-GAAP Financial Measures
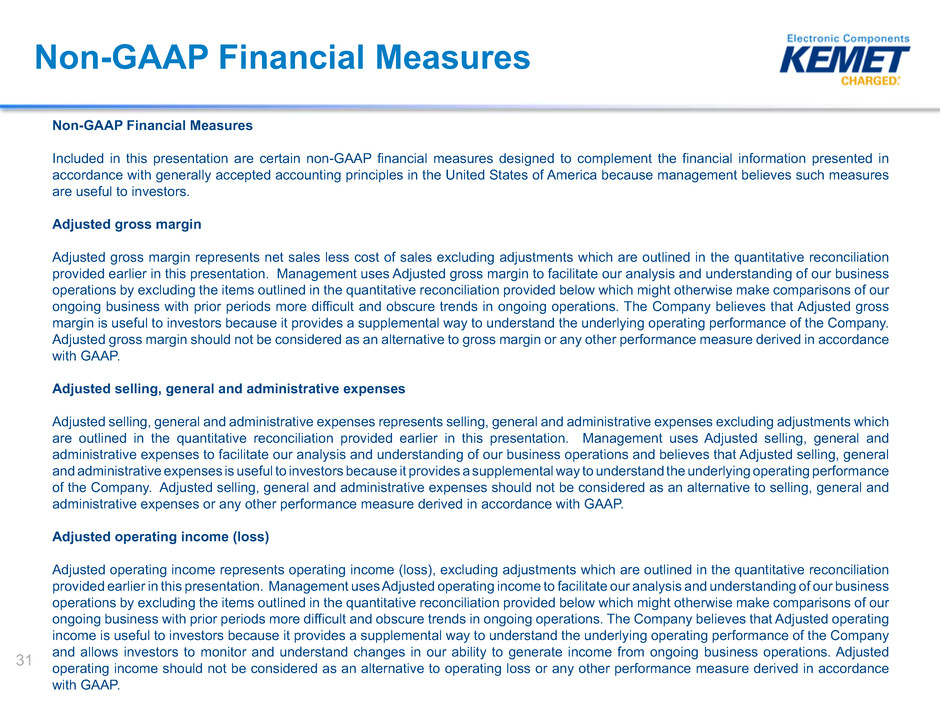
Non-GAAP Financial Measures
Included in this presentation are certain non-GAAP financial measures designed to complement the financial information presented in
accordance with generally accepted accounting principles in the United States of America because management believes such measures
are useful to investors.
Adjusted gross margin
Adjusted gross margin represents net sales less cost of sales excluding adjustments which are outlined in the quantitative reconciliation
provided earlier in this presentation. Management uses Adjusted gross margin to facilitate our analysis and understanding of our business
operations by excluding the items outlined in the quantitative reconciliation provided below which might otherwise make comparisons of our
ongoing business with prior periods more difficult and obscure trends in ongoing operations. The Company believes that Adjusted gross
margin is useful to investors because it provides a supplemental way to understand the underlying operating performance of the Company.
Adjusted gross margin should not be considered as an alternative to gross margin or any other performance measure derived in accordance
with GAAP.
Adjusted selling, general and administrative expenses
Adjusted selling, general and administrative expenses represents selling, general and administrative expenses excluding adjustments which
are outlined in the quantitative reconciliation provided earlier in this presentation. Management uses Adjusted selling, general and
administrative expenses to facilitate our analysis and understanding of our business operations and believes that Adjusted selling, general
and administrative expenses is useful to investors because it provides a supplemental way to understand the underlying operating performance
of the Company. Adjusted selling, general and administrative expenses should not be considered as an alternative to selling, general and
administrative expenses or any other performance measure derived in accordance with GAAP.
Adjusted operating income (loss)
Adjusted operating income represents operating income (loss), excluding adjustments which are outlined in the quantitative reconciliation
provided earlier in this presentation. Management uses Adjusted operating income to facilitate our analysis and understanding of our business
operations by excluding the items outlined in the quantitative reconciliation provided below which might otherwise make comparisons of our
ongoing business with prior periods more difficult and obscure trends in ongoing operations. The Company believes that Adjusted operating
income is useful to investors because it provides a supplemental way to understand the underlying operating performance of the Company
and allows investors to monitor and understand changes in our ability to generate income from ongoing business operations. Adjusted
operating income should not be considered as an alternative to operating loss or any other performance measure derived in accordance
with GAAP.
31

Non-GAAP Financial Measures
Continued
Adjusted net income (loss) and Adjusted EPS
Adjusted net income (loss) and Adjusted EPS represent net income (loss) and EPS, excluding adjustments which are more specifically
outlined in the quantitative reconciliation provided earlier in this presentation. Management uses Adjusted net income and Adjusted
EPS to evaluate the Company's operating performance by excluding the items outlined in the quantitative reconciliation provided below
which might otherwise make comparisons of our ongoing business with prior periods more difficult and obscure trends in ongoing
operations. The Company believes that Adjusted net income (loss) and Adjusted EPS are useful to investors because they provide a
supplemental way to possibly better understand the underlying operating performance of the Company and allows investors to monitor
and understand changes in our ability to generate income from ongoing business operations. Adjusted net income (loss) and Adjusted
EPS should not be considered as alternatives to net income, operating income or any other performance measures derived in
accordance with GAAP.
Adjusted EBITDA
Adjusted EBITDA represents net loss before income tax expense (benefit), interest expense, net, and depreciation and amortization
expense, excluding adjustments which are more specifically outlined in the quantitative reconciliation provided earlier in this
presentation. We present Adjusted EBITDA as a supplemental measure of our performance and ability to service debt. We also
present Adjusted EBITDA because we believe such measure is frequently used by securities analysts, investors and other interested
parties in the evaluation of companies in our industry.
We believe Adjusted EBITDA is an appropriate supplemental measure of debt service capacity, because cash expenditures on interest
are, by definition, available to pay interest, and tax expense is inversely correlated to interest expense because tax expense goes
down as deductible interest expense goes up; depreciation and amortization are non-cash charges. The other items excluded from
Adjusted EBITDA are excluded in order to better reflect our continuing operations.
In evaluating Adjusted EBITDA, you should be aware that in the future we may incur expenses similar to the adjustments in this
presentation. Our presentation of Adjusted EBITDA should not be construed as an inference that our future results will be unaffected
by these types of adjustments. Adjusted EBITDA is not a measurement of our financial performance under GAAP and should not be
considered as an alternative to net income, operating income or any other performance measures derived in accordance with GAAP
or as an alternative to cash flow from operating activities as a measure of our liquidity.
32

Non-GAAP Financial Measures
Continued
Our Adjusted EBITDA measure has limitations as an analytical tool, and you should not consider it in isolation or as a
substitute for analysis of our results as reported under GAAP. Some of these limitations are:
• it does not reflect our cash expenditures, future requirements for capital expenditures or contractual commitments;
• it does not reflect changes in, or cash requirements for, our working capital needs;
• it does not reflect the significant interest expense or the cash requirements necessary to service interest or principal
payment on our debt;
• although depreciation and amortization are non-cash charges, the assets being depreciated and amortized will often
have to be replaced in the future, and our Adjusted EBITDA measure does not reflect any cash requirements for such
replacements;
• it is not adjusted for all non-cash income or expense items that are reflected in our statements of cash flows;
• it does not reflect the impact of earnings or charges resulting from matters we consider not to be indicative of our
ongoing operations;
• it does not reflect limitations on or costs related to transferring earnings from our subsidiaries to us; and
• other companies in our industry may calculate this measure differently than we do, limiting its usefulness as a
comparative measure.
Because of these limitations, Adjusted EBITDA should not be considered as a measure of discretionary cash available
to us to invest in the growth of our business or as a measure of cash that will be available to us to meet our obligations.
You should compensate for these limitations by relying primarily on our GAAP results and using Adjusted EBITDA only
supplementally.
33
