Attached files
| file | filename |
|---|---|
| EX-32.2 - EXHIBIT 32.2 - HECLA MINING CO/DE/ | ex32-2.htm |
| EX-32.1 - EXHIBIT 32.1 - HECLA MINING CO/DE/ | ex32-1.htm |
| EX-31.2 - EXHIBIT 31.2 - HECLA MINING CO/DE/ | ex31-2.htm |
| EX-31.1 - EXHIBIT 31.1 - HECLA MINING CO/DE/ | ex31-1.htm |
UNITED STATES
SECURITIES AND EXCHANGE COMMISSION
Washington, D.C. 20549
FORM 10-Q/A
Amendment No. 1
[X] QUARTERLY REPORT PURSUANT TO SECTION 13 OR 15(d) OF THE
SECURITIES EXCHANGE ACT OF 1934
For the quarterly period ended March 31, 2017
|
Commission file number |
1-8491 |
HECLA MINING COMPANY
(Exact name of registrant as specified in its charter)
|
Delaware |
77-0664171 |
|||
|
(State or other jurisdiction of |
(I.R.S. Employer |
|||
|
incorporation or organization) |
Identification No.) |
|||
|
6500 Mineral Drive, Suite 200 |
||||
|
Coeur d'Alene, Idaho |
83815-9408 |
|||
|
(Address of principal executive offices) |
(Zip Code) |
|||
|
208-769-4100 | ||||
|
(Registrant's telephone number, including area code) | ||||
Indicate by check mark whether the registrant: (1) has filed all reports required to be filed by Section 13 or 15(d) of the Securities Exchange Act of 1934 during the preceding 12 months (or for such shorter period that the registrant was required to file such reports), and (2) has been subject to such filing requirements for the past 90 days.
Yes XX . No .
Indicate by check mark whether the registrant has submitted electronically and posted on its corporate Web site, if any, every Interactive Data File required to be submitted and posted pursuant to Rule 405 of Regulation S-T (§ 232.405 of this chapter) during the preceding 12 months (or for such shorter period that the registrant was required to submit and post such files).
Yes XX . No___.
Indicate by check mark whether the registrant is a large accelerated filer, an accelerated filer, a non-accelerated filer, a smaller reporting company, or an emerging growth company. See definitions of “large accelerated filer,” “accelerated filer” “smaller reporting company,” and "emerging growth company" in Rule 12b-2 of the Exchange Act (check one):
|
Large Accelerated Filer XX. |
|
|
|
Accelerated Filer . |
| Non-Accelerated Filer . (Do not check if a smaller reporting company) | Smaller Reporting Company . | |||
|
Emerging growth company . |
|
|
|
|
If an emerging growth company, indicate by check mark if the registrant has elected not to use the extended transition period for complying with any new or revised financial accounting standards provided pursuant to Section 13(a) of the Exchange Act. .
Indicate by check mark whether the registrant is a shell company (as defined in Rule 12b-2 of the Exchange Act).
Yes . No XX.
Indicate the number of shares outstanding of each of the issuer’s classes of common stock, as of the latest practicable date.
|
Class |
Shares Outstanding May 4, 2017 | |
|
Common stock, par value $0.25 per share |
395,992,936 |
EXPLANATORY NOTE
This Amendment No. 1 on Form 10-Q/A is being filed to amend the Hecla Mining Company Quarterly Report on Form 10-Q for the period ended March 31, 2017 (“Form 10-Q”), as filed with the Securities and Exchange Commission on May 8, 2017, in order to correct data input errors contained under “Item 2. Management's Discussion and Analysis of Financial Condition and Results of Operations - Financial Liquidity and Capital Resources” in the last full paragraph on page 46. That paragraph is amended and restated as follows (with changes appearing in the last three sentences only):
|
Original Disclosure |
Amended and Restated Disclosure | |
|
Cash provided by operating activities in the first quarter of 2017 increased by $19.6 million compared to the same period in 2016. The increase was primarily due to working capital and other operating asset and liability changes which resulted in a net cash flow increase of $21.7 million in the first three months of 2017 compared to a net decrease in cash flows of $21.5 million in the 2016 period. The $0.2 million variance in working capital changes is attributed to lower accounts receivable due to the timing of sales at Greens Creek and Casa Berardi and higher payroll accruals due to the timing of payment of incentive compensation related to prior year performance. In addition, income, as adjusted for non-cash items, was higher by $19.5 million, due primarily to higher metals prices. |
Cash provided by operating activities in the first quarter of 2017 increased by $19.6 million compared to the same period in 2016. The increase was primarily due to working capital and other operating asset and liability changes which resulted in a net cash flow decrease of $7.4 million in the first three months of 2017 compared to a net decrease in cash flows of $21.5 million in the 2016 period. The $14.1 million variance in working capital changes is attributed to lower accounts receivable due to the timing of sales at Greens Creek and Casa Berardi and higher payroll accruals due to the timing of payment of incentive compensation related to prior year performance. In addition, income, as adjusted for non-cash items, was higher by $5.5 million, due primarily to higher metals prices. |
Pursuant to Rule 12b-15 promulgated under the Securities Exchange Act of 1934, as amended, we have repeated the entire text of Item 2 of the Form 10-Q in this Amendment, however, there have been no changes to the text of such item other than the changes described above and reflected in the paragraph under the heading “Amended and Restated Disclosure.”
This Amendment amends only the item of the Form 10-Q specified above and amends that item solely to reflect the changes described above. This Amendment does not reflect events occurring after May 8, 2017.
Item 2. Management's Discussion and Analysis of Financial Condition and Results of Operations
Certain statements contained in this Form 10-Q, including in Management’s Discussion and Analysis of Financial Condition and Results of Operations and Quantitative and Qualitative Disclosure About Market Risk, are intended to be covered by the safe harbor provided for under Section 27A of the Securities Act of 1933, as amended, and Section 21E of the Securities Exchange Act of 1934, as amended. Our forward-looking statements include our current expectations and projections about future results, performance, results of litigation, prospects and opportunities, including reserves and other mineralization. We have tried to identify these forward-looking statements by using words such as “may,” “will,” “expect,” “anticipate,” “believe,” “intend,” “feel,” “plan,” “estimate,” “project,” “forecast” and similar expressions. These forward-looking statements are based on information currently available to us and are expressed in good faith and believed to have a reasonable basis. However, our forward-looking statements are subject to a number of risks, uncertainties and other factors that could cause our actual results, performance, prospects or opportunities to differ materially from those expressed in, or implied by, these forward-looking statements.
These risks, uncertainties and other factors include, but are not limited to, those set forth under Part I, Item 1A – Business – Risk Factors in our annual report filed on Form 10-K for the year ended December 31, 2016. Given these risks and uncertainties, readers are cautioned not to place undue reliance on our forward-looking statements. All subsequent written and oral forward-looking statements attributable to Hecla Mining Company or to persons acting on our behalf are expressly qualified in their entirety by these cautionary statements. Except as required by federal securities laws, we do not intend to update or revise any forward-looking statements, whether as a result of new information, future events or otherwise.
Overview
Hecla Mining Company and our subsidiaries have provided precious and base metals to the U.S. and worldwide since 1891. We discover, acquire, develop, and produce silver, gold, lead and zinc.
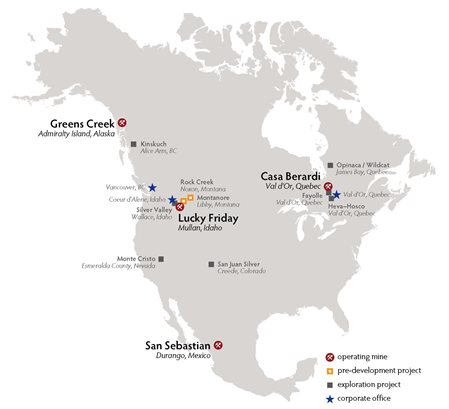
We produce lead, zinc and bulk concentrates, which we sell to custom smelters and brokers, and unrefined precipitate and bullion bars (doré) containing gold and silver, which are further refined before sale to precious metals traders. We are organized into four segments that encompass our operating and development units: Greens Creek, Lucky Friday, Casa Berardi, and San Sebastian. The map below shows the locations of our operating units and our exploration and pre-development projects, as well as our corporate offices located in Coeur d'Alene, Idaho and Vancouver, British Columbia.
|
|
Our current business strategy is to focus our financial and human resources in the following areas:
|
• |
operating our properties safely, in an environmentally responsible manner, and cost-effectively; |
|
• |
continue optimizing and improving operations at our Greens Creek, Lucky Friday, Casa Berardi, and San Sebastian units; |
|
• |
expanding our proven and probable reserves and production capacity at our operating properties; |
|
• |
conducting our business with financial stewardship to preserve our financial position in varying metals price environments; |
|
• |
advance permitting of the Rock Creek and Montanore projects. We acquired Rock Creek as part of the acquisition of Revett Mining Company, Inc. ("Revett") in June 2015, and we acquired Montanore through the acquisition of Mines Management, Inc. ("Mines Management") in September 2016; |
|
• |
maintaining and investing in exploration and pre-development projects in the vicinities of six mining districts and projects we believe to be under-explored and under-invested: North Idaho's Silver Valley in the historic Coeur d'Alene Mining District; our Greens Creek unit on Alaska's Admiralty Island located near Juneau; the silver-producing district near Durango, Mexico; the Abitibi region of northwestern Quebec, Canada; the Rock Creek and Montanore projects in northwestern Montana; and the Creede district of Southwestern Colorado; and |
|
• |
continuing to seek opportunities to acquire and invest in mining properties and companies. |
A number of key factors may impact the execution of our strategy, including regulatory issues and metals prices. Metals prices can be very volatile. As discussed in the Critical Accounting Estimates section below, metals prices are influenced by a number of factors beyond our control. Average market prices of silver, gold, lead, and zinc in the first three months of 2017 were higher than their levels from the comparable period last year, as illustrated by the table in Results of Operations below. While we believe current global economic and industrial trends could result in continued demand for the metals we produce, prices have been volatile and there can be no assurance that current prices will continue.
The total principal amount of our Senior Notes due May 1, 2021 is $506.5 million and they bear interest at a rate of 6.875% per year. The net proceeds from the Senior Notes were primarily used for the acquisition of Aurizon in June 2013 (see Note 9 of Notes to Condensed Consolidated Financial Statements (Unaudited)). As discussed in the Financial Liquidity and Capital Resources section below, we believe that we will be able to meet the obligations associated with the Senior Notes; however, a number of factors could impact our ability to meet the debt obligations and fund our other projects.
On June 15, 2015, we completed the acquisition of Revett, giving us 100% ownership of the Rock Creek project, a significant undeveloped silver and copper deposit in northwestern Montana. In addition, on September 13, 2016, we completed the acquisition of Mines Management, giving us 100% ownership of the Montanore project, another significant undeveloped silver and copper deposit located approximately 10 miles from our Rock Creek project. Development of Rock Creek and Montanore has been challenged by conservation groups at various times, and there can be no assurance that we will be able to obtain the permitting required to develop these projects. In Part I, Item 1A. Risk Factors in our annual report filed on Form 10-K for the year ended December 31, 2016, see Legal challenges could prevent the Rock Creek or Montanore projects from ever being developed for more information.
As further discussed in the Lucky Friday Segment section below, the union employees at Lucky Friday have been on strike since March 13, 2017, and production at Lucky Friday has been suspended since that time. We cannot predict how long the strike will last or whether an agreement will be reached. As a result of the strike or other related events, operations at Lucky Friday could continue to be disrupted, which could adversely affect our financial condition and results of operations.
During the third quarter of 2015, we made a development decision to mine near surface, high grade portions of silver and gold deposits at our San Sebastian project in Mexico. Ore production commenced in the fourth quarter of 2015 and has continued since that time. In addition, work began in the first quarter of 2017 to develop and rehabilitate underground access which would allow us to mine deeper portions of the deposits at San Sebastian. See the San Sebastian Segment section below for more information. We have generated positive cash flows at San Sebastian since the start of production there, and we believe that will continue through 2018. However, our ability to generate positive cash flows at San Sebastian may be impacted by changes in estimated costs, precious metals prices, or other factors, and there can be no assurance that we will be able to develop and operate San Sebastian as anticipated.
We strive to achieve excellent mine safety and health performance. We seek to implement this goal by: training employees in safe work practices; establishing, following and improving safety standards; investigating accidents, incidents and losses to avoid recurrence; involving employees in the establishment of safety standards; and participating in the National Mining Association's CORESafety program. We attempt to implement reasonable best practices with respect to mine safety and emergency preparedness. We work with the Mine Safety and Health Administration ("MSHA") to address issues outlined in its investigations and inspections and continue to evaluate our safety practices.
Another challenge for us is the risk associated with environmental litigation and ongoing reclamation activities. As described in Part I, Item 1A. Risk Factors of our annual report filed on Form 10-K for the year ended December 31, 2016 and Note 4 of Notes to Condensed Consolidated Financial Statements (Unaudited), it is possible that our estimate of these liabilities (and our ability to estimate liabilities in general) may change in the future, affecting our strategic plans. We are involved in various environmental legal matters and the estimate of our environmental liabilities, liquidity needs, or strategic plans may be significantly impacted as a result of these matters or new matters that may arise. We strive to ensure that our activities are conducted in compliance with applicable laws and regulations and attempt to resolve environmental litigation on as favorable terms as possible.
Results of Operations
Sales of products by metal for the three-month periods ended March 31, 2017 and 2016 were as follows:
|
Three Months Ended |
||||||||
|
(in thousands) |
2017 |
2016 |
||||||
|
Silver |
$ | 51,357 | $ | 56,670 | ||||
|
Gold |
62,701 | 54,892 | ||||||
|
Lead |
13,619 | 13,724 | ||||||
|
Zinc |
29,865 | 22,525 | ||||||
|
Less: Smelter and refining charges |
(14,998 |
) |
(16,794 |
) | ||||
|
Sales of products |
$ | 142,544 | $ | 131,017 | ||||
For the first quarter of 2017, we recorded income applicable to common stockholders of $26.7 million ($0.07 per basic common share), compared to a loss of $0.8 million ($0.00 per basic common share) during the first quarter of 2016. The following factors contributed to the results for the first three months of 2017 compared to the same period in 2016:
|
• |
An income tax benefit of $29.1 million in first quarter of 2017 compared to an income tax provision of $1.7 million in the first quarter of 2016. The benefit in the 2017 period is primarily the result of a change in income tax position relating to the timing of deduction for #4 Shaft development costs at Lucky Friday, as further discussed in Corporate Matters below. |
|
• |
Higher average silver, gold, lead and zinc prices for the first quarter of 2017 compared to the same period in 2016. |
|
Three months ended March 31, |
|||||||||
|
2017 |
2016 |
||||||||
|
Silver – |
London PM Fix ($/ounce) |
$ | 17.42 | $ | 14.84 | ||||
|
Realized price per ounce |
$ | 17.90 | $ | 14.93 | |||||
|
Gold – |
London PM Fix ($/ounce) |
$ | 1,219 | $ | 1,181 | ||||
|
Realized price per ounce |
$ | 1,221 | $ | 1,187 | |||||
|
Lead – |
LME Final Cash Buyer ($/pound) |
$ | 1.03 | $ | 0.79 | ||||
|
Realized price per pound |
$ | 1.06 | $ | 0.78 | |||||
|
Zinc – |
LME Final Cash Buyer ($/pound) |
$ | 1.26 | $ | 0.76 | ||||
|
Realized price per pound |
$ | 1.26 | $ | 0.79 | |||||
Average realized prices differ from average market prices primarily because concentrate sales are generally recorded as revenues at the time of shipment at forward prices for the estimated month of settlement, which differ from average market prices. Due to the time elapsed between shipment of concentrates and final settlement with customers, we must estimate the prices at which sales of our metals will be settled. Previously recorded sales are adjusted to estimated settlement metal prices each period through final settlement. For the first quarter of 2017, we recorded net positive price adjustments to provisional settlements of $0.6 million compared to net positive price adjustments to provisional settlements of $0.5 million in the first quarter of 2016. The price adjustments related to silver, gold, zinc and lead contained in our concentrate shipments were largely offset by gains and losses on forward contracts for those metals for each period. See Note 11 of Notes to Condensed Consolidated Financial Statements (Unaudited) for more information. The gains and losses on these contracts are included in revenues and impact the realized prices for silver, gold, lead and zinc. Realized prices are calculated by dividing gross revenues for each metal (which include the price adjustments and gains and losses on the forward contracts discussed above) by the payable quantities of each metal included in concentrate and doré shipped during the period.
|
• |
A net foreign exchange loss in the first quarter of 2017 of $2.3 million versus a net loss of $8.2 million in the same period of 2016, with the variance primarily related to the impact of smaller decreases in the CAD-to-USD exchange rate on the remeasurement of our net monetary liabilities in Quebec. During the first quarter of 2017, the applicable CAD-to-USD exchange rate decreased from 1.3426 to 1.3310, compared to a decrease in the rate from 1.4006 to 1.2987 during the first quarter of 2016. |
|
• |
Increased gross profit at our Greens Creek and Lucky Friday units in the first quarter of 2017 of $5.8 million and $2.7 million, respectively, compared to the first quarter of 2016. This was partially offset by decreases in gross profit of $0.7 million and $3.8 million, respectively, in the first quarter of 2017 at our Casa Berardi and San Sebastian units. See The Greens Creek Segment, The Lucky Friday Segment, The Casa Berardi Segment, and The San Sebastian Segment sections below. |
|
• |
Unrealized gains on investments of $0.3 million in the first quarter of 2017 compared to losses of $0.7 million in the first quarter of 2016. The losses in 2016 were the result of impairments of certain investments being deemed to be other-than-temporary. |
|
• |
Exploration and pre-development expense increased by $2.4 million in the first quarter of 2017 compared to the first quarter of 2016. In 2017, we have continued exploration work at our Greens Creek, San Sebastian, and Casa Berardi units, and at our other projects in Quebec, Canada. "Pre-development expense" is defined as costs incurred in the exploration stage that may ultimately benefit production, such as underground ramp development, which are expensed due to the lack of proven and probable reserves. Pre-development expense of $1.3 million in the first quarter of 2017 was related to advancement of our Montanore and Rock Creek projects. |
|
• |
Higher interest expense by $2.8 million in the first quarter of 2017 compared to the same period of 2016. Interest expense in the first quarters of 2017 and 2016 was net of $0.9 million and $3.8 million, respectively, in capitalized interest primarily related to the #4 Shaft project, with the decrease due to completion of #4 Shaft in January 2017. |
|
• |
A loss on base metal derivatives contracts of $7.8 million in the first quarter of 2017, with no net activity on base metal derivative contracts in the first quarter of 2016. See Note 11 of Notes to Condensed Consolidated Financial Statements (Unaudited) for more information. |
The Greens Creek Segment
|
Dollars are in thousands (except per ounce and per ton amounts) |
Three months ended March 31, |
|||||||
|
2017 |
2016 |
|||||||
|
Sales |
$ | 58,850 | $ | 53,882 | ||||
|
Cost of sales and other direct production costs |
(30,664 |
) |
(31,252 |
) | ||||
|
Depreciation, depletion and amortization |
(13,332 |
) |
(13,601 |
) | ||||
|
Gross profit |
$ | 14,854 | $ | 9,029 | ||||
|
Tons of ore milled |
197,129 | 204,968 | ||||||
|
Production: |
||||||||
|
Silver (ounces) |
1,929,297 | 2,458,276 | ||||||
|
Gold (ounces) |
14,022 | 15,981 | ||||||
|
Zinc (tons) |
13,406 | 14,611 | ||||||
|
Lead (tons) |
4,809 | 5,087 | ||||||
|
Payable metal quantities sold: |
||||||||
|
Silver (ounces) |
1,439,461 | 1,901,143 | ||||||
|
Gold (ounces) |
10,290 | 11,420 | ||||||
|
Zinc (tons) |
10,159 | 12,412 | ||||||
|
Lead (tons) |
2,830 | 3,244 | ||||||
|
Ore grades: |
||||||||
|
Silver ounces per ton |
12.71 | 15.17 | ||||||
|
Gold ounces per ton |
0.10 | 0.11 | ||||||
|
Zinc percent |
7.82 | 8.13 | ||||||
|
Lead percent |
3.06 | 3.05 | ||||||
|
Mining cost per ton |
$ | 71.41 | $ | 66.96 | ||||
|
Milling cost per ton |
$ | 33.72 | $ | 30.99 | ||||
|
Cash Cost, After By-product Credits, per Silver Ounce (1) |
$ | 0.65 | $ | 3.96 | ||||
|
All-In Sustaining Cost ("AISC"), After By-product Credits, per Silver Ounce (1) |
$ | 3.86 | $ | 7.03 | ||||
|
(1) |
A reconciliation of these non-GAAP measures to cost of sales and other direct production costs and depreciation, depletion and amortization, the most comparable GAAP measure, can be found below in Reconciliation of Cost of Sales and Other Direct Production Costs and Depreciation, Depletion and Amortization (GAAP) to Cash Cost, Before By-product Credits and Cash Cost, After By-product Credits (non-GAAP) and All-In Sustaining Cost, Before By-product Credits and All-In Sustaining Cost, After By-product Credits (non-GAAP). |
The $5.8 million increase in gross profit during the first quarter of 2017 compared to the same 2016 period was the result of higher average prices for silver, gold, zinc and lead, impacting sales by approximately $14.4 million. These factors were partially offset by lower sales volume due to the timing of shipments, and decreased ore production, grades and mill recoveries. In addition, gross profit at Greens Creek was impacted by positive price adjustments to revenues of $0.5 million for the first quarter of 2017 compared to positive price adjustments of $0.4 million for the first quarter of 2016. Price adjustments to revenues result from changes in metals prices between transfer of title of concentrates to buyers and final settlements during the period. The price adjustments related to silver, gold, zinc and lead contained in concentrate shipments were net of gains and losses on forward contracts for those metals for each period. The price adjustments and gains and losses on forward contracts discussed above are included in sales.
Mining costs per ton increased by 7% in the first quarter of 2017 compared to the same period in 2016, primarily as a result of higher labor cost, due to higher staffing levels, higher fuel and power costs, and lower milled tons. Milling costs per ton increased 9% in the first quarter of 2017 compared to the same period in 2016 due to lower tons milled and higher power and reagents costs, partially offset by lower labor costs. The increase in cost of hydroelectric power is the result of a price increase per kilowatt-hour purchased from $0.10 to $0.16 in September 2016.
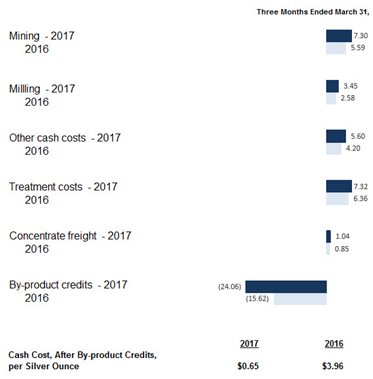
The chart below illustrates the factors contributing to the variances in Cash Cost, After By-product Credits, per Silver Ounce for the first quarter of 2017 compared to the same period of 2016:
|
|
The following table summarizes the components of Cash Cost, After By-product Credits, per Silver Ounce:
|
Three Months Ended March 31, |
||||||||
|
2017 |
2016 |
|||||||
|
Cash Cost, Before By-product Credits, per Silver Ounce |
$ | 24.71 | $ | 19.58 | ||||
|
By-product credits |
(24.06 |
) |
(15.62 |
) | ||||
|
Cash Cost, After By-product Credits, per Silver Ounce |
$ | 0.65 | $ | 3.96 | ||||
The following table summarizes the components of AISC, After By-product Credits, per Silver Ounce:
|
Three Months Ended March 31, |
||||||||
|
2017 |
2016 |
|||||||
|
AISC, Before By-product Credits, per Silver Ounce |
$ | 27.92 | $ | 22.65 | ||||
|
By-product credits |
(24.06 |
) |
(15.62 |
) | ||||
|
AISC, After By-product Credits, per Silver Ounce |
$ | 3.86 | $ | 7.03 | ||||
The decrease in Cash Costs, After By-Product Credits, per Silver Ounce for the first quarter of 2017 compared to 2016 was the result of higher by-product credits, partially offset by lower silver production. The decrease in AISC, After By-Product Credits, per Silver Ounce was due to the same factors impacting Cash Costs, After By-Product Credits, per Silver Ounce, along with lower capital and exploration spending.
Mining and milling costs per ounce increased in the first quarter of 2017 compared to 2016 on a per-ounce basis due primarily to lower silver production resulting from lower silver grades and ore throughput.
Other cash costs per ounce for the first quarter of 2017 were higher compared to 2016 due to the effect of lower silver production.
Treatment costs were higher in the first quarter of 2017 compared to 2016 as a result of lower silver production and higher silver prices, as treatment costs include the value of silver not payable to us through the smelting process. The silver not payable to us is either recovered by the smelters through further processing or ultimately not recovered and included in the smelters’ waste material.
By-product credits per ounce were higher in the first quarter of 2017 compared to 2016 due to higher gold, zinc and lead prices and lower silver production.
The difference between what we report as “production” and “payable metal quantities sold” is attributable to the difference between the quantities of metals contained in the concentrates we produce versus the portion of those metals actually paid for by our customers according to the terms of our sales contracts. Differences can also arise from inventory changes incidental to shipping schedules, or variances in ore grades which impact the amount of metals contained in concentrates produced and sold. The difference in payable quantities sold for 2017 compared to 2016 is due mainly to timing of concentrate shipments.
While revenue from zinc, lead and gold by-products is significant, we believe that identification of silver as the primary product of the Greens Creek unit is appropriate because:
|
• |
silver has historically accounted for a higher proportion of revenue than any other metal and is expected to do so in the future; |
|
• |
we have historically presented Greens Creek as a producer primarily of silver, based on the original analysis that justified putting the project into production, and believe that consistency in disclosure is important to our investors regardless of the relationships of metals prices and production from year to year; |
|
• |
metallurgical treatment maximizes silver recovery; |
|
• |
the Greens Creek deposit is a massive sulfide deposit containing an unusually high proportion of silver; and |
|
• |
in most of its working areas, Greens Creek utilizes selective mining methods in which silver is the metal targeted for highest recovery. |
Likewise, we believe the identification of gold, lead and zinc as by-product credits is appropriate because of their lower economic value compared to silver and due to the fact that silver is the primary product we intend to produce. In addition, we have not consistently received sufficient revenue from any single by-product metal to warrant classification of such as a co-product.
We periodically review our revenues to ensure that reporting of primary products and by-products is appropriate. Because we consider zinc, lead and gold to be by-products of our silver production, the values of these metals offset operating costs within our calculations of Cash Cost, After By-product Credits, per Silver Ounce and AISC, After By-product Credits, per Silver Ounce.
The Lucky Friday Segment
|
Dollars are in thousands (except per ounce and per ton amounts) |
Three Months Ended March 31, |
|||||||
|
2017 |
2016 |
|||||||
|
Sales |
$ | 20,010 | $ | 21,252 | ||||
|
Cost of sales and other direct production costs |
(12,110 |
) |
(15,500 |
) | ||||
|
Depreciation, depletion and amortization |
(2,433 |
) |
(3,004 |
) | ||||
|
Gross profit |
$ | 5,467 | $ | 2,748 | ||||
|
Tons of ore milled |
57,069 | 74,021 | ||||||
|
Production: |
||||||||
|
Silver (ounces) |
680,782 | 977,084 | ||||||
|
Lead (tons) |
3,827 | 5,951 | ||||||
|
Zinc (tons) |
2,131 | 2,753 | ||||||
|
Payable metal quantities sold: |
||||||||
|
Silver (ounces) |
641,004 | 928,801 | ||||||
|
Lead (tons) |
3,596 | 5,507 | ||||||
|
Zinc (tons) |
1,688 | 1,930 | ||||||
|
Ore grades: |
||||||||
|
Silver ounces per ton |
12.39 | 13.67 | ||||||
|
Lead percent |
7.05 | 8.36 | ||||||
|
Zinc percent |
3.99 | 3.97 | ||||||
|
Mining cost per ton |
$ | 104.72 | $ | 98.02 | ||||
|
Milling cost per ton |
$ | 27.16 | $ | 23.35 | ||||
|
Cash Cost, After By-product Credits, per Silver Ounce (1) |
$ | 5.93 | $ | 9.05 | ||||
|
AISC, After By-product Credits, per Silver Ounce (1) |
$ | 12.06 | $ | 21.78 | ||||
|
(1) |
A reconciliation of these non-GAAP measures to cost of sales and other direct production costs and depreciation, depletion and amortization, the most comparable GAAP measure, can be found below in Reconciliation of Cost of Sales and Other Direct Production Costs and Depreciation, Depletion and Amortization (GAAP) to Cash Cost, Before By-product Credits and Cash Cost, After By-product Credits (non-GAAP) and All-In Sustaining Cost, Before By-product Credits and All-In Sustaining Cost, After By-product Credits (non-GAAP). |
Gross profit increased by $2.7 million in the first quarter of 2017 compared to 2016. The variance is primarily due to higher silver, lead, and zinc prices, partially offset by reduced metal production as a result of the suspension of operations starting in mid-March 2017 due to a strike by unionized employees, discussed further below. Silver and lead production was also impacted by lower ore grades.
Mining and milling cost per ton increased by 7% and 16%, respectively, in the first quarter of 2017 compared to the same period in 2016 due primarily to lower ore production as a result of the strike described below.
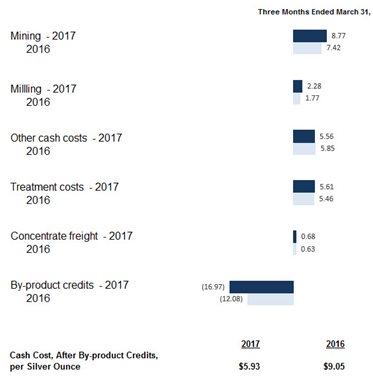
The chart below illustrates the factors contributing to the variances in Cash Cost, After By-product Credits, per Silver Ounce for the first quarter of 2017 compared to the same period of 2016:
|
|
The following table summarizes the components of Cash Cost, After By-product Credits, per Silver Ounce:
|
Three Months Ended March 31, |
||||||||
|
2017 |
2016 |
|||||||
|
Cash Cost, Before By-product Credits, per Silver Ounce |
$ | 22.90 | $ | 21.13 | ||||
|
By-product credits |
(16.97 |
) |
(12.08 |
) | ||||
|
Cash Cost, After By-product Credits, per Silver Ounce |
$ | 5.93 | $ | 9.05 | ||||
The following table summarizes the components of AISC, After By-product Credits, per Silver Ounce:
|
Three Months Ended March 31, |
||||||||
|
2017 |
2016 |
|||||||
|
AISC, Before By-product Credits, per Silver Ounce |
$ | 29.03 | $ | 33.86 | ||||
|
By-product credits |
(16.97 |
) |
(12.08 |
) | ||||
|
AISC, After By-product Credits, per Silver Ounce |
$ | 12.06 | $ | 21.78 | ||||
The decrease in Cash Cost, After By-product Credits, per Silver Ounce in the first quarter of 2017 compared to the first quarter of 2016 was the result of higher by-product credits due to higher lead and zinc prices, partially offset by lower silver production. The decrease in AISC, After By-product Credits, per Silver Ounce is due to the same factors impacting Cash Cost, After By-product Credits, per Silver Ounce, along with lower capital costs primarily as a result of completion of the #4 Shaft project in January 2017.
Similar to the Greens Creek segment, the difference between what we report as “production” and “payable metal quantities sold” is due essentially to the difference between the quantities of metals contained in the concentrates we produce versus the portion of those metals actually paid for by our customers according to the terms of our sales contracts.
While value from lead and zinc is significant, we believe that identification of silver as the primary product of the Lucky Friday unit is appropriate because:
|
• |
silver has historically accounted for a higher proportion of revenue than any other metal and is expected to do so in the future; |
|
• |
the Lucky Friday unit is situated in a mining district long associated with silver production; and |
|
• |
the Lucky Friday unit generally utilizes selective mining methods to target silver production. |
Likewise, we believe the identification of lead and zinc as by-product credits is appropriate because of their lower economic value compared to silver and due to the fact that silver is the primary product we intend to produce. In addition, we do not receive sufficient revenue from any single by-product metal to warrant classification of such as a co-product.
We periodically review our revenues to ensure that reporting of primary products and by-products is appropriate. Because we consider zinc and lead to be by-products of our silver production, the values of these metals offset operating costs within our calculations of Cash Cost, After By-product Credits, per Silver Ounce and AISC, After By-product Credits, per Silver Ounce.
Many of the employees at our Lucky Friday unit are represented by a union, and the most recent collective bargaining agreement with the union expired on April 30, 2016. On February 19, 2017, the unionized employees voted against our contract offer. On March 13, 2017, the unionized employees went on strike, and have been on strike since that time. Production at the Lucky Friday has been suspended since start of the strike. Costs related to care-and-maintenance of the mine during the strike period are reported in a separate line item on our condensed consolidated statement of operations and totaled $1.6 million in the first quarter of 2017. These care-and-maintenance costs are excluded from the calculation of gross profit, Cash Cost, After By-product Credits, per Silver Ounce and AISC, After By-product Credits, per Silver Ounce. We cannot predict how long the strike will last or whether an agreement will be reached. As a result of the strike or other related events, operations at Lucky Friday could continue to be disrupted, which could adversely affect our financial condition and results of operations.
See Note 4 of Notes to Condensed Consolidated Financial Statements (Unaudited) for contingencies related to various accidents and other events occurring at the Lucky Friday mine in prior periods.
The Casa Berardi Segment
|
Dollars are in thousands (except per ounce and per ton amounts) |
Three Months Ended March 31, |
|||||||
|
2017 |
2016 |
|||||||
|
Sales |
$ | 41,712 | $ | 32,198 | ||||
|
Cost of sales and other direct production costs |
(29,953 |
) |
(20,659 |
) | ||||
|
Depreciation, depletion and amortization |
(12,514 |
) |
(8,501 |
) | ||||
|
Gross (loss) profit |
$ | (755 |
) |
$ | 3,038 | |||
|
Tons of ore milled |
293,696 | 216,962 | ||||||
|
Production: |
||||||||
|
Gold (ounces) |
35,807 | 30,378 | ||||||
|
Silver (ounces) |
8,545 | 7,005 | ||||||
|
Payable metal quantities sold: |
||||||||
|
Gold (ounces) |
34,166 | 27,427 | ||||||
|
Silver (ounces) |
7,899 | 7,864 | ||||||
|
Ore grades: |
||||||||
|
Gold ounces per ton |
0.14 | 0.16 | ||||||
|
Silver ounces per ton |
0.03 | 0.04 | ||||||
|
Mining cost per ton |
$ | 86.58 | $ | 87.54 | ||||
|
Milling cost per ton |
$ | 17.26 | $ | 18.91 | ||||
|
Cash Cost, After By-product Credits, per Gold Ounce (1) |
$ | 886 | $ | 781 | ||||
|
AISC, After By-product Credits, per Gold Ounce (1) |
$ | 1,256 | $ | 1,322 | ||||
|
(1) |
A reconciliation of these non-GAAP measures to cost of sales and other direct production costs and depreciation, depletion and amortization, the most comparable GAAP measure, can be found below in Reconciliation of Cost of Sales and Other Direct Production Costs and Depreciation, Depletion and Amortization (GAAP) to Cash Cost, Before By-product Credits and Cash Cost, After By-product Credits (non-GAAP) and All-In Sustaining Cost, Before By-product Credits and All-In Sustaining Cost, After By-product Credits (non-GAAP). |
Gross profit decreased by $3.8 million for the first quarter of 2017 compared to the same period in 2016. The decrease is primarily due to increased costs, mainly resulting from the additional costs related to the East Mine Crown Pillar ("EMCP") pit, including ongoing stripping costs, and lower ore grades, partially offset by higher gold prices and ore production. Processing of ore from the EMCP pit began in July 2016, resulting in increased ore volume, but at a lower grade.
Mining and milling cost per ton for the first quarter of 2017 were lower than the first quarter of 2016 by 1% and 9%, respectively, primarily due to higher ore production. This was partially offset by foreign exchange differences, as the U.S. dollar was weaker relative to the Canadian dollar in the first quarter of 2017 than it was in the first quarter of 2016.
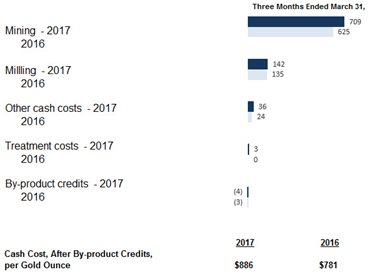
The chart below illustrates the factors contributing to Cash Cost, After By-product Credits, per Gold Ounce for the first quarter of 2017 compared to the same period of 2016:
|
|
The following table summarizes the components of Cash Cost, After By-product Credits, per Gold Ounce:
|
Three Months Ended March 31, |
||||||||
|
2017 |
2016 |
|||||||
|
Cash Cost, Before By-product Credits, per Gold Ounce |
$ | 890 | $ | 785 | ||||
|
By-product credits |
(4 |
) |
(3 |
) | ||||
|
Cash Cost, After By-product Credits, per Gold Ounce |
$ | 886 | $ | 782 | ||||
The following table summarizes the components of AISC, After By-product Credits, per Gold Ounce:
|
Three Months Ended March 31, |
||||||||
|
2017 |
2016 |
|||||||
|
AISC, Before By-product Credits, per Gold Ounce |
$ | 1,260 | $ | 1,325 | ||||
|
By-product credits |
(4 |
) |
(3 |
) | ||||
|
AISC, After By-product Credits, per Gold Ounce |
$ | 1,256 | $ | 1,322 | ||||
The increase in Cash Cost, After By-product Credits, per Gold Ounce for the first quarter of 2017 compared to the first quarter of 2016 was primarily the result of higher costs as a result of addition of production from the EMCP pit, partially offset by higher gold production. The decrease in AISC, After By-product Credits, per Gold Ounce was due to lower capital spending and higher gold production, partially offset by higher production costs.
The difference between what we report as "production" and "payable metal quantities sold" is mainly attributable to inventory changes incidental to the timing of sales of refined metals and shipping schedules.
We believe the identification of silver as a by-product credit is appropriate at Casa Berardi because of its lower economic value compared to gold and due to the fact that gold is the primary product we intend to produce there. In addition, we do not receive sufficient revenue from silver at Casa Berardi to warrant classification of such as a co-product. Because we consider silver to be a by-product of our gold production at Casa Berardi, the value of silver offsets operating costs within our calculations of Cash Cost, After By-product Credits, per Gold Ounce and AISC, After By-product Credits, per Gold Ounce.
The San Sebastian Segment
|
Dollars are in thousands (except per ounce and per ton amounts) |
Three Months Ended March 31, |
|||||||
|
2017 |
2016 |
|||||||
|
Sales |
$ | 21,972 | $ | 23,685 | ||||
|
Cost of sales and other direct production costs |
(5,950 |
) |
(6,909 |
) | ||||
|
Depreciation, depletion and amortization |
(673 |
) |
(769 |
) | ||||
|
Gross profit |
$ | 15,349 | $ | 16,007 | ||||
|
Tons of ore milled |
36,663 | 31,158 | ||||||
|
Production: |
||||||||
|
Silver (ounces) |
750,803 | 1,200,339 | ||||||
|
Gold (ounces) |
6,284 | 9,329 | ||||||
|
Payable metal quantities sold: |
||||||||
|
Silver (ounces) |
780,750 | 958,007 | ||||||
|
Gold (ounces) |
6,915 | 7,413 | ||||||
|
Ore grades: |
||||||||
|
Silver ounces per ton |
21.78 | 41.26 | ||||||
|
Gold ounces per ton |
0.183 | 0.322 | ||||||
|
Mining cost per ton |
$ | 38.99 | $ | 103.72 | ||||
|
Milling cost per ton |
$ | 64.15 | $ | 69.62 | ||||
|
Cash Cost, After By-product Credits, per Silver Ounce (1) |
$ | (3.27 |
) |
$ | (3.26 |
) | ||
|
AISC, After By-product Credits, per Silver Ounce (1) |
$ | 0.43 | $ | (2.28 |
) | |||
|
(1) |
A reconciliation of this non-GAAP measure to cost of sales and other direct production costs and depreciation, depletion and amortization, the most comparable GAAP measure, can be found below in Reconciliation of Cost of Sales and Other Direct Production Costs and Depreciation, Depletion and Amortization (GAAP) to Cash Cost, Before By-product Credits and Cash Cost, After By-product Credits (non-GAAP) and All-In Sustaining Cost, Before By-product Credits and All-In Sustaining Cost, After By-product Credits (non-GAAP). |
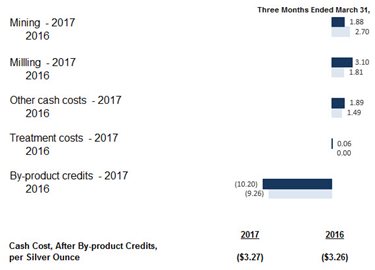
The $0.7 million decrease in gross profit in the first quarter of 2017 compared to the same period of 2016 is primarily due to lower silver and gold production as a result of lower ore grades, partially offset by higher ore throughput. The ore processed in the first quarter of 2016 had considerably higher grades than anticipated over the mine life. The impact of lower metals production was partially offset by higher average silver and gold prices.
The chart below illustrates the factors contributing to Cash Cost, After By-product Credits, Per Silver Ounce for the first quarter of 2017 compared to the same period of 2016:
|
|
The following table summarizes the components of Cash Cost, After By-product Credits, per Silver Ounce:
|
Three Months Ended March 31, |
||||||||
|
2017 |
2016 |
|||||||
|
Cash Cost, Before By-product Credits, per Silver Ounce |
$ | 6.93 | $ | 6.00 | ||||
|
By-product credits |
(10.20 |
) |
(9.26 |
) | ||||
|
Cash Cost, After By-product Credits, per Silver Ounce |
$ | (3.27 |
) |
$ | (3.26 |
) | ||
The following table summarizes the components of AISC, After By-product Credits, per Silver Ounce:
|
Three Months Ended March 31, |
||||||||
|
2017 |
2016 |
|||||||
|
AISC, Before By-product Credits, per Silver Ounce |
$ | 10.63 | $ | 6.98 | ||||
|
By-product credits |
(10.20 |
) |
(9.26 |
) | ||||
|
AISC, After By-product Credits, per Silver Ounce |
$ | 0.43 | $ | (2.28 |
) | |||
The slight decrease in Cash Cost, After By-product Credits, per Silver Ounce in the first quarter of 2017 compared to the same period of 2016 was primarily the result of higher by-product credits per ounce due to higher gold prices and the impact of lower silver production, partially offset by lower gold production, and lower mining costs as a result of reduced mining of waste. The increase in AISC, After By-product Credits, per Silver Ounce was the result of higher exploration and capital spending, partially offset by higher by-product credits per ounce.
The difference between what we report as "production" and "payable metal quantities sold" is mainly attributable to inventory changes incidental to the timing of sales of refined metals and shipping schedules.
We believe the identification of gold as a by-product credit is appropriate at San Sebastian because of its anticipated lower economic value compared to silver over the life of the mine. In addition, we will not receive sufficient revenue from gold at San Sebastian to warrant classification of such as a co-product. Because we consider gold to be a by-product of our silver production at San Sebastian, the value of gold offsets operating costs within our calculations of Cash Cost, After By-product Credits, per Silver Ounce and AISC, After By-product Credits, per Silver Ounce. In addition to the impact of the by-product credits from gold, Cash Cost, After By-product Credits, per Silver Ounce and AISC, After By-product Credits, per Silver Ounce at San Sebastian are lower compared to our other operations due to the orebody being near surface and having higher precious metal grades, resulting in a lower Cash Cost, Before By-product Credits, per Silver Ounce and AISC, After By-product Credits, per Silver Ounce.
In the first quarter of 2017, we began construction of a new underground ramp and rehabilitation of the historical underground access. Once completed, these underground accesses should allow us to mine deeper portions of the deposits at San Sebastian, and we anticipate underground ore production to begin in late 2017. Capital costs related to the underground development are expected to total approximately $5.0 million.
Corporate Matters
Employee Benefit Plans
Our defined benefit pension plans, while affording a significant benefit to our employees, also represent a significant liability to us. The liability recorded for the funded status of our plans was $46.9 million and $44.9 million as of March 31, 2017 and December 31, 2016, respectively. In April 2017, we contributed $1.2 million in cash to our defined benefits plans, and expect to contribute an additional $2.8 million in cash or shares of our common stock to our defined benefit plans in 2017. While the economic variables which will determine future funding requirements are uncertain, we expect contributions to continue to be required in future years under current plan provisions, and we periodically examine the plans for affordability and competitiveness. See Note 7 of Notes to Condensed Consolidated Financial Statements (Unaudited) for more information.
Income Taxes
Each reporting period we assess our deferred tax assets utilizing long-range forecasts to provide reasonable assurance that they will be realized through future earnings. We continue to have a net deferred tax asset in the U.S. and a net deferred tax liability in Canada.
Our U.S. net deferred tax asset at March 31, 2017 totaled $48.4 million, or 2% of total assets, an increase of $12.6 million from the $35.8 million net deferred tax asset at December 31, 2016. The largest component of the deferred tax asset is net operating loss carryforwards. The next largest component is deferred foreign exchange losses. We have previously determined that we are an indefinite AMT taxpayer, resulting in additional valuation allowance primarily related to forecasted utilization of regular net operating loss carryforwards and the effect of re-measuring temporary deferred tax assets using a tax rate of 20% which differed from the previous rate of 35%. During the fourth quarter of 2016, we determined that we are eligible to take a different income tax position relating to the timing of deductions for #4 Shaft development costs at Lucky Friday. We filed with the Internal Revenue Service ("IRS") a request for approval to use this method, which was approved in the first quarter of 2017. The change resulted in additional deductions of approximately $203 million and $110 million for regular tax and AMT, respectively, resulting in a current tax benefit of approximately $10.7 million for the reduction in 2016 AMT payable. In addition, this change in tax position substantially changes the timing of additional deductions for these costs for regular tax and AMT relative to our projected life of mine and projected taxable income. These timing changes caused us to change our assessment of the ability to generate sufficient future taxable income to realize our deferred tax assets, resulting in a valuation allowance decrease and deferred tax benefit of approximately $15.1 million in the first quarter of 2017. At March 31, 2017, we retained a valuation allowance on U.S. deferred tax assets of approximately $78 million, primarily for net operating loss carryforwards.
Our net Canadian deferred tax liability at March 31, 2017 was $121.0 million, a decrease of $1.9 million from the $122.9 million net deferred tax liability at December 31, 2016. The deferred tax liability is primarily related to the excess of the carrying value of the mineral resource assets over the tax bases of those assets for Canadian tax reporting.
We had no Mexican deferred tax asset or liability at March 31, 2017 or December 31, 2016. We expect to have unremitted earnings in Mexico by the end 2017; however, we anticipate being able to fully offset any U.S. tax impact of repatriating any Mexican earnings with foreign tax credits that are available to use for both regular tax and AMT. Accordingly, we estimate the net U.S. income tax impact of unremitted earnings to be zero. A $3.6 million valuation allowance remains on deferred tax assets in foreign jurisdictions.
Reconciliation of Cost of Sales and Other Direct Production Costs and Depreciation, Depletion and Amortization (GAAP) to Cash Cost, Before By-product Credits and Cash Cost, After By-product Credits (non-GAAP) and All-In Sustaining Cost ("AISC"), Before By-product Credits and All-In Sustaining Cost, After By-product Credits (non-GAAP)
The tables below present reconciliations between the most comparable GAAP measure of cost of sales and other direct production costs and depreciation, depletion and amortization to the non-GAAP measures of Cash Cost, Before By-product Credits, Cash Cost, After By-product Credits, AISC, Before By-product Credits and AISC, After By-product Credits for our operations at the Greens Creek, Lucky Friday, San Sebastian and Casa Berardi units and for the Company for the three-month periods ended March 31, 2017 and 2016.
Cash Cost, After By-product Credits, per Ounce is an important operating statistic that we utilize to measure each mine's operating performance. We have recently started reporting AISC, After By-product Credits, per Ounce which we use as a measure of our mines' net cash flow after costs for exploration, pre-development, reclamation, and sustaining capital. This is similar to the Cash Cost, After By-product Credits, per Ounce non-GAAP measure we report, but also includes on-site exploration, reclamation, and sustaining capital costs. Current GAAP measures used in the mining industry, such as cost of goods sold, do not capture all the expenditures incurred to discover, develop and sustain silver and gold production. Cash Cost, After By-product Credits, per Ounce and AISC, After By-product Credits, per Ounce also allow us to benchmark the performance of each of our mines versus those of our competitors. As a primary silver mining company, we also use these statistics on an aggregate basis - aggregating the Greens Creek, Lucky Friday and San Sebastian mines - to compare our performance with that of other primary silver mining companies. With regard to Casa Berardi, we use Cash Cost, After By-product Credits, per Gold Ounce and AISC, After By-product Credits, per Gold Ounce to compare its performance with other gold mines. Similarly, these statistics are useful in identifying acquisition and investment opportunities as they provide a common tool for measuring the financial performance of other mines with varying geologic, metallurgical and operating characteristics.
Cash Cost, Before By-product Credits and AISC, Before By-product Credits include all direct and indirect operating cash costs related directly to the physical activities of producing metals, including mining, processing and other plant costs, third-party refining expense, on-site general and administrative costs, royalties and mining production taxes. AISC, Before By-product Credits for each mine also includes on-site exploration, reclamation, and sustaining capital costs. AISC, Before By-product Credits for our consolidated silver properties also includes corporate costs for general and administrative expense, exploration and sustaining capital projects. By-product credits include revenues earned from all metals other than the primary metal produced at each unit. As depicted in the tables below, by-product credits comprise an essential element of our silver unit cost structure, distinguishing our silver operations due to the polymetallic nature of their orebodies. Cash Cost, After By-product Credits, per Ounce and AISC, After By-product Credits, per Ounce provide management and investors an indication of operating cash flow, after consideration of the average price, received from production. We also use these measurements for the comparative monitoring of performance of our mining operations period-to-period from a cash flow perspective. Cash Cost, After By-product Credits, per Ounce is a measure developed by precious metals companies (including the Silver Institute) in an effort to provide a uniform standard for comparison purposes. There can be no assurance, however, that these non-GAAP measures as we report them are the same as those reported by other mining companies.
The Casa Berardi section below reports Cash Cost, After By-product Credits, per Gold Ounce and AISC, After By-product Credits, per Gold Ounce for the production of gold, its primary product, and by-product revenues earned from silver, which is a by-product at Casa Berardi. Only costs and ounces produced relating to units with the same primary product are combined to represent Cash Cost, After By-product Credits, per Ounce and AISC, After By-product Credits, per Ounce. Thus, the gold produced at our Casa Berardi unit is not included as a by-product credit when calculating Cash Cost, After By-product Credits, per Silver Ounce and AISC, After By-product Credits, per Silver Ounce for the total of Greens Creek, Lucky Friday and San Sebastian, our combined silver properties.
|
In thousands (except per ounce amounts) |
Three Months Ended March 31, 2017 |
|||||||||||||||||||||||||||
|
Greens Creek |
Lucky Friday(2) |
San Sebastian |
Corporate(3) |
Total Silver |
Casa Berardi (Gold) |
Total |
||||||||||||||||||||||
|
Cost of sales and other direct production costs and depreciation, depletion and amortization |
$ | 43,996 | $ | 14,543 | $ | 6,623 | $ | 65,162 | $ | 42,466 | $ | 107,628 | ||||||||||||||||
|
Depreciation, depletion and amortization |
(13,332 |
) |
(2,433 |
) |
(673 |
) |
(16,438 |
) |
(12,514 |
) |
(28,952 |
) | ||||||||||||||||
|
Treatment costs |
14,131 | 3,817 | 225 | 18,173 | 571 | 18,744 | ||||||||||||||||||||||
|
Change in product inventory |
3,265 | (149 |
) |
(380 |
) |
2,736 | 1,381 | 4,117 | ||||||||||||||||||||
|
Reclamation and other costs |
(386 |
) |
(182 |
) |
(590 |
) |
(1,158 |
) |
(17 |
) |
(1,175 |
) | ||||||||||||||||
|
Cash Cost, Before By-product Credits (1) |
47,674 | 15,596 | 5,205 | 68,475 | 31,887 | 100,362 | ||||||||||||||||||||||
|
Reclamation and other costs |
666 | 179 | 117 | 962 | 17 | 979 | ||||||||||||||||||||||
|
Exploration |
278 | 1 | 1,532 | 378 | 2,189 | 797 | 2,986 | |||||||||||||||||||||
|
Sustaining capital |
5,234 | 3,990 | 1,132 | 5 | 10,361 | 12,411 | 22,772 | |||||||||||||||||||||
|
General and administrative |
9,206 | 9,206 | 9,206 | |||||||||||||||||||||||||
|
AISC, Before By-product Credits (1) |
53,852 | 19,766 | 7,986 | 91,193 | 45,112 | 136,305 | ||||||||||||||||||||||
|
By-product credits: |
||||||||||||||||||||||||||||
|
Zinc |
(23,779 |
) |
(4,060 |
) |
(27,839 |
) |
(27,839 |
) | ||||||||||||||||||||
|
Gold |
(14,852 |
) |
(7,657 |
) |
(22,509 |
) |
(22,509 |
) | ||||||||||||||||||||
|
Lead |
(7,782 |
) |
(7,496 |
) |
(15,278 |
) |
(15,278 |
) | ||||||||||||||||||||
|
Silver |
(147 |
) |
(147 |
) | ||||||||||||||||||||||||
|
Total By-product credits |
(46,413 |
) |
(11,556 |
) |
(7,657 |
) |
(65,626 |
) |
(147 |
) |
(65,773 |
) | ||||||||||||||||
|
Cash Cost, After By-product Credits |
$ | 1,261 | $ | 4,040 | $ | (2,452 |
) |
$ | 2,849 | $ | 31,740 | $ | 34,589 | |||||||||||||||
|
AISC, After By-product Credits |
$ | 7,439 | $ | 8,210 | $ | 329 | $ | 25,567 | $ | 44,965 | $ | 70,532 | ||||||||||||||||
|
Divided by ounces produced |
1,929 | 681 | 751 | 3,361 | 36 | |||||||||||||||||||||||
|
Cash Cost, Before By-product Credits, per Ounce |
$ | 24.71 | $ | 22.90 | $ | 6.93 | $ | 20.37 | $ | 890.53 | ||||||||||||||||||
|
By-product credits per ounce |
(24.06 |
) |
(16.97 |
) |
(10.20 |
) |
(19.53 |
) |
(4.11 |
) |
||||||||||||||||||
|
Cash Cost, After By-product Credits, per Ounce |
$ | 0.65 | $ | 5.93 | $ | (3.27 |
) |
$ | 0.84 | $ | 886.42 | |||||||||||||||||
|
AISC, Before By-product Credits, per Ounce |
$ | 27.92 | $ | 29.03 | $ | 10.63 | $ | 27.13 | $ | 1,259.87 | ||||||||||||||||||
|
By-product credits per ounce |
(24.06 |
) |
(16.97 |
) |
(10.20 |
) |
(19.53 |
) |
(4.11 |
) |
||||||||||||||||||
|
AISC, After By-product Credits, per Ounce |
$ | 3.86 | $ | 12.06 | $ | 0.43 | $ | 7.60 | $ | 1,255.76 | ||||||||||||||||||
|
In thousands (except per ounce amounts) |
Three Months Ended March 31, 2016 |
|||||||||||||||||||||||||||
|
Greens Creek |
Lucky Friday(2) |
San Sebastian |
Corporate(3) |
Total Silver |
Casa Berardi (Gold) |
Total |
||||||||||||||||||||||
|
Cost of sales and other direct production costs and depreciation, depletion and amortization |
$ | 44,854 | $ | 18,505 | $ | 7,677 | $ | 71,036 | $ | 29,159 | $ | 100,195 | ||||||||||||||||
|
Depreciation, depletion and amortization |
(13,601 |
) |
(3,004 |
) |
(769 |
) |
(17,374 |
) |
(8,501 |
) |
(25,875 |
) | ||||||||||||||||
|
Treatment costs |
15,638 | 5,334 | (9 |
) |
20,963 | 171 | 21,134 | |||||||||||||||||||||
|
Change in product inventory |
1,640 | (21 |
) |
340 | 1,959 | 3,118 | 5,077 | |||||||||||||||||||||
|
Reclamation and other costs |
(398 |
) |
(166 |
) |
(41 |
) |
(605 |
) |
(111 |
) |
(716 |
) | ||||||||||||||||
|
Cash Cost, Before By-product Credits (1) |
48,133 | 20,648 | 7,198 | 75,979 | 23,836 | 99,815 | ||||||||||||||||||||||
|
Reclamation and other costs |
682 | 165 | 42 | 889 | 111 | 1,000 | ||||||||||||||||||||||
|
Exploration |
488 | — | 650 | 473 | 1,611 | 717 | 2,328 | |||||||||||||||||||||
|
Sustaining capital |
6,376 | 12,266 | 490 | 37 | 19,169 | 15,611 | 34,780 | |||||||||||||||||||||
|
General and administrative |
10,214 | 10,214 | 10,214 | |||||||||||||||||||||||||
|
AISC, Before By-product Credits (1) |
55,679 | 33,079 | 8,380 | 107,862 | 40,275 | 148,137 | ||||||||||||||||||||||
|
By-product credits: |
||||||||||||||||||||||||||||
|
Zinc |
(15,684 |
) |
(3,133 |
) |
(18,817 |
) |
(18,817 |
) | ||||||||||||||||||||
|
Gold |
(16,340 |
) |
(11,116 |
) |
(27,456 |
) |
(27,456 |
) | ||||||||||||||||||||
|
Lead |
(6,384 |
) |
(8,673 |
) |
(15,057 |
) |
(15,057 |
) | ||||||||||||||||||||
|
Silver |
(103 |
) |
(103 |
) | ||||||||||||||||||||||||
|
Total By-product credits |
(38,408 |
) |
(11,806 |
) |
(11,116 |
) |
(61,330 |
) |
(103 |
) |
(61,433 |
) | ||||||||||||||||
|
Cash Cost, After By-product Credits |
$ | 9,725 | $ | 8,842 | $ | (3,918 |
) |
$ | 14,649 | $ | 23,733 | $ | 38,382 | |||||||||||||||
|
AISC, After By-product Credits |
$ | 17,271 | $ | 21,273 | $ | (2,736 |
) |
$ | 46,532 | $ | 40,172 | $ | 86,704 | |||||||||||||||
|
Divided by ounces produced |
2,458 | 977 | 1,200 | 4,635 | 30 | |||||||||||||||||||||||
|
Cash Cost, Before By-product Credits, per Ounce |
$ | 19.58 | $ | 21.13 | $ | 6.00 | $ | 16.39 | $ | 784.66 | ||||||||||||||||||
|
By-product credits per ounce |
(15.62 |
) |
(12.08 |
) |
(9.26 |
) |
(13.23 |
) |
(3.39 |
) |
||||||||||||||||||
|
Cash Cost, After By-product Credits, per Ounce |
$ | 3.96 | $ | 9.05 | $ | (3.26 |
) |
$ | 3.16 | $ | 781.27 | |||||||||||||||||
|
AISC, Before By-product Credits, per Ounce |
$ | 22.65 | $ | 33.86 | $ | 6.98 | $ | 23.27 | $ | 1,325.79 | ||||||||||||||||||
|
By-product credits per ounce |
(15.62 |
) |
(12.08 |
) |
(9.26 |
) |
(13.23 |
) |
(3.39 |
) |
||||||||||||||||||
|
AISC, After By-product Credits, per Ounce |
$ | 7.03 | $ | 21.78 | $ | (2.28 |
) |
$ | 10.04 | $ | 1,322.40 | |||||||||||||||||
|
(1) |
Includes all direct and indirect operating costs related directly to the physical activities of producing metals, including mining, processing and other plant costs, third-party refining and marketing expense, on-site general and administrative costs, royalties and mining production taxes, after by-product revenues earned from all metals other than the primary metal produced at each unit. AISC, Before By-product Credits also includes on-site exploration, reclamation, and sustaining capital costs. |
|
(2) |
The unionized employees at Lucky Friday have been on strike since March 13, 2017, and production at Lucky Friday has been suspended since that time. Costs related to the suspension period totaling approximately $1.6 million in the first quarter of 2017 have been excluded from the calculations of cost of sales and other direct production costs and depreciation, depletion and amortization, Cash Cost, Before By-product Credits, Cash Cost, After By-product Credits, AISC, Before By-product Credits, and AISC, After By-product Credits. |
|
(3) |
AISC, Before By-product Credits for our consolidated silver properties includes corporate costs for general and administrative expense, exploration and sustaining capital. |
Financial Liquidity and Capital Resources
Our liquid assets include (in millions):
|
March 31, 2017 |
December 31, 2016 |
|||||||
|
Cash and cash equivalents held in U.S. dollars |
$ | 152.2 | $ | 156.1 | ||||
|
Cash and cash equivalents held in foreign currency |
24.6 | 13.7 | ||||||
|
Total cash and cash equivalents |
176.8 | 169.8 | ||||||
|
Marketable debt securities, current |
36.5 | 29.1 | ||||||
|
Marketable equity securities, non-current |
5.1 | 5.0 | ||||||
|
Total cash, cash equivalents and investments |
$ | 218.4 | $ | 203.9 | ||||
Cash and cash equivalents increased by $7.0 million in the first three months of 2017, as discussed below. Cash held in foreign currencies represents balances in Canadian dollars and Mexican pesos, with the $10.9 million increase in the first quarter of 2017 resulting primarily from an increase in Mexican pesos held. Current marketable debt securities increased by $7.4 million (discussed below), and the value of non-current marketable equity securities increased by $0.1 million (see Note 2 of Notes to Condensed Consolidated Financial Statements (Unaudited) for more information).
As discussed in Note 9 of Notes to Condensed Consolidated Financial Statements (Unaudited), on April 12, 2013, we completed an offering of Senior Notes in the total principal amount of US$500 million, which have a total principal balance of $506.5 million as of March 31, 2017. The Senior Notes are due May 1, 2021 and bear interest at a rate of 6.875% per year from the most recent payment date to which interest has been paid or provided for. Interest on the Senior Notes is payable on May 1 and November 1 of each year, commencing November 1, 2013, and we have made all interest payments payable to date.
In the third quarter of 2015, we made a development decision to mine near surface, high grade portions of the silver and gold deposits at our San Sebastian project in Mexico and commenced ore production at the end of 2015. As a result, San Sebastian has generated positive cash flows since the start of production there. In January 2017, we initiated work to develop and rehabilitate underground access which, upon completion, would allow us to mine deeper portions of the deposits at San Sebastian. We anticipate San Sebastian will continue to generate positive cash flows in 2017 and 2018. However, our estimate of costs could change, and our ability to generate cash flow at San Sebastian could be impacted by changes in precious metals prices or other factors, and there can be no assurance that we will be able to develop and operate San Sebastian as anticipated.
As further discussed in the Lucky Friday Segment section above, the union employees at Lucky Friday have been on strike since March 13, 2017, and production at Lucky Friday has been suspended since that time. We cannot predict how long the strike will last or whether an agreement will be reached. As a result of the strike or other related events, operations at Lucky Friday could continue to be disrupted, which could adversely affect our financial condition and results of operations.
As discussed in Note 8 of Notes to Condensed Consolidated Financial Statements (Unaudited), in February 2016 we entered into an equity distribution agreement under which we may issue and sell shares of our common stock from time to time having an aggregate offering price of up to $75 million, with the net proceeds available for general corporate purposes. Whether or not we engage in sales from time to time may depend on a variety of factors, including share price, our cash resources, customary black-out restrictions, and whether we have any material inside information, and the agreement can be terminated by us at any time. As of March 31, 2017, we had sold 2,780,087 shares through the at-the-market program for net proceeds of $8.1 million.
Pursuant to our common stock dividend policy described in Note 8 of Notes to Condensed Consolidated Financial Statements (Unaudited), our Board of Directors declared and paid dividends on common stock totaling $1.0 million in the first quarter of each of 2017 and 2016. On May 4, 2017, our Board of Directors declared a dividend on common stock totaling $1.0 million payable in June 2017. Our dividend policy has a silver-price-linked component which ties the amount of declared common stock dividends to our realized silver price for the preceding quarter. Another component of our common stock dividend policy anticipates paying an annual minimum dividend. The declaration and payment of dividends on common stock is at the sole discretion of our board of directors, and there can be no assurance that we will continue to declare and pay common stock dividends in the future.
On May 8, 2012, we announced that our board of directors approved a stock repurchase program. Under the program, we are authorized to repurchase up to 20 million shares of our outstanding common stock from time to time in open market or privately negotiated transactions, depending on prevailing market conditions and other factors. The repurchase program may be modified, suspended or discontinued by us at any time. Whether or not we engage in repurchases from time to time may depend on a variety of factors, including not only price and cash resources, but customary black-out restrictions, whether we have any material inside information, limitations on share repurchases or cash usage that may be imposed by our credit agreement or in connection with issuances of securities, alternative uses for cash, applicable law, and other investment opportunities from time to time. As of March 31, 2017, 934,100 shares have been purchased in prior periods at an average price of $3.99 per share, leaving 19.1 million shares that may yet be purchased under the program. The closing price of our common stock at May 4, 2017, was $5.14 per share.
We may defer some capital investment and/or exploration and pre-development activities, engage in asset sales or secure additional capital if necessary to maintain liquidity. We also may pursue additional acquisition opportunities, which could require additional equity issuances or other forms of financing. There can be no assurance that such financing will be available to us.
As a result of our current cash balances, the performance of our current and expected operations, current metals prices, proceeds from potential at-the-market sales of common stock, and full availability of our $100 million revolving credit facility, we believe our cash, cash equivalents, investments, projected cash from operations, and availability of financing (including equity issuances), if needed, will be adequate to meet our obligations and other potential cash requirements during the next 12 months. Our obligations and other uses of cash may include, but are not limited to: debt service obligations related to the Senior Notes, capital expenditures at our operations, potential acquisitions of other mining companies or properties, regulatory matters, litigation, potential repurchases of our common stock under the program described above, and payment of dividends on common stock, if declared by our board of directors. Capital expenditures are closely tied to operations, and because mining at Lucky Friday has halted due to the strike and we cannot predict how long the strike will last, we currently do not have an estimate of capital expenditures for the full year of 2017. We incurred $21.7 million in capital expenditures in the first three months of March 31, 2017. We estimate that exploration and pre-development expenditures will total between $25 million and $30 million in 2017, including $5.8 million already incurred as of March 31, 2017. However, capital, exploration, and pre-development expenditures may change based upon our financial position, metals prices, and other considerations. Our ability to fund the activities described above will depend on our operating performance, metals prices, our ability to estimate costs, sources of liquidity available to us, and other factors. A sustained downturn in metals prices or significant increase in operational or capital costs, other uses of cash, or other factors beyond our control could impact our plans.
|
Three Months Ended | ||||||||||
|
March 31, 2017 |
March 31, 2016 | |||||||||
|
Cash provided by operating activities (in millions) |
$ | 38.3 | $ | 18.7 | ||||||
Cash provided by operating activities in the first quarter of 2017 increased by $19.6 million compared to the same period in 2016. The increase was primarily due to working capital and other operating asset and liability changes which resulted in a net cash flow decrease of $7.4 million in the first three months of 2017 compared to a net decrease in cash flows of $21.5 million in the 2016 period. The $14.1 million variance in working capital changes is attributed to lower accounts receivable due to the timing of sales at Greens Creek and Casa Berardi and higher payroll accruals due to the timing of payment of incentive compensation related to prior year performance. In addition, income, as adjusted for non-cash items, was higher by $5.5 million, due primarily to higher metals prices.
|
Three Months Ended |
||||||||
|
March 31, 2017 |
March 31, 2016 |
|||||||
|
Cash used in investing activities (in millions) |
$ | (29.1 |
) |
$ | (38.3 |
) | ||
During the first quarter of 2017 we invested $21.7 million in capital expenditures, not including $1.8 million in capital lease additions, compared to $34.7 million in the same period in 2016, with the variance primarily due to lower costs for the #4 Shaft project, which was completed in January 2017. During the first quarter of 2017, we purchased bonds having a cost basis of $11.1 million and maturities of greater than 90 days and less than 365 days. Bonds valued at $3.6 million matured during the first quarter of 2017. We incurred an increase in restricted cash of $3.9 million in the first quarter of 2016 related to the settlement of response costs at the Gilt Edge site by CoCa Mines, Inc., our wholly-owned subsidiary.
|
Three Months Ended |
||||||||
|
March 31, 2017 |
March 31, 2016 |
|||||||
|
Cash used in financing activities (in millions) |
$ | (4.0 |
) |
$ | (3.1 |
) | ||
We paid cash dividends of $1.0 million on our common stock and cash dividends of $0.1 million on our Series B Preferred Stock during the first quarter of each of 2017 and 2016. We made repayments on our capital leases of $1.6 million and $2.1 million, respectively, in the first quarter of 2017 and 2016. In the first quarter of 2017 and 2016, we also made repayments of debt totaling $0.5 million and $0.7 million, respectively. In addition, during the first quarter of 2017 and 2016, we acquired treasury shares for $0.7 million and $1.3 million, respectively, as the result of employees' elections to satisfy their tax withholding obligations related to incentive compensation paid in stock through net share settlement. See Note 8 of Notes to Condensed Consolidated Financial Statements (Unaudited) for more information. During the first quarter of 2016, we received $2.1 million in proceeds from the sale of shares of our common stock under the equity distribution agreement discussed above.
Contractual Obligations, Contingent Liabilities and Commitments
The table below presents our fixed, non-cancelable contractual obligations and commitments primarily related to our Senior Notes, outstanding purchase orders, certain capital expenditures, our credit facility and lease arrangements as of March 31, 2017 (in thousands):
|
Payments Due By Period |
||||||||||||||||||||
|
Less than 1 year |
1-3 years |
4-5 years |
More than 5 years |
Total |
||||||||||||||||
|
Purchase obligations (1) |
$ | 11,810 | $ | — | $ | — | $ | — | $ | 11,810 | ||||||||||
|
Commitment fees (2) |
500 | 317 | — | — | 817 | |||||||||||||||
|
Contractual obligations (3) |
1,769 | — | — | — | 1,769 | |||||||||||||||
|
Capital lease commitments (4) |
5,988 | 5,717 | 604 | — | 12,309 | |||||||||||||||
|
Operating lease commitments (5) |
4,045 | 3,074 | 1,556 | 476 | 9,151 | |||||||||||||||
|
Supplemental executive retirement plan (6) |
428 | 991 | 1,296 | 4,169 | 6,884 | |||||||||||||||
|
Defined benefit pension plans (6) |
3,986 | — | — | — | 3,986 | |||||||||||||||
|
Senior Notes (7) |
34,822 | 69,644 | 544,224 | — | 648,690 | |||||||||||||||
|
Total contractual cash obligations |
$ | 63,348 | $ | 79,743 | $ | 547,680 | $ | 4,645 | $ | 695,416 | ||||||||||
|
(1) |
Consist of open purchase orders of approximately $9.5 million at the Greens Creek unit, $0.2 million at the Lucky Friday unit and $2.1 million at the Casa Berardi unit. |
|
(2) |
We have a $100 million revolving credit agreement under which we are required to pay a standby fee of 0.5% per annum on undrawn amounts under the revolving credit agreement. There was no amount drawn under the revolving credit agreement as of March 31, 2017, and the amounts above assume no amounts will be drawn during the agreement's term. For more information on our credit facility, see Note 9 of Notes to Condensed Consolidated Financial Statements (Unaudited). |
|
(3) |
As of March 31, 2017, we were committed to approximately $1.8 million for various items. |
|
(4) |
Includes scheduled capital lease payments of $3.4 million, $4.7 million, and $4.2 million (including interest), respectively, for equipment at our Greens Creek, Lucky Friday and Casa Berardi units. These leases have fixed payment terms and contain bargain purchase options at the end of the lease periods (see Note 9 of Notes to Condensed Consolidated Financial Statements (Unaudited) for more information). |
|
(5) |
We enter into operating leases in the normal course of business. Substantially all lease agreements have fixed payment terms based on the passage of time. Some lease agreements provide us with the option to renew the lease or purchase the leased property. Our future operating lease obligations would change if we exercised these renewal options and if we entered into additional operating lease arrangements. |
|
(6) |
We sponsor defined benefit pension plans covering substantially all U.S. employees and provide certain post-retirement benefits for qualifying retired employees, along with a supplemental executive retirement plan. These amounts represent our estimate of the future funding requirements for these plans. We believe we will have funding requirements related to our defined benefit plans beyond one year; however, such obligations are not fixed in nature and are difficult to estimate, as they involve significant assumptions. See Note 7 of Notes to Condensed Consolidated Financial Statements (Unaudited) for more information. |
|
(7) |
On April 12, 2013, we completed an offering of $500 million in aggregate principal amount of our Senior Notes due May 1, 2021. The Senior Notes bear interest at a rate of 6.875% per year from the date of original issuance or from the most recent payment date to which interest has been paid or provided for. Interest on the Senior Notes is payable on May 1 and November 1 of each year, commencing November 1, 2013, and we have made all interest payments payable to date. Since the initial offering, we have issued an additional $6.5 million in aggregate principal amount of the Senior Notes to fund obligations under our defined benefit pension plan. See Note 9 of Notes to Condensed Consolidated Financial Statements (Unaudited) for more information. |
We record liabilities for costs associated with mine closure, reclamation of land and other environmental matters. At March 31, 2017, our liabilities for these matters totaled $86.8 million. Future expenditures related to closure, reclamation and environmental expenditures at our sites are difficult to estimate, although we anticipate we will incur expenditures relating to these obligations over the next 30 years. For additional information relating to our environmental obligations, see Note 4 of Notes to Condensed Consolidated Financial Statements (Unaudited).
Off-Balance Sheet Arrangements
At March 31, 2017, we had no existing off-balance sheet arrangements, as defined under SEC regulations, that have or are reasonably likely to have a current or future effect on our financial condition, revenues or expenses, results of operations, liquidity, capital expenditures or capital resources that are material to investors.
Critical Accounting Estimates
Our significant accounting policies are described in Note 1 of Notes to Consolidated Financial Statements in our annual report filed on Form 10-K for the year ended December 31, 2016. As described in Note 1 of the annual report, we are required to make estimates and assumptions that affect the reported amounts and related disclosures of assets, liabilities, revenue, and expenses. Our estimates are based on our experience and our interpretation of economic, political, regulatory, and other factors that affect our business prospects. Actual results may differ significantly from our estimates.
We believe that our most critical accounting estimates are related to future metals prices; obligations for environmental, reclamation, and closure matters; mineral reserves; and accounting for business combinations, as they require us to make assumptions that were highly uncertain at the time the accounting estimates were made and changes in them are reasonably likely to occur from period to period. Management has discussed the development and selection of these critical accounting estimates with the Audit Committee of our Board of Directors, and the Audit Committee has reviewed the disclosures presented below. In addition, there are other items within our financial statements that require estimation, but are not deemed to be critical. However, changes in estimates used in these and other items could have a material impact on our financial statements.
Future Metals Prices
Metals prices are key components in estimates that determine the valuation of some of our significant assets and liabilities, including properties, plants and equipment, deferred tax assets, and certain accounts receivable. Metals prices are also an important component in the estimation of reserves. As shown under Item 1A. - Risk Factors in our annual report filed on Form 10-K for the year ended December 31, 2016, metals prices have historically been volatile. Silver demand arises from investment demand, particularly in exchange-traded funds, industrial demand, and consumer demand. Gold demand arises primarily from investment and consumer demand. Investment demand for silver and gold is influenced by various factors, including: the value of the U.S. Dollar and other currencies, changing U.S. budget deficits, widening availability of exchange-traded funds, interest rate levels, the health of credit markets, and inflationary expectations. Uncertainty related to the political environment in the U.S., Britain's exit from the European Union and a global economic recovery, including recent uncertainty in China, could result in continued investment demand for precious metals. Industrial demand for silver is closely linked to world Gross Domestic Product growth and industrial fabrication levels, as it is difficult to substitute for silver in industrial fabrication. Consumer demand is driven significantly by demand for jewelry and other retail products. We believe that long-term industrial and economic trends, including urbanization and growth of the middle class in countries such as China and India, will result in continued consumer demand for silver and gold and industrial demand for silver. However, China has recently experienced a lower rate of economic growth which could continue in the near term. There can be no assurance whether these trends will continue or how they will impact prices of the metals we produce. In the past, we have recorded impairments to our asset carrying value because of low prices, and we can offer no assurance that prices will either remain at their current levels or increase.
Processes supporting valuation of our assets and liabilities that are most significantly affected by prices include analysis of asset carrying values, depreciation, reserves, and deferred income taxes. On at least an annual basis - and more frequently if circumstances warrant - we examine our depreciation rates, reserve estimates, and the valuation allowances on our deferred tax assets. We examine the carrying values of our assets as changes in facts and circumstances warrant. In our evaluation of carrying values and deferred taxes, we apply several pricing views to our forecasting model, including current prices, analyst price estimates, forward-curve prices, and historical prices (see Mineral Reserves, below, regarding prices used for reserve estimates). Using applicable accounting guidance and our view of metals markets, we use the probability-weighted average of the various methods to determine whether the values of our assets are fairly stated, and to determine the level of valuation allowances, if any, on our deferred tax assets. In addition, estimates of future metals prices are used in the valuation of certain assets in the determination of the purchase price allocations for our acquisitions (see Business Combinations below).
Sales of concentrates sold directly to customers are recorded as revenues when title and risk of loss transfer to the customer (generally at the time of shipment) at estimated forward metals prices for the estimated month of settlement. Due to the time elapsed between the time of shipment of concentrates to the customer and final settlement with the customer, we must estimate the prices at which sales of our metals will be settled. Previously recorded sales and trade accounts receivable are adjusted to estimated settlement metals prices until final settlement by the customer. Changes in metals prices between shipment and final settlement result in changes to revenues and accounts receivable previously recorded upon shipment. As a result, our trade accounts receivable balances related to concentrate sales are subject to changes in metals prices until final settlement occurs. For more information, see part N. Revenue Recognition of Note 1 of Notes to Consolidated Financial Statements in our annual report filed on Form 10-K for the year ended December 31, 2016.
We utilize financially-settled forward contracts to manage our exposure to changes in prices for silver, gold, zinc and lead. See Item 7A. Quantitative and Qualitative Disclosures About Market Risk - Commodity-Price Risk Management below for more information on our contract programs. These contracts do not qualify for hedge accounting and are therefore marked-to-market through earnings each period. Changes in silver, gold, zinc and lead prices between the dates that the contracts are entered into and their settlements will result in changes to the fair value asset or liability associated with the contracts, with a corresponding gain or loss recognized in earnings.
Obligations for Environmental, Reclamation and Closure Matters
Accrued reclamation and closure costs can represent a significant and variable liability on our balance sheet. We have estimated our liabilities under appropriate accounting guidance, and on at least an annual basis - and more frequently if warranted - management reviews our liabilities with our Audit Committee. However, the ranges of liability could exceed the liabilities recognized. If substantial damages were awarded, claims were settled, or remediation costs incurred in excess of our accruals, our financial results or condition could be materially adversely affected.
Mineral Reserves
Critical estimates are inherent in the process of determining our reserves. Our reserves are affected largely by our assessment of future metals prices, as well as by engineering and geological estimates of ore grade, accessibility and production cost. Metals prices are estimated at long-term averages, as described in Item 2. - Property Descriptions in our annual report filed on Form 10-K for the year ended December 31, 2016. Our assessment of reserves occurs at least annually, and periodically utilizes external audits.
Reserves are a key component in the valuation of our properties, plants and equipment. Reserve estimates are used in determining appropriate rates of units-of-production depreciation, with net book value of many assets depreciated over remaining estimated reserves. Reserves are also a key component in forecasts, with which we compare future cash flows to current asset values in an effort to ensure that carrying values are reported appropriately. Our forecasts are also used in determining the level of valuation allowances on our deferred tax assets. Reserves also play a key role in the valuation of certain assets in the determination of the purchase price allocations for acquisitions. Annual reserve estimates are also used to determine conversions of mineral assets beyond the known reserve resulting from business combinations to depreciable reserves, in periods subsequent to the business combinations (see Business Combinations below). Reserves are a culmination of many estimates and are not guarantees that we will recover the indicated quantities of metals or that we will do so at a profitable level.
Business Combinations
We are required to allocate the purchase price of acquired companies to the tangible and intangible assets acquired and liabilities assumed based on their estimated fair values at the acquisition date. The valuation of assets acquired and liabilities assumed requires management to make significant estimates and assumptions, especially with respect to long-lived assets (including mineral assets beyond the known reserve); these include estimates of future metals prices and mineral reserves, as discussed above. Management may also be required to make estimates related to the valuation of deferred tax assets or liabilities as part of the purchase price allocation for business combinations. In some cases, we use third-party appraisers to determine the fair values and lives of property and other identifiable assets. In addition, costs related to business combinations are included in earnings as incurred, and our financial results for periods in which business combinations are pursued could be adversely affected as a result.
Item 6. Exhibits
The following exhibits are filed as a part of this report:
|
31.1 |
Certification pursuant to Section 302 of the Sarbanes-Oxley Act of 2002. * |
|
31.2 |
Certification pursuant to Section 302 of the Sarbanes-Oxley Act of 2002. * |
|
32.1 |
Certification pursuant to Section 906 of the Sarbanes-Oxley Act of 2002. * |
|
32.2 |
Certification pursuant to Section 906 of the Sarbanes-Oxley Act of 2002. * |
* Filed herewith.
SIGNATURES
Pursuant to the requirements of the Securities Exchange Act of 1934, the registrant has duly caused this report to be signed on its behalf by the undersigned thereunto duly authorized.
|
HECLA MINING COMPANY | |||
|
(Registrant) | |||
|
Date: |
May 10, 2017 |
By: |
/s/ Phillips S. Baker, Jr. |
|
Phillips S. Baker, Jr., President, | |||
|
Chief Executive Officer and Director | |||
|
Date: |
May 10, 2017 |
By: |
/s/ Lindsay A. Hall |
|
Lindsay A. Hall, Senior Vice President and | |||
|
Chief Financial Officer | |||