Attached files
| file | filename |
|---|---|
| 8-K - 8-K - GOLDEN ENTERTAINMENT, INC. | gden-8k_20170510.htm |

Exhibit 99.1
Forward-Looking Statements This presentation includes forward-looking statements regarding future events and future results that are subject to the safe harbors created under the Securities Act of 1933 and the Securities Exchange Act of 1934, or the Exchange Act. Forward-looking statements can generally be identified by the use of words such as “anticipate,” “believe,” “continue,” “could,” “estimate,” “expect,” “forecast,” “intend,” “plan,” “project,” “seek,” “should,” “think,” “will,” “would” and similar expressions. In addition, forward-looking statements include statements regarding Golden Entertainment Inc.’s (referred to herein as “Golden,” “GDEN” and the “Company”) strategies, objectives, business opportunities and plans for future expansion, developments or acquisitions, anticipated future growth and trends in Golden’s business or key markets, projections of future financial condition, operating results, income, capital expenditures, costs or other financial items, anticipated regulatory and legislative changes, Golden’s ability to utilize its net operating loss carryforwards to offset future taxable income, as well as other statements that are not statements of historical fact. Forward-looking statements are based on Golden’s current expectations and assumptions regarding its business, the economy and other future conditions. These forward-looking statements are subject to assumptions, risks and uncertainties that may change at any time, and readers are therefore cautioned that actual results could differ materially from those expressed in any forward-looking statements. Factors that could cause actual results to differ include: the acquisitions of distributed gaming assets in Montana, and integration risks relating to such transactions, changes in national, regional and local economic and market conditions, legislative and regulatory matters (including the cost of compliance or failure to comply with applicable laws and regulations), increases in gaming taxes and fees in the jurisdictions in which Golden operates, litigation, increased competition, Golden’s ability to renew its distributed gaming contracts, reliance on key personnel (including Golden’s chief executive officer, chief operating officer, chief strategy officer and chief financial officer), the level of Golden’s indebtedness and Golden’s ability to comply with covenants in its debt instruments, terrorist incidents, natural disasters, severe weather conditions (including weather or road conditions that limit access to Golden’s properties), the effects of environmental and structural building conditions, the effects of disruptions to Golden’s information technology and other systems and infrastructure, the occurrence of an “ownership change” as defined in Section 382 of the Internal Revenue Code, and other factors affecting the gaming, entertainment and hospitality industries generally. In addition, please refer to the risk factors contained in Golden’s SEC filings available at www.sec.gov, including its most recent Annual Report on Form 10-K and Quarterly Report on Form 10-Q. Readers are cautioned not to place undue reliance on any forward-looking statements, which speak only as of May 9, 2017. Golden undertakes no obligation to revise or update any forward-looking statements for any reason. Financial Information and Non-GAAP Financial Measures All years represented in this presentation are fiscal years unless otherwise indicated. Previously, Golden’s fiscal year was the 52 or 53 weeks ending the Sunday closest to December 31 of the specified year. On October 28, 2015, Golden’s Board of Directors approved a change to a calendar year ending on December 31, effective as of the beginning of the third quarter of 2015. All information presented for quarterly or annualized periods, including for the last twelve months (“LTM”) ended March 37, 2017, is unaudited. This presentation includes combined financial information derived from the historical consolidated financial statements of Golden Entertainment, Inc. (which changed its name from Lakes Entertainment, Inc. in connection with the merger) and for the historical consolidated financial statements of Sartini Gaming for periods prior to the consummation of the merger. Combined financial information is presented for illustrative purposes only and does not purport to be indicative of what Golden’s actual business, financial condition or results of operations would have been had the Lakes Entertainment-Sartini Gaming merger been consummated at the beginning of the applicable period. The presentation of combined financial information does not conform to GAAP or the Securities and Exchange Commission (“SEC”) rules for pro forma presentations. This presentation includes non-GAAP financial measures to supplement financial information presented on a GAAP basis. Golden believes these measures are appropriate to enhance an overall understanding of its past financial performance and prospects for the future. The Company defines “Adjusted EBITDA” as earnings before interest and other non-operating income (expense), income, taxes, depreciation and amortization, preopening expenses, merger expenses, share-based compensation expenses, executive severance and sign-on bonuses, impairments and other gains and losses. However, the presentation of this additional information is not meant to be considered in isolation or as a substitute for measures of financial performance prepared in accordance with GAAP. A reconciliation between certain non-GAAP financial measures and the most comparable GAAP financial information is set forth in Appendix A. Reconciliations of Combined Net Revenues and Combined Adjusted EBITDA for each of 2013, 2014 and 2015 to the most comparable GAAP financial information are set forth in Appendix A to the Investor Presentation dated February 2017 located in the Investors section of the Company’s website at www.goldenent.com, and are incorporated herein by reference. Forward Looking Statements and Financial Information
Investment Highlights Market leader in distributed gaming with over 10,000 devices in nearly 1,000 locations Largest branded tavern operator in Nevada with a robust development and acquisition pipeline Capital structure to continue disciplined and accretive acquisition strategy Uniquely positioned with multiple paths to meaningful growth Well-positioned regional casinos with loyal, local customers 20-year track record in distributed gaming and casino operations
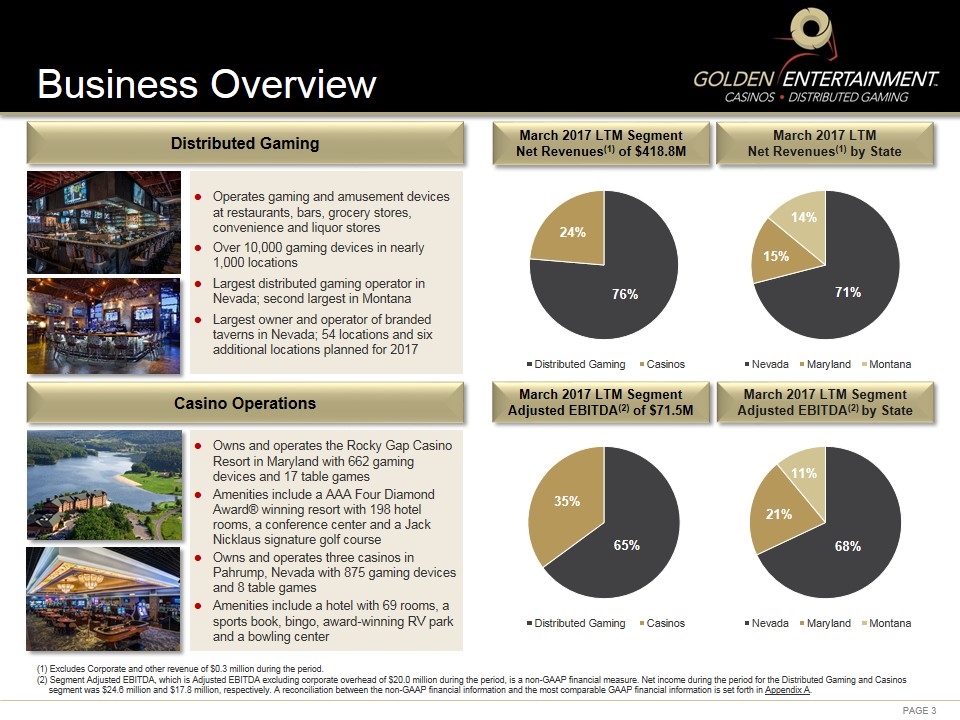
Casino Operations Business Overview Distributed Gaming Owns and operates the Rocky Gap Casino Resort in Maryland with 662 gaming devices and 17 table games Amenities include a AAA Four Diamond Award® winning resort with 198 hotel rooms, a conference center and a Jack Nicklaus signature golf course Owns and operates three casinos in Pahrump, Nevada with 875 gaming devices and 8 table games Amenities include a hotel with 69 rooms, a sports book, bingo, award-winning RV park and a bowling center (1) Excludes Corporate and other revenue of $0.3 million during the period. (2) Segment Adjusted EBITDA, which is Adjusted EBITDA excluding corporate overhead of $20.0 million during the period, is a non-GAAP financial measure. Net income during the period for the Distributed Gaming and Casinos segment was $24.6 million and $17.8 million, respectively. A reconciliation between the non-GAAP financial information and the most comparable GAAP financial information is set forth in Appendix A. March 2017 LTM Net Revenues(1) by State March 2017 LTM Segment Adjusted EBITDA(2) by State March 2017 LTM Segment Net Revenues(1) of $418.8M March 2017 LTM Segment Adjusted EBITDA(2) of $71.5M Operates gaming and amusement devices at restaurants, bars, grocery stores, convenience and liquor stores Over 10,000 gaming devices in nearly 1,000 locations Largest distributed gaming operator in Nevada; second largest in Montana Largest owner and operator of branded taverns in Nevada; 54 locations and six additional locations planned for 2017
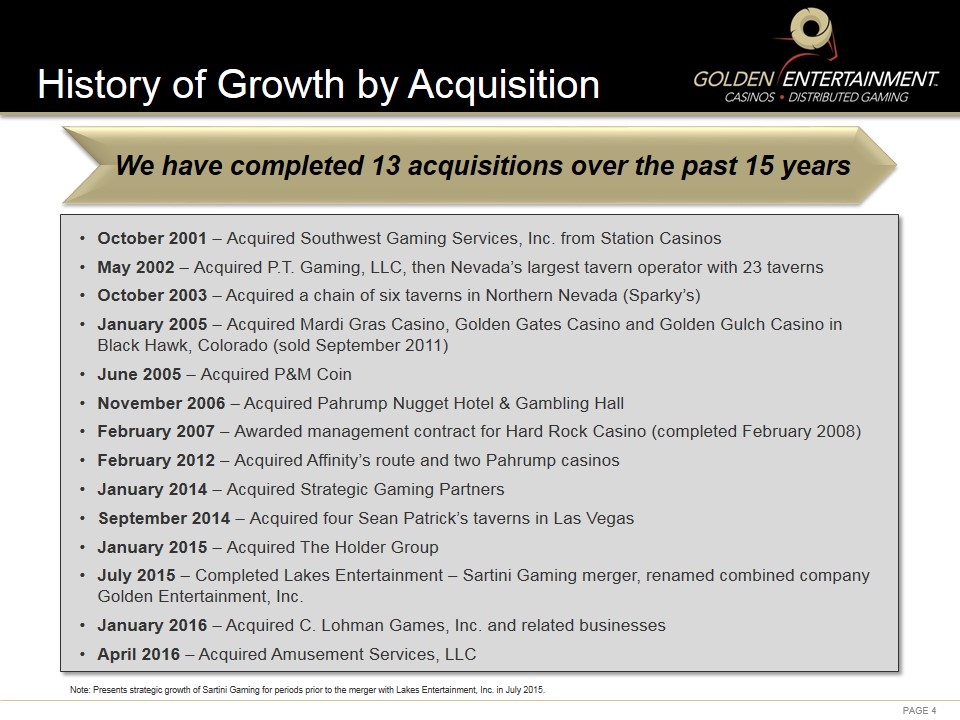
Note: Presents strategic growth of Sartini Gaming for periods prior to the merger with Lakes Entertainment, Inc. in July 2015. History of Growth by Acquisition October 2001 – Acquired Southwest Gaming Services, Inc. from Station Casinos May 2002 – Acquired P.T. Gaming, LLC, then Nevada’s largest tavern operator with 23 taverns October 2003 – Acquired a chain of six taverns in Northern Nevada (Sparky’s) January 2005 – Acquired Mardi Gras Casino, Golden Gates Casino and Golden Gulch Casino in Black Hawk, Colorado (sold September 2011) June 2005 – Acquired P&M Coin November 2006 – Acquired Pahrump Nugget Hotel & Gambling Hall February 2007 – Awarded management contract for Hard Rock Casino (completed February 2008) February 2012 – Acquired Affinity’s route and two Pahrump casinos January 2014 – Acquired Strategic Gaming Partners September 2014 – Acquired four Sean Patrick’s taverns in Las Vegas January 2015 – Acquired The Holder Group July 2015 – Completed Lakes Entertainment – Sartini Gaming merger, renamed combined company Golden Entertainment, Inc. January 2016 – Acquired C. Lohman Games, Inc. and related businesses April 2016 – Acquired Amusement Services, LLC We have completed 13 acquisitions over the past 15 years
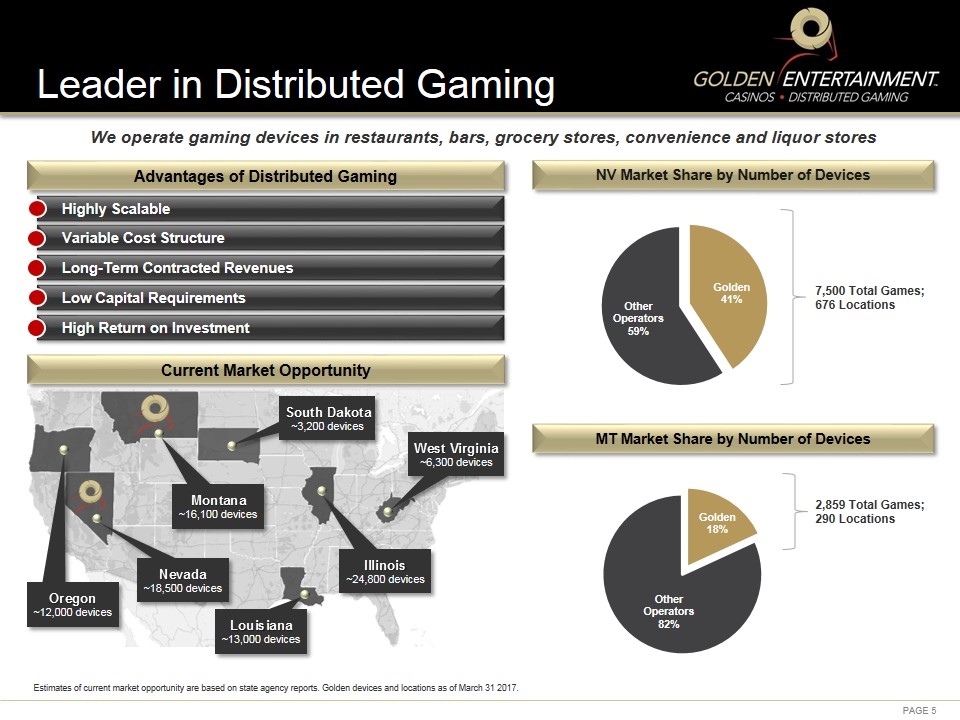
We operate gaming devices in restaurants, bars, grocery stores, convenience and liquor stores Leader in Distributed Gaming Advantages of Distributed Gaming Highly Scalable Variable Cost Structure Long-Term Contracted Revenues Low Capital Requirements High Return on Investment Current Market Opportunity Nevada ~18,500 devices Oregon ~12,000 devices Louisiana ~13,000 devices West Virginia ~6,300 devices Illinois ~24,800 devices South Dakota ~3,200 devices Montana ~16,100 devices Estimates of current market opportunity are based on state agency reports. Golden devices and locations as of March 31 2017. 2,859 Total Games; 290 Locations NV Market Share by Number of Devices 7,500 Total Games; 676 Locations MT Market Share by Number of Devices
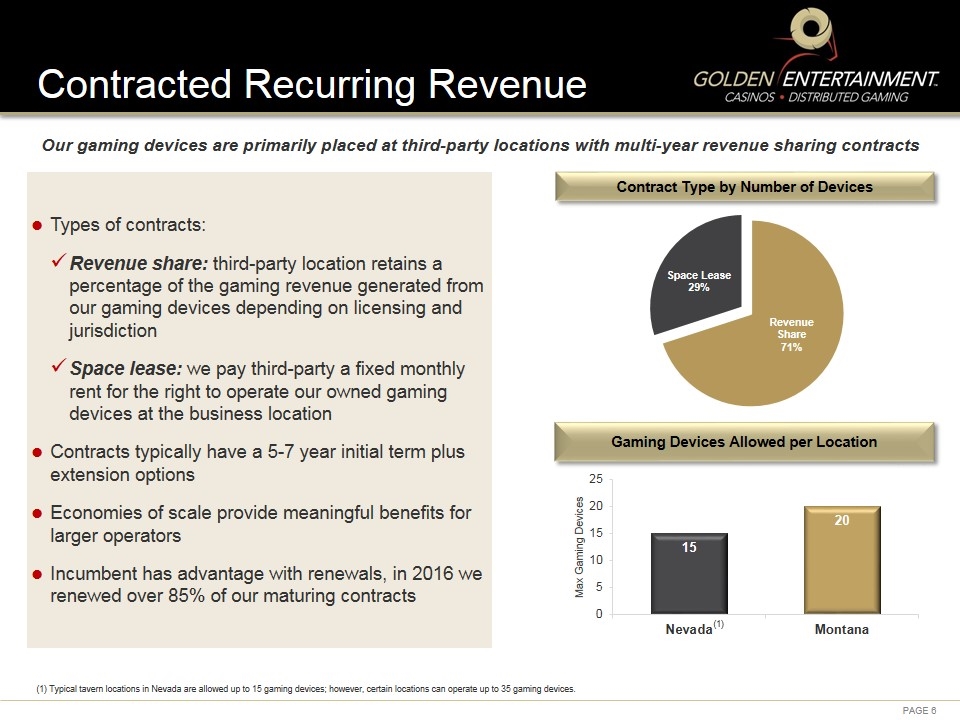
Contract Type by Number of Devices Contracted Recurring Revenue Our gaming devices are primarily placed at third-party locations with multi-year revenue sharing contracts Gaming Devices Allowed per Location Types of contracts: Revenue share: third-party location retains a percentage of the gaming revenue generated from our gaming devices depending on licensing and jurisdiction Space lease: we pay third-party a fixed monthly rent for the right to operate our owned gaming devices at the business location Contracts typically have a 5-7 year initial term plus extension options Economies of scale provide meaningful benefits for larger operators Incumbent has advantage with renewals, in 2016 we renewed over 85% of our maturing contracts (1) Typical tavern locations in Nevada are allowed up to 15 gaming devices; however, certain locations can operate up to 35 gaming devices. (1)
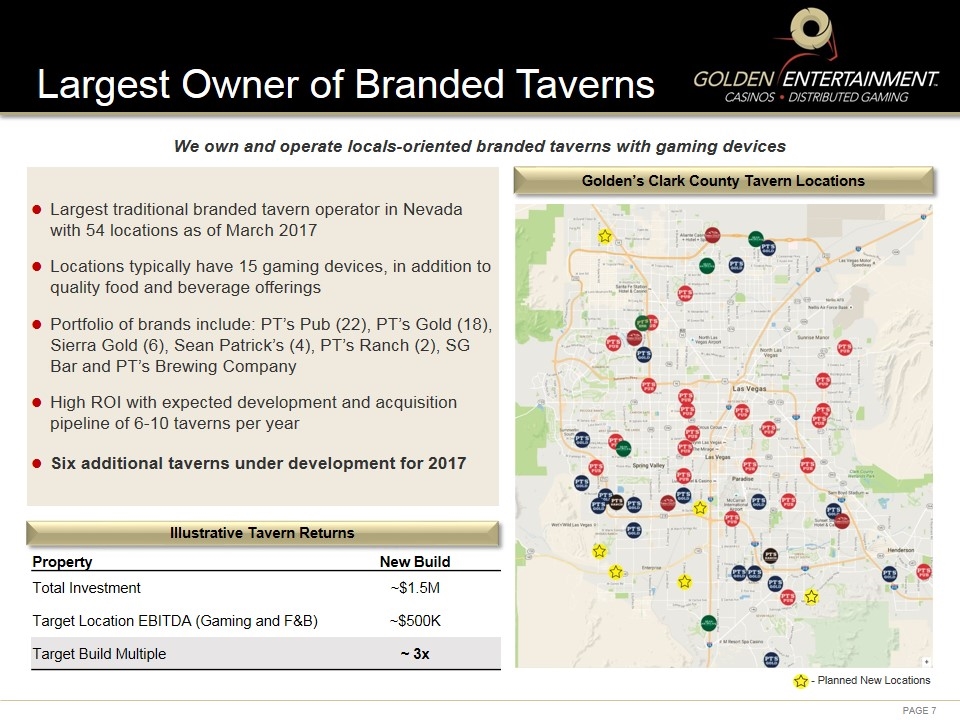
Largest Owner of Branded Taverns Golden’s Clark County Tavern Locations - Planned New Locations Property New Build Total Investment ~$1.5M Target Location EBITDA (Gaming and F&B) ~$500K Target Build Multiple ~ 3x Illustrative Tavern Returns We own and operate locals-oriented branded taverns with gaming devices Largest traditional branded tavern operator in Nevada with 54 locations as of March 2017 Locations typically have 15 gaming devices, in addition to quality food and beverage offerings Portfolio of brands include: PT’s Pub (22), PT’s Gold (18), Sierra Gold (6), Sean Patrick’s (4), PT’s Ranch (2), SG Bar and PT’s Brewing Company High ROI with expected development and acquisition pipeline of 6-10 taverns per year Six additional taverns under development for 2017
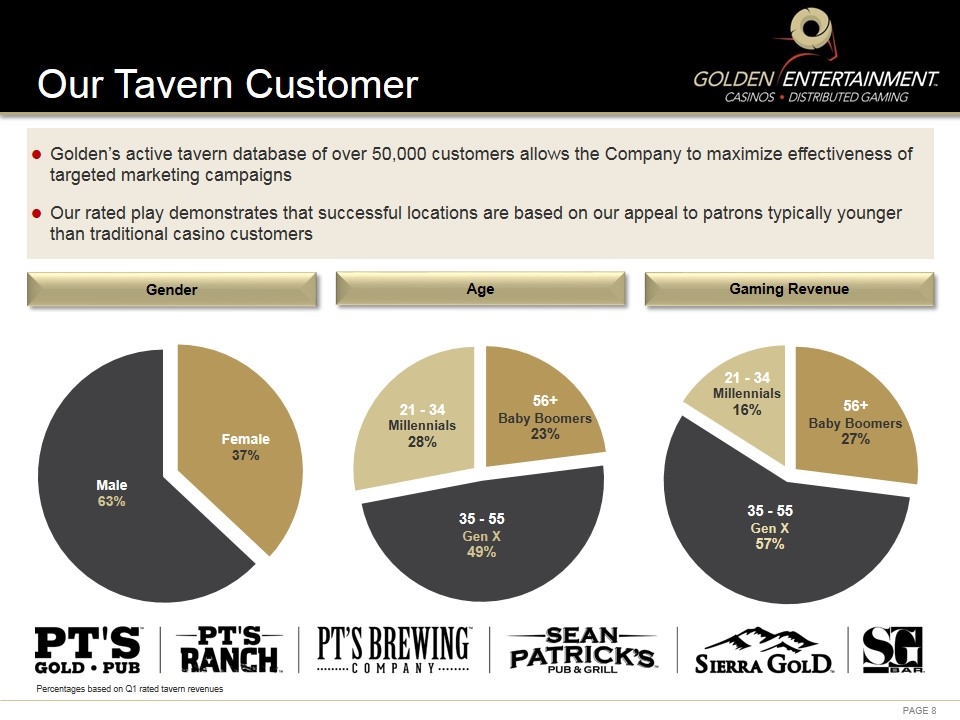
Our Tavern Customer Gender Age Gaming Revenue Golden’s active tavern database of over 50,000 customers allows the Company to maximize effectiveness of targeted marketing campaigns Our rated play demonstrates that successful locations are based on our appeal to patrons typically younger than traditional casino customers Percentages based on Q1 rated tavern revenues
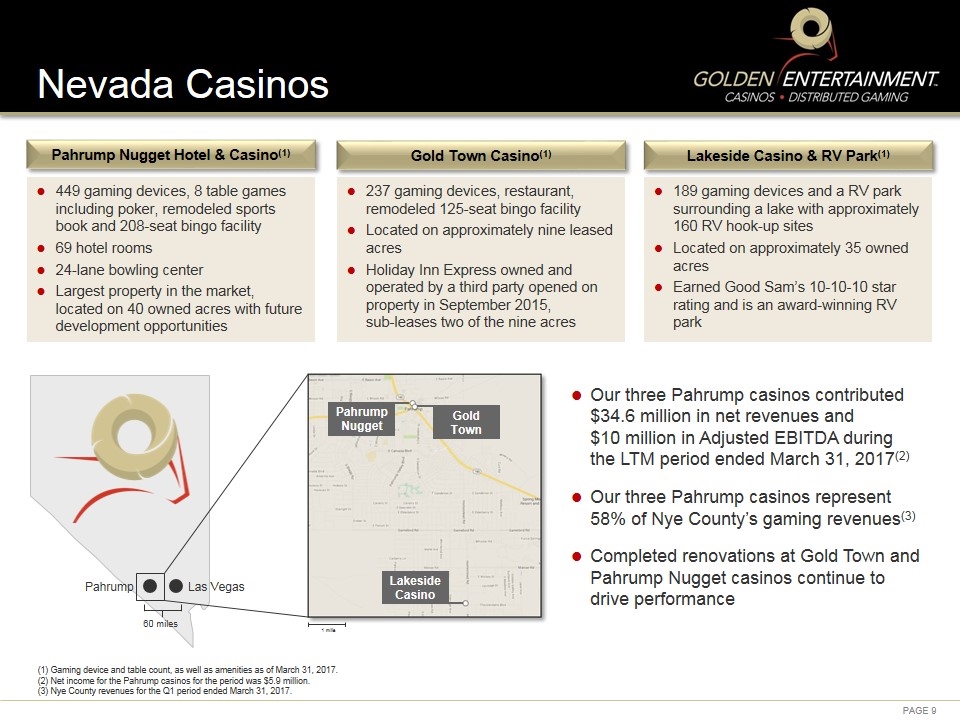
Nevada Casinos 449 gaming devices, 8 table games including poker, remodeled sports book and 208-seat bingo facility 69 hotel rooms 24-lane bowling center Largest property in the market, located on 40 owned acres with future development opportunities Pahrump Nugget Hotel & Casino(1) Gold Town Casino(1) Lakeside Casino & RV Park(1) 189 gaming devices and a RV park surrounding a lake with approximately 160 RV hook-up sites Located on approximately 35 owned acres Earned Good Sam’s 10-10-10 star rating and is an award-winning RV park 1 mile Pahrump Nugget Gold Town Lakeside Casino Pahrump Las Vegas 60 miles 237 gaming devices, restaurant, remodeled 125-seat bingo facility Located on approximately nine leased acres Holiday Inn Express owned and operated by a third party opened on property in September 2015, sub-leases two of the nine acres Our three Pahrump casinos contributed $34.6 million in net revenues and $10 million in Adjusted EBITDA during the LTM period ended March 31, 2017(2) Our three Pahrump casinos represent 58% of Nye County’s gaming revenues(3) Completed renovations at Gold Town and Pahrump Nugget casinos continue to drive performance (1) Gaming device and table count, as well as amenities as of March 31, 2017. (2) Net income for the Pahrump casinos for the period was $5.9 million. (3) Nye County revenues for the Q1 period ended March 31, 2017.
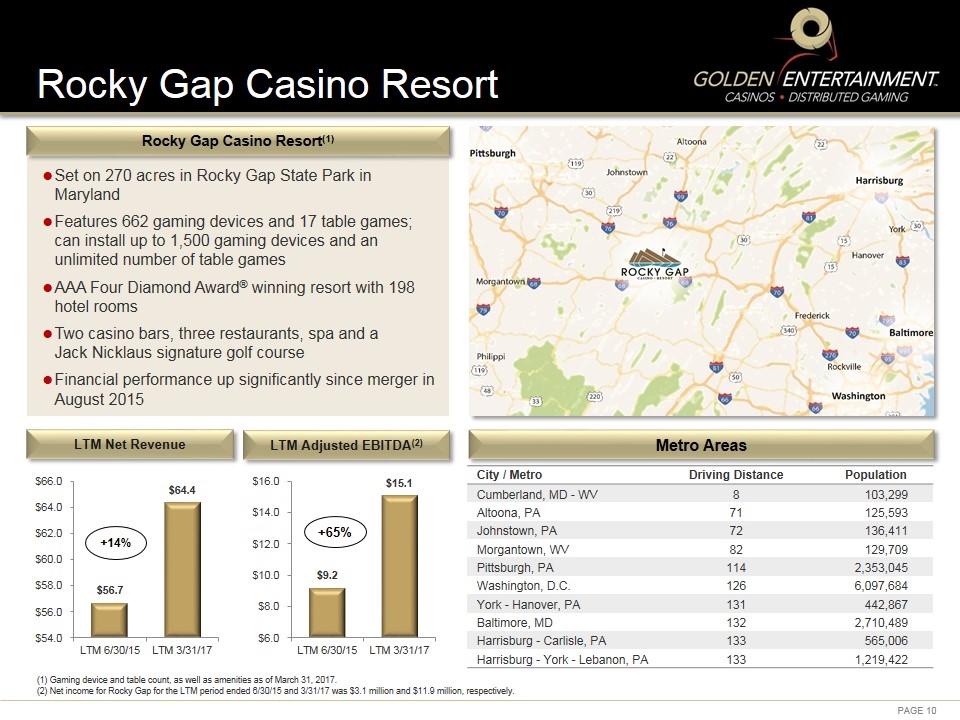
Rocky Gap Casino Resort Rocky Gap Casino Resort(1) City / Metro Driving Distance Population Cumberland, MD - WV 8 103,299 Altoona, PA 71 125,593 Johnstown, PA 72 136,411 Morgantown, WV 82 129,709 Pittsburgh, PA 114 2,353,045 Washington, D.C. 126 6,097,684 York - Hanover, PA 131 442,867 Baltimore, MD 132 2,710,489 Harrisburg - Carlisle, PA 133 565,006 Harrisburg - York - Lebanon, PA 133 1,219,422 Metro Areas (1) Gaming device and table count, as well as amenities as of March 31, 2017. (2) Net income for Rocky Gap for the LTM period ended 6/30/15 and 3/31/17 was $3.1 million and $11.9 million, respectively. Set on 270 acres in Rocky Gap State Park in Maryland Features 662 gaming devices and 17 table games; can install up to 1,500 gaming devices and an unlimited number of table games AAA Four Diamond Award® winning resort with 198 hotel rooms Two casino bars, three restaurants, spa and a Jack Nicklaus signature golf course Financial performance up significantly since merger in August 2015 LTM Net Revenue LTM Adjusted EBITDA(2) +14% +65%
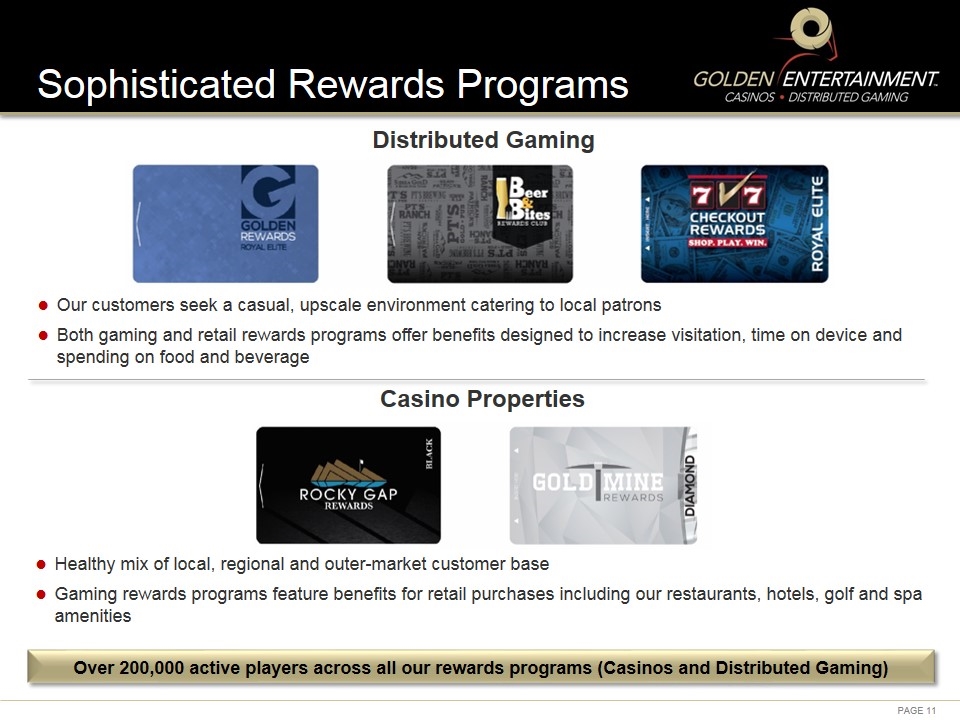
Casino Properties Healthy mix of local, regional and outer-market customer base Gaming rewards programs feature benefits for retail purchases including our restaurants, hotels, golf and spa amenities Sophisticated Rewards Programs Distributed Gaming Our customers seek a casual, upscale environment catering to local patrons Both gaming and retail rewards programs offer benefits designed to increase visitation, time on device and spending on food and beverage Over 200,000 active players across all our rewards programs (Casinos and Distributed Gaming)
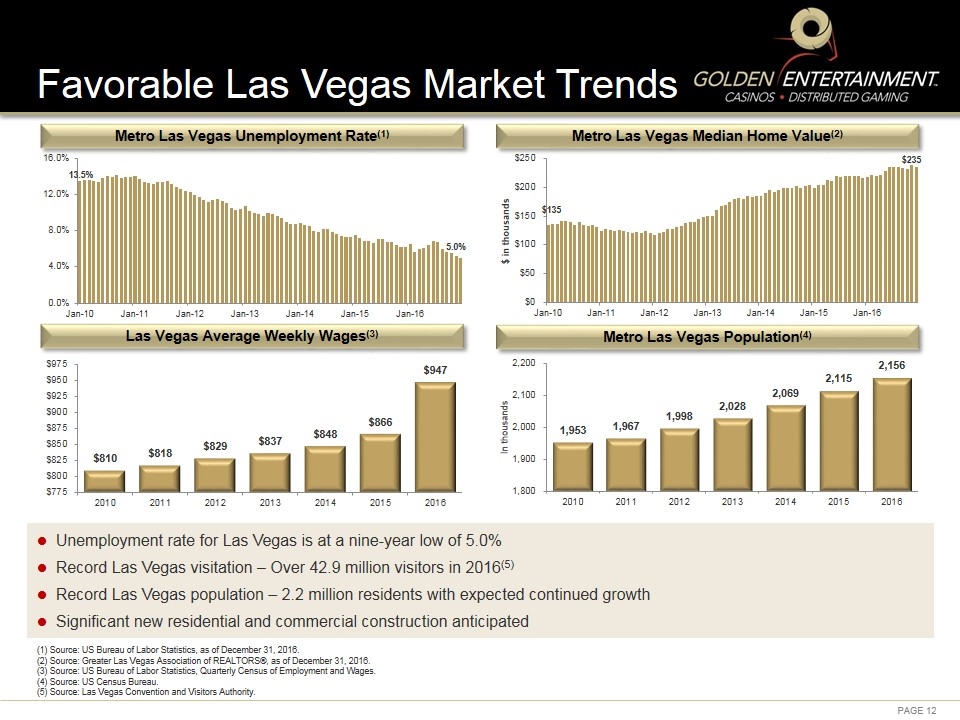
(1) Source: US Bureau of Labor Statistics, as of December 31, 2016. (2) Source: Greater Las Vegas Association of REALTORS®, as of December 31, 2016. (3) Source: US Bureau of Labor Statistics, Quarterly Census of Employment and Wages. (4) Source: US Census Bureau. (5) Source: Las Vegas Convention and Visitors Authority. Favorable Las Vegas Market Trends Metro Las Vegas Unemployment Rate(1) Metro Las Vegas Median Home Value(2) Metro Las Vegas Population(4) Las Vegas Average Weekly Wages(3) Unemployment rate for Las Vegas is at a nine-year low of 5.0% Record Las Vegas visitation – Over 42.9 million visitors in 2016(5) Record Las Vegas population – 2.2 million residents with expected continued growth Significant new residential and commercial construction anticipated 13.5% 5.0% $135 $235
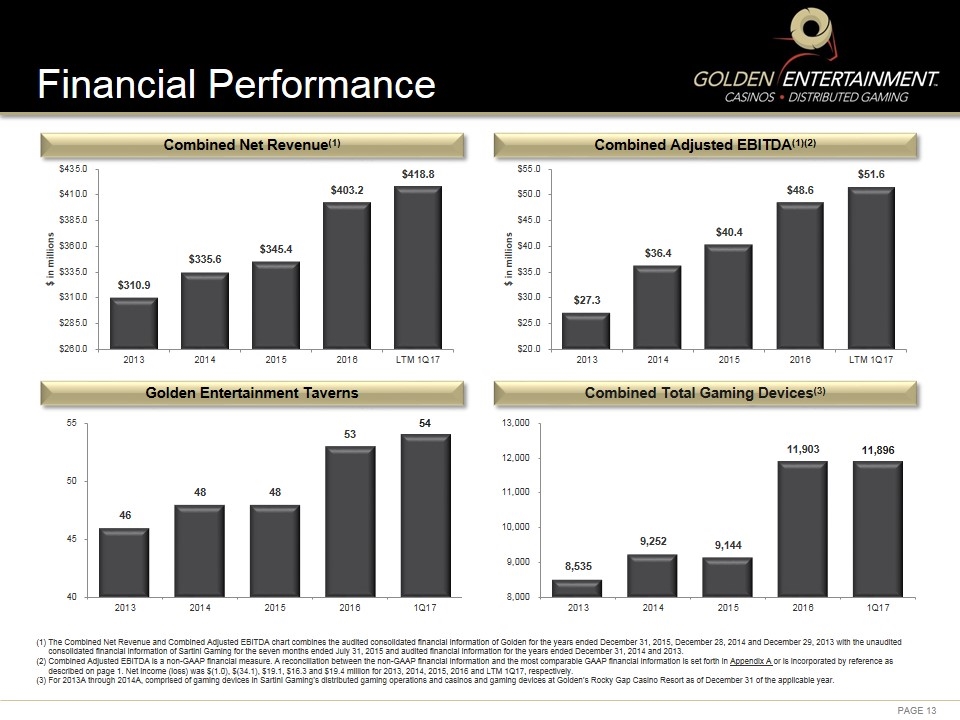
Financial Performance Combined Net Revenue(1) Combined Adjusted EBITDA(1)(2) Golden Entertainment Taverns (1) The Combined Net Revenue and Combined Adjusted EBITDA chart combines the audited consolidated financial information of Golden for the years ended December 31, 2015, December 28, 2014 and December 29, 2013 with the unaudited consolidated financial information of Sartini Gaming for the seven months ended July 31, 2015 and audited financial information for the years ended December 31, 2014 and 2013. (2) Combined Adjusted EBITDA is a non-GAAP financial measure. A reconciliation between the non-GAAP financial information and the most comparable GAAP financial information is set forth in Appendix A or is incorporated by reference as described on page 1. Net income (loss) was $(1.0), $(34.1), $19.1, $16.3 and $19.4 million for 2013, 2014, 2015, 2016 and LTM 1Q17, respectively. (3) For 2013A through 2014A, comprised of gaming devices in Sartini Gaming’s distributed gaming operations and casinos and gaming devices at Golden’s Rocky Gap Casino Resort as of December 31 of the applicable year. Combined Total Gaming Devices(3)
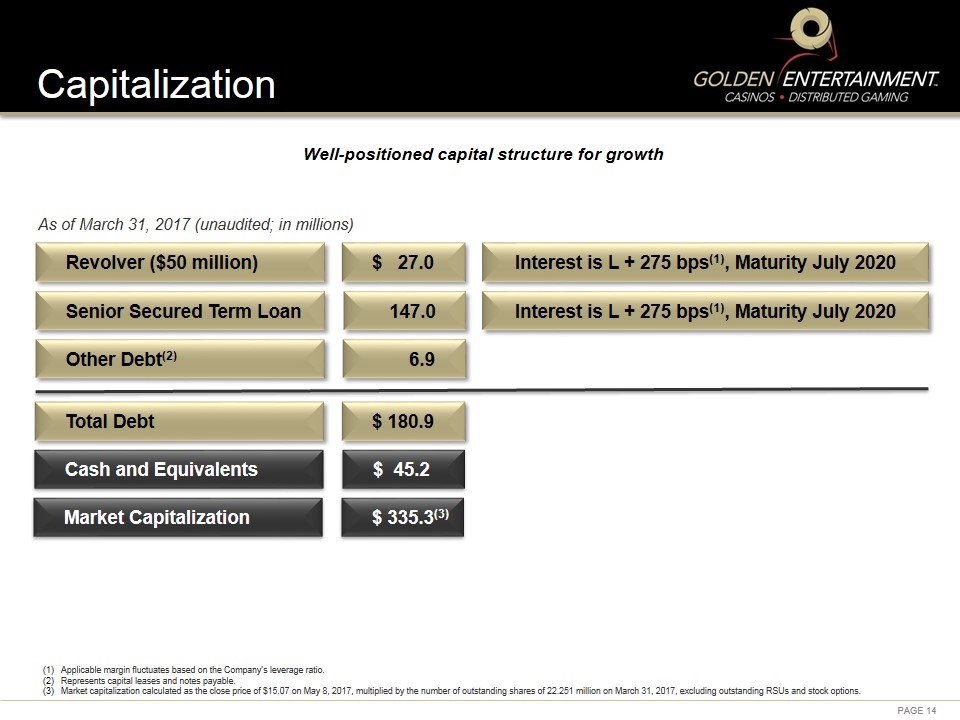
Capitalization Cash and Equivalents Revolver ($50 million) $ 27.0 Interest is L + 275 bps(1), Maturity July 2020 Senior Secured Term Loan 147.0 Interest is L + 275 bps(1), Maturity July 2020 Total Debt As of March 31, 2017 (unaudited; in millions) Other Debt(2) Market Capitalization $ 335.3(3) Well-positioned capital structure for growth $ 45.2 Applicable margin fluctuates based on the Company’s leverage ratio. Represents capital leases and notes payable. Market capitalization calculated as the close price of $15.07 on May 8, 2017, multiplied by the number of outstanding shares of 22.251 million on March 31, 2017, excluding outstanding RSUs and stock options. $ 180.9 6.9
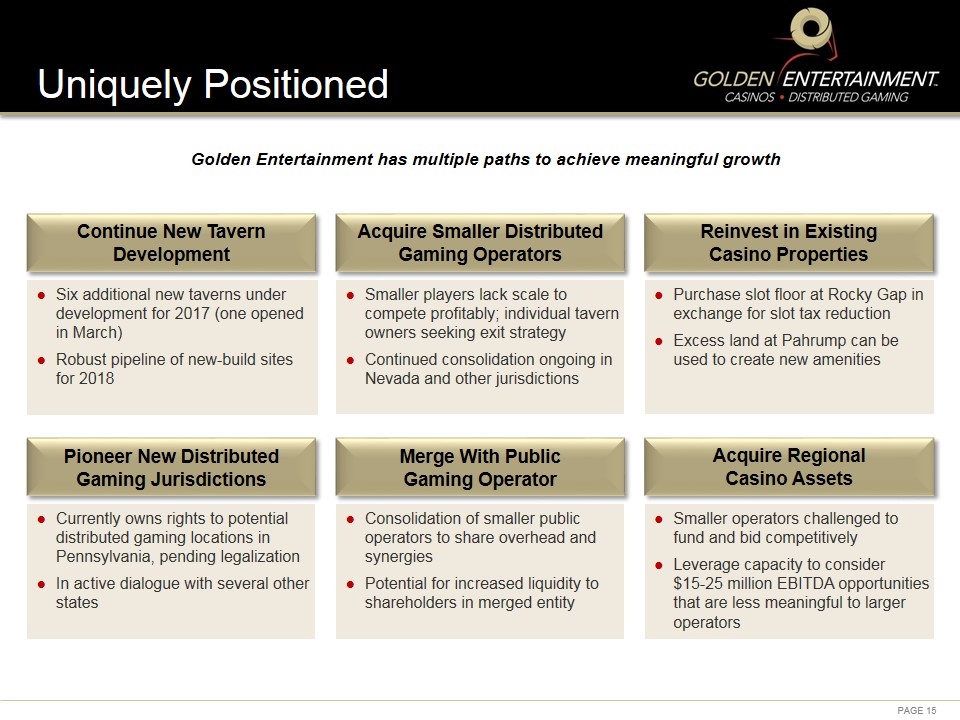
Uniquely Positioned Six additional new taverns under development for 2017 (one opened in March) Robust pipeline of new-build sites for 2018 Smaller players lack scale to compete profitably; individual tavern owners seeking exit strategy Continued consolidation ongoing in Nevada and other jurisdictions Purchase slot floor at Rocky Gap in exchange for slot tax reduction Excess land at Pahrump can be used to create new amenities Continue New Tavern Development Acquire Smaller Distributed Gaming Operators Reinvest in Existing Casino Properties Pioneer New Distributed Gaming Jurisdictions Merge With Public Gaming Operator Acquire Regional Casino Assets Currently owns rights to potential distributed gaming locations in Pennsylvania, pending legalization In active dialogue with several other states Consolidation of smaller public operators to share overhead and synergies Potential for increased liquidity to shareholders in merged entity Smaller operators challenged to fund and bid competitively Leverage capacity to consider $15-25 million EBITDA opportunities that are less meaningful to larger operators Golden Entertainment has multiple paths to achieve meaningful growth
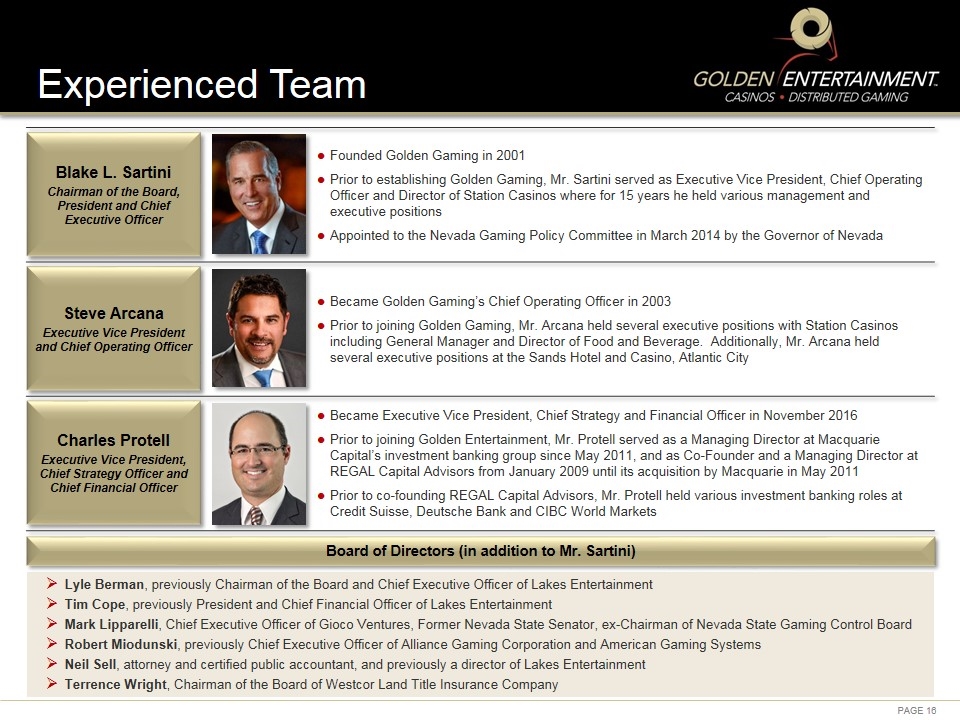
Founded Golden Gaming in 2001 Prior to establishing Golden Gaming, Mr. Sartini served as Executive Vice President, Chief Operating Officer and Director of Station Casinos where for 15 years he held various management and executive positions Appointed to the Nevada Gaming Policy Committee in March 2014 by the Governor of Nevada Became Golden Gaming’s Chief Operating Officer in 2003 Prior to joining Golden Gaming, Mr. Arcana held several executive positions with Station Casinos including General Manager and Director of Food and Beverage. Additionally, Mr. Arcana held several executive positions at the Sands Hotel and Casino, Atlantic City Became Executive Vice President, Chief Strategy and Financial Officer in November 2016 Prior to joining Golden Entertainment, Mr. Protell served as a Managing Director at Macquarie Capital’s investment banking group since May 2011, and as Co-Founder and a Managing Director at REGAL Capital Advisors from January 2009 until its acquisition by Macquarie in May 2011 Prior to co-founding REGAL Capital Advisors, Mr. Protell held various investment banking roles at Credit Suisse, Deutsche Bank and CIBC World Markets Experienced Team Board of Directors (in addition to Mr. Sartini) Lyle Berman, previously Chairman of the Board and Chief Executive Officer of Lakes Entertainment Tim Cope, previously President and Chief Financial Officer of Lakes Entertainment Mark Lipparelli, Chief Executive Officer of Gioco Ventures, Former Nevada State Senator, ex-Chairman of Nevada State Gaming Control Board Robert Miodunski, previously Chief Executive Officer of Alliance Gaming Corporation and American Gaming Systems Neil Sell, attorney and certified public accountant, and previously a director of Lakes Entertainment Terrence Wright, Chairman of the Board of Westcor Land Title Insurance Company Blake L. Sartini Chairman of the Board, President and Chief Executive Officer Steve Arcana Executive Vice President and Chief Operating Officer Charles Protell Executive Vice President, Chief Strategy Officer and Chief Financial Officer
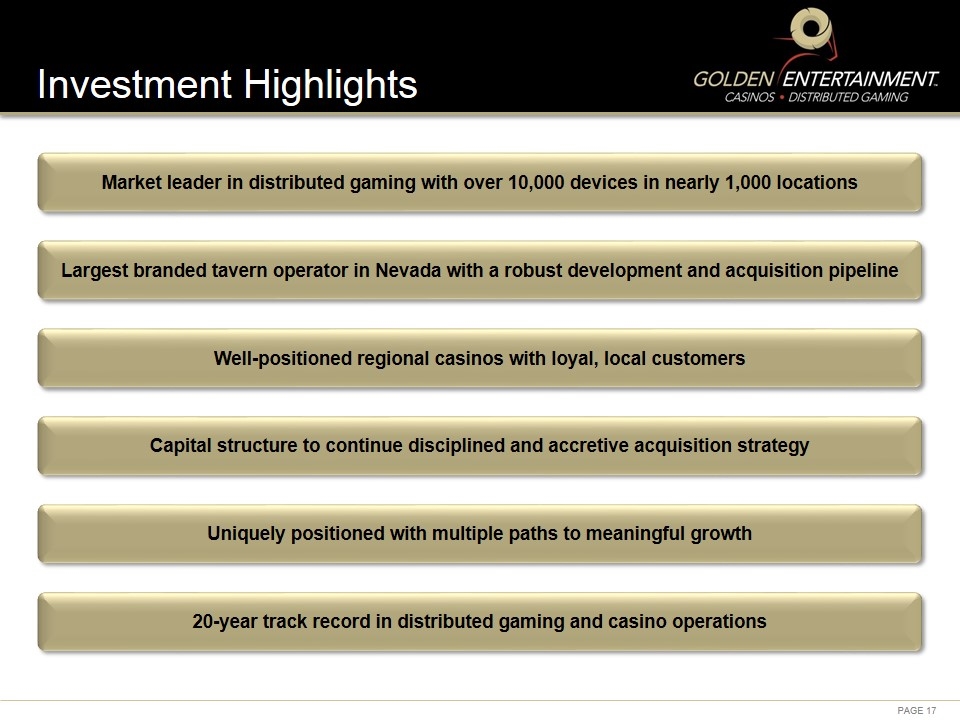
Investment Highlights Market leader in distributed gaming with over 10,000 devices in nearly 1,000 locations Largest branded tavern operator in Nevada with a robust development and acquisition pipeline Capital structure to continue disciplined and accretive acquisition strategy Uniquely positioned with multiple paths to meaningful growth Well-positioned regional casinos with loyal, local customers 20-year track record in distributed gaming and casino operations
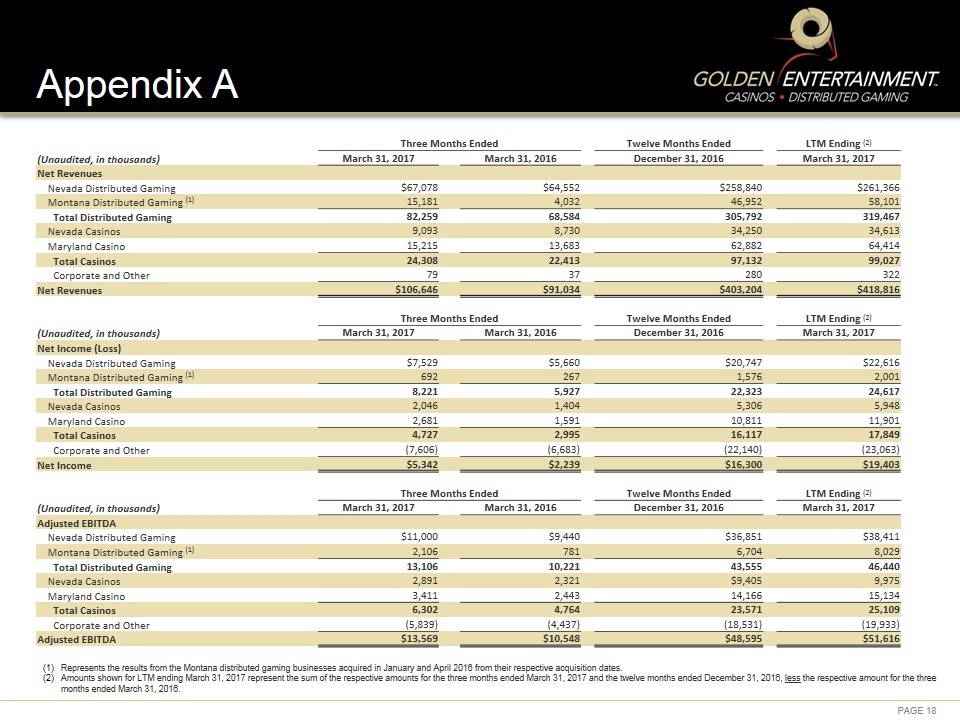
Appendix A Three Months Ended Twelve Months Ended LTM Ending (2) (Unaudited, in thousands) March 31, 2017 March 31, 2016 December 31, 2016 March 31, 2017 Net Revenues Nevada Distributed Gaming $67,078 $64,552 $258,840 $261,366 Montana Distributed Gaming (1) 15,181 4,032 46,952 58,101 Total Distributed Gaming 82,259 68,584 305,792 319,467 Nevada Casinos 9,093 8,730 34,250 34,613 Maryland Casino 15,215 13,683 62,882 64,414 Total Casinos 24,308 22,413 97,132 99,027 Corporate and Other 79 37 280 322 Net Revenues $106,646 $91,034 $403,204 $418,816 Three Months Ended Twelve Months Ended LTM Ending (2) (Unaudited, in thousands) March 31, 2017 March 31, 2016 December 31, 2016 March 31, 2017 Net Income (Loss) Nevada Distributed Gaming $7,529 $5,660 $20,747 $22,616 Montana Distributed Gaming (1) 692 267 1,576 2,001 Total Distributed Gaming 8,221 5,927 22,323 24,617 Nevada Casinos 2,046 1,404 5,306 5,948 Maryland Casino 2,681 1,591 10,811 11,901 Total Casinos 4,727 2,995 16,117 17,849 Corporate and Other (7,606) (6,683) (22,140) (23,063) Net Income $5,342 $2,239 $16,300 $19,403 Three Months Ended Twelve Months Ended LTM Ending (2) (Unaudited, in thousands) March 31, 2017 March 31, 2016 December 31, 2016 March 31, 2017 Adjusted EBITDA Nevada Distributed Gaming $11,000 $9,440 $36,851 $38,411 Montana Distributed Gaming (1) 2,106 781 6,704 8,029 Total Distributed Gaming 13,106 10,221 43,555 46,440 Nevada Casinos 2,891 2,321 $9,405 9,975 Maryland Casino 3,411 2,443 14,166 15,134 Total Casinos 6,302 4,764 23,571 25,109 Corporate and Other (5,839) (4,437) (18,531) (19,933) Adjusted EBITDA $13,569 $10,548 $48,595 $51,616 Represents the results from the Montana distributed gaming businesses acquired in January and April 2016 from their respective acquisition dates. Amounts shown for LTM ending March 31, 2017 represent the sum of the respective amounts for the three months ended March 31, 2017 and the twelve months ended December 31, 2016, less the respective amount for the three months ended March 31, 2016.
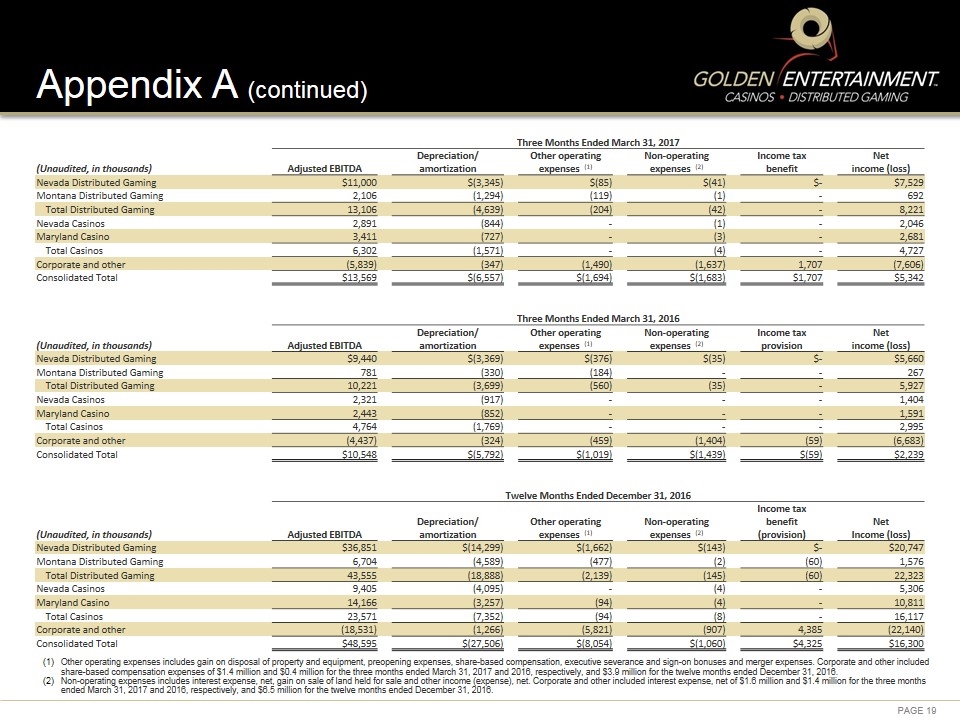
Appendix A (continued) Three Months Ended March 31, 2017 (Unaudited, in thousands) Adjusted EBITDA Depreciation/ amortization Other operating expenses (1) Non-operating expenses (2) Income tax benefit Net income (loss) Nevada Distributed Gaming $11,000 $(3,345) $(85) $(41) $- $7,529 Montana Distributed Gaming 2,106 (1,294) (119) (1) - 692 Total Distributed Gaming 13,106 (4,639) (204) (42) - 8,221 Nevada Casinos 2,891 (844) - (1) - 2,046 Maryland Casino 3,411 (727) - (3) - 2,681 Total Casinos 6,302 (1,571) - (4) - 4,727 Corporate and other (5,839) (347) (1,490) (1,637) 1,707 (7,606) Consolidated Total $13,569 $(6,557) $(1,694) $(1,683) $1,707 $5,342 Three Months Ended March 31, 2016 (Unaudited, in thousands) Adjusted EBITDA Depreciation/ amortization Other operating expenses (1) Non-operating expenses (2) Income tax provision Net income (loss) Nevada Distributed Gaming $9,440 $(3,369) $(376) $(35) $- $5,660 Montana Distributed Gaming 781 (330) (184) - - 267 Total Distributed Gaming 10,221 (3,699) (560) (35) - 5,927 Nevada Casinos 2,321 (917) - - - 1,404 Maryland Casino 2,443 (852) - - - 1,591 Total Casinos 4,764 (1,769) - - - 2,995 Corporate and other (4,437) (324) (459) (1,404) (59) (6,683) Consolidated Total $10,548 $(5,792) $(1,019) $(1,439) $(59) $2,239 Twelve Months Ended December 31, 2016 (Unaudited, in thousands) Adjusted EBITDA Depreciation/ amortization Other operating expenses (1) Non-operating expenses (2) Income tax benefit (provision) Net Income (loss) Nevada Distributed Gaming $36,851 $(14,299) $(1,662) $(143) $- $20,747 Montana Distributed Gaming 6,704 (4,589) (477) (2) (60) 1,576 Total Distributed Gaming 43,555 (18,888) (2,139) (145) (60) 22,323 Nevada Casinos 9,405 (4,095) - (4) - 5,306 Maryland Casino 14,166 (3,257) (94) (4) - 10,811 Total Casinos 23,571 (7,352) (94) (8) - 16,117 Corporate and other (18,531) (1,266) (5,821) (907) 4,385 (22,140) Consolidated Total $48,595 $(27,506) $(8,054) $(1,060) $4,325 $16,300 Other operating expenses includes gain on disposal of property and equipment, preopening expenses, share-based compensation, executive severance and sign-on bonuses and merger expenses. Corporate and other included share-based compensation expenses of $1.4 million and $0.4 million for the three months ended March 31, 2017 and 2016, respectively, and $3.9 million for the twelve months ended December 31, 2016. Non-operating expenses includes interest expense, net, gain on sale of land held for sale and other income (expense), net. Corporate and other included interest expense, net of $1.6 million and $1.4 million for the three months ended March 31, 2017 and 2016, respectively, and $6.5 million for the twelve months ended December 31, 2016.
