Attached files
| file | filename |
|---|---|
| 8-K - 8-K - Tronox Holdings plc | form8k.htm |
Exhibit 99.1

Wells Fargo Industrials Conference May 9, 2017

Safe Harbor Statement Additional Information and Where to Find ItThis communication shall not constitute an offer to sell or the solicitation of an offer to buy any securities, or a solicitation of any vote or approval. In connection with the Transaction Agreement, by and between Tronox Limited (the “Company”), The National Titanium Dioxide Company (“Cristal”) and Cristal Inorganic Chemicals Netherlands Coöperatief W.A. (the “Transaction”), the Company intends to file relevant materials with the U.S. Securities and Exchange Commission (“SEC”), including a proxy statement. Investors and Securityholders are urged to read the proxy statement (including all amendments and supplements thereto) and all other relevant documents regarding the proposed Transaction filed with the SEC or sent to shareholders as they become available as they will contain important information about the Transaction. You may obtain a free copy of the proxy statement (if and when it becomes available) and other relevant documents filed by the Company with the SEC at the SEC’s website at www.sec.gov. Copies of documents filed by the Company with the SEC will be available free of charge on the Company’s website at www.tronox.com or by contacting the Company’s Investor Relations at +1.203.705.3722. Certain Information Regarding ParticipantsThe Company, Cristal and their respective directors and executive officers may be deemed to be participants in the solicitation of proxies in respect of the Transaction. You can find information about the Company’s directors and executive officers in the Company’s definitive annual proxy statement filed with the SEC on March 16, 2017. Additional information regarding the interests of such potential participants will be included in the proxy statement regarding the Transaction and other relevant documents filed with the SEC. 1

Safe Harbor Statement Forward-Looking Statements Statements in this presentation that are not historical are forward-looking statements within the meaning of the U.S. Private Securities Litigation Reform Act of 1995. These forward-looking statements are based upon management’s current beliefs and expectations and are subject to uncertainty and changes in circumstances and contain words such as “believe,” “intended,” “expect,” and “anticipate,” and include statements about expectations for future results. The forward-looking statements involve risks that may affect the company’s operations, markets, products, services, prices and other risk factors discussed in the Company’s filings with the SEC, including those under the heading entitled “Risk Factors” in our Annual Report on Form 10-K for the year ended December 31, 2016. Significant risks and uncertainties may relate to, but are not limited to, the risk that the Transaction will not close, including by failure to obtain shareholder approval, failure to obtain any necessary financing or the failure to satisfy other closing conditions under the Transaction Agreement or by the termination of the Transaction Agreement; failure to plan and manage the Transaction effectively and efficiently; the risk that a regulatory approval that may be required for the Transaction is delayed, is not obtained or is obtained subject to conditions that are not anticipated; the risk that expected synergies will not be realized or will not be realized within the expected time period; unanticipated increases in financing and other costs, including a rise in interest rates; reduced access to unrestricted cash; compliance with our bank facility covenants; the price of our shares; general market conditions; our customers potentially reducing their demand for our products; more competitive pricing from our competitors or increased supply from our competitors; operating efficiencies and other benefits expected from the Transaction. Neither the Company’s investors and securityholders nor any other person should place undue reliance on these forward-looking statements. Unless otherwise required by applicable laws, the Company undertakes no obligations to update or revise any forward-looking statements, whether as a result of new information or future developments.All reconciliations to GAAP of non-GAAP financial measures used in this presentation can be found in the tables accompanying Tronox’s press releases issued February 21, 2017 and May 4, 2017. 2
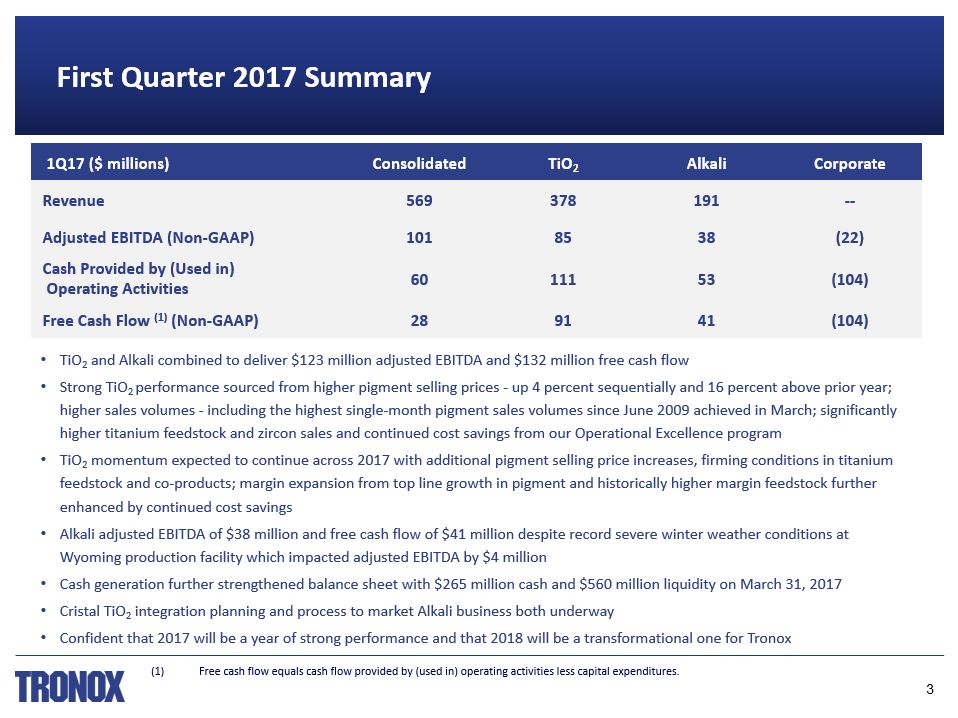
First Quarter 2017 Summary TiO2 and Alkali combined to deliver $123 million adjusted EBITDA and $132 million free cash flow Strong TiO2 performance sourced from higher pigment selling prices - up 4 percent sequentially and 16 percent above prior year; higher sales volumes - including the highest single-month pigment sales volumes since June 2009 achieved in March; significantly higher titanium feedstock and zircon sales and continued cost savings from our Operational Excellence program TiO2 momentum expected to continue across 2017 with additional pigment selling price increases, firming conditions in titanium feedstock and co-products; margin expansion from top line growth in pigment and historically higher margin feedstock further enhanced by continued cost savingsAlkali adjusted EBITDA of $38 million and free cash flow of $41 million despite record severe winter weather conditions at Wyoming production facility which impacted adjusted EBITDA by $4 millionCash generation further strengthened balance sheet with $265 million cash and $560 million liquidity on March 31, 2017Cristal TiO2 integration planning and process to market Alkali business both underwayConfident that 2017 will be a year of strong performance and that 2018 will be a transformational one for Tronox 1Q17 ($ millions) Consolidated TiO2 Alkali Corporate Revenue 569 378 191 -- Adjusted EBITDA (Non-GAAP) 101 85 38 (22) Cash Provided by (Used in) Operating Activities 60 111 53 (104) Free Cash Flow (1) (Non-GAAP) 28 91 41 (104) 3 (1) Free cash flow equals cash flow provided by (used in) operating activities less capital expenditures.
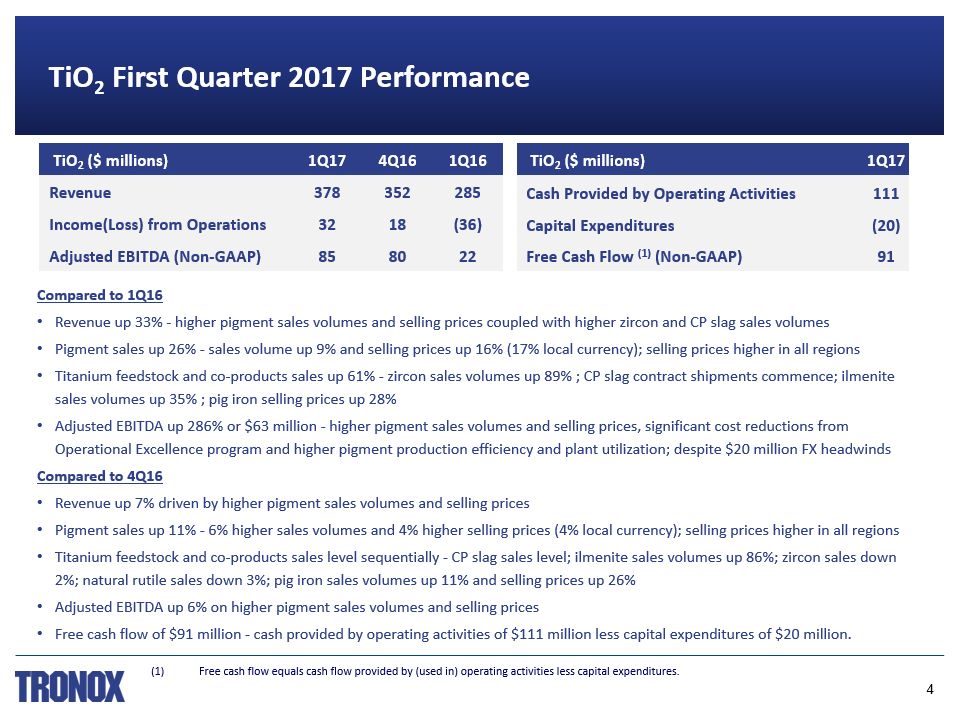
TiO2 First Quarter 2017 Performance Compared to 1Q16Revenue up 33% - higher pigment sales volumes and selling prices coupled with higher zircon and CP slag sales volumesPigment sales up 26% - sales volume up 9% and selling prices up 16% (17% local currency); selling prices higher in all regions Titanium feedstock and co-products sales up 61% - zircon sales volumes up 89% ; CP slag contract shipments commence; ilmenite sales volumes up 35% ; pig iron selling prices up 28% Adjusted EBITDA up 286% or $63 million - higher pigment sales volumes and selling prices, significant cost reductions from Operational Excellence program and higher pigment production efficiency and plant utilization; despite $20 million FX headwinds Compared to 4Q16Revenue up 7% driven by higher pigment sales volumes and selling prices Pigment sales up 11% - 6% higher sales volumes and 4% higher selling prices (4% local currency); selling prices higher in all regions Titanium feedstock and co-products sales level sequentially - CP slag sales level; ilmenite sales volumes up 86%; zircon sales down 2%; natural rutile sales down 3%; pig iron sales volumes up 11% and selling prices up 26% Adjusted EBITDA up 6% on higher pigment sales volumes and selling pricesFree cash flow of $91 million - cash provided by operating activities of $111 million less capital expenditures of $20 million. TiO2 ($ millions) 1Q17 4Q16 1Q16 Revenue 378 352 285 Income(Loss) from Operations 32 18 (36) Adjusted EBITDA (Non-GAAP) 85 80 22 TiO2 ($ millions) 1Q17 Cash Provided by Operating Activities 111 Capital Expenditures (20) Free Cash Flow (1) (Non-GAAP) 91 4 (1) Free cash flow equals cash flow provided by (used in) operating activities less capital expenditures.
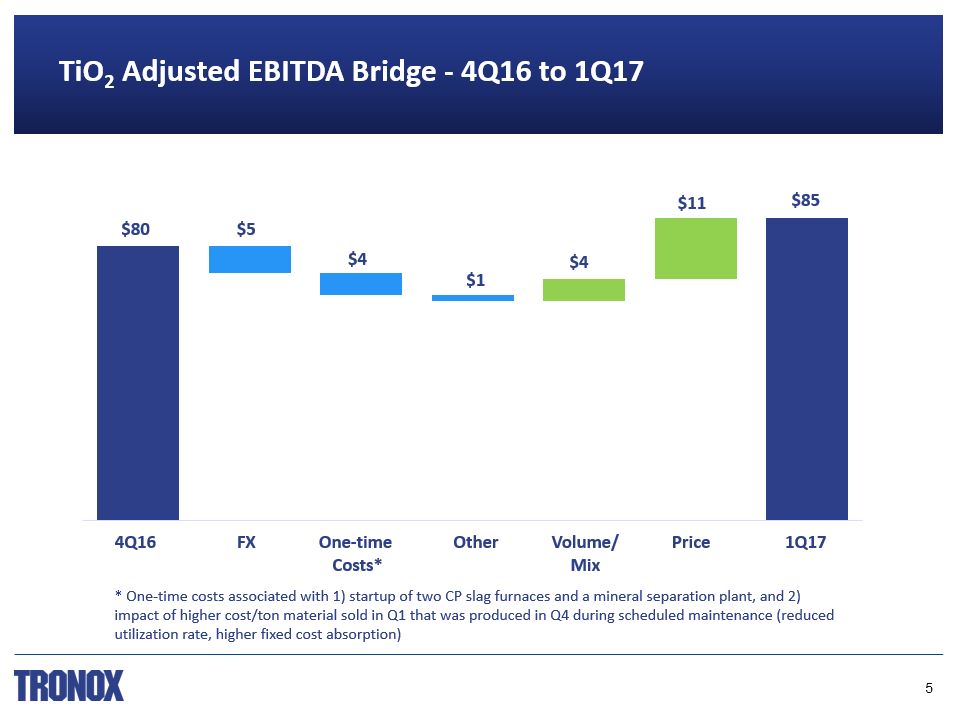
TiO2 Adjusted EBITDA Bridge - 4Q16 to 1Q17 $80 $5 $4 $1 $4 $85 4Q16 FX Other 1Q17 One-time Costs* Volume/Mix $11 Price * One-time costs associated with 1) startup of two CP slag furnaces and a mineral separation plant, and 2) impact of higher cost/ton material sold in Q1 that was produced in Q4 during scheduled maintenance (reduced utilization rate, higher fixed cost absorption) 5

TiO2 Adjusted EBITDA Margins Expected to be 30% by YE 2017 Adjusted EBITDA MarginExpansion Q1-Q4 2017 6
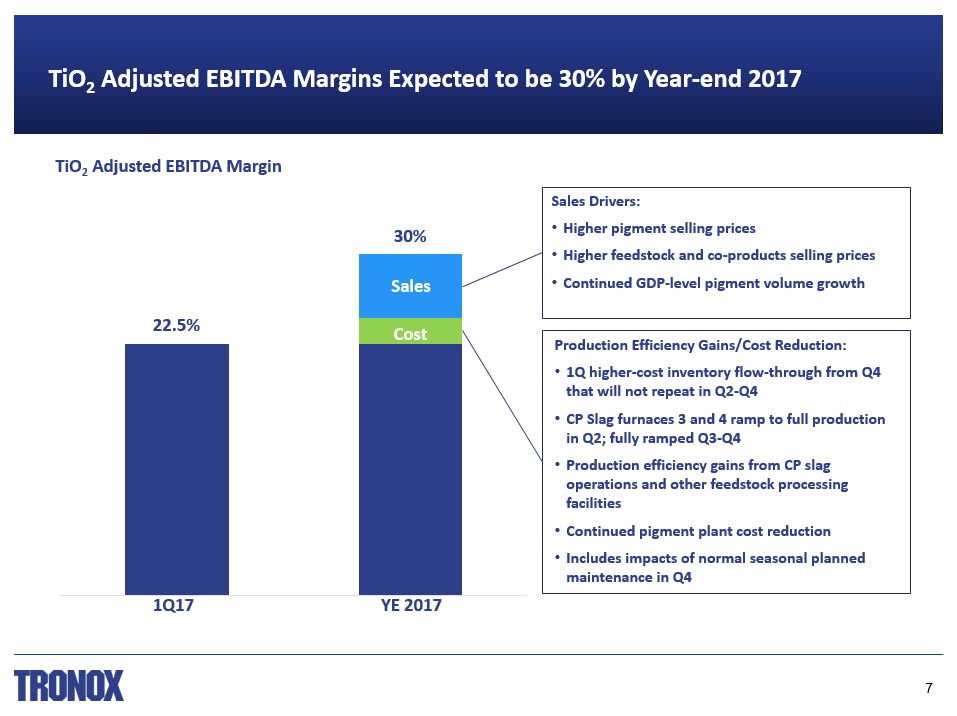
1Q17 YE 2017 22.5% 30% Sales Drivers:Higher pigment selling pricesHigher feedstock and co-products selling pricesContinued GDP-level pigment volume growth Sales TiO2 Adjusted EBITDA Margins Expected to be 30% by Year-end 2017 TiO2 Adjusted EBITDA Margin Cost Production Efficiency Gains/Cost Reduction:1Q higher-cost inventory flow-through from Q4 that will not repeat in Q2-Q4CP Slag furnaces 3 and 4 ramp to full production in Q2; fully ramped Q3-Q4Production efficiency gains from CP slag operations and other feedstock processing facilities Continued pigment plant cost reductionIncludes impacts of normal seasonal planned maintenance in Q4 7

Alkali First Quarter 2017 Performance Compared to 1Q16Revenue of $191 million level as sales volumes up 5% and selling prices down 4% ; revenue reduced by $5 million as lower sales volumes resulted from lower production volumes due to record severe winter weather conditions at its Wyoming production facility Domestic sales volumes down 3% - lower container glass and detergent demand; selling prices 2% lower due to customer mix and freight pass-through costsExport sales volumes up 13% driven by strong demand in Asia-Pacific and Latin America ; selling prices 2% lowerAdjusted EBITDA up 6% driven by operating cost reductions and higher plant efficiencies; adjusted EBITDA reduced by $4 million due to record severe winter weather conditions Compared to 4Q16Revenue down 3% on 3% lower sales volumes driven by lower production volumes due to record severe weather; selling prices level Domestic sales volumes down 4% and selling prices up 2%; export sales volumes and selling prices both down 2%Adjusted EBITDA down 17% driven by lower sales and production volumes and higher energy and operating costs , primarily the result of the record severe winter weather conditions in WyomingFree cash flow of $41 million - cash provided by operating activities of $53 million less capital expenditures of $12 million Alkali ($ millions) 1Q17 4Q16 1Q16 Revenue 191 197 191 Income from Operations 19 31 21 Adjusted EBITDA (Non-GAAP) 38 46 36 Alkali ($ millions) 1Q17 Cash Provided by Operating Activities 53 Capital Expenditures (12) Free Cash Flow (1) (Non-GAAP) 41 8 (1) Free cash flow equals cash flow provided by (used in) operating activities less capital expenditures.

Debt Maturities and Financial Maintenance Covenants No meaningful maturities until 2020; annual 1% payment on term loan No financial maintenance covenants on term loan or high yield notes 48% of total indebtedness set at a fixed rate on March 31, 2017 First Quarter 2017 Financial Position Tronox ($ millions) 1Q17 4Q16 1Q16 Corporate Income(Loss) from Operations (35)* (16) (16) Adjusted EBITDA (Non-GAAP) (22)** (21) (18) Cash Used in Operations (104) (44) (105) SG&A 74* 59 50 Interest & Debt Expense, Net 46 47 46 * Includes $15 million professional fees primarily related to the Cristal transaction and process to market Alkali plus certain non-cash employee retirement-related and other costs of $10 million** Includes $4 million related to the process to market Alkali Tronox ($ millions) Mar 31, 2017 Dec 31, 2016 Gross Consolidated Debt 3,053 3,054 Debt, Net of Cash 2,788 2,806 Cash and Cash Equivalents 265 248 Liquidity 560 533 Blended Cost of Debt 5.6% 5.6% Tronox ($ millions) FY 2017 Outlook Cash Interest 170-180 Capital Expenditures ~150 DD&A ~245 9
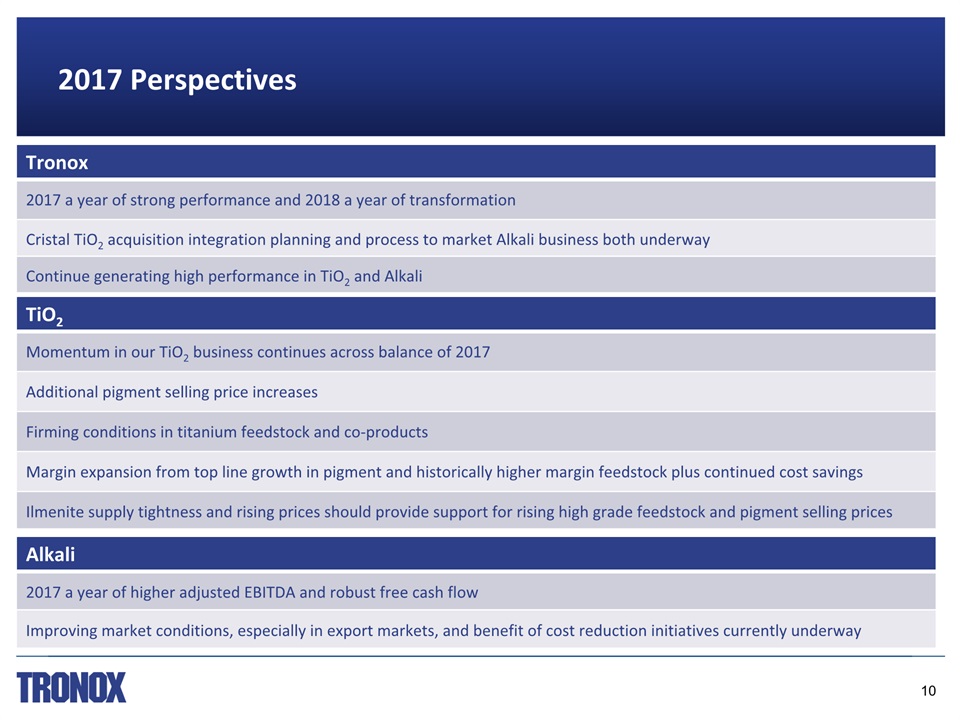
2017 Perspectives TiO2 Momentum in our TiO2 business continues across balance of 2017 Additional pigment selling price increases Firming conditions in titanium feedstock and co-products Margin expansion from top line growth in pigment and historically higher margin feedstock plus continued cost savings Ilmenite supply tightness and rising prices should provide support for rising high grade feedstock and pigment selling prices Alkali 2017 a year of higher adjusted EBITDA and robust free cash flow Improving market conditions, especially in export markets, and benefit of cost reduction initiatives currently underway 10 Tronox 2017 a year of strong performance and 2018 a year of transformation Cristal TiO2 acquisition integration planning and process to market Alkali business both underway Continue generating high performance in TiO2 and Alkali
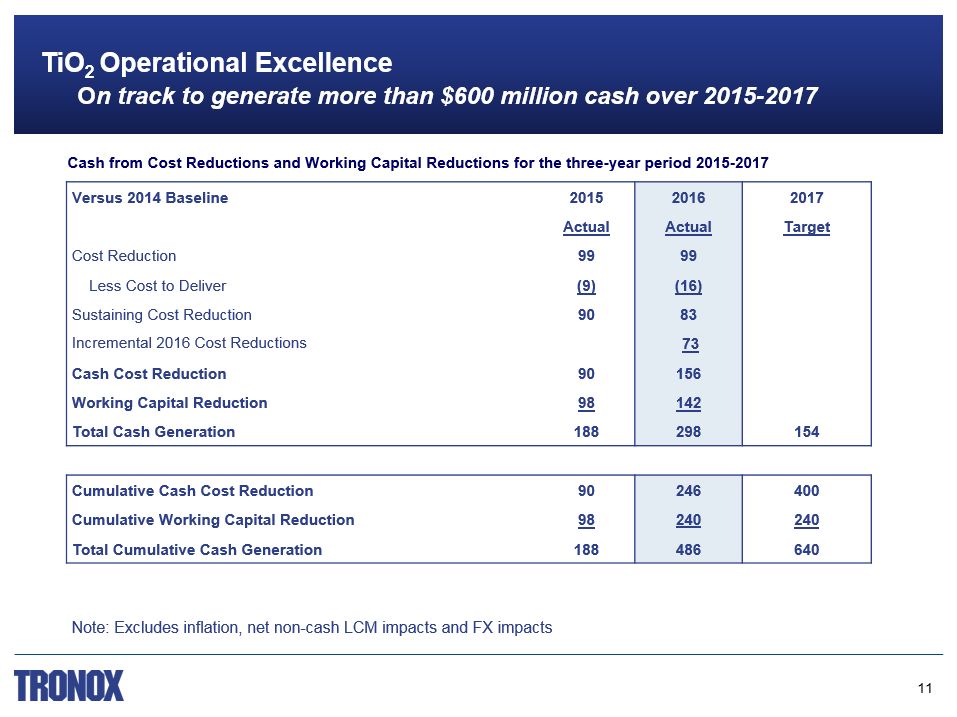
TiO2 Operational Excellence On track to generate more than $600 million cash over 2015-2017 Cash from Cost Reductions and Working Capital Reductions for the three-year period 2015-2017 Versus 2014 Baseline 2015 2016 2017 Actual Actual Target Cost Reduction 99 99 Less Cost to Deliver (9) (16) Sustaining Cost Reduction 90 83 Incremental 2016 Cost Reductions 73 Cash Cost Reduction 90 156 Working Capital Reduction 98 142 Total Cash Generation 188 298 154 Cumulative Cash Cost Reduction 90 246 400 Cumulative Working Capital Reduction 98 240 240 Total Cumulative Cash Generation 188 486 640 Note: Excludes inflation, net non-cash LCM impacts and FX impacts 11
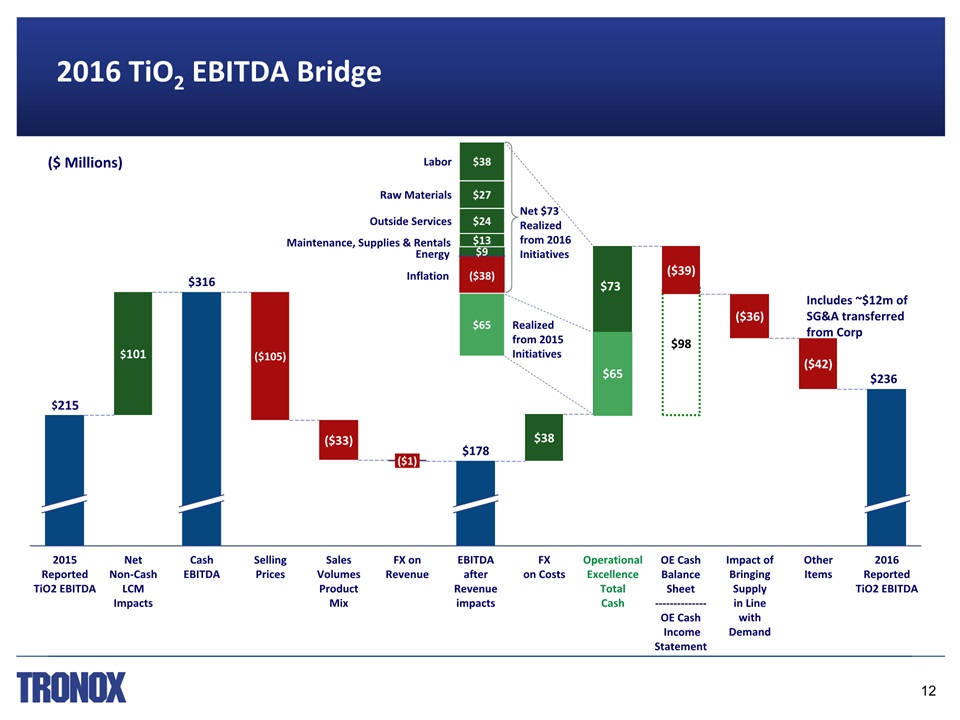
$98 Maintenance, Supplies & Rentals 2016 TiO2 EBITDA Bridge $178 $38 EBITDA after Revenue impacts OperationalExcellenceTotalCash ($39) 2016ReportedTiO2 EBITDA ($36) Impact of Bringing Supplyin Line with Demand ($42) Other Items $236 ($1) FX on Revenue $101 2015 ReportedTiO2 EBITDA $215 NetNon-CashLCMImpacts FX on Costs Selling Prices $316 SalesVolumesProduct Mix ($105) CashEBITDA ($33) ($ Millions) Labor $9 ($38) $13 $38 $24 $27 Inflation Outside Services Raw Materials $73 $65 Realized from 2015 Initiatives $65 Net $73Realized from 2016 Initiatives Energy OE CashBalance Sheet--------------OE Cash Income Statement Includes ~$12m of SG&A transferred from Corp 12

Cristal Transaction

Expands Global Footprint, Increases Participation in High Growth Emerging Markets Increases Growth Rates, Faster-growing EBITDA, Free Cash Flow and Earnings Highly Synergistic and Substantially Accretive and Deleveraging Upon Closing Very Strong Fourth Quarter 2016 Performance, TiO2 Market Momentum Continues Creates World’s Largest and Most Highly Integrated TiO2 Producer Tronox Announces Definitive Agreement to Acquire Cristal TiO2 Cristal is the world’s second largest producer of titanium dioxide and operates 8 titanium dioxide plants, 6 mines and mineral separation plants, and 1 slag plant in seven countries 14
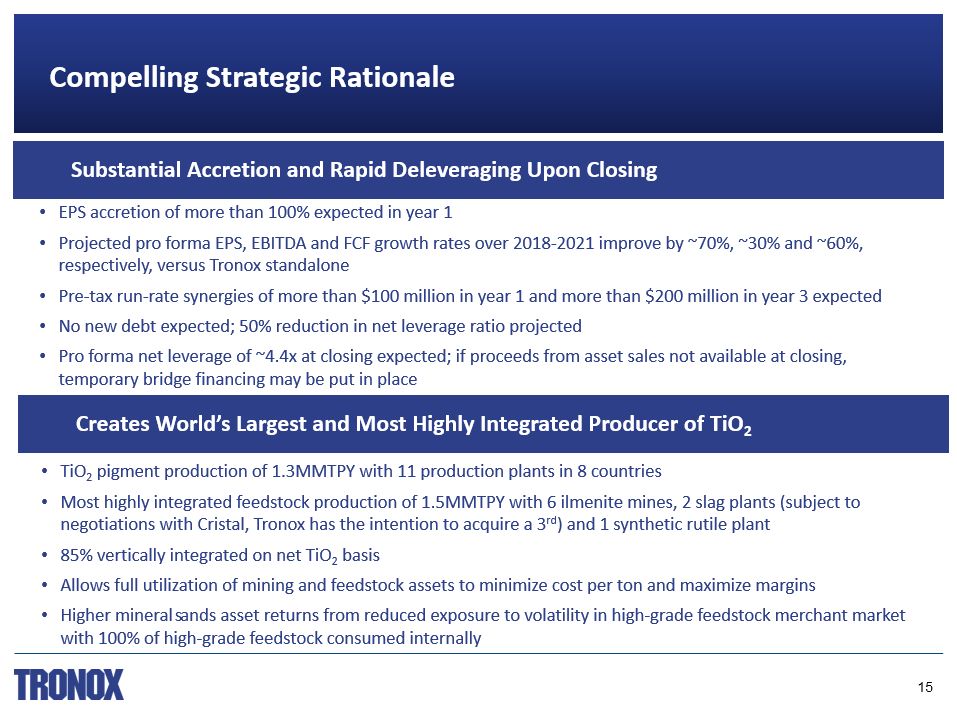
Substantial Accretion and Rapid Deleveraging Upon Closing Compelling Strategic Rationale Creates World’s Largest and Most Highly Integrated Producer of TiO2 EPS accretion of more than 100% expected in year 1Projected pro forma EPS, EBITDA and FCF growth rates over 2018-2021 improve by ~70%, ~30% and ~60%, respectively, versus Tronox standalonePre-tax run-rate synergies of more than $100 million in year 1 and more than $200 million in year 3 expectedNo new debt expected; 50% reduction in net leverage ratio projectedPro forma net leverage of ~4.4x at closing expected; if proceeds from asset sales not available at closing, temporary bridge financing may be put in place TiO2 pigment production of 1.3MMTPY with 11 production plants in 8 countriesMost highly integrated feedstock production of 1.5MMTPY with 6 ilmenite mines, 2 slag plants (subject to negotiations with Cristal, Tronox has the intention to acquire a 3rd) and 1 synthetic rutile plant 85% vertically integrated on net TiO2 basisAllows full utilization of mining and feedstock assets to minimize cost per ton and maximize marginsHigher mineral sands asset returns from reduced exposure to volatility in high-grade feedstock merchant market with 100% of high-grade feedstock consumed internally 15

Transaction Summary Governance & Leadership Size of Tronox board of directors remains unchanged with 9 membersCristal’s owners will receive 2 board seatsExxaro Mineral Sands will remain on the board with its 3 seatsTom Casey to remain Chairman and CEO Transaction Overview Cristal shareholders to receive $1.673 billion of cash plus Class A ordinary shares representing 24% ownership in pro forma Tronox Cash portion of purchase consideration expected to be funded through proceeds from asset sales, including Alkali and selected other non-core assets if appropriate, and cash on hand Ownership 76% existing Tronox shareholders and 24% Cristal shareholdersCristal can sell a maximum of 4% of total shares for 3 years following closing and can not acquire more than 24% of total shares for 3 years following closing Key Closing Conditions Approval of Tronox Class A and B shareholders, voting as a single class, plus regulatory approvals and customary closing conditionsClosing is expected before first quarter 2018 16

World’s 2nd largest TiO2 pigment producer 858 kMT of nameplate production capacity84% chloride2011-2016 average EBITDA of $385 millionHigh-quality, well-invested assets, with highly automated manufacturing processesHighly integrated into mining, chlorine, air separation, energy facilities and a 500kMT slag production complex under commissioningSignificant co-product and downstream businessLargest producer of merchant high quality TiCl4Global leader in specialty, catalyst grade TiO2Mining and mineral separation facilities in Australia with 258MMT of reserves Cristal Overview Key Facts Facilities 8 TiO2 facilities, 6 mines / MSPs(1) and 1 slagger(2) Countries Plants in 7 countries TiO2 Nameplate Capacity 858 kMT Feedstock and Co-Products Nameplate Capacity 500kMT ilmenite, 70ktpa rutile, 100ktpa zircon, 500kMT slag(2) Employees ~4,100 2016 Sales: $1.7 billion (1) Mineral Separation Plants (2) Currently in commissioning phase 17
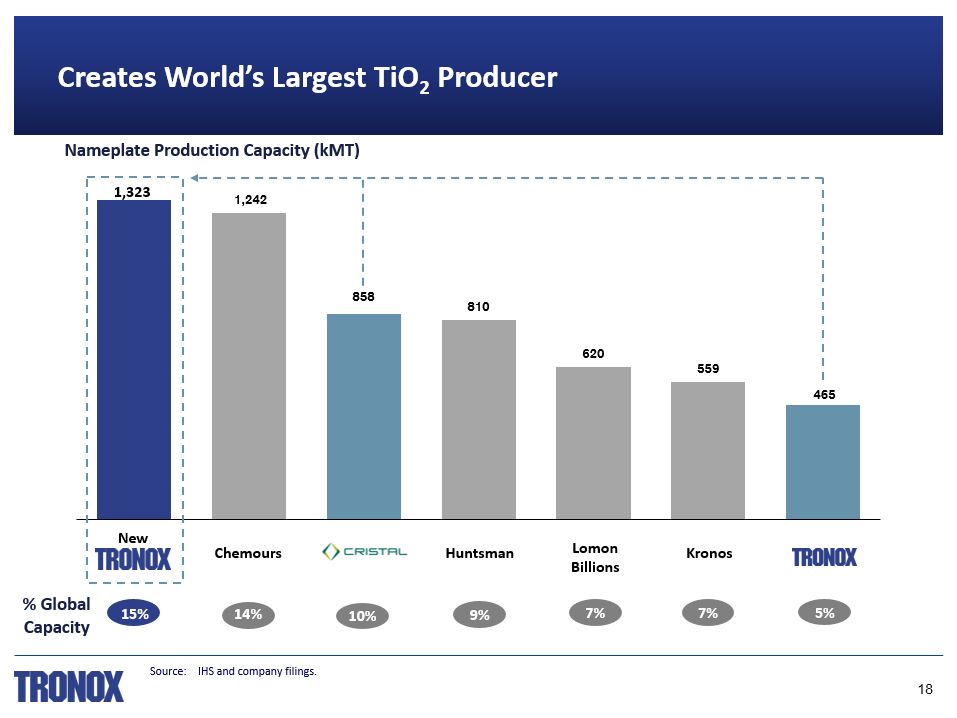
Creates World’s Largest TiO2 Producer Nameplate Production Capacity (kMT) Huntsman Chemours 14% 15% 10% 9% Kronos 7% Lomon Billions 7% 5% % Global Capacity New 1,323 Source: IHS and company filings. 18

World’s second largest mineral sands producer, 85% vertically integrated on net TiO2 basisFull utilization of mining and feedstock assets to maximize margins by minimizing cost per tonHigher mineral sands asset returns resulting from reduced exposure to volatility in high-grade feedstock merchant market as 100% of high-grade feedstock consumed internally World’s Most Highly Integrated TiO2 and Mineral Sands Producer New Tronox Mineral Sands Production (kMT, TiO2 units) Feedstock Balance Shifts (2018E) 220 Long New Tronox Tronox 180 Short Source: Tronox estimates. 19
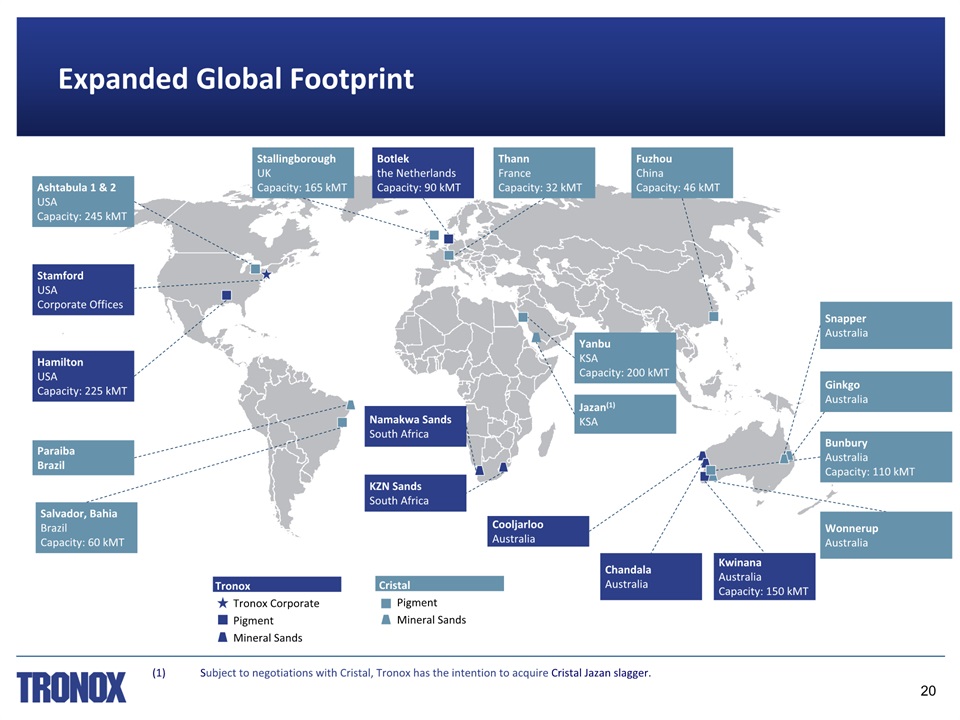
Expanded Global Footprint ThannFranceCapacity: 32 kMT Ashtabula 1 & 2USACapacity: 245 kMT Salvador, BahiaBrazilCapacity: 60 kMT YanbuKSACapacity: 200 kMT BunburyAustraliaCapacity: 110 kMT FuzhouChinaCapacity: 46 kMT StallingboroughUKCapacity: 165 kMT Namakwa SandsSouth Africa KZN SandsSouth Africa ChandalaAustralia KwinanaAustraliaCapacity: 150 kMT HamiltonUSACapacity: 225 kMT Jazan(1)KSA Botlekthe NetherlandsCapacity: 90 kMT StamfordUSACorporate Offices ParaibaBrazil CooljarlooAustralia WonnerupAustralia SnapperAustralia GinkgoAustralia (1) Subject to negotiations with Cristal, Tronox has the intention to acquire Cristal Jazan slagger. 20 TronoxTronox Corporate PigmentMineral Sands CristalPigmentMineral Sands

Balanced Geographical Sales Mix Tronox Increased participation in higher growth emerging markets Cristal New Tronox 21

Significant Shareholder Value Creation Potential ($ millions) Average EBITDA Bridge(1) 1 (1) Average EBITDA 2011 – 2016(1) $428 Tronox TiO2 $385 Cristal $200 Year 3Synergies $1,013 New Tronox (1) Does not reflect any future price recovery. 22

Highly Synergistic Combination Pre-tax run-rate synergies of more than $100 million by year 1 and more than $200 million by year 3 expected Components of Synergies ($ millions) Full utilization of mineral sands assets Optimizing value in use of our feedstockSharing of best practices across complementary technologies, production facilities and production geographiesSignificant supplier overlapEnhanced global footprint reduces average distance to customers Consolidation of third party spend, overlapping functions, elimination of redundant corporate costs One-time Costs to Achieve ($ millions) Sources of Synergies ($ millions) ($ millions) 23
Summary World’s Largest and Most Highly Integrated TiO2 Producer Highly Strategic and Synergistic Combination Substantially Accretive and Deleveraging Upon Closing Higher Growth Rates, Faster-growing EBITDA, Free Cash Flow and Earnings Expanded Global Footprint, Increased Participation in Emerging Markets 24

www.tronox.com