Attached files
| file | filename |
|---|---|
| 8-K - 8-K - SOUTH JERSEY INDUSTRIES INC | form8k-q12017resultsslided.htm |
South Jersey Industries
Q1 2017 Business Update
May 9, 2017
Certain statements contained in this presentation may qualify as “forward-looking statements” within
the meaning of Section 27A of the Securities Act of 1933 and Section 21E of the Securities Exchange Act
of 1934. All statements other than statements of historical fact should be considered forward-looking
statements made in good faith and are intended to qualify for the safe harbor from liability established
by the Private Securities Litigation Reform Act of 1995. Words such as “anticipate”, “believe”, “expect”,
“estimate”, “forecast”, “goal”, “intend”, “objective”, “plan”, “project”, “seek”, “strategy” and similar
expressions are intended to identify forward-looking statements. Such forward-looking statements are
subject to risks and uncertainties that could cause actual results to differ materially from those
expressed or implied in the statements. These risks and uncertainties include, but are not limited to, the
following: general economic conditions on an international, national, state and local level; weather
conditions in our marketing areas; changes in commodity costs; changes in the availability of natural
gas; “non-routine” or “extraordinary” disruptions in our distribution system; regulatory, legislative and
court decisions; competition; the availability and cost of capital; costs and effects of legal proceedings
and environmental liabilities; the failure of customers or suppliers to fulfill their contractual obligations;
and changes in business strategies. These cautionary statements should not be construed by you to be
exhaustive. While SJI believes these forward-looking statements to be reasonable, there can be no
assurance that they will approximate actual experience. Further, SJI undertakes no obligation to update
or revise any of its forward-looking statements, whether as a result of new information, future events or
otherwise.
Forward Looking Statements
2
Grow Economic
Earnings
Improve
Quality of
Earnings
Maintain Strong
Balance Sheet
Maintain Low to
Moderate Risk Profile
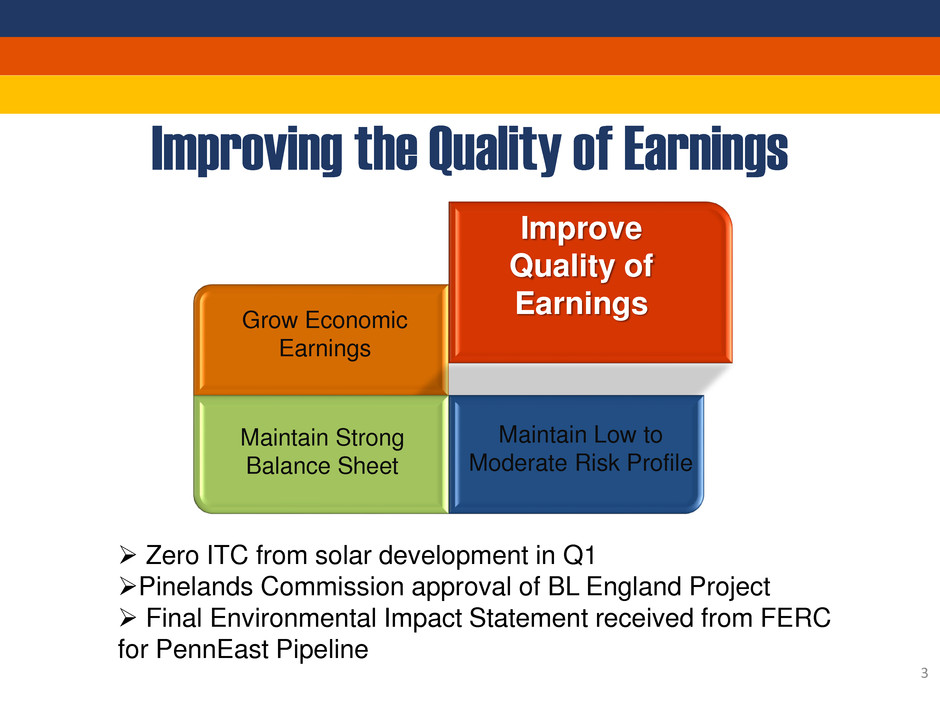
Zero ITC from solar development in Q1
Pinelands Commission approval of BL England Project
Final Environmental Impact Statement received from FERC
for PennEast Pipeline
3
Improving the Quality of Earnings
Grow Economic
Earnings
Improve Quality
of Earnings
Maintain Strong
Balance Sheet
Maintain Low
to Moderate
Risk Profile
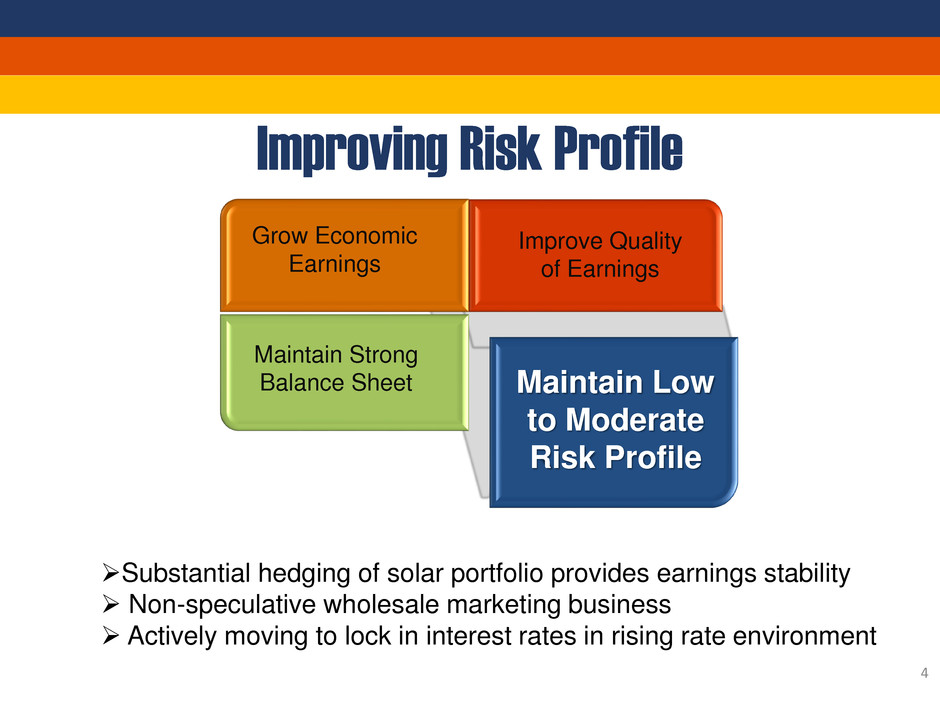
Substantial hedging of solar portfolio provides earnings stability
Non-speculative wholesale marketing business
Actively moving to lock in interest rates in rising rate environment
4
Improving Risk Profile
Grow Economic
Earnings
Improve Quality
of Earnings
Maintain
Strong
Balance Sheet
Maintain Low to
Moderate Risk
Profile
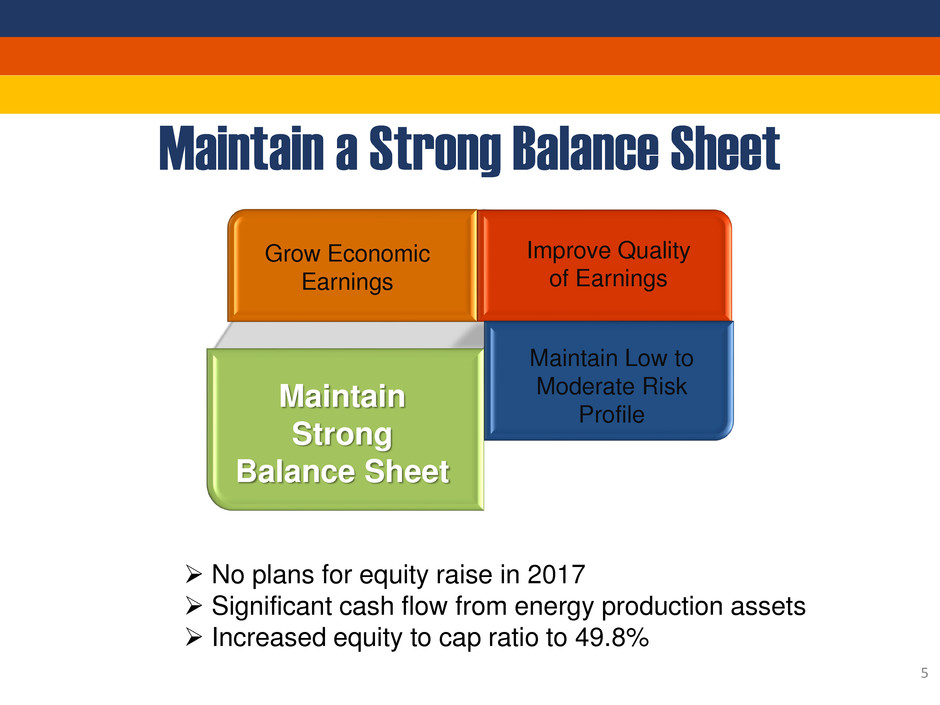
No plans for equity raise in 2017
Significant cash flow from energy production assets
Increased equity to cap ratio to 49.8%
5
Maintain a Strong Balance Sheet
Grow
Economic
Earnings
Maintain Strong
Balance Sheet
Improve Quality
of Earnings
Maintain Low to
Moderate Risk Profile
The Path to $150 Million
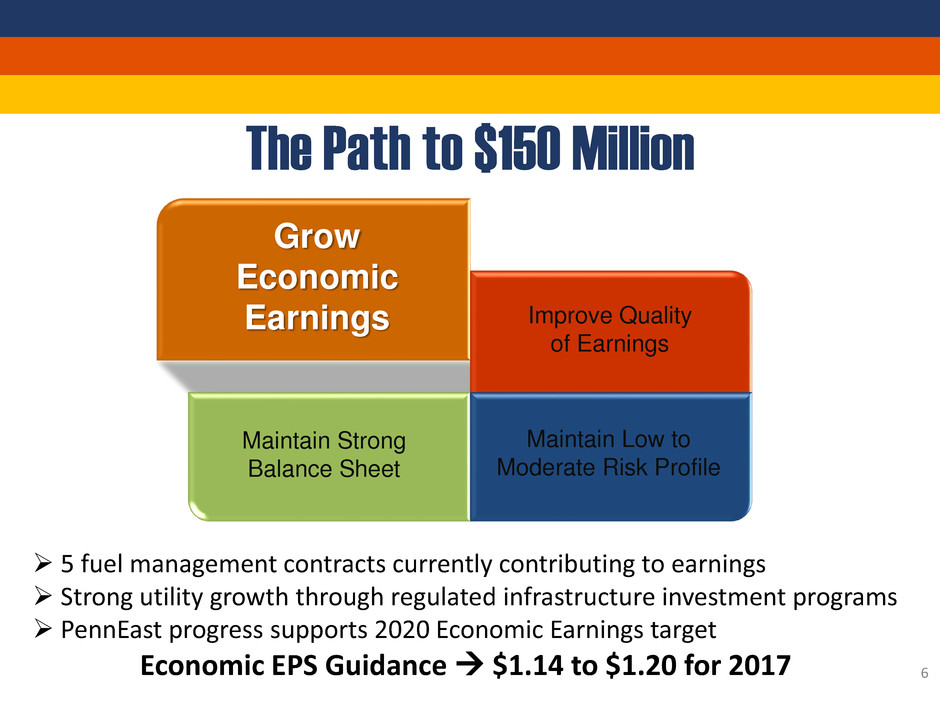
5 fuel management contracts currently contributing to earnings
Strong utility growth through regulated infrastructure investment programs
PennEast progress supports 2020 Economic Earnings target
Economic EPS Guidance $1.14 to $1.20 for 2017
6
SJI Capital Investment
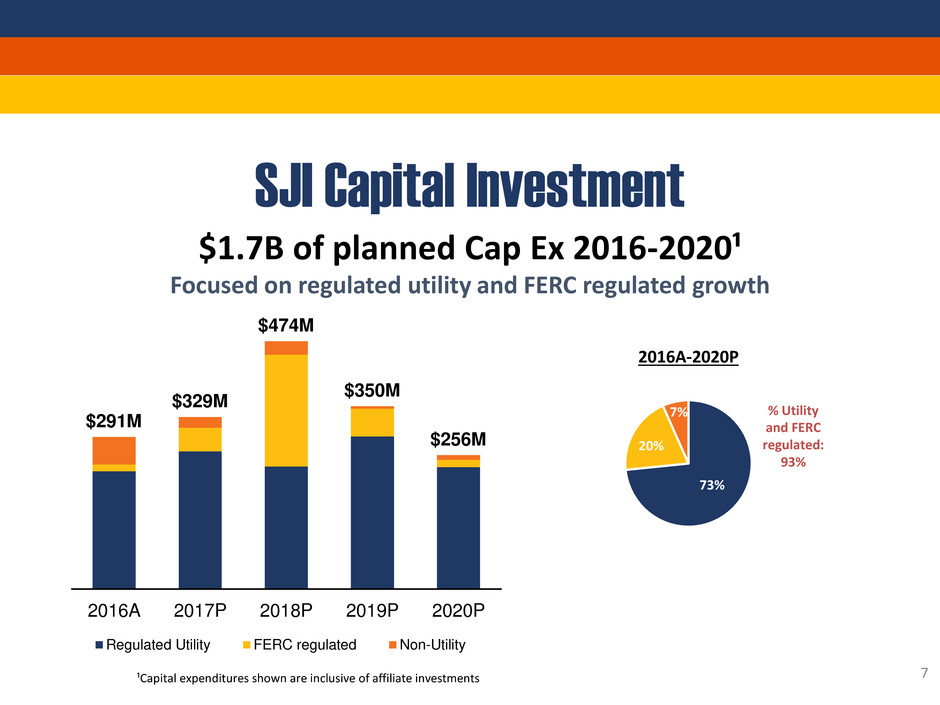
$1.7B of planned Cap Ex 2016-2020¹
Focused on regulated utility and FERC regulated growth
$291M
$329M
$474M
$350M
$256M
2016A 2017P 2018P 2019P 2020P
Regulated Utility FERC regulated Non-Utility
2016A-2020P
73%
20%
7% % Utility
and FERC
regulated:
93%
7 ¹Capital expenditures shown are inclusive of affiliate investments
Utility Capital Investment
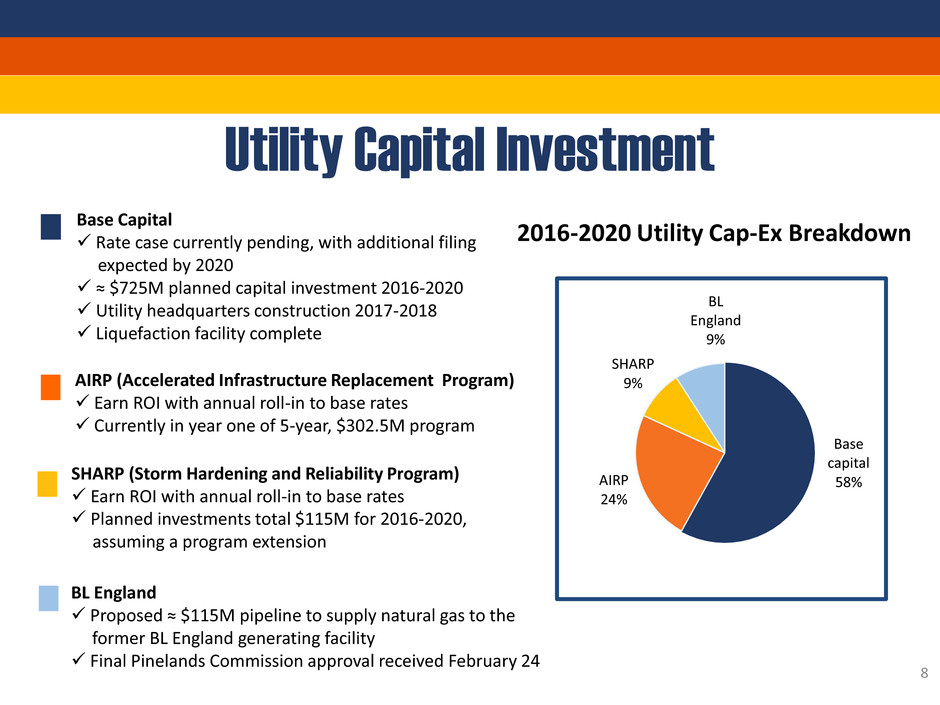
2016-2020 Utility Cap-Ex Breakdown
Base
capital
58% AIRP
24%
SHARP
9%
BL
England
9%
Base Capital
Rate case currently pending, with additional filing
expected by 2020
≈ $725M planned capital investment 2016-2020
Utility headquarters construction 2017-2018
Liquefaction facility complete
AIRP (Accelerated Infrastructure Replacement Program)
Earn ROI with annual roll-in to base rates
Currently in year one of 5-year, $302.5M program
SHARP (Storm Hardening and Reliability Program)
Earn ROI with annual roll-in to base rates
Planned investments total $115M for 2016-2020,
assuming a program extension
BL England
Proposed ≈ $115M pipeline to supply natural gas to the
former BL England generating facility
Final Pinelands Commission approval received February 24
8
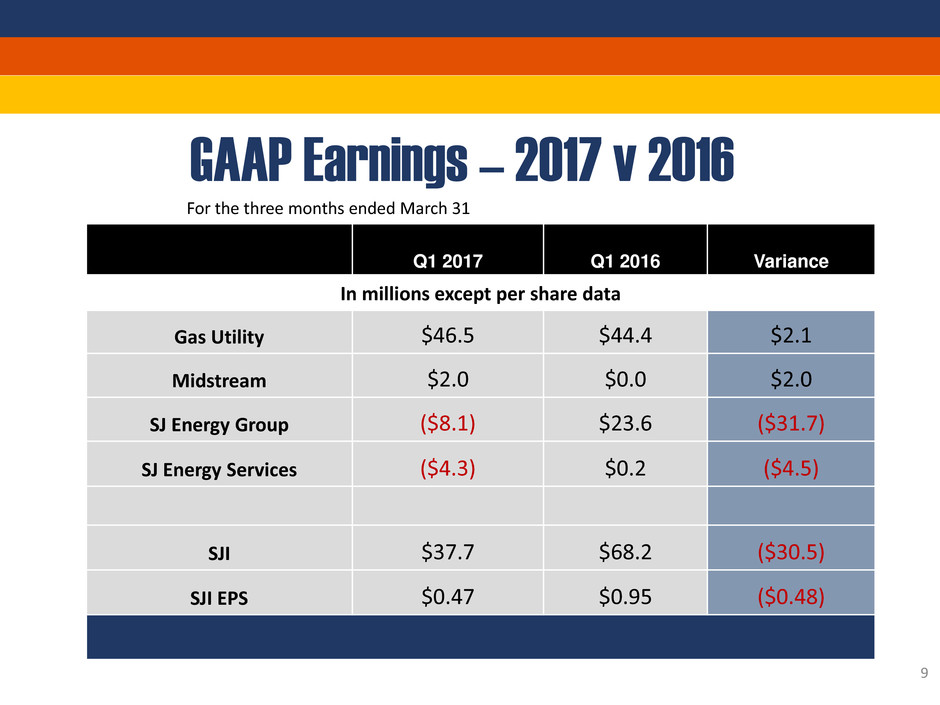
GAAP Earnings – 2017 v 2016
For the three months ended March 31
Q1 2017 Q1 2016 Variance
In millions except per share data
Gas Utility $46.5 $44.4 $2.1
Midstream $2.0 $0.0 $2.0
SJ Energy Group ($8.1) $23.6 ($31.7)
SJ Energy Services ($4.3) $0.2 ($4.5)
SJI $37.7 $68.2 ($30.5)
SJI EPS $0.47 $0.95 ($0.48)
9
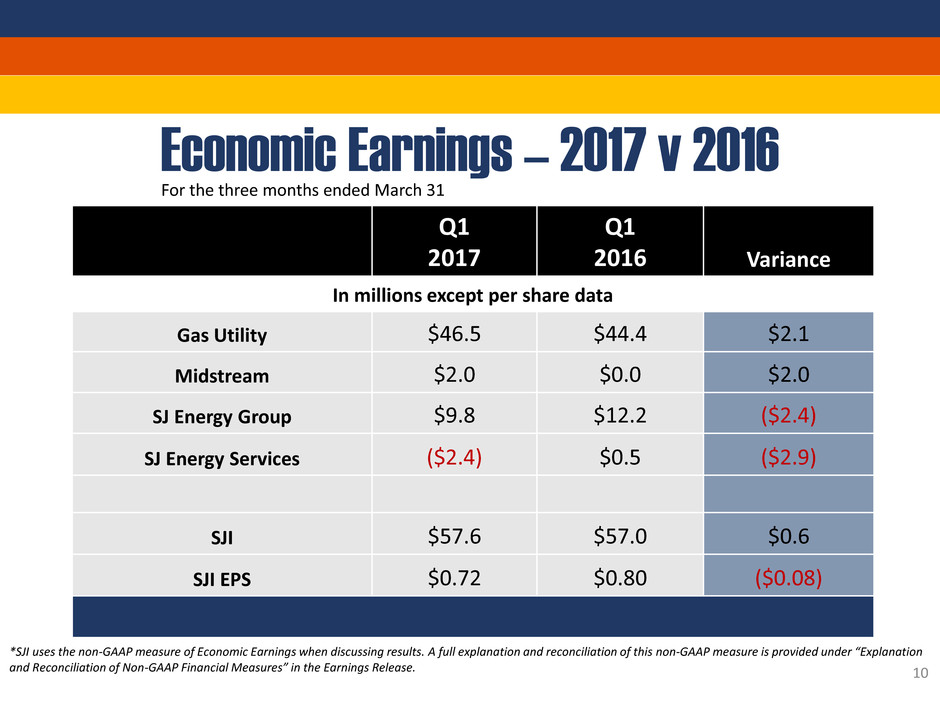
Economic Earnings – 2017 v 2016
For the three months ended March 31
Q1
2017
Q1
2016 Variance
In millions except per share data
Gas Utility $46.5 $44.4 $2.1
Midstream $2.0 $0.0 $2.0
SJ Energy Group $9.8 $12.2 ($2.4)
SJ Energy Services ($2.4) $0.5 ($2.9)
SJI $57.6 $57.0 $0.6
SJI EPS $0.72 $0.80 ($0.08)
*SJI uses the non-GAAP measure of Economic Earnings when discussing results. A full explanation and reconciliation of this non-GAAP measure is provided under “Explanation
and Reconciliation of Non-GAAP Financial Measures” in the Earnings Release.
10
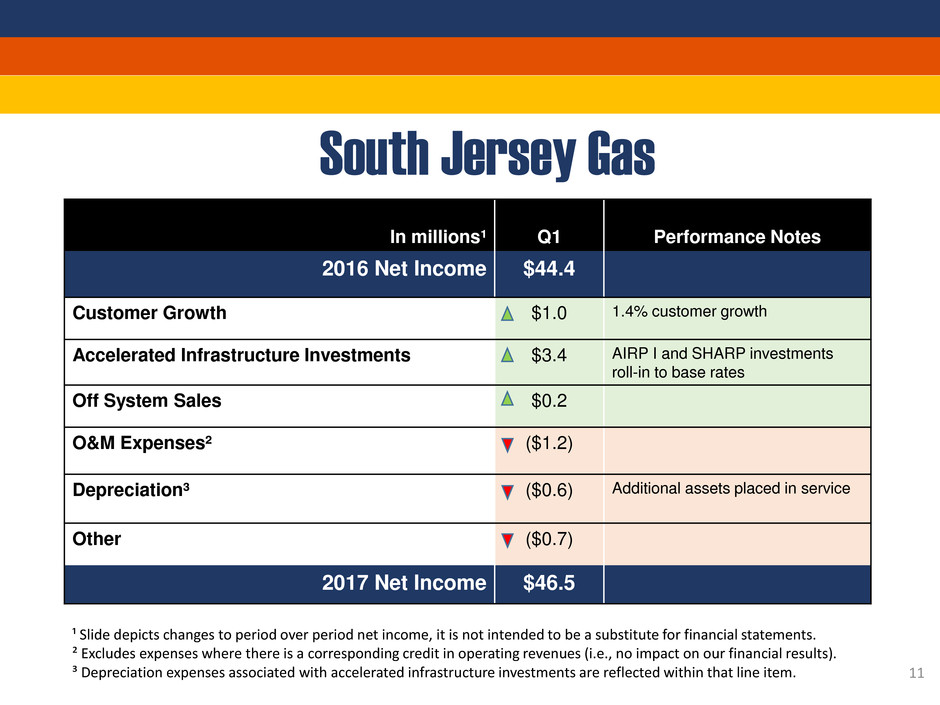
South Jersey Gas
In millions¹
Q1
Performance Notes
2016 Net Income $44.4
Customer Growth $1.0 1.4% customer growth
Accelerated Infrastructure Investments $3.4 AIRP I and SHARP investments
roll-in to base rates
Off System Sales $0.2
O&M Expenses² ($1.2)
Depreciation³ ($0.6) Additional assets placed in service
Other ($0.7)
2017 Net Income $46.5
¹ Slide depicts changes to period over period net income, it is not intended to be a substitute for financial statements.
² Excludes expenses where there is a corresponding credit in operating revenues (i.e., no impact on our financial results).
³ Depreciation expenses associated with accelerated infrastructure investments are reflected within that line item.
11
12
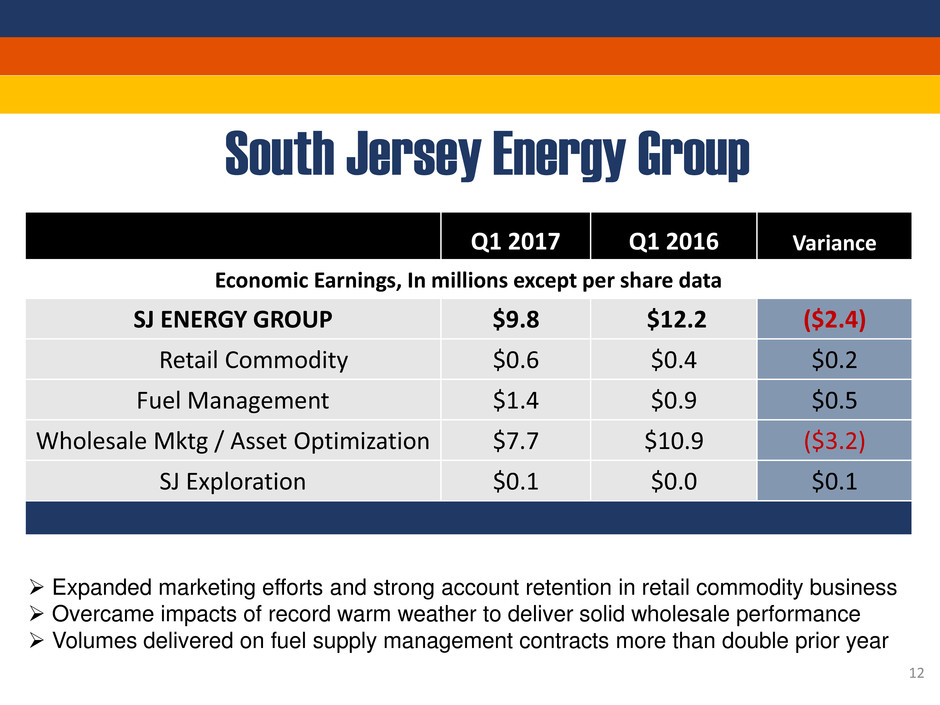
Q1 2017 Q1 2016 Variance
Economic Earnings, In millions except per share data
SJ ENERGY GROUP $9.8 $12.2 ($2.4)
Retail Commodity $0.6 $0.4 $0.2
Fuel Management $1.4 $0.9 $0.5
Wholesale Mktg / Asset Optimization $7.7 $10.9 ($3.2)
SJ Exploration $0.1 $0.0 $0.1
South Jersey Energy Group
Expanded marketing efforts and strong account retention in retail commodity business
Overcame impacts of record warm weather to deliver solid wholesale performance
Volumes delivered on fuel supply management contracts more than double prior year
13
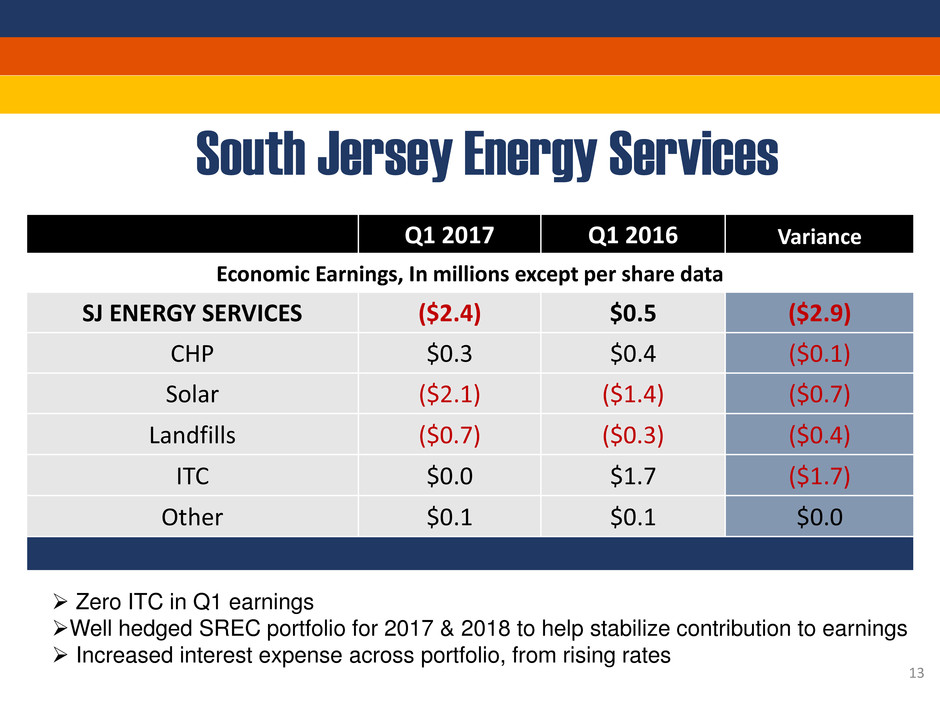
Q1 2017 Q1 2016 Variance
Economic Earnings, In millions except per share data
SJ ENERGY SERVICES ($2.4) $0.5 ($2.9)
CHP $0.3 $0.4 ($0.1)
Solar ($2.1) ($1.4) ($0.7)
Landfills ($0.7) ($0.3) ($0.4)
ITC $0.0 $1.7 ($1.7)
Other $0.1 $0.1 $0.0
South Jersey Energy Services
Zero ITC in Q1 earnings
Well hedged SREC portfolio for 2017 & 2018 to help stabilize contribution to earnings
Increased interest expense across portfolio, from rising rates
Appendix
15
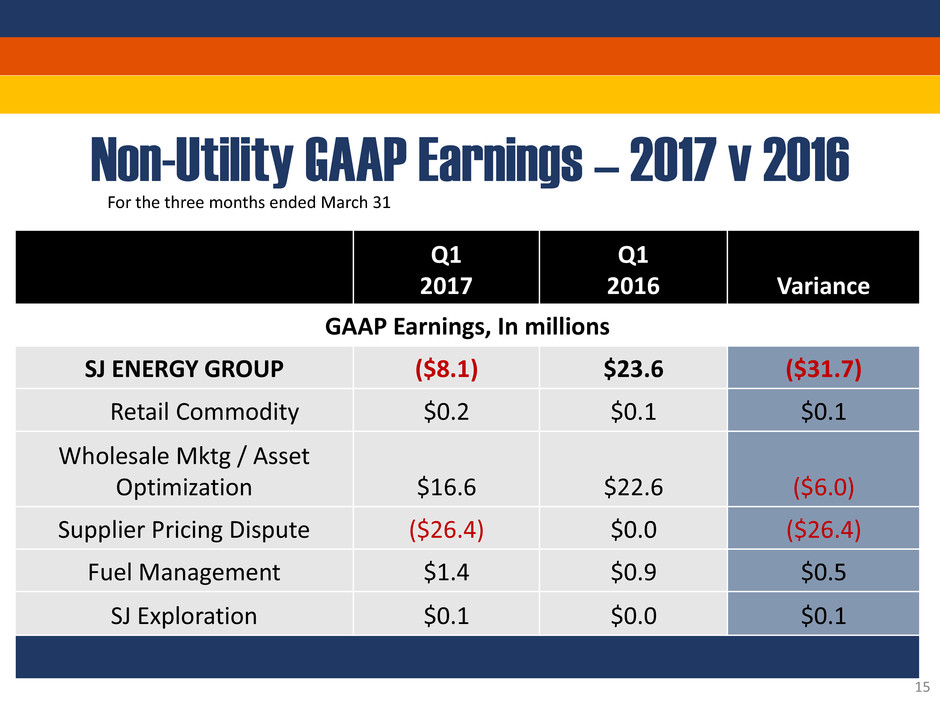
Q1
2017
Q1
2016 Variance
GAAP Earnings, In millions
SJ ENERGY GROUP ($8.1) $23.6 ($31.7)
Retail Commodity $0.2 $0.1 $0.1
Wholesale Mktg / Asset
Optimization $16.6 $22.6 ($6.0)
Supplier Pricing Dispute ($26.4) $0.0 ($26.4)
Fuel Management $1.4 $0.9 $0.5
SJ Exploration $0.1 $0.0 $0.1
Non-Utility GAAP Earnings – 2017 v 2016
For the three months ended March 31
16
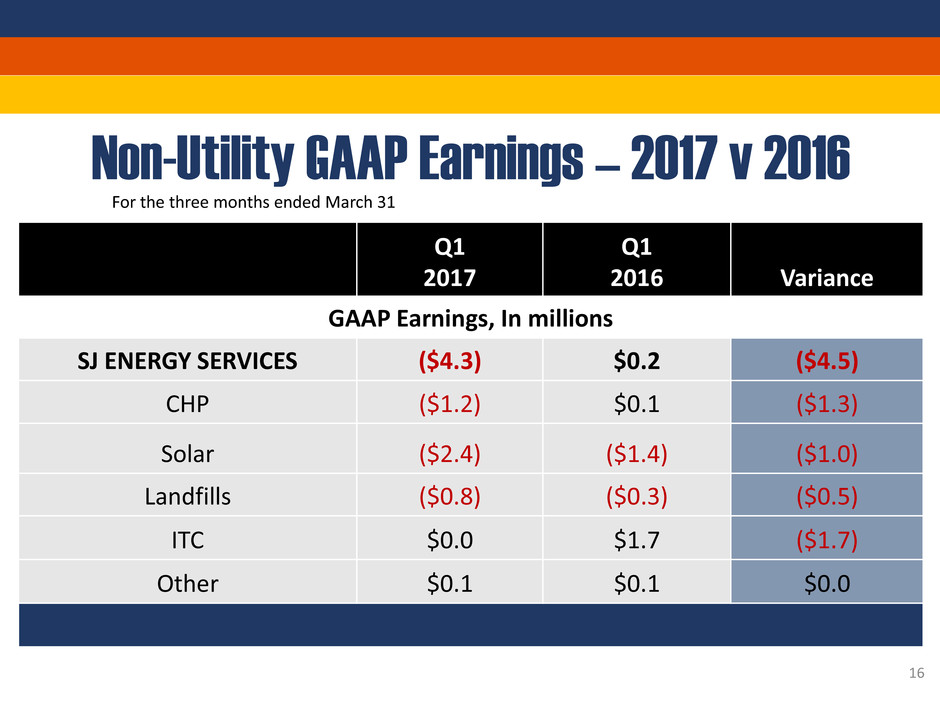
Q1
2017
Q1
2016 Variance
GAAP Earnings, In millions
SJ ENERGY SERVICES ($4.3) $0.2 ($4.5)
CHP ($1.2) $0.1 ($1.3)
Solar ($2.4) ($1.4) ($1.0)
Landfills ($0.8) ($0.3) ($0.5)
ITC $0.0 $1.7 ($1.7)
Other $0.1 $0.1 $0.0
Non-Utility GAAP Earnings – 2017 v 2016
For the three months ended March 31
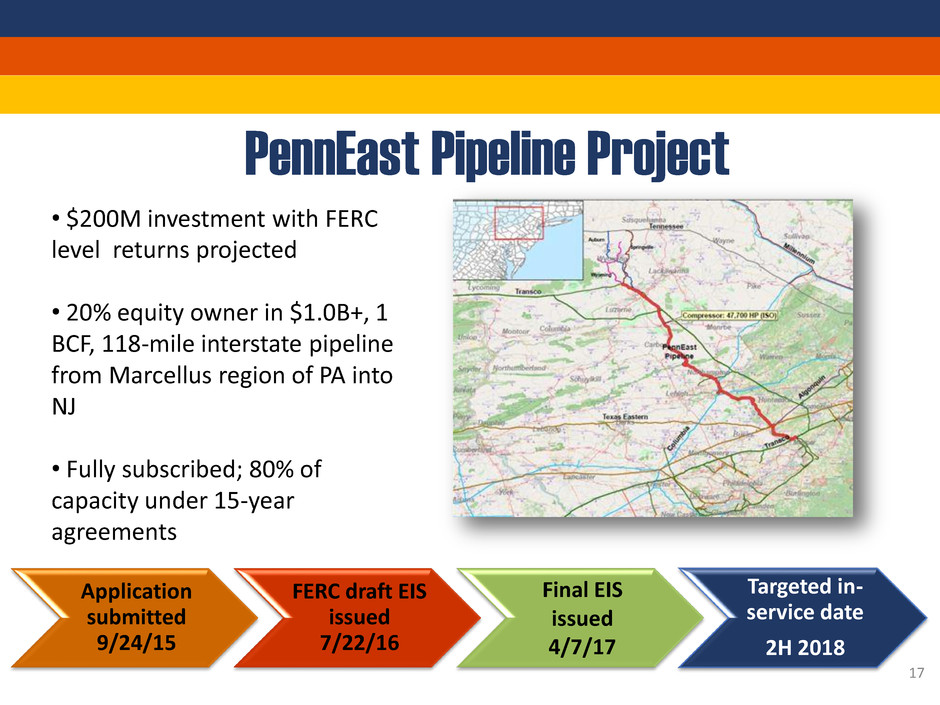
PennEast Pipeline Project
• $200M investment with FERC
level returns projected
• 20% equity owner in $1.0B+, 1
BCF, 118-mile interstate pipeline
from Marcellus region of PA into
NJ
• Fully subscribed; 80% of
capacity under 15-year
agreements
Application
submitted
9/24/15
FERC draft EIS
issued
7/22/16
Final EIS
issued
4/7/17
Targeted in-
service date
2H 2018
17
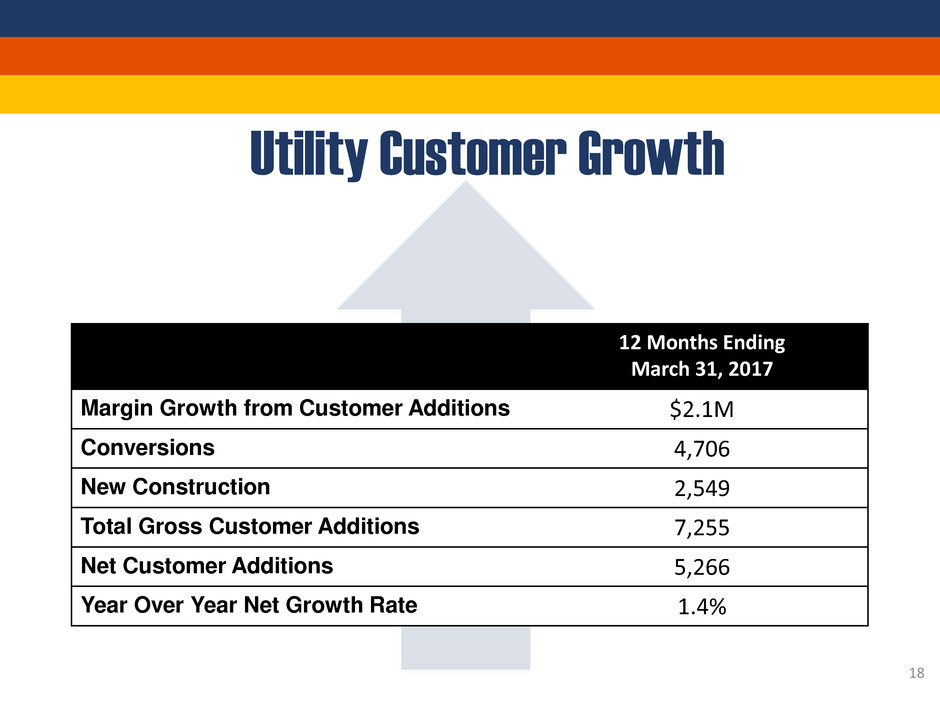
Utility Customer Growth
12 Months Ending
March 31, 2017
Margin Growth from Customer Additions $2.1M
Conversions 4,706
New Construction 2,549
Total Gross Customer Additions 7,255
Net Customer Additions 5,266
Year Over Year Net Growth Rate 1.4%
18
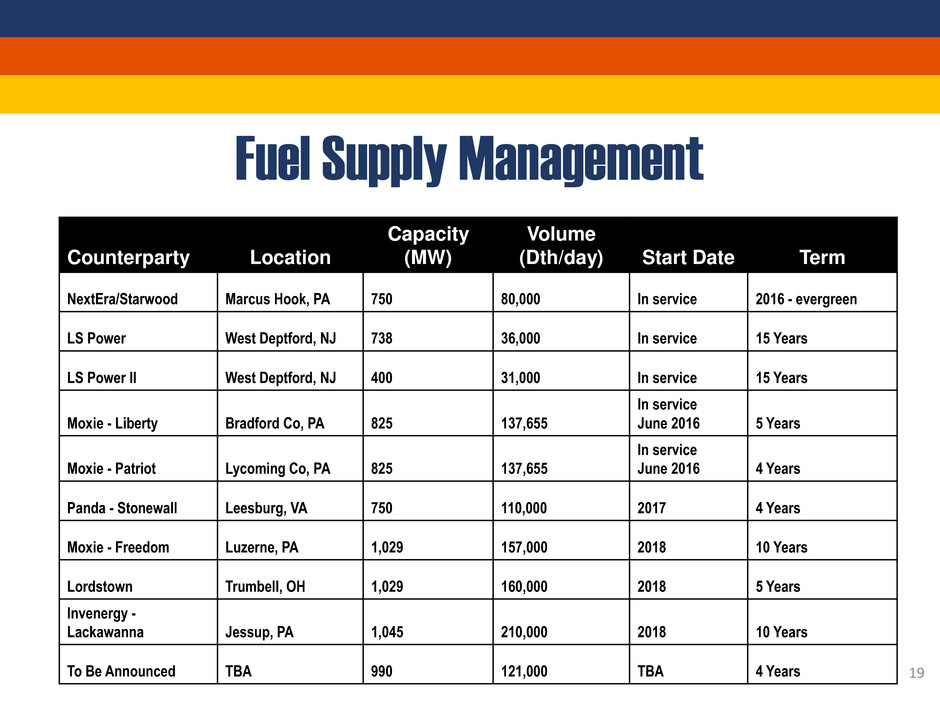
Fuel Supply Management
Counterparty Location
Capacity
(MW)
Volume
(Dth/day) Start Date Term
NextEra/Starwood Marcus Hook, PA 750 80,000 In service 2016 - evergreen
LS Power West Deptford, NJ 738 36,000 In service 15 Years
LS Power II West Deptford, NJ 400 31,000 In service 15 Years
Moxie - Liberty Bradford Co, PA 825 137,655
In service
June 2016 5 Years
Moxie - Patriot Lycoming Co, PA 825 137,655
In service
June 2016 4 Years
Panda - Stonewall Leesburg, VA 750 110,000 2017 4 Years
Moxie - Freedom Luzerne, PA 1,029 157,000 2018 10 Years
Lordstown Trumbell, OH 1,029 160,000 2018 5 Years
Invenergy -
Lackawanna Jessup, PA 1,045 210,000 2018 10 Years
To Be Announced TBA 990 121,000 TBA 4 Years 19
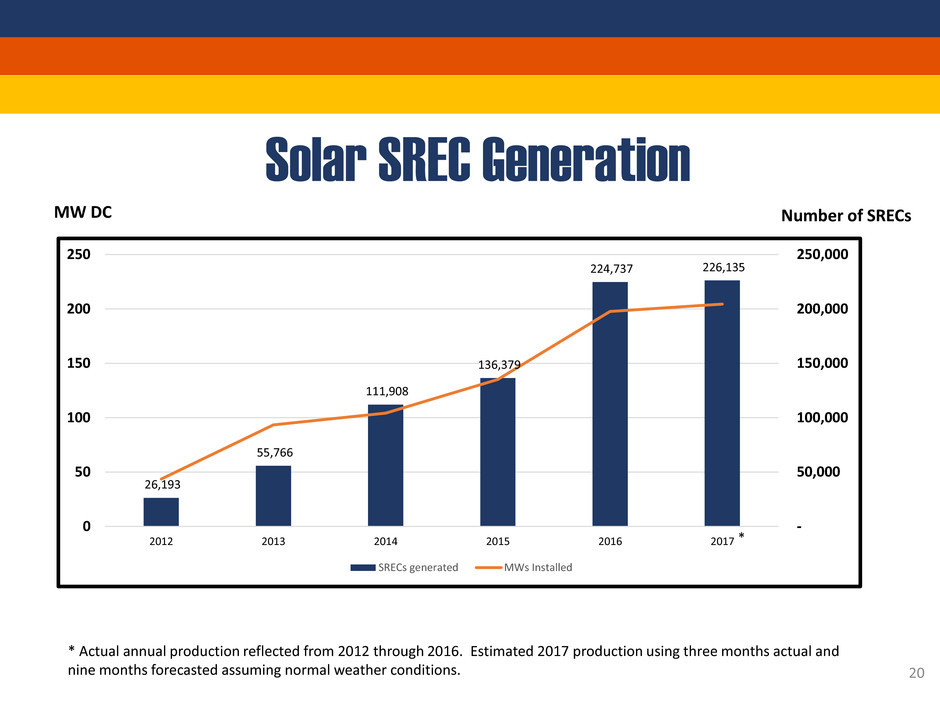
Solar SREC Generation
MW DC Number of SRECs
26,193
55,766
111,908
136,379
224,737 226,135
-
50,000
100,000
150,000
200,000
250,000
0
50
100
150
200
250
2012 2013 2014 2015 2016 2017
SRECs generated MWs Installed
*
* Actual annual production reflected from 2012 through 2016. Estimated 2017 production using three months actual and
nine months forecasted assuming normal weather conditions. 20
