Attached files
| file | filename |
|---|---|
| EX-99.1 - PRESS RELEASE DATED MAY 8, 2017 - J2 GLOBAL, INC. | exh99-1_18060.htm |
| 8-K - FORM 8K DATED MAY 4, 2017 - J2 GLOBAL, INC. | j2form8-k_18060.htm |
EXHIBIT 99.2

Investors Presentation ® First Quarter 2017 Results May 8, 2017
Certain statements in this presentation are “forward-looking statements” within the meaning of the Private Securities Litigation Reform Act of 1995, particularly those regarding our 2017 Financial Guidance. Such forward-looking statements are subject to numerous assumptions, risks and uncertainties that could cause actual results to differ materially from those described in those statements. Readers should carefully review the Risk Factors slide of this presentation. These forward-looking statements are based on management’s expectations or beliefs as of May 8, 2017 and as well as those set forth in our Annual Report on Form 10-K filed by us on March 1, 2017 with the Securities and Exchange Commission (“SEC”) and the other reports we file from time-to-time with the SEC. We undertake no obligation to revise or publicly release any updates to such statements based on future information or actual results. Such forward-looking statements address the following subjects, among others: All information in this presentation speaks as of May 8, 2017 and any redistribution or rebroadcast of this presentation after that date is not intended and will not be construed as updating or confirming such information. Future operating resultsAbility to acquire businesses on acceptable terms and integrate and recognize synergies from acquired businessesDeployment of cash and investment balances to grow the companySubscriber growth, retention, usage levels and average revenue per accountCloud service and digital media growth and continued demand for fax servicesInternational growthNew products, services, features and technologiesCorporate spending including stock repurchasesIntellectual property and related licensing revenuesLiquidity and ability to repay or refinance indebtednessNetwork capacity, coverage, reliability and securityRegulatory developments and taxes 2 Safe Harbor for Forward-Looking Statements
Inability to sustain growth or profitability, particularly in light of an uncertain U.S. and worldwide economy and the related impact on customer acquisition, retention and usage levels, advertising spend and credit and debit card payment declinesReduced use of fax services due to increased use of email, scanning or widespread adoption of digital signatures or otherwiseInability to acquire businesses on acceptable terms or successfully integrate and realize anticipated synergies Failure to offer compelling digital media content causing reduced traffic and advertising levels; loss of advertisers or reduction in advertising spend; increased prevalence or effectiveness of advertising blocking technologies; inability to monetize handheld devices and handheld traffic supplanting monetized traffic; and changes by our vendors or partners that impact our traffic or publisher audience acquisition and/or monetization New or unanticipated costs or tax liabilities, including those relating to federal and state income tax and indirect taxes, such as sales, value-added and telecommunications taxesInability to manage certain risks inherent to our business, such as fraudulent activity, system failure or a security breachCompetition from others with regard to price, service, content and functionalityInadequate intellectual property (IP) protection, expiration or invalidity of key patents, violations of 3rd party IP rights or inability or significant delay in monetizing IPInability to continue to expand our business and operations internationallyInability to maintain required services on acceptable terms with financially stable telecom, co-location and other critical vendors; and inability to obtain telephone numbers in sufficient quantities on acceptable terms and in desired locationsLevel of debt limiting availability of cash flow to reinvest in the business; inability to repay or refinance debt when due; and restrictive covenants relating to debt imposing operating and financial restrictions on business activities or plansInability to maintain and increase our cloud services customer base or average revenue per userEnactment of burdensome telecommunications, Internet, advertising, health care or other regulations, or being subject to existing regulationsInability to adapt to technological change and diversify services & related revenues at acceptable levels of financial returnLoss of services of executive officers and other key employeesOther factors set forth in our Annual Report on Form 10-K filed by us on March 1, 2017 with the Securities and Exchange Commission (“SEC”) and the other reports we file from time-to-time with the SEC The following factors, among others, could cause our business, prospects, financial condition, operating results and cash flows to be materially adversely affected: 3 Risk Factors
Q1 2017 Results
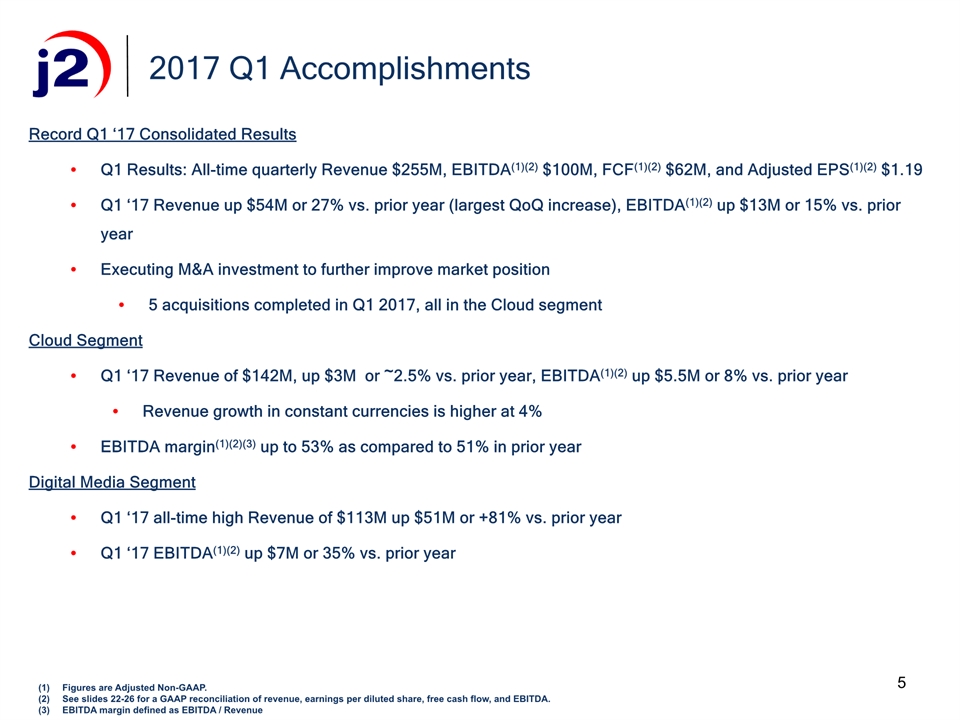
5 Record Q1 ‘17 Consolidated ResultsQ1 Results: All-time quarterly Revenue $255M, EBITDA(1)(2) $100M, FCF(1)(2) $62M, and Adjusted EPS(1)(2) $1.19Q1 ‘17 Revenue up $54M or 27% vs. prior year (largest QoQ increase), EBITDA(1)(2) up $13M or 15% vs. prior yearExecuting M&A investment to further improve market position5 acquisitions completed in Q1 2017, all in the Cloud segmentCloud SegmentQ1 ‘17 Revenue of $142M, up $3M or ~2.5% vs. prior year, EBITDA(1)(2) up $5.5M or 8% vs. prior yearRevenue growth in constant currencies is higher at 4%EBITDA margin(1)(2)(3) up to 53% as compared to 51% in prior yearDigital Media SegmentQ1 ‘17 all-time high Revenue of $113M up $51M or +81% vs. prior yearQ1 ‘17 EBITDA(1)(2) up $7M or 35% vs. prior year 2017 Q1 Accomplishments Figures are Adjusted Non-GAAP. See slides 22-26 for a GAAP reconciliation of revenue, earnings per diluted share, free cash flow, and EBITDA.EBITDA margin defined as EBITDA / Revenue
j2 Global Consolidated
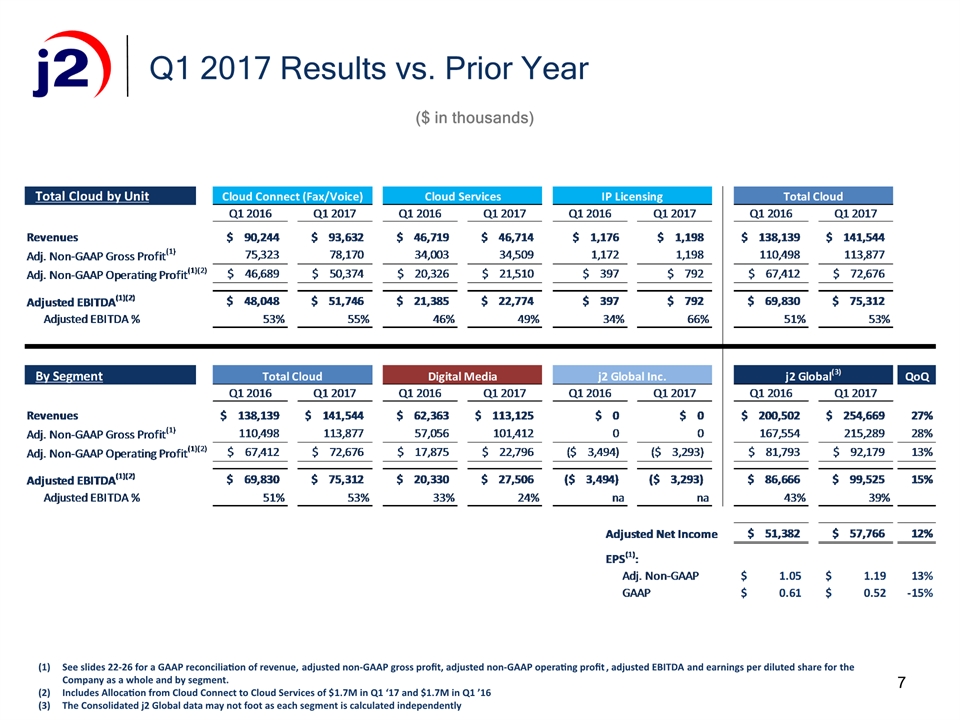
7 Q1 2017 Results vs. Prior Year See slides 22-26 for a GAAP reconciliation of revenue, adjusted non-GAAP gross profit, adjusted non-GAAP operating profit, adjusted EBITDA and earnings per diluted share for the Company as a whole and by segment.Includes Allocation from Cloud Connect to Cloud Services of $1.7M in Q1 ‘17 and $1.7M in Q1 ’16The Consolidated j2 Global data may not foot as each segment is calculated independently ($ in thousands)
Business Cloud Services
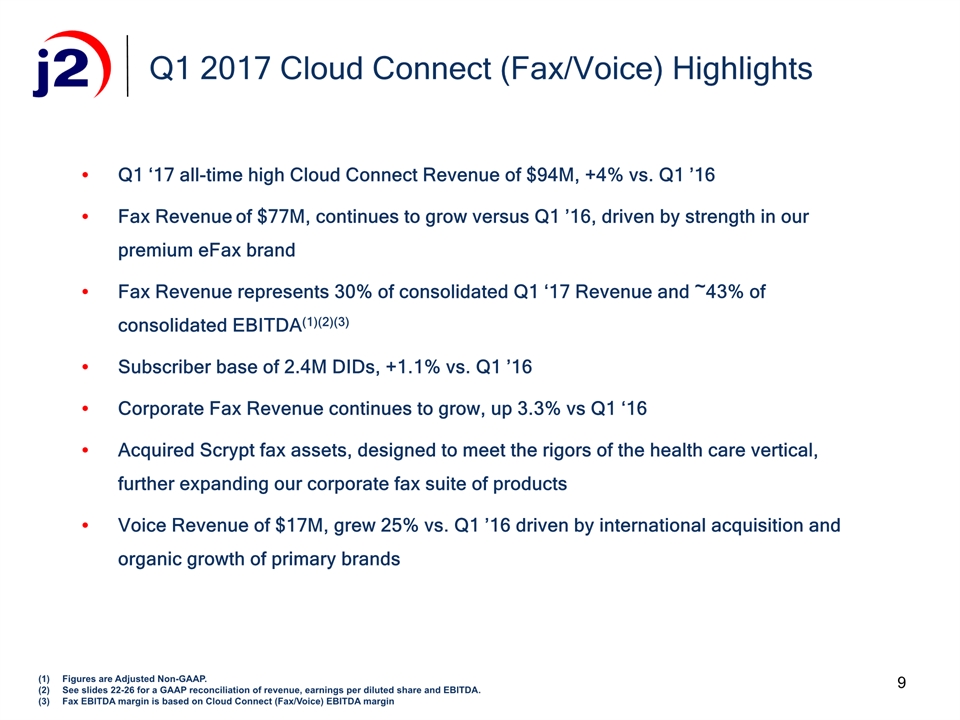
Q1 ‘17 all-time high Cloud Connect Revenue of $94M, +4% vs. Q1 ’16Fax Revenue of $77M, continues to grow versus Q1 ’16, driven by strength in our premium eFax brandFax Revenue represents 30% of consolidated Q1 ‘17 Revenue and ~43% of consolidated EBITDA(1)(2)(3)Subscriber base of 2.4M DIDs, +1.1% vs. Q1 ’16Corporate Fax Revenue continues to grow, up 3.3% vs Q1 ‘16Acquired Scrypt fax assets, designed to meet the rigors of the health care vertical, further expanding our corporate fax suite of productsVoice Revenue of $17M, grew 25% vs. Q1 ’16 driven by international acquisition and organic growth of primary brands Q1 2017 Cloud Connect (Fax/Voice) Highlights Figures are Adjusted Non-GAAP. See slides 22-26 for a GAAP reconciliation of revenue, earnings per diluted share and EBITDA.Fax EBITDA margin is based on Cloud Connect (Fax/Voice) EBITDA margin 9
Q1 ‘17 Revenue of $28M, +1.5% vs Q1 ’16, Revenue growth in constant currencies was higher at 5%EBITDA(1)(2) of $14M, +4% vs. Q1 ’16KeepItSafe EU revenue grew 18% vs. Q1 ’16Continued integration of the acquired businessesFilling key leadership roles in the businessInvesting in R&D to support and develop the platformInitiated channel marketing programs to focus on channel partner growthSuccessfully launched Disaster Recovery as a Service (DRaaS)Strong M&A pipeline Q1 2017 Cloud Backup Highlights Figures are Adjusted Non-GAAPSee slides 22-26 for a GAAP reconciliation of revenue, earnings per diluted share and EBITDA. 10
Q1 ‘17 Revenue of $10.0M vs. $12.3M in Q1 ‘16Migrated to FuseMail: McAfee (EOL), Stay Secure, Comendo, and CudaMailSuccessfully migrated over 2.1M users, retained 80% FX headwindsEurope: double digit EBITDA(1) growth of +17% vs Q4 ’16Full Year 2016 EBITDA(1)(2) margin was 32.5% , Q1 ‘17 is 31.9%Acquired three assets in late Q1 2017SendInc, an email encryption platform, driving customer upgrades and retentionMXForce, small antispam/virusLongscope, small email encryptionHealthy M&A pipeline Q1 2017 Email Highlights Figures are Adjusted Non-GAAPEBITDA margin defined as EBITDA / Revenue 11
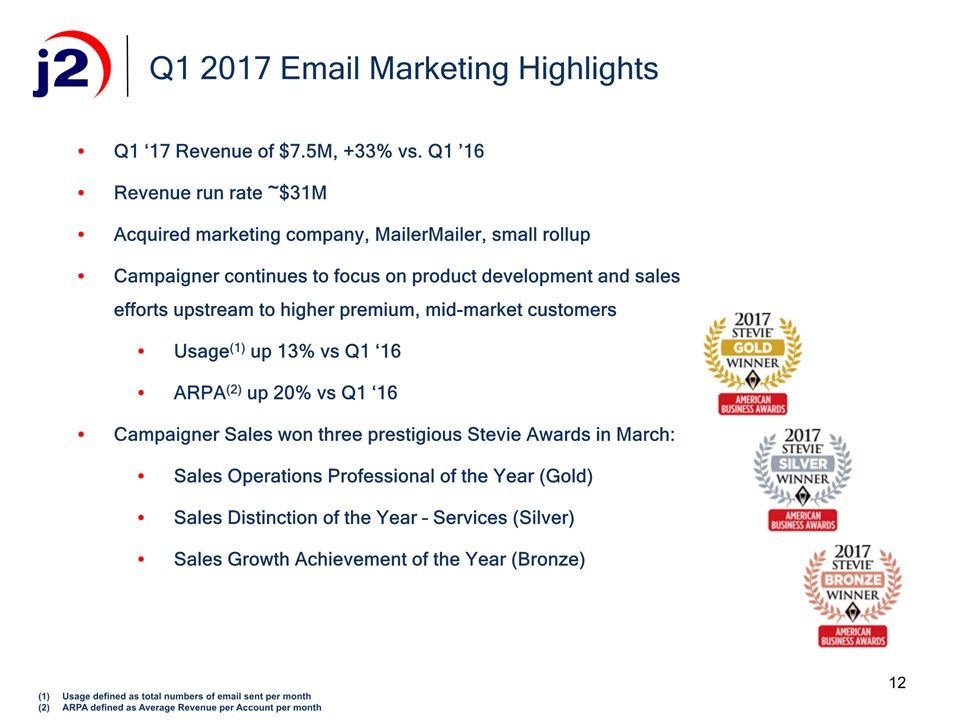
Q1 ‘17 Revenue of $7.5M, +33% vs. Q1 ’16 Revenue run rate ~$31MAcquired marketing company, MailerMailer, small rollup Campaigner continues to focus on product development and sales efforts upstream to higher premium, mid-market customersUsage(1) up 13% vs Q1 ‘16ARPA(2) up 20% vs Q1 ‘16Campaigner Sales won three prestigious Stevie Awards in March: Sales Operations Professional of the Year (Gold)Sales Distinction of the Year – Services (Silver)Sales Growth Achievement of the Year (Bronze) 12 Q1 2017 Email Marketing Highlights Usage defined as total numbers of email sent per monthARPA defined as Average Revenue per Account per month

Digital Media
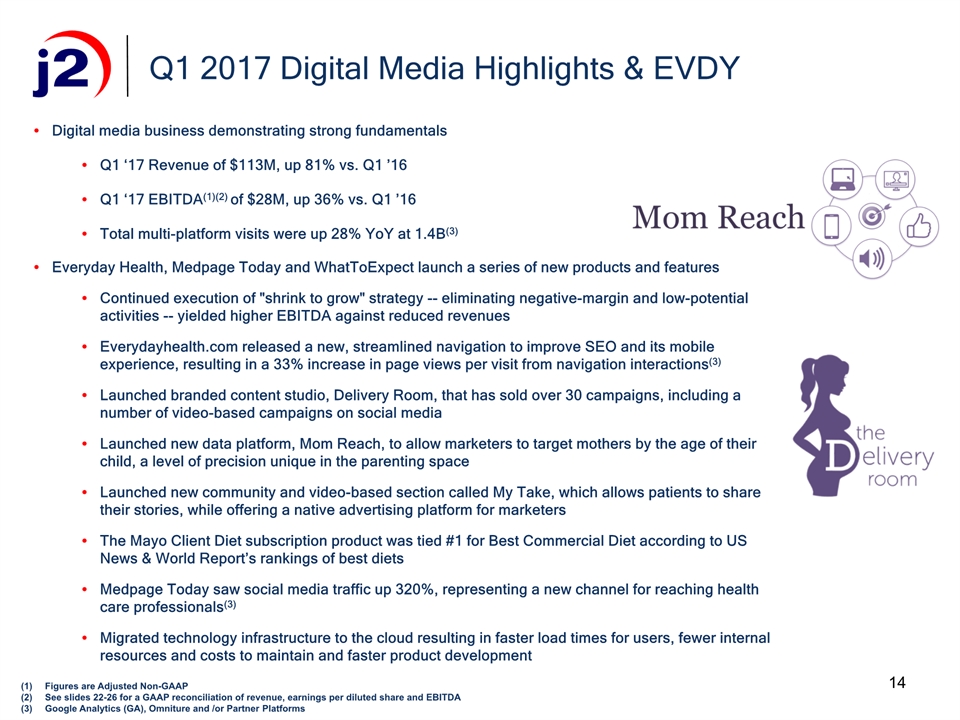
14 Figures are Adjusted Non-GAAPSee slides 22-26 for a GAAP reconciliation of revenue, earnings per diluted share and EBITDAGoogle Analytics (GA), Omniture and /or Partner Platforms Digital media business demonstrating strong fundamentalsQ1 ‘17 Revenue of $113M, up 81% vs. Q1 ’16Q1 ‘17 EBITDA(1)(2) of $28M, up 36% vs. Q1 ’16Total multi-platform visits were up 28% YoY at 1.4B(3)Everyday Health, Medpage Today and WhatToExpect launch a series of new products and featuresContinued execution of "shrink to grow" strategy -- eliminating negative-margin and low-potential activities -- yielded higher EBITDA against reduced revenuesEverydayhealth.com released a new, streamlined navigation to improve SEO and its mobile experience, resulting in a 33% increase in page views per visit from navigation interactions(3)Launched branded content studio, Delivery Room, that has sold over 30 campaigns, including a number of video-based campaigns on social mediaLaunched new data platform, Mom Reach, to allow marketers to target mothers by the age of their child, a level of precision unique in the parenting spaceLaunched new community and video-based section called My Take, which allows patients to share their stories, while offering a native advertising platform for marketersThe Mayo Client Diet subscription product was tied #1 for Best Commercial Diet according to US News & World Report’s rankings of best dietsMedpage Today saw social media traffic up 320%, representing a new channel for reaching health care professionals(3)Migrated technology infrastructure to the cloud resulting in faster load times for users, fewer internal resources and costs to maintain and faster product development Q1 2017 Digital Media Highlights & EVDY
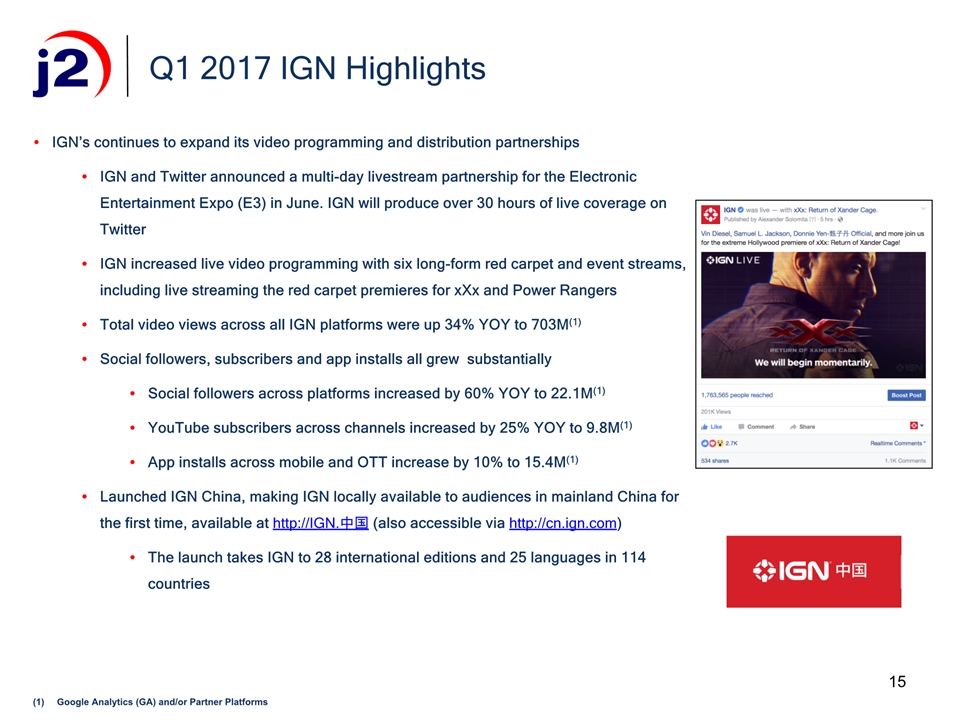
Q1 2017 IGN Highlights IGN’s continues to expand its video programming and distribution partnerships IGN and Twitter announced a multi-day livestream partnership for the Electronic Entertainment Expo (E3) in June. IGN will produce over 30 hours of live coverage on TwitterIGN increased live video programming with six long-form red carpet and event streams, including live streaming the red carpet premieres for xXx and Power RangersTotal video views across all IGN platforms were up 34% YOY to 703M(1)Social followers, subscribers and app installs all grew substantiallySocial followers across platforms increased by 60% YOY to 22.1M(1)YouTube subscribers across channels increased by 25% YOY to 9.8M(1)App installs across mobile and OTT increase by 10% to 15.4M(1)Launched IGN China, making IGN locally available to audiences in mainland China for the first time, available at http://IGN.中国 (also accessible via http://cn.ign.com)The launch takes IGN to 28 international editions and 25 languages in 114 countries 15 Google Analytics (GA) and/or Partner Platforms
Q1 2017 Ookla/Speedtest Highlights Ookla achieved several key milestones during Q1 2017Total tests across all platforms exceed 600M tests (+10% YOY) with mobile tests growing 22% YOY(1) Speedtest app installs reached 265M, an increase of 47% YOY(2)Released Speedtest Custom replacing NetGuage (Ookla's licensed legacy Flash product) with an HTML5 solution (http://www.ookla.com/speedtest-custom) 16 Internal Test DatabasePlatform Portals

2017 Financial Guidance
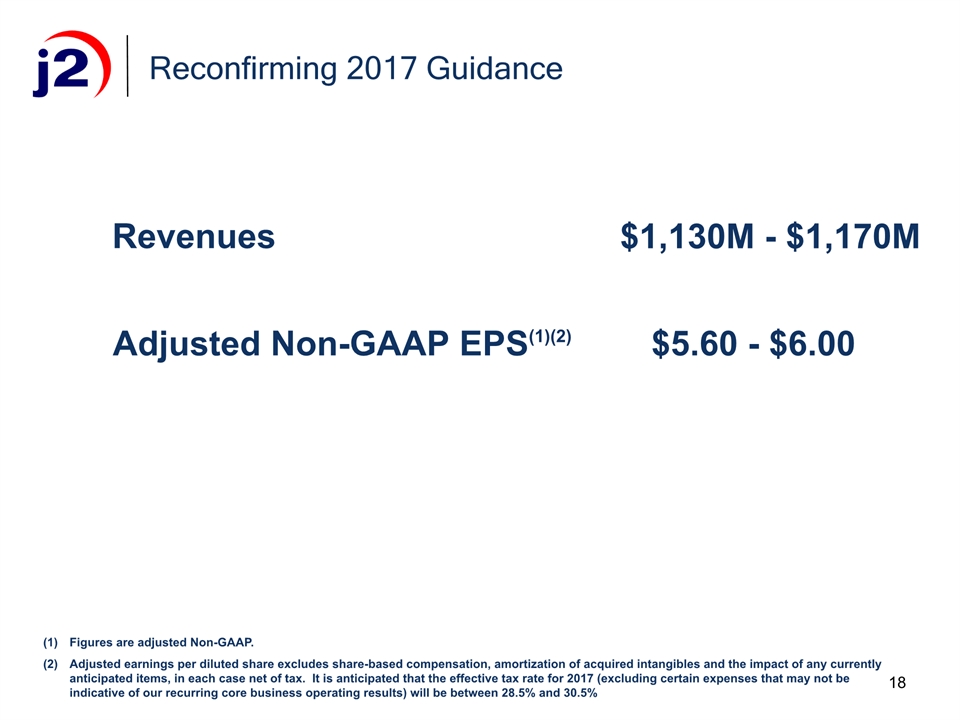
Revenues $1,130M - $1,170M Adjusted Non-GAAP EPS(1)(2) $5.60 - $6.00 18 Reconfirming 2017 Guidance Figures are adjusted Non-GAAP.Adjusted earnings per diluted share excludes share-based compensation, amortization of acquired intangibles and the impact of any currently anticipated items, in each case net of tax. It is anticipated that the effective tax rate for 2017 (excluding certain expenses that may not be indicative of our recurring core business operating results) will be between 28.5% and 30.5%
Supplemental Information
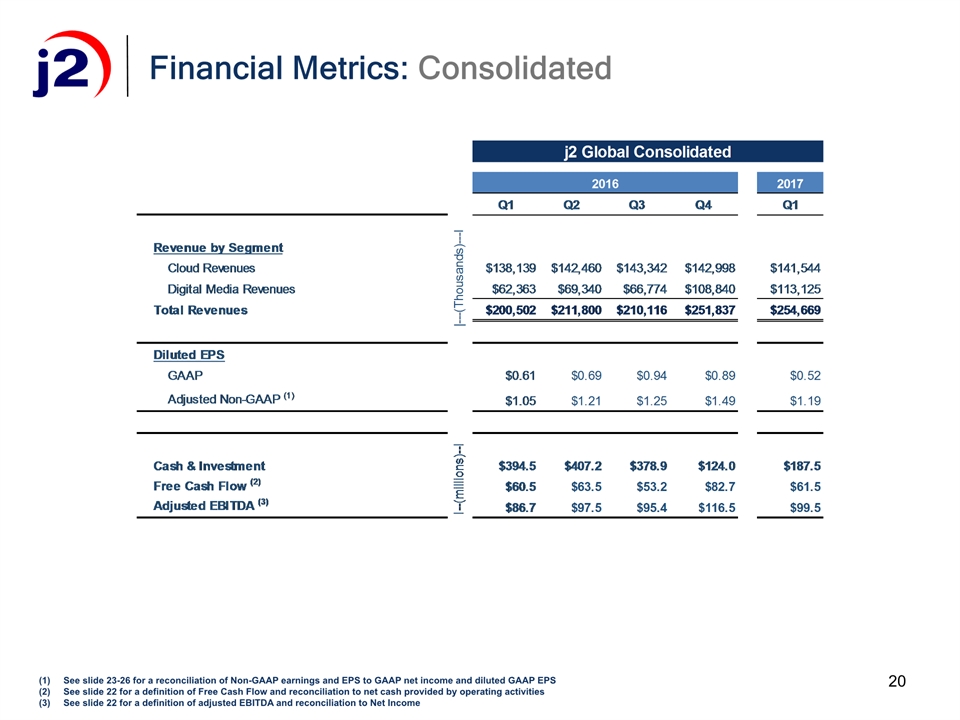
20 See slide 23-26 for a reconciliation of Non-GAAP earnings and EPS to GAAP net income and diluted GAAP EPSSee slide 22 for a definition of Free Cash Flow and reconciliation to net cash provided by operating activitiesSee slide 22 for a definition of adjusted EBITDA and reconciliation to Net Income Financial Metrics: Consolidated
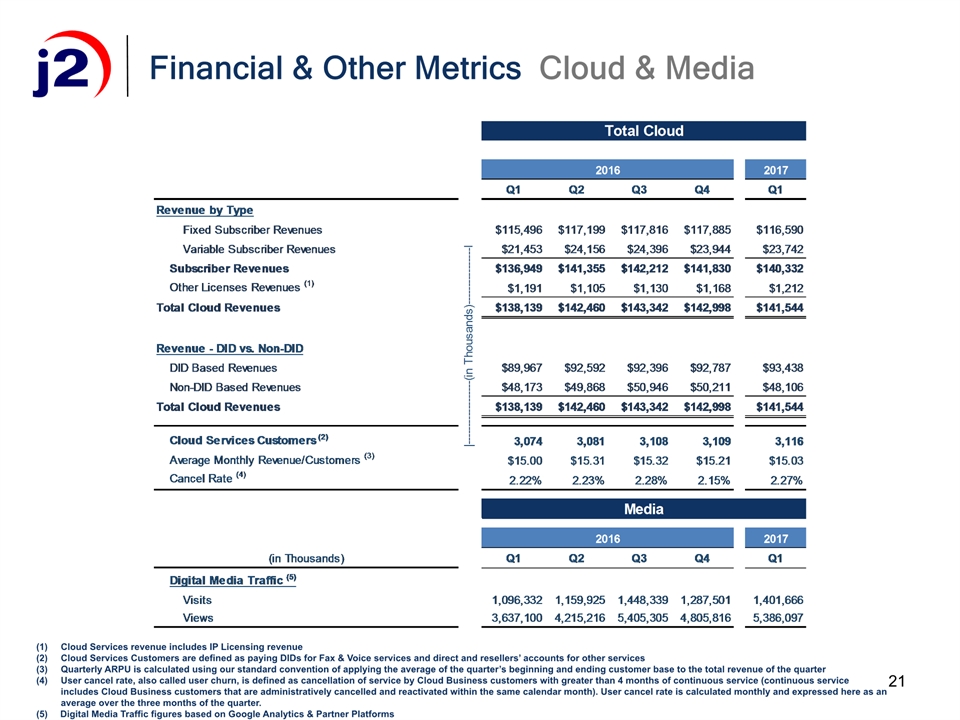
21 Financial & Other Metrics Cloud & Media Cloud Services revenue includes IP Licensing revenueCloud Services Customers are defined as paying DIDs for Fax & Voice services and direct and resellers’ accounts for other servicesQuarterly ARPU is calculated using our standard convention of applying the average of the quarter’s beginning and ending customer base to the total revenue of the quarterUser cancel rate, also called user churn, is defined as cancellation of service by Cloud Business customers with greater than 4 months of continuous service (continuous service includes Cloud Business customers that are administratively cancelled and reactivated within the same calendar month). User cancel rate is calculated monthly and expressed here as an average over the three months of the quarter. Digital Media Traffic figures based on Google Analytics & Partner Platforms
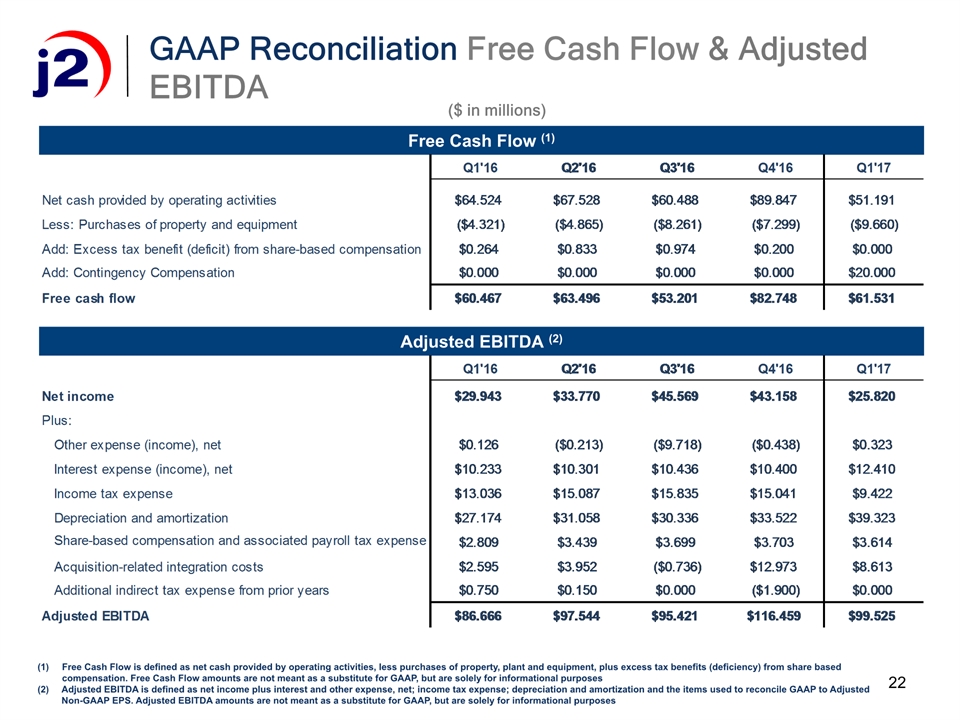
22 Free Cash Flow (1) Free Cash Flow is defined as net cash provided by operating activities, less purchases of property, plant and equipment, plus excess tax benefits (deficiency) from share based compensation. Free Cash Flow amounts are not meant as a substitute for GAAP, but are solely for informational purposesAdjusted EBITDA is defined as net income plus interest and other expense, net; income tax expense; depreciation and amortization and the items used to reconcile GAAP to Adjusted Non-GAAP EPS. Adjusted EBITDA amounts are not meant as a substitute for GAAP, but are solely for informational purposes GAAP Reconciliation Free Cash Flow & Adjusted EBITDA Adjusted EBITDA (2) ($ in millions)
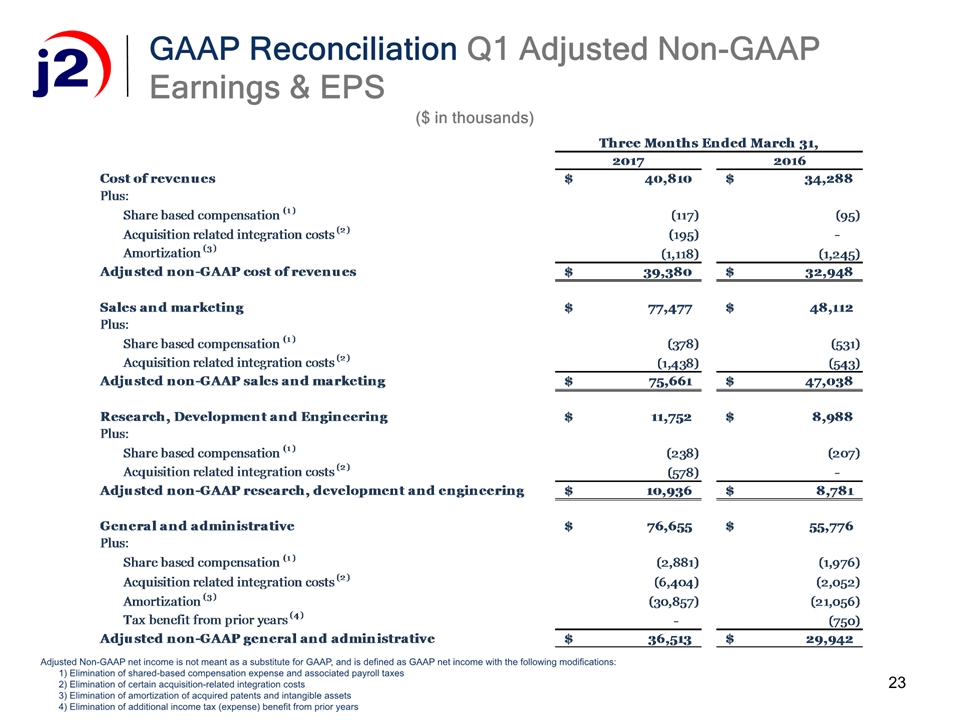
23 GAAP Reconciliation Q1 Adjusted Non-GAAP Earnings & EPS Adjusted Non-GAAP net income is not meant as a substitute for GAAP, and is defined as GAAP net income with the following modifications: 1) Elimination of shared-based compensation expense and associated payroll taxes 2) Elimination of certain acquisition-related integration costs 3) Elimination of amortization of acquired patents and intangible assets 4) Elimination of additional income tax (expense) benefit from prior years ($ in thousands)
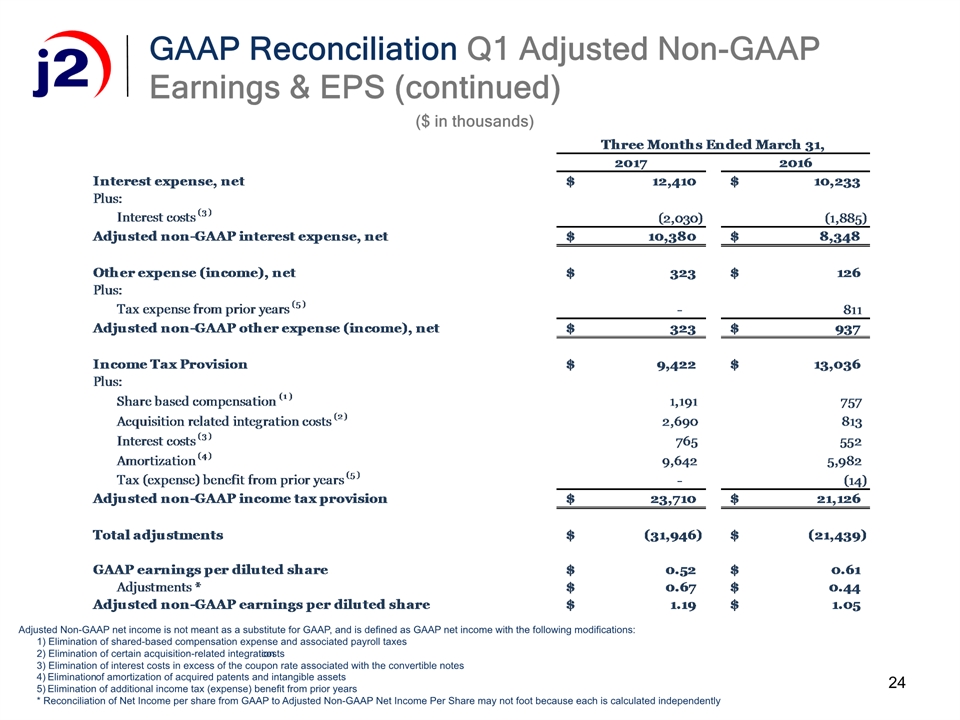
24 GAAP Reconciliation Q1 Adjusted Non-GAAP Earnings & EPS (continued) Adjusted Non-GAAP net income is not meant as a substitute for GAAP, and is defined as GAAP net income with the following modifications: 1) Elimination of shared-based compensation expense and associated payroll taxes 2) Elimination of certain acquisition-related integration costs 3) Elimination of interest costs in excess of the coupon rate associated with the convertible notes 4) Elimination of amortization of acquired patents and intangible assets 5) Elimination of additional income tax (expense) benefit from prior years * Reconciliation of Net Income per share from GAAP to Adjusted Non-GAAP Net Income Per Share may not foot because each is calculated independently ($ in thousands)
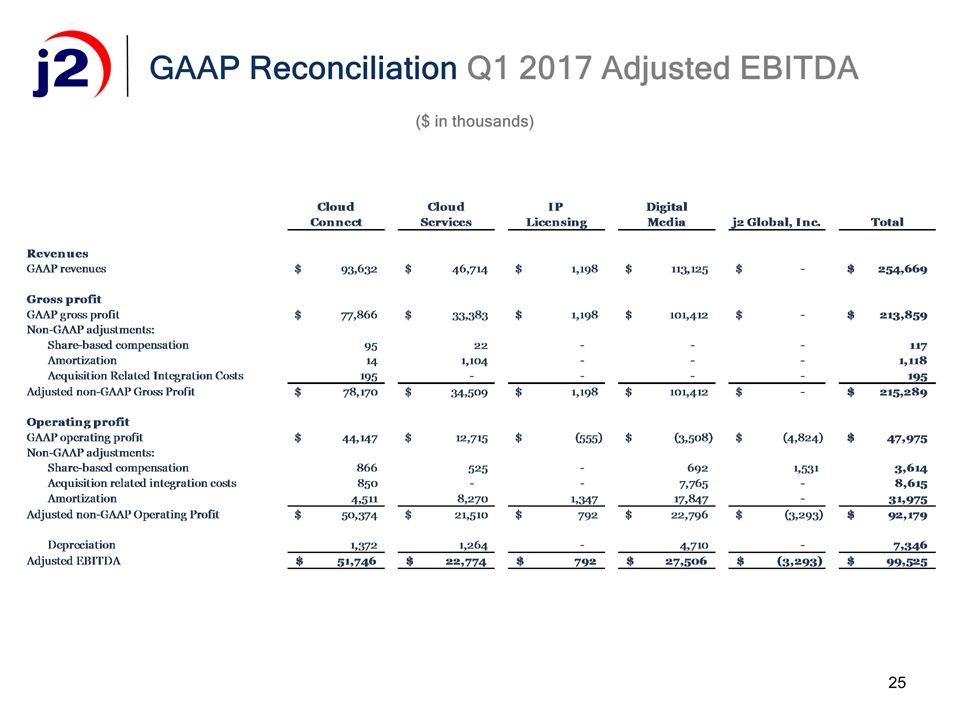
25 GAAP Reconciliation Q1 2017 Adjusted EBITDA ($ in thousands)
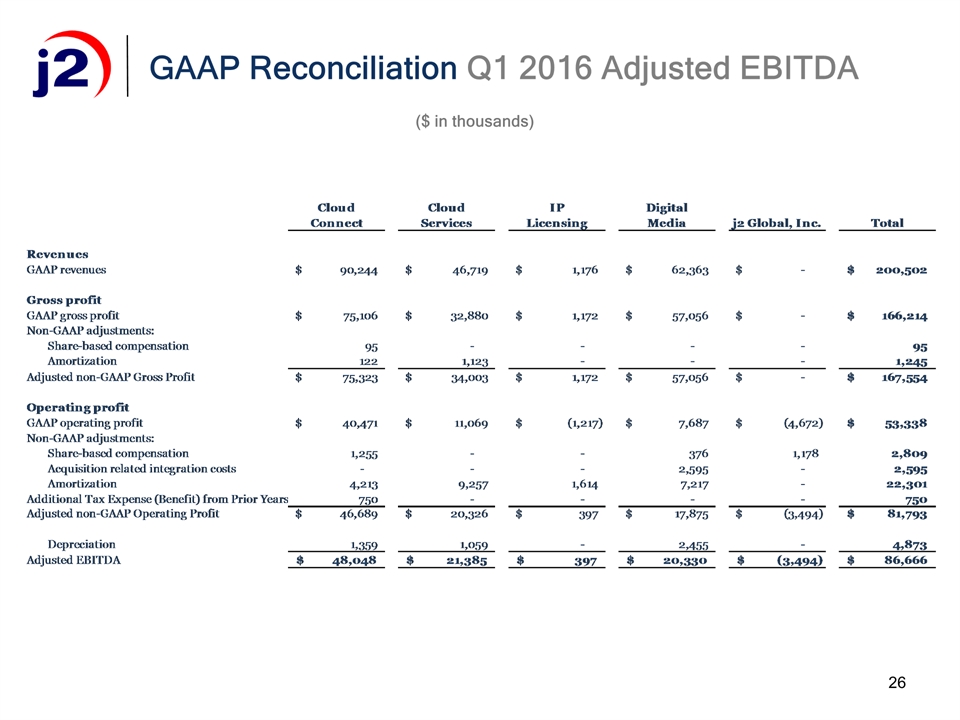
26 GAAP Reconciliation Q1 2016 Adjusted EBITDA ($ in thousands)

®