Attached files
| file | filename |
|---|---|
| EX-99.1 - EXHIBIT 99.1 - Atkore Inc. | atkr2q17exhibit991.htm |
| 8-K - ATKR 2Q17 FORM 8-K - Atkore Inc. | atkr2q17form8-k.htm |

Second Quarter 2017 Earnings Presentation
May 9, 2017

1
Cautionary statements
This presentation contains forward-looking statements that are subject to known and unknown risks and uncertainties, many of which are beyond our control. All statements other than statements of historical
fact included in this presentation are forward-looking statements. Forward-looking statements appearing throughout this presentation include, without limitation, statements regarding our intentions, beliefs,
assumptions or current expectations concerning, among other things, financial position; results of operations; cash flows; prospects; growth strategies or expectations; customer retention; the outcome (by
judgment or settlement) and costs of legal, administrative or regulatory proceedings, investigations or inspections, including, without limitation, collective, representative or any other litigation; and the impact of
prevailing economic conditions. You can identify forward-looking statements by the fact that they do not relate strictly to historical or current facts. These statements may include words such as “believes,”
“expects,” “may,” “will,” “shall,” “should,” “would,” “could,” “seeks,” “aims,” “projects,” “is optimistic,” “intends,” “plans,” “estimates,” “anticipates” and other comparable terms. We caution you that forward-looking
statements are not guarantees of future performance or outcomes and that actual performance and outcomes, including, without limitation, our actual results of operations, financial condition and liquidity, and
the development of the market in which we operate, may differ materially from those made in or suggested by the forward-looking statements contained in this presentation. In addition, even if our results of
operations, financial condition and cash flows, and the development of the market in which we operate, are consistent with the forward-looking statements contained in this presentation, those results or
developments may not be indicative of results or developments in subsequent periods. A number of important factors, including, without limitation, the risks and uncertainties discussed under the captions “Risk
Factors” and Management’s Discussion and Analysis of Financial Condition and Results of Operations” in the Quarterly Report on Form 10-Q for the fiscal quarter ended March 31, 2017, filed with the U.S.
Securities and Exchange Commission on May 9, 2017 (File No. 001-37793), could cause actual results and outcomes to differ materially from those reflected in the forward-looking statements. Because of
these risks, we caution that you should not place undue reliance on any of our forward-looking statements. New risks and uncertainties arise from time to time, and it is impossible for us to predict those events
or how they may affect us. Further, any forward-looking statement speaks only as of the date on which it is made. We undertake no obligation to revise the forward-looking statements in this presentation after
the date of this presentation.
Market data and industry information used throughout this presentation are based on management’s knowledge of the industry and the good faith estimates of management. We also relied, to the extent
available, upon management’s review of independent industry surveys, forecasts and publications and other publicly available information prepared by a number of third party sources. All of the market data
and industry information used in this presentation involves a number of assumptions and limitations which we believe to be reasonable, and you are cautioned not to give undue weight to such estimates.
Although we believe that these sources are reliable, we cannot guarantee the accuracy or completeness of this information, and we have not independently verified this information. While we believe the
estimated market position, market opportunity and market size information included in this presentation are generally reliable, such information, which is derived in part from management’s estimates and
beliefs, is inherently uncertain and imprecise. Projections, assumptions and estimates of our future performance and the future performance of the industry in which we operate are subject to a high degree of
uncertainty and risk due to a variety of factors, including those described above. These and other factors could cause results to differ materially from those expressed in our estimates and beliefs and in the
estimates prepared by independent parties.
We present Adjusted EBITDA. Adjusted EBITDA margin, Adjusted net income, Adjusted earnings per share, Net debt (total debt less cash and cash equivalents), and Leverage ratio (net debt or total debt less
cash and cash equivalents, over Adjusted EBITDA on trailing twelve month basis) to help us describe our operating and financial performance. Adjusted EBITDA, Adjusted EBITDA margin, Adjusted net
income, Adjusted earnings per share, and Leverage ratio are non-GAAP financial measures commonly used in our industry and have certain limitations and should not be construed as alternatives to net
income, net sales and other income data measures (as determined in accordance with generally accepted accounting principles in the United States, or GAAP), or as better indicators of operating performance.
Adjusted EBITDA, Adjusted EBITDA margin, Adjusted net income, Adjusted earnings per share, Net debt (total debt less cash and cash equivalents), and Leverage ratio (net debt or total debt less cash and
cash equivalents over Adjusted EBITDA on a trailing twelve month basis), as defined by us may not be comparable to similar non-GAAP measures presented by other issuers. Our presentation of such
measures should not be construed as an inference that our future results will be unaffected by unusual or non-recurring items. See the appendix to this presentation for a reconciliation of Adjusted EBITDA to
net income, Adjusted net income to adjusted net income per share, and net debt over Adjusted EBITDA on a trailing twelve month basis.
Fiscal Periods - The Company has a fiscal year that ends on September 30th. It is the Company's practice to establish quarterly closings using a 4-5-4 calendar. The Company's fiscal quarters end on the last
Friday in December, March and June.

2
Key Takeaways
• Despite choppiness in our markets and solar headwinds, we were able to deliver
EBITDA for the quarter at the high-end of our guidance
• Non-Residential construction market sentiment and leading indicators in our business
are positive, but momentum is building slower than anticipated in Electrical Raceway
• Mechanical Products & Solutions volume is stabilizing and building strength in value
added applications (healthcare, conveyors, signposts, prefabrication)
• We are tightening our 2017 Adjusted EBITDA guidance range to $235 to $245mm and
our Adjusted EPS range to $1.55 to $1.65
• The Atkore team continues to outperform market inputs; Our ability to generate
productivity savings, improve margins through innovation, and pass through material
cost increases is driving long-term growth and earnings expansion

3
Financial Highlights – Q2 2017
($’s in millions)
Q2
2017
Q2
2016
Y/Y
Change
Net Sales $372.8 $353.0 5.6%
Net Income $18.9 $14.0 35.2%
Adjusted EBITDA(1) $56.1 $58.4 (3.8%)
Net Income Margin 5.1% 4.0% +110 bps
Adjusted EBITDA
Margin(1) 15.1% 16.5% (140 bps)
Net Income per Share $0.28 $0.22 27.3%
Adjusted Net Income
per Share(1) $0.35 $0.31 12.9%
• Standard work enables pass
through of increased material costs
• Construction demand choppy but
improving
• EBITDA growth excluding
continued solar headwinds
• Unusual and non-recurring items
- Gain booked on 2012 sale of Saudi JV ($5.8M)
- U.S. Commerce Dept. ruling on malleable
metal fitting imports ($7.5M impact 2014-2017)
Strong Productivity and
Pricing Initiatives Continue
(1) See non-GAAP reconciliation in appendix

4
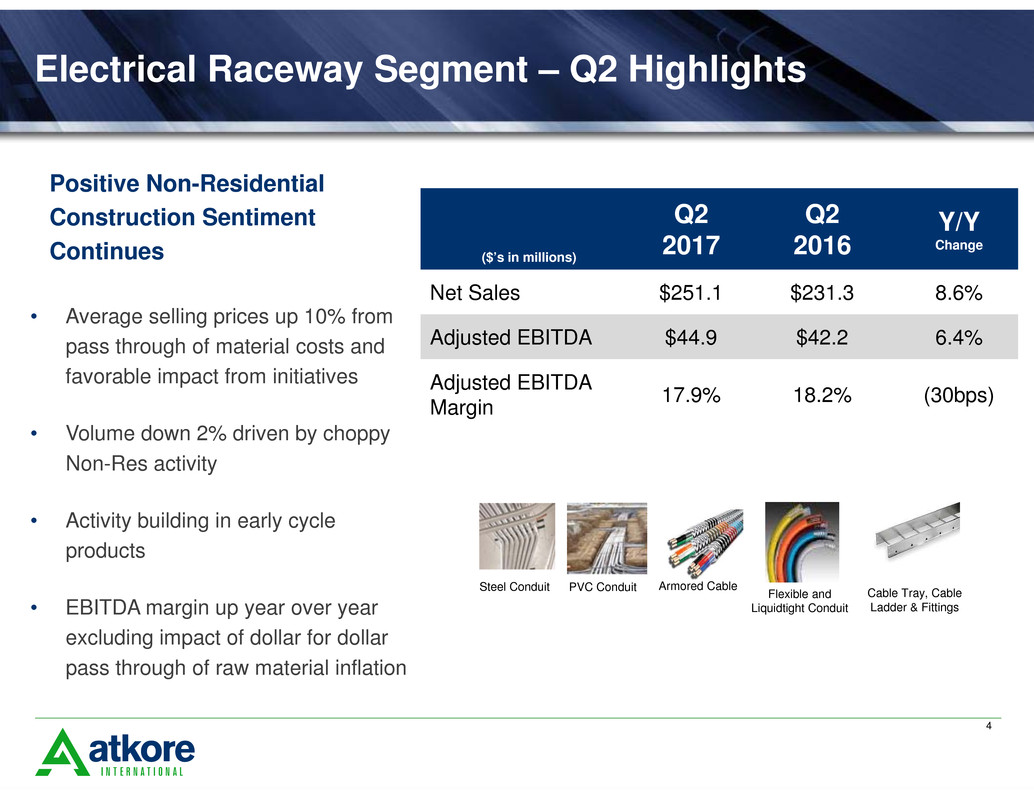
Electrical Raceway Segment – Q2 Highlights
• Average selling prices up 10% from
pass through of material costs and
favorable impact from initiatives
• Volume down 2% driven by choppy
Non-Res activity
• Activity building in early cycle
products
• EBITDA margin up year over year
excluding impact of dollar for dollar
pass through of raw material inflation
Steel Conduit PVC Conduit Armored Cable Flexible and
Liquidtight Conduit
Cable Tray, Cable
Ladder & Fittings
($’s in millions)
Q2
2017
Q2
2016
Y/Y
Change
Net Sales $251.1 $231.3 8.6%
Adjusted EBITDA $44.9 $42.2 6.4%
Adjusted EBITDA
Margin 17.9% 18.2% (30bps)
Positive Non-Residential
Construction Sentiment
Continues

5
Mechanical Products & Solutions Segment Highlights
• Price up 7% due to pass through of
material cost increases and
initiatives
• Volume down 5% due primarily to
impact of solar comparison
• Adjusted EBITDA flat excluding
solar comparison impact
• EBITDA margins compressed from
solar headwinds and impact of
dollar for dollar pass through of raw
material inflation
($’s in millions)
Q2
2017
Q2
2016
Y/Y
Change
Net Sales $122.0 $122.2 (0.2%)
Adjusted EBITDA $17.3 $22.3 (22.6%)
Adjusted EBITDA
Margin 14.2% 18.3% (410bps)
Metal Framing &
Related Fittings
In-Line Galvanized
Mechanical Tube
Construction Design
& Services
Solar Headwinds Moderating;
Momentum Building in Value
Added Applications

6
Key Balance Sheet and Cash Flow Metrics
($mm) 3/31/2017
Cash and cash equivalents $77.9
Total Debt $492.7
CapEx $8.4
Net cash from operating activities $25.1
TTM Adjusted EBITDA(1) $234.6
Leverage Ratio (1)
Total debt / TTM Adjusted EBITDA(1) 2.1x
Net debt / TTM Adjusted EBITDA(1) 1.8x
Metrics Leverage Ratio(1)
1. Leverage ratio is defined as net debt (total debt less cash and cash equivalents) divided by Adjusted EBITDA on a trailing twelve month (TTM)
basis or March 26 ,2016 to March 31, 2017. Total debt was $692.9mm, $652.2mm, and $630.3mm, as of September 26, 2014, September 25,
2015, and September 30, 2016, respectively. Cash and cash equivalents were $33.4mm, $80.6mm, and $200.3mm as of September 26, 2014,
September 25, 2015, and September 30, 2016, respectively. Leverage ratio for all periods above and TTM Adjusted EBITDA for the TTM ended
March 31, 2017 is reconciled in the appendix.
5.2x
3.5x
1.8x 1.8x
FY 2014 FY 2015 FY 2016 TTM 3/31/17
Strong Cash Flow and Leverage Ratio
Support M&A Strategy

7
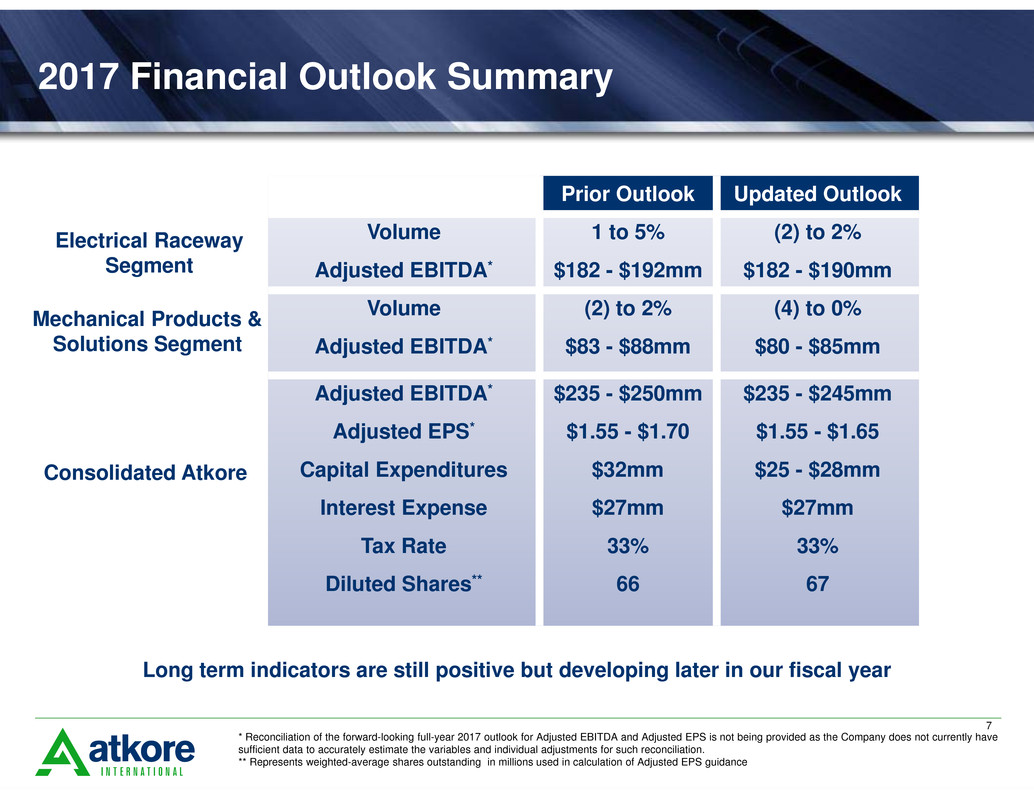
2017 Financial Outlook Summary
Electrical Raceway
Segment
Consolidated Atkore
Mechanical Products &
Solutions Segment
Prior Outlook Updated Outlook
Volume 1 to 5% (2) to 2%
Adjusted EBITDA* $182 - $192mm $182 - $190mm
Volume (2) to 2% (4) to 0%
Adjusted EBITDA* $83 - $88mm $80 - $85mm
Adjusted EBITDA* $235 - $250mm $235 - $245mm
Adjusted EPS* $1.55 - $1.70 $1.55 - $1.65
Capital Expenditures $32mm $25 - $28mm
Interest Expense $27mm $27mm
Tax Rate 33% 33%
Diluted Shares** 66 67
* Reconciliation of the forward-looking full-year 2017 outlook for Adjusted EBITDA and Adjusted EPS is not being provided as the Company does not currently have
sufficient data to accurately estimate the variables and individual adjustments for such reconciliation.
** Represents weighted-average shares outstanding in millions used in calculation of Adjusted EPS guidance
Long term indicators are still positive but developing later in our fiscal year

8
Key Takeaways
• Despite choppiness in our markets and solar headwinds, we were able to deliver
EBITDA for the quarter at the high-end of our guidance
• Non-Residential construction market sentiment and leading indicators in our business
are positive, but momentum is building slower than anticipated in Electrical Raceway
• Mechanical Products & Solutions volume is stabilizing and building strength in value
added applications (healthcare, conveyors, signposts, prefabrication)
• We are tightening our 2017 Adjusted EBITDA guidance range to $235 to $245MM and
our Adjusted EPS range to $1.55 to $1.65
• The Atkore team continues to outperform market inputs; Our ability to generate
productivity savings, improve margins through innovation, and pass through material
cost increases is driving long-term growth and earnings expansion

Appendix

10
Segment Information
Three Months Ended
March 31, 2017 March 25, 2016
(in thousands) Net sales
Adjusted
EBITDA
Adjusted
EBITDA
Margin Net sales
Adjusted
EBITDA
Adjusted
EBITDA
Margin
Electrical Raceway $ 251,108 $ 44,866 17.9 % $ 231,293 $ 42,186 18.2 %
Mechanical Products & Solutions 122,027 $ 17,268 14.2 % 122,245 $ 22,324 18.3 %
Eliminations (344) (492)
Consolidated operations $ 372,791 $ 353,046

11
Adjusted earnings per share reconciliation
Consolidated Atkore International Group Inc.
Three Months Ended Six months ended
(in thousands, except per share data) March 31, 2017 March 25, 2016 March 31, 2017 March 25, 2016
Net income $ 18,935 $ 14,007 $ 36,317 $ 22,579
Stock-based compensation 3,584 9,998 6,304 12,043
Consulting fee — 875 — 1,750
Loss (gain) on extinguishment of debt — (1,661) 9,805 (1,661)
Gain on sale of joint venture (5,774) — (5,774) —
Impact of Fence and Sprinkler exit — — — 811
Legal matters 7,501 — 7,501 —
Other (a) 447 (1,294) (10,483) 4,213
Pre-tax adjustments to net income 5,758 7,918 7,353 17,156
Tax effect (1,458) (2,835) (2,028) (6,142)
Adjusted net income $ 23,235 $ 19,090 $ 41,642 $ 33,593
Weighted-Average Common Shares Outstanding
Basic 63,252 62,490 62,948 62,478
Diluted 66,888 62,490 66,446 62,478
Net income (loss) per share
Basic $ 0.30 $ 0.22 $ 0.58 $ 0.36
Diluted $ 0.28 $ 0.22 $ 0.55 $ 0.36
Adjusted Net income (loss) per share
Basic $ 0.37 $ 0.31 $ 0.66 $ 0.54
Diluted $ 0.35 $ 0.31 $ 0.63 $ 0.54
(a) Represents other items, such as lower-of-cost-or-market inventory adjustments and release of indemnified uncertain tax positions.

12
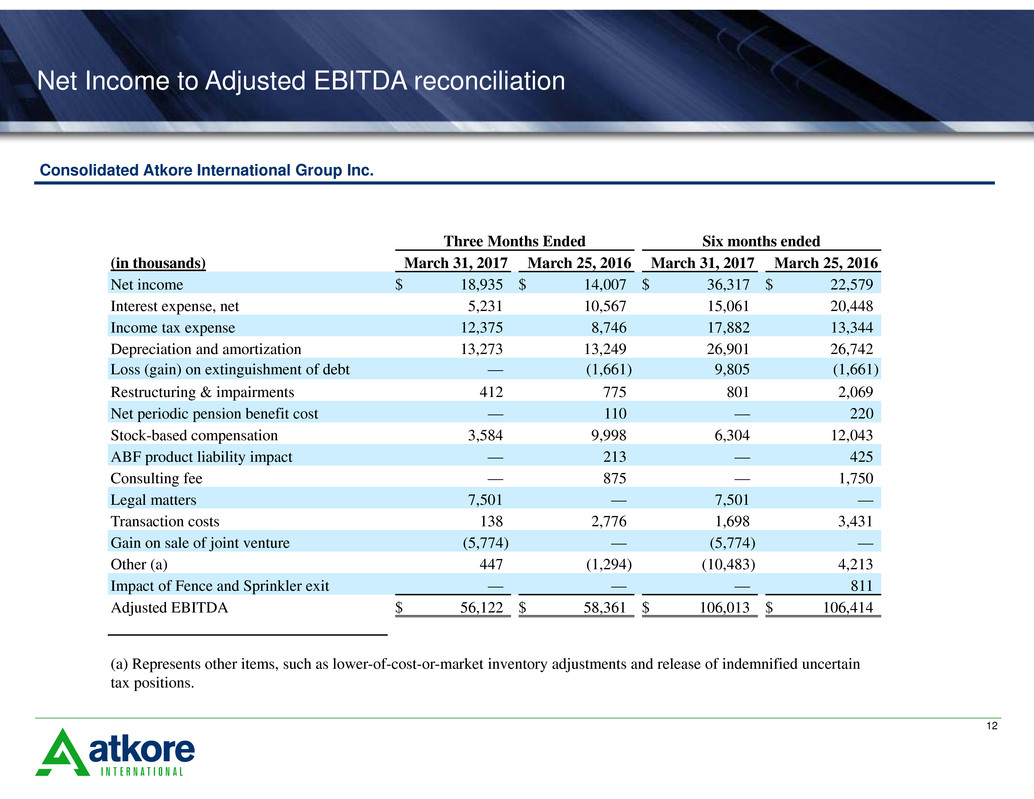
Net Income to Adjusted EBITDA reconciliation
Consolidated Atkore International Group Inc.
Three Months Ended Six months ended
(in thousands) March 31, 2017 March 25, 2016 March 31, 2017 March 25, 2016
Net income $ 18,935 $ 14,007 $ 36,317 $ 22,579
Interest expense, net 5,231 10,567 15,061 20,448
Income tax expense 12,375 8,746 17,882 13,344
Depreciation and amortization 13,273 13,249 26,901 26,742
Loss (gain) on extinguishment of debt — (1,661) 9,805 (1,661)
Restructuring & impairments 412 775 801 2,069
Net periodic pension benefit cost — 110 — 220
Stock-based compensation 3,584 9,998 6,304 12,043
ABF product liability impact — 213 — 425
Consulting fee — 875 — 1,750
Legal matters 7,501 — 7,501 —
Transaction costs 138 2,776 1,698 3,431
Gain on sale of joint venture (5,774) — (5,774) —
Other (a) 447 (1,294) (10,483) 4,213
Impact of Fence and Sprinkler exit — — — 811
Adjusted EBITDA $ 56,122 $ 58,361 $ 106,013 $ 106,414
(a) Represents other items, such as lower-of-cost-or-market inventory adjustments and release of indemnified uncertain
tax positions.

13
Net debt / Adjusted EBITDA reconciliation
Consolidated Atkore International Group Inc.
($ in thousands) March 31, 2017
September 30,
2016
September 25,
2015
September 26,
2014
Short-term debt and current maturities of
long-term debt $ 4,220 $ 1,267 $ 2,864 $ 42,887
Long-term debt 488,467 629,046 649,344 649,980
Total debt 492,687 630,313 652,208 692,867
Less cash and cash equivalents 77,931 200,279 80,598 33,360
Net debt $ 414,756 $ 430,034 $ 571,610 $ 659,507
TTM Adjusted EBITDA $ 234,601 $ 235,002 $ 163,949 $ 126,597
Total debt/TTM Adjusted EBITDA 2.1 x 2.7 x 4.0 x 5.5 x
Net debt/TTM Adjusted EBITDA 1.8 x 1.8 x 3.5 x 5.2 x

14
Net Income to Adjusted EBITDA reconciliation
Consolidated Atkore International Group Inc.
TTM Three Months Ended
(in thousands)
March 31,
2017
March 31,
2017
December 30,
2016
September 30,
2016 June 24, 2016
Net income $ 72,534 $ 18,935 $ 17,382 $ 15,572 $ 20,645
Interest expense, net 36,411 5,231 9,830 11,181 10,169
Income tax expense 32,523 12,375 5,507 3,892 10,749
Depreciation and amortization 55,176 13,273 13,628 14,953 13,322
Loss (gain) on extinguishment of debt 9,805 — 9,805 — —
Restructuring & impairments 2,828 412 389 1,701 326
Net periodic pension benefit cost 220 — — 110 110
Stock-based compensation 15,388 3,584 2,720 4,230 4,854
ABF product liability impact 424 — — 212 212
Consulting fee 13,675 — — — 13,675
Legal matters 8,883 7,501 — 82 1,300
Transaction costs 6,099 138 1,560 2,484 1,917
Gain on sale of joint venture (5,774) (5,774) — — —
Other (13,591) 447 (10,930) 6,947 (10,055)
Adjusted EBITDA $ 234,601 $ 56,122 $ 49,891 $ 61,364 $ 67,224
