Attached files
| file | filename |
|---|---|
| EX-99.1 - EX-99.1 - Sabra Health Care REIT, Inc. | d393170dex991.htm |
| EX-10.1 - EX-10.1 - Sabra Health Care REIT, Inc. | d393170dex101.htm |
| EX-3.1 - EX-3.1 - Sabra Health Care REIT, Inc. | d393170dex31.htm |
| EX-2.1 - EX-2.1 - Sabra Health Care REIT, Inc. | d393170dex21.htm |
| 8-K - FORM 8-K - Sabra Health Care REIT, Inc. | d393170d8k.htm |
Exhibit 99.2
Relationship driven. Investor focused. Combination Creates Premier REIT for the Future of Healthcare Delivery May 8, 2017
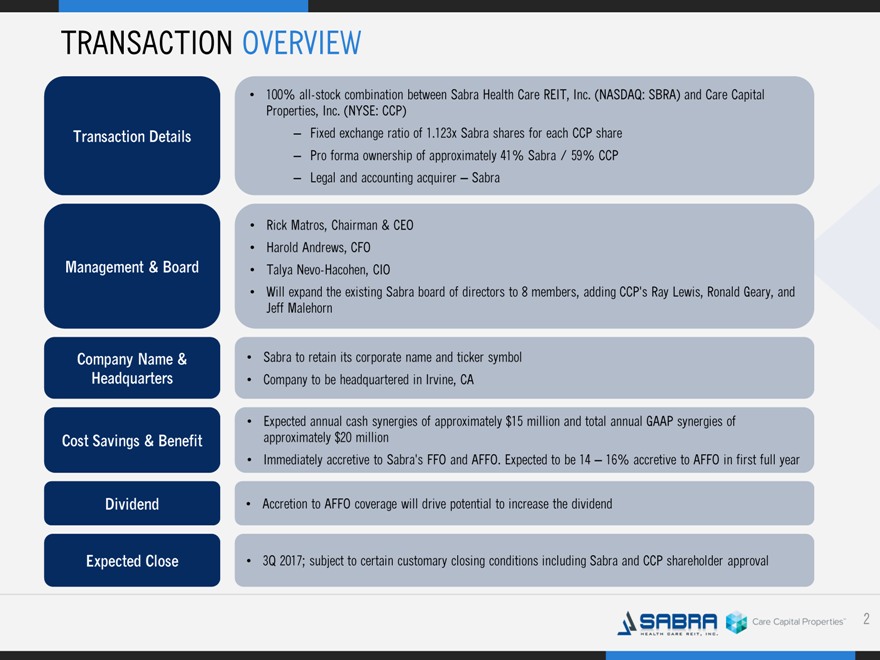
TRANSACTION OVERVIEW 100% all-stock combination between Sabra Health Care REIT, Inc. (NASDAQ: SBRA) and Care Capital Properties, Inc. (NYSE: CCP) Transaction Details Fixed exchange ratio of 1.123x Sabra shares for each CCP share Pro forma ownership of approximately 41% Sabra / 59% CCP Legal and accounting acquirer – Sabra Rick Matros, Chairman & CEO Harold Andrews, CFO Management & Board Talya Nevo-Hacohen, CIO Will expand the existing Sabra board of directors to 8 members, adding CCP’s Ray Lewis, Ronald Geary, and Jeff Malehorn Company Name & Sabra to retain its corporate name and ticker symbol Headquarters Company to be headquartered in Irvine, CA Expected annual cash synergies of approximately $15 million and total annual GAAP synergies of Cost Savings & Benefit approximately $20 million Immediately accretive to Sabra’s FFO and AFFO. Expected to be 14 – 16% accretive to AFFO in first full year Dividend Accretion to AFFO coverage will drive potential to increase the dividend Expected Close 3Q 2017; subject to certain customary closing conditions including Sabra and CCP shareholder approval 2
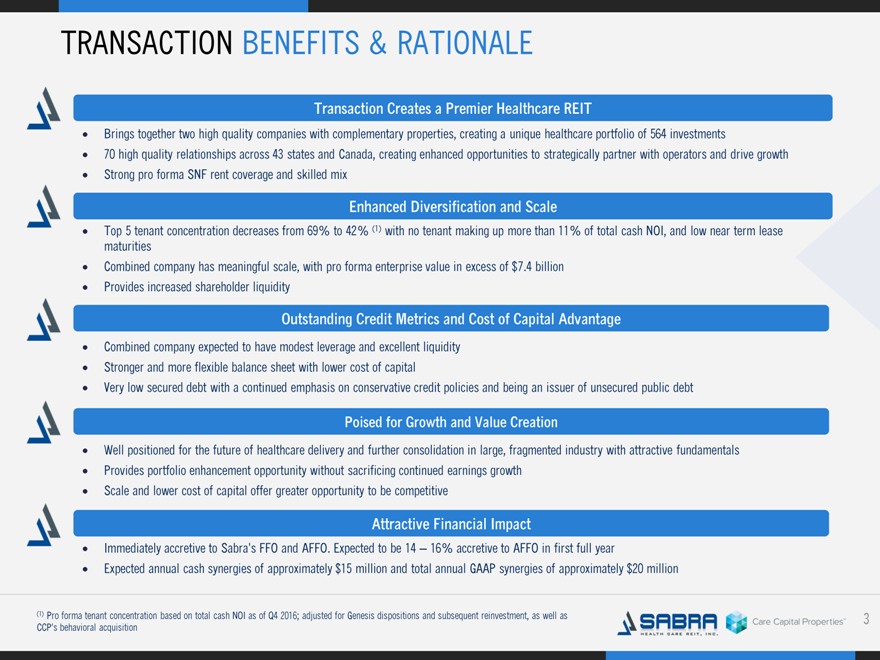
TRANSACTION BENEFITS & RATIONALE Transaction Creates a Premier Healthcare REIT Brings together two high quality companies with complementary properties, creating a unique healthcare portfolio of 564 investments 70 high quality relationships across 43 states and Canada, creating enhanced opportunities to strategically partner with operators and drive growth Strong pro forma SNF rent coverage and skilled mix Enhanced Diversification and Scale Top 5 tenant concentration decreases from 69% to 42% (1) with no tenant making up more than 11% of total cash NOI, and low near term lease maturities Combined company has meaningful scale, with pro forma enterprise value in excess of $7.4 billion Provides increased shareholder liquidity Outstanding Credit Metrics and Cost of Capital Advantage Combined company expected to have modest leverage and excellent liquidity Stronger and more flexible balance sheet with lower cost of capital Very low secured debt with a continued emphasis on conservative credit policies and being an issuer of unsecured public debt Poised for Growth and Value Creation Well positioned for the future of healthcare delivery and further consolidation in large, fragmented industry with attractive fundamentals Provides portfolio enhancement opportunity without sacrificing continued earnings growth Scale and lower cost of capital offer greater opportunity to be competitive Attractive Financial Impact Immediately accretive to Sabra’s FFO and AFFO. Expected to be 14 – 16% accretive to AFFO in first full year Expected annual cash synergies of approximately $15 million and total annual GAAP synergies of approximately $20 million (1) Pro forma tenant concentration based on total cash NOI as of Q4 2016; adjusted for Genesis dispositions and subsequent reinvestment, as well as CCP’s behavioral acquisition 3
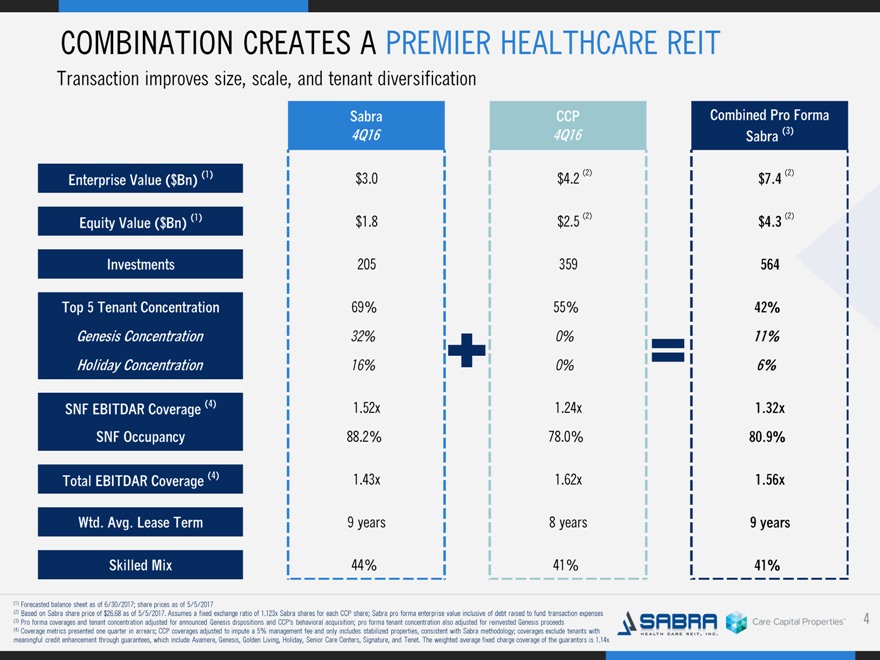
COMBINATION CREATES A PREMIER HEALTHCARE REIT Transaction improves size, scale, and tenant diversification Sabra CCP Combined Pro Forma 4Q16 4Q16 Sabra (3) Enterprise Value ($Bn) (1) $ 3.0 $ 4.2 (2) $ 7.4 (2) Equity Value ($Bn) (1) $ 1.8 $ 2.5 (2) $ 4.3 (2) Investments 205 359 564 Top 5 Tenant Concentration 69% 55% 42% Genesis Concentration 32% 0% 11% Holiday Concentration 16% 0% 6% SNF EBITDAR Coverage (4) 1.52x 1.24x 1.32x SNF Occupancy 88.2% 78.0% 80.9% Total EBITDAR Coverage (4) 1.43x 1.62x 1.56x Wtd. Avg. Lease Term 9 years 8 years 9 years Skilled Mix 44% 41% 41% (1) Forecasted balance sheet as of 6/30/2017; share prices as of 5/5/2017 (2) Based on Sabra share price of $26.68 as of 5/5/2017. Assumes a fixed exchange ratio of 1.123x Sabra shares for each CCP share; Sabra pro forma enterprise value inclusive of debt raised to fund transaction expenses (3) Pro forma coverages and tenant concentration adjusted for announced Genesis dispositions and CCP’s behavioral acquisition; pro forma tenant concentration also adjusted for reinvested Genesis proceeds (4) Coverage metrics presented one quarter in arrears; CCP coverages adjusted to impute a 5% management fee and only includes stabilized properties, consistent with Sabra methodology; coverages exclude tenants with meaningful credit enhancement through guarantees, which include Avamere, Genesis, Golden Living, Holiday, Senior Care Centers, Signature, and Tenet. The weighted average fixed charge coverage of the guarantors is 1.14x 4
HIGH QUALITY PORTFOLIO OF PRIMARILY SKILLED NURSING AND SENIOR HOUSING ASSETS 5
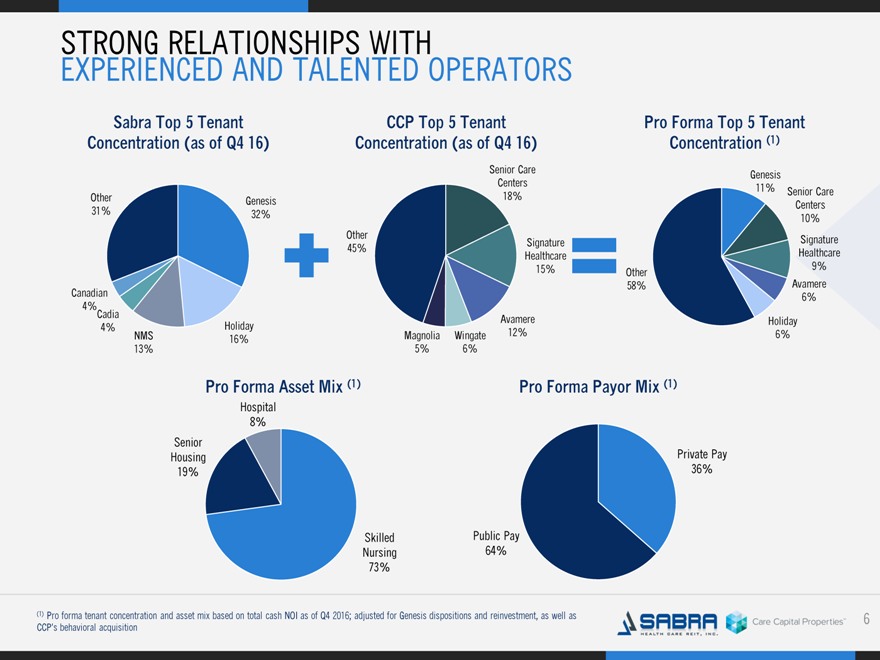
STRONG RELATIONSHIPS WITH EXPERIENCED AND TALENTED OPERATORS Sabra Top 5 Tenant CCP Top 5 Tenant Pro Forma Top 5 Tenant Concentration (as of Q4 16) Concentration (as of Q4 16) Concentration (1) Senior Care Genesis Centers Other 18% 11% Senior Care Genesis Centers 31% 32% 10% Other Signature Signature 45% Healthcare Healthcare 15% 9% Other 58% Avamere Canadian 6% 4% Cadia 4% Holiday Avamere Holiday NMS Magnolia Wingate 12% 6% 16% 13% 5% 6% Pro Forma Asset Mix (1) Pro Forma Payor Mix (1) Hospital 8% Senior Housing Private Pay 19% 36% Skilled Public Pay Nursing 64% 73% (1) Pro forma tenant concentration and asset mix based on total cash NOI as of Q4 2016; adjusted for Genesis dispositions and reinvestment, as well as CCP’s behavioral acquisition 6
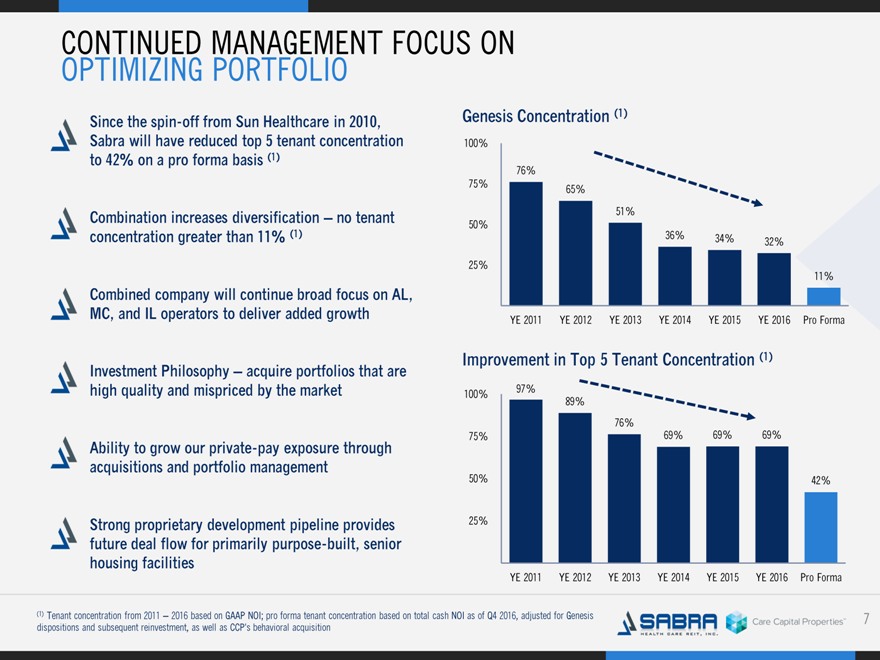
CONTINUED MANAGEMENT FOCUS ON OPTIMIZING PORTFOLIO Since the spin-off from Sun Healthcare in 2010, Sabra will have reduced top 5 tenant concentration to 42% on a pro forma basis (1) Combination increases diversification – no tenant concentration greater than 11% (1) Combined company will continue broad focus on AL, MC, and IL operators to deliver added growth Investment Philosophy – acquire portfolios that are high quality and mispriced by the market Ability to grow our private-pay exposure through acquisitions and portfolio management Strong proprietary development pipeline provides future deal flow for primarily purpose-built, senior housing facilities Genesis Concentration (1) 100% 76% 75% 65% 51% 50% 36% 34% 32% 25% 11% YE 2011 YE 2012 YE 2013 YE 2014 YE 2015 YE 2016 Pro Forma Improvement in Top 5 Tenant Concentration (1) 100% 97% 89% 76% 75% 69% 69% 69% 50% 42% 25% YE 2011 YE 2012 YE 2013 YE 2014 YE 2015 YE 2016 Pro Forma (1) Tenant concentration from 2011 – 2016 based on GAAP NOI; pro forma tenant concentration based on total cash NOI as of Q4 2016, adjusted for Genesis dispositions and subsequent reinvestment, as well as CCP’s behavioral acquisition 7
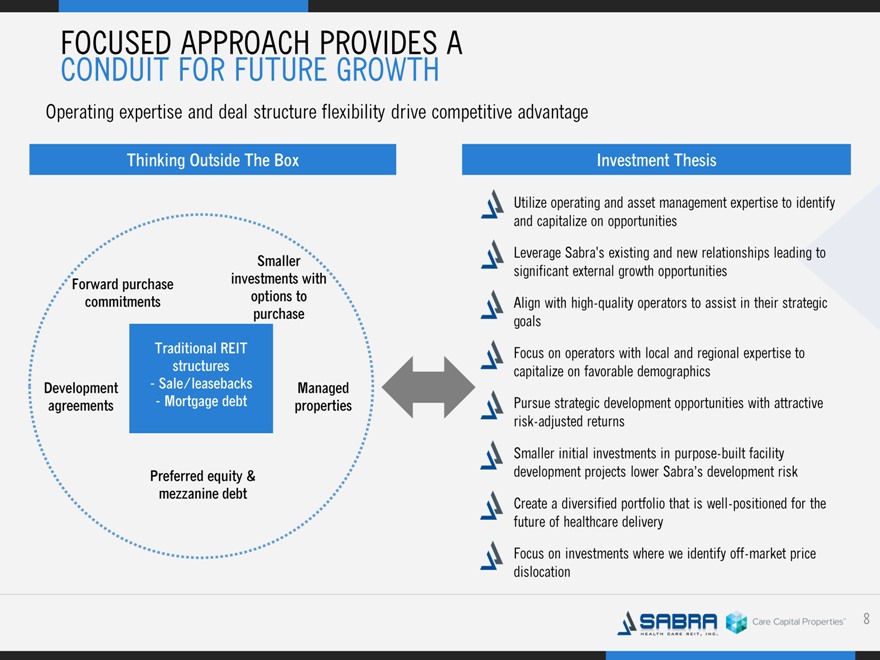
FOCUSED APPROACH PROVIDES A CONDUIT FOR FUTURE GROWTH Operating expertise and deal structure flexibility drive competitive advantage Thinking Outside The Box Smaller Forward purchase investments with commitments options to purchase Traditional REIT structures Development Sale/leasebacks Managed agreements Mortgage debt properties Preferred equity & mezzanine debt Investment Thesis Utilize operating and asset management expertise to identify and capitalize on opportunities Leverage Sabra’s existing and new relationships leading to significant external growth opportunities Align with high-quality operators to assist in their strategic goals Focus on operators with local and regional expertise to capitalize on favorable demographics Pursue strategic development opportunities with attractive risk-adjusted returns Smaller initial investments in purpose-built facility development projects lower Sabra’s development risk Create a diversified portfolio that is well-positioned for the future of healthcare delivery Focus on investments where we identify off-market price dislocation 8
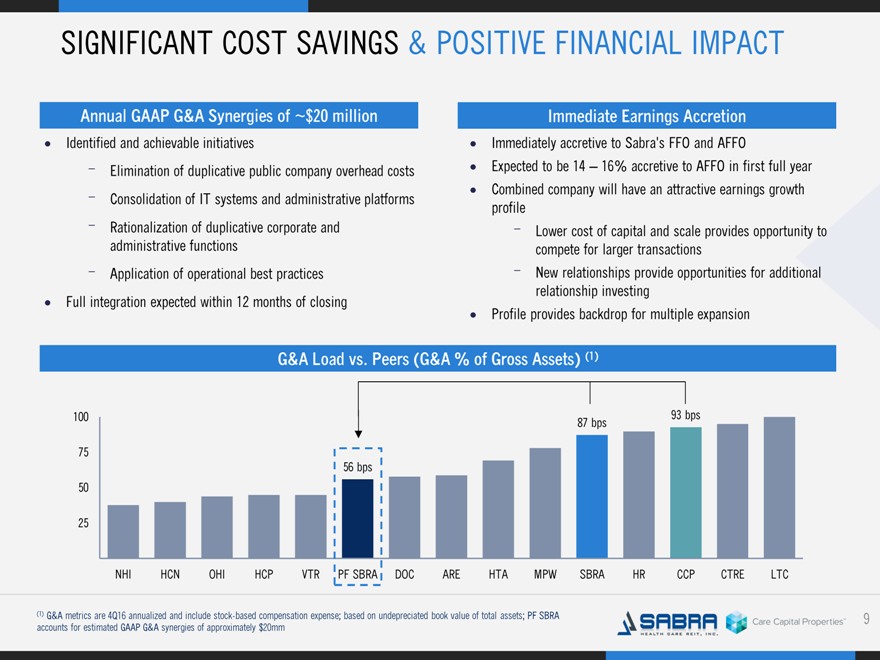
SIGNIFICANT COST SAVINGS & POSITIVE FINANCIAL IMPACT Annual GAAP G&A Synergies of ~$20 million Identified and achievable initiatives Elimination of duplicative public company overhead costs Consolidation of IT systems and administrative platforms Rationalization of duplicative corporate and administrative functions Application of operational best practices Full integration expected within 12 months of closing Immediate Earnings Accretion Immediately accretive to Sabra’s FFO and AFFO Expected to be 14 – 16% accretive to AFFO in first full year Combined company will have an attractive earnings growth profile Lower cost of capital and scale provides opportunity to compete for larger transactions New relationships provide opportunities for additional relationship investing Profile provides backdrop for multiple expansion G&A Load vs. Peers (G&A % of Gross Assets) (1) 100 93 bps 87 bps 75 56 bps 50 25 NHI HCN OHI HCP VTR PF SBRA DOC ARE HTA MPW SBRA HR CCP CTRE LTC (1) G&A metrics are 4Q16 annualized and include stock-based compensation expense; based on undepreciated book value of total assets; PF SBRA accounts for estimated GAAP G&A synergies of approximately $20mm 9
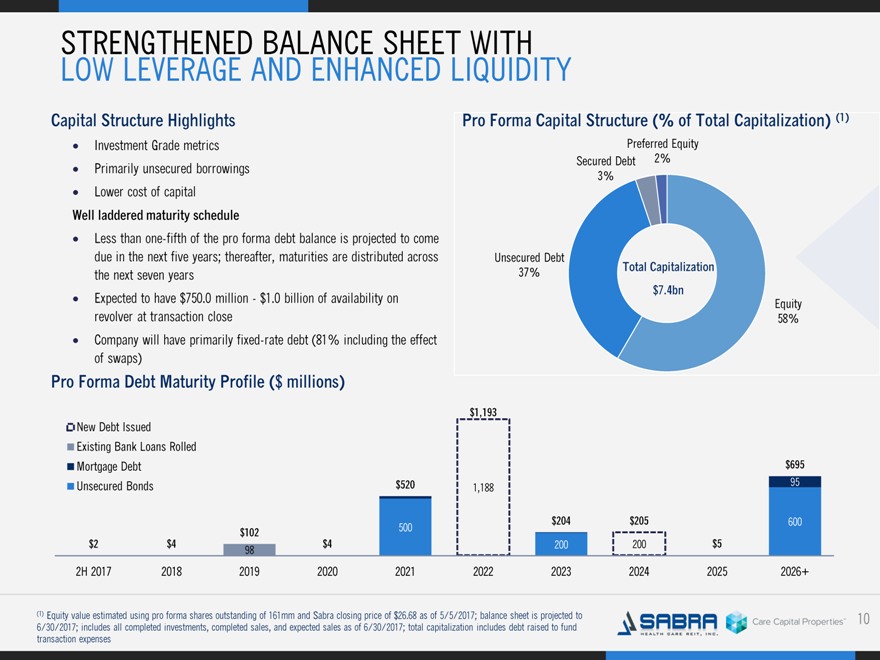
STRENGTHENED BALANCE SHEET WITH LOW LEVERAGE AND ENHANCED LIQUIDITY Capital Structure Highlights Investment Grade metrics · Primarily unsecured borrowings · Lower cost of capital Well laddered maturity schedule Less than one-fifth of the pro forma debt balance is projected to come due in the next five years; thereafter, maturities are distributed across the next seven years Expected to have $750.0 million—$1.0 billion of availability on revolver at transaction close Company will have primarily fixed-rate debt (81% including the effect of swaps) Pro Forma Debt Maturity Profile ($ millions) New Debt Issued Existing Bank Loans Rolled Mortgage Debt Unsecured Bonds Pro Forma Capital Structure (% of Total Capitalization) (1) Preferred Equity Secured Debt 2% 3% Unsecured Debt Total Capitalization 37% $7.4bn Equity 58% $1,193 New Debt Issued Existing Bank Loans Rolled Mortgage Debt $695 Unsecured Bonds $520 95 1,188 $204 $205 600 $102 500 $2 $4 $4 200 200 $5 98 2H 2017 2018 2019 2020 2021 2022 2023 2024 2025 2026+ (1) Equity value estimated using pro forma shares outstanding of 161mm and Sabra closing price of $26.68 as of 5/5/2017; balance sheet is projected to 6/30/2017; includes all completed investments, completed sales, and expected sales as of 6/30/2017; total capitalization includes debt raised to fund transaction expenses 10
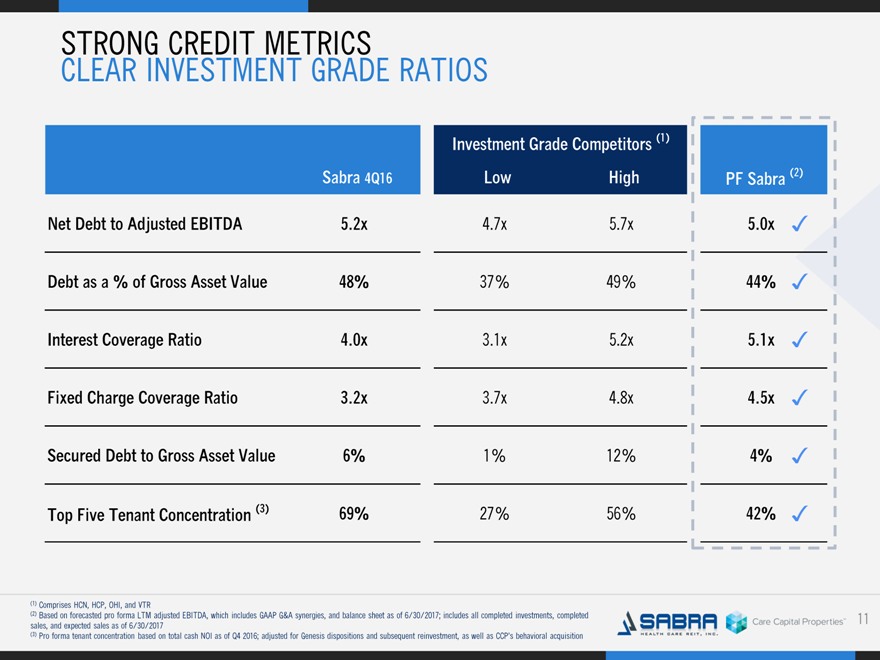
STRONG CREDIT METRICS CLEAR INVESTMENT GRADE RATIOS Investment Grade Competitors (1) Sabra 4Q16 Low High PF Sabra (2) Net Debt to Adjusted EBITDA 5.2x 4.7x 5.7x 5.0x 3 Debt as a % of Gross Asset Value 48% 37% 49% 44% 3 Interest Coverage Ratio 4.0x 3.1x 5.2x 5.1x 3 Fixed Charge Coverage Ratio 3.2x 3.7x 4.8x 4.5x 3 Secured Debt to Gross Asset Value 6% 1% 12% 4% 3 Top Five Tenant Concentration (3) 69% 27% 56% 42% 3 (1) Comprises HCN, HCP, OHI, and VTR (2) Based on forecasted pro forma LTM adjusted EBITDA, which includes GAAP G&A synergies, and balance sheet as of 6/30/2017; includes all completed investments, completed sales, and expected sales as of 6/30/2017 (3) Pro forma tenant concentration based on total cash NOI as of Q4 2016; adjusted for Genesis dispositions and subsequent reinvestment, as well as CCP’s behavioral acquisition 11
FUTURE ROADMAP Integrate the acquired corporate infrastructure into Sabra’s platform Execute on synergies Target achieving investment grade rating at transaction close Expand and close on the value-adding pipeline of opportunities Optimize portfolio with select investments and SNF dispositions Grow the dividend 12
PROVEN SENIOR MANAGEMENT TEAM TRACK RECORD OF DRIVING RETURNS Rick Matros has served as Sabra’s President and Chief Executive Officer and as a Director since May 2010, and as Chairman of the Board since November 2010. He was also Chairman of the Board of Directors and Chief Executive Officer of Old Sun from 2001 to 2010 Served as Chief Executive Officer and President of Bright Now! Dental from 1998 to 2000 and as a Director from 1998 until its sale in December 2010 From 1998 until the sale of its operations in 2006, was a member of the management committee of CareMeridian, LLC From 1994 to 1997, served Regency Health Services, Inc. as Chief Executive Officer, President, Director and Chief Operating Officer Currently serves on the Executive Board for RFE Investment Partners and is the Executive Producer of Sabra Films, LLC Harold W. Andrews, Jr. has served as Sabra’s Executive Vice President, Chief Financial Officer and Secretary since November 2010 Member of the management committee of Journey Health Properties, LLC and Journey Lane 5, LLC, two real estate holding entities From 1997 to May 2008, was a Partner and Chief Financial Officer of CareMeridian, LLC From 1996 to 1997, served as the Vice President of Finance for Regency Health Services, Inc., a provider of post-acute care services Spent 10 years in public accounting at Arthur Andersen LLP, including time as Senior Manager for healthcare and real estate companies CPA and Member of the AICPA and Financial Executives International Talya Nevo-Hacohen serves as Sabra’s Executive Vice President, Chief Investment Officer and Treasurer From 2006 to 2008 and from February 2009 to November 2010, Ms. Nevo-Hacohen served as an advisor to private real estate developers and operators regarding property acquisitions and dispositions, corporate capitalization, and equity and debt capital raising From August 2008 to February 2009, was a Managing Director with Cerberus Real Estate Capital Management, LLC From 2003 to 2006, was Senior Vice President—Capital Markets and Treasurer for HCP, Inc. From 1993 to 2003, worked for Goldman, Sachs & Co. where she was a Vice President in the investment banking and finance, operations and administration divisions Prior to her affiliation with Goldman Sachs, she practiced architecture and was associated with several architectural firms in New York Rick Matros Chairman, President & CEO Harold W. Andrews Jr. CFO and EVP Talya Nevo-Hacohen Chief Investment Officer 13
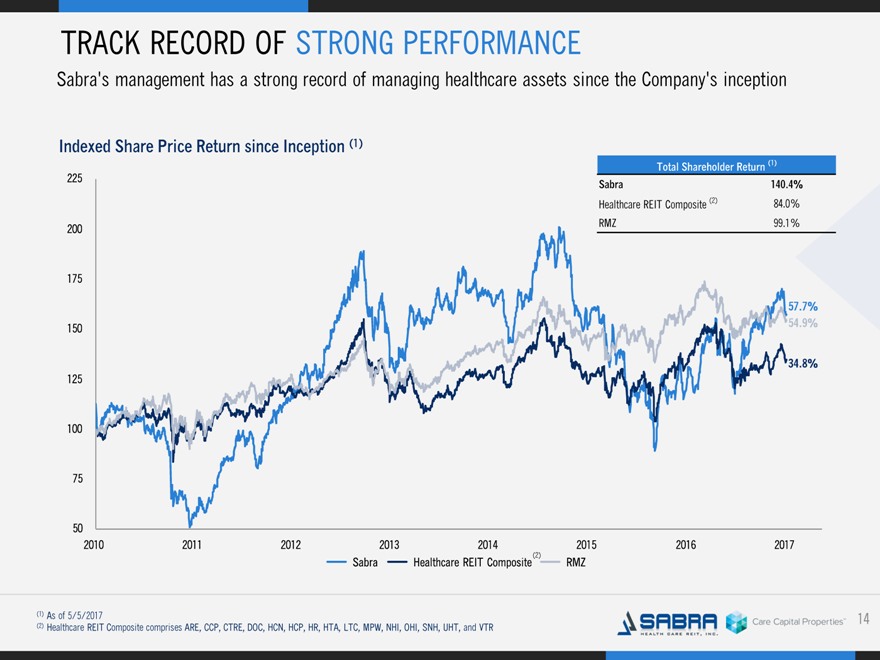
TRACK RECORD OF STRONG PERFORMANCE Sabra’s management has a strong record of managing healthcare assets since the Company’s inception Indexed Share Price Return since Inception (1) Total Shareholder Return (1) Sabra 140.4% Healthcare REIT Composite (2) 84.0% RMZ 99.1% (2) (1) As of 5/5/2017 (2) Healthcare REIT Composite comprises ARE, CCP, CTRE, DOC, HCN, HCP, HR, HTA, LTC, MPW, NHI, OHI, SNH, UHT, and VTR 14
FORWARD LOOKING STATEMENTS This presentation contains “forward-looking” statements that may be identified, without limitation, by the use of “expects,” “believes,” “intends,” “should” or comparable terms or the negative thereof. Forward-looking statements in this presentation include, but are not limited to, statements about Sabra’s proposed merger with CCP, the expected impact of the proposed merger on Sabra’s financial results, Sabra’s ability to achieve the synergies and other benefits of the proposed merger with CCP and Sabra’s and CCP’s strategic and operational plans, as well as all statements regarding expected future financial position, results of operations, cash flows, liquidity, financing plans, business strategy, the expected amounts and timing of dividends, projected expenses and capital expenditures, competitive position, growth opportunities and potential investments, plans and objectives for future operations and compliance with and changes in governmental Ma regulations. These statements are made as of the date hereof and are subject to known and unknown risks, uncertainties, assumptions and other factors—many of which are out of the Company’s control and difficult to forecast—that could cause actual results to differ materially from those set forth in or implied by our forward-looking statements. These risks and uncertainties include but are not limited to: our dependence on Genesis Healthcare, Inc. (“Genesis”) and certain wholly owned subsidiaries of Holiday AL Holdings LP (collectively, “Holiday”) until we are able to further diversify our portfolio; our dependence on the operating success of our tenants; the significant amount of and our ability to service our indebtedness; covenants in our debt agreements that may restrict our ability to pay dividends, make investments, incur additional indebtedness and refinance indebtedness on favorable terms; increases in market interest rates; changes in foreign currency exchange rates; our ability to raise capital through equity and debt financings; the impact of required regulatory approvals of transfers of healthcare properties; the effect of increasing healthcare regulation and enforcement on our tenants and the dependence of our tenants on reimbursement from governmental and other third-party Option One payors; the relatively illiquid nature of real estate investments; competitive conditions in our industry; the loss of key management personnel or other employees; the impact of litigation and rising insurance costs on the business of our tenants; the effect of our tenants declaring bankruptcy or becoming insolvent; uninsured or underinsured losses affecting our properties and the possibility of environmental compliance costs and liabilities; the ownership limits and anti-takeover defenses in our governing documents and Maryland law, which may restrict change of control or business combination opportunities; the impact of a failure or security breach of information technology in our operations; our ability to find replacement tenants and the impact of unforeseen costs in acquiring new properties; our ability to maintain our status as a REIT and compliance with REIT requirements and certain tax and tax regulatory matters related to our status as a REIT. There are also risks that are inherent in the nature of the transaction with CCP, including the possibility that the parties may be unable to obtain required stockholder approvals or regulatory approvals or that other conditions to closing the transaction may not be satisfied, such that the transaction will not close or that the closing may be delayed; the potential adverse effect on tenant and vendor relationships, operating results and business generally resulting from the proposed transaction; the proposed transaction will require significant time, attention and resources, potentially diverting attention from the conduct of Sabra’s business; the amount of debt that will need to be refinanced or amended in connection with the proposed merger and the ability to do so on acceptable terms; changes in healthcare regulation and political or economic conditions; the anticipated benefits of the proposed transaction may not be realized; the anticipated and unanticipated costs, fees, expenses and liabilities related to the transaction; the outcome of any legal proceedings related to the transaction; and the occurrence of any event, change or other circumstances that could give rise to the termination of the transaction agreement. Additional information concerning risks and uncertainties that could affect Sabra’s business can be found in Sabra’s filings with the Securities and Exchange Commission (the “SEC”), including Item 1A of its Annual Report on Form 10-K for the year ended December 31, 2016. Additional information concerning risks and uncertainties that could affect CCP’s business can be found in CCP’s filings with the SEC, including Item 1A of its Annual Report on Form 10-K for the year ended December 31, 2016. Forward-looking statements made in this presentation are not guarantees of future performance, events or results, and you should not place undue reliance on these forward-looking statements, which speak only as of the date hereof. The Company assumes no, and hereby disclaims any, obligation to update any of the foregoing or any other forward-looking statements as a result of new information or new or future developments, except as otherwise required by law. TENANT AND BORROWER INFORMATION This presentation includes Option information Three (e. g. EBITDAR coverage, EBITDARM coverage and occupancy percentage) regarding certain of our tenants that lease properties from us and our borrowers, most of which are not subject to SEC reporting requirements. Genesis is subject to the reporting requirements of the SEC and is required to file with the SEC annual reports containing audited financial information and quarterly reports containing unaudited financial information. The information related to our tenants and borrowers that is provided in this presentation has been provided by such tenants and borrowers. We have not independently verified this information. We have no reason to believe that such information is inaccurate in any material respect. We are providing this data for informational purposes only. Genesis’s filings with the SEC can be found at www.sec.gov. 15
ADDITIONAL INFORMATION ABOUT THE MERGER AND WHERE TO FIND IT This communication does not constitute an offer to sell or the solicitation of an offer to buy any securities or a solicitation of any vote or approval. This communication may be deemed to be solicitation material in respect of the proposed merger of CCP with a wholly owned subsidiary of Sabra. In connection with the proposed merger, Sabra intends to file a registration statement on Form S-4 with the U.S. Securities and Exchange Commission (“SEC”), which will include a joint proxy statement/prospectus with respect to the proposed merger. After the registration statement Ma is declared effective, Sabra and CCP will each mail the definitive joint proxy statement/prospectus to their respective stockholders. The definitive joint proxy statement/prospectus will contain important information about the proposed merger and related matters. STOCKHOLDERS OF SABRA AND CCP ARE URGED TO READ ALL RELEVANT DOCUMENTS FILED WITH THE SEC, INCLUDING THE DEFINITIVE JOINT PROXY STATEMENT/PROSPECTUS, CAREFULLY AND IN THEIR ENTIRETY WHEN THEY BECOME AVAILABLE BECAUSE THEY WILL CONTAIN IMPORTANT INFORMATION ABOUT SABRA, CCP AND THE MERGER. Stockholders will be able to obtain copies of the joint proxy statement/prospectus and other relevant materials (when they become available) and any other documents filed with the SEC by Sabra and CCP for no charge at the SEC’s website at www.sec.gov. Copies of the documents filed by Sabra with the SEC will be available free of charge on Sabra’s website at www.sabrahealth.com, or by directing a written request to Sabra Health Care REIT, Inc., 18500 Von Karman Avenue, Suite 550, Irvine, CA 92612, Attention: Investor Relations. Copies of the documents filed by CCP with the SEC will be available free of charge on CCP’s website at www.carecapitalproperties. Option com, or One by directing a written request to Care Capital Properties, Inc., 191 North Wacker Drive, Suite 1200, Chicago, Illinois 60606, Attention: Investor Relations. 16
PARTICIPANTS IN THE SOLICITATION Sabra and CCP, and their respective directors and executive officers and certain other employees, may be deemed to be participants in the solicitation of proxies in respect of the transactions contemplated by the merger agreement. Information concerning the ownership of Sabra securities by Sabra’s directors and executive officers is included in their SEC filings on Forms 3, 4, and 5, and additional information about Sabra’s directors and executive officers is also available in Sabra’s proxy statement for its 2017 annual meeting of stockholders filed with the SEC on April 25, 2017 as well as its Form 10-K filed with SEC for the year ended December 31, 2016. Information concerning the ownership of CCP securities by CCP’s directors and executive officers is included in their SEC filings on Forms 3, 4, and 5, and additional information about CCP’s directors and executive officers is also available in CCP’s proxy statement for its 2017 annual meeting of stockholders Ma filed with the SEC on April 7, 2017 as well as its Form 10-K filed with SEC for the year ended December 31, 2016. Other information regarding persons who may be deemed participants in the proxy solicitation, including their respective interests by security holdings or otherwise, will be set forth in the joint proxy statement/prospectus relating to the proposed merger when it becomes available and is filed with the SEC. These documents can be obtained free of charge from the sources indicated above. 17
DEFINITIONS Cash NOI. The Company considers cash net operating income (“NOI”) an important supplemental measure because it allows investors, analysts and our management to evaluate the operating performance of our investments. We define cash NOI as total revenues less operating expenses and non-cash revenues. EBITDA. Earnings before interest, taxes, depreciation and amortization (“EBITDA”) excluding the impact of stock-based compensation expense under the Company’s long-term equity award program, asset specific loan loss reserves, significant out of period revenues and expenses, and further adjusted to give effect to acquisitions and dispositions as though such acquisitions and dispositions occurred at the beginning of the period (“Adjusted EBITDA”) is an important non-GAAP supplemental measure of operating performance. Ma EBITDAR Coverage. Represents the ratio of EBITDAR to contractual rent for owned facilities (excluding Managed Properties). EBITDAR Coverage is a supplemental measure of an operator/tenant’s ability to meet their cash rent and other obligations to the Company. However, its usefulness is limited by, among other things, the same factors that limit the usefulness of EBITDAR. EBITDARM Coverage. Represents the ratio of EBITDARM to contractual rent for owned facilities (excluding Managed Properties). EBITDARM coverage is a supplemental measure of a property’s ability to generate Option cash flows One for the operator/tenant (not the Company) to meet the operator’s/tenant’s related cash rent and other obligations to the Company. However, its usefulness is limited by, among other things, the same factors that limit the usefulness of EBITDARM. Fixed Charge Coverage Ratio. EBITDAR (including adjustments for one-time and pro forma items) for the period indicated for all operations of any entities that guarantee the tenants’ lease obligations to the Company divided by the same period cash rent expense, interest expense and mandatory principal payments for operations of any entity that guarantees the tenants’ lease obligation to the Company. Fixed Charge Coverage is a supplemental measure of a guarantor’s ability to meet the operator/tenant’s cash rent and other obligations to the Company should the operator/tenant be unable to do so itself. However, its usefulness is limited by, among other things, the same factors that limit the usefulness of EBITDAR. Occupancy Percentage. Occupancy Percentage represents the facilities’ average operating occupancy for the period indicated. The percentages are calculated by dividing the actual census from the period presented by the available beds/units for the same period. Occupancy for independent living facilities can be greater than 100% for a given period as multiple residents could occupy a single unit. Senior Housing. Senior housing facilities include independent living, assisted living, continuing care retirement community and memory care facilities. Skilled Mix is defined as the total Medicare and non-Medicaid managed care patient revenue at Skilled Nursing/Transitional Care facilities divided by the total revenues at Skilled Nursing/Transitional Care facilities for the period indicated. Skilled Nursing/Transitional Care. Skilled nursing/transitional care facilities include skilled nursing, transitional care, multi-license designation and mental health facilities. Stabilized Facility. At the Option time of Three acquisition, the Company classifies each facility as either stabilized or pre-stabilized. In addition, the Company may classify a facility as pre-stabilized after acquisition. Circumstances that could result in a facility being classified as prestabilized include newly completed developments, facilities undergoing major renovations or additions, facilities being repositioned or transitioned to new operators, and significant transitions within the tenants’ business model. Such facilities will be reclassified to stabilized upon maintaining consistent occupancy (85% for Skilled Nursing/Transitional Care and 90% for Senior Housing Facilities) but in no event beyond 24 months after the date of classification as pre-stabilized. Stabilized Facilities exclude (i) Managed Properties, (ii) facilities held for sale, (iii) facilities being positioned to be sold, (iv) facilities being transitioned from being leased by the Company to being operated by the Company, and (v) facilities acquired during the three months preceding the period presented. Note: All facility financial performance data were derived solely from information provided by operators/tenants and relevant guarantors without independent verification by the Company. 18