Attached files
| file | filename |
|---|---|
| 8-K - 8-K - STATE BANK FINANCIAL CORP | stbz-20170508x8k.htm |

State Bank Financial Corporation
May 8, 2017
2017 Gulf South Bank Conference

2
Cautionary Note Regarding Forward-Looking
Statements
This presentation contains forward-looking statements within the meaning of the federal securities laws. These forward-looking statements, which are based on
certain assumptions and describe our future plans, strategies, and expectations, can generally be identified by the use of the words “will,” “expect,” “should,”
“anticipate,” “may,” and “project,” as well as similar expressions. These forward-looking statements include, but are not limited to, statements regarding our
significant opportunity for deposit growth in the Atlanta and Savannah markets, statements regarding our ability to leverage our existing treasury and payroll
capabilities in certain markets, statements regarding our strategic outlook on Slide 7, including our forward vision, our focus on improving efficiency, including that
our noninterest expense is expected to decline, and other statements about expected developments or events, our future financial performance, and the execution
of our strategic goals. Forward-looking statements are not guarantees of future performance and are subject to risks, uncertainties and assumptions (“risk factor”)
that are difficult to predict with regard to timing, extent, likelihood and degree. Therefore, actual results and outcomes may materially differ from what may be
expressed or forecasted in such forward-looking statements. We undertake no obligation to update, amend or clarify forward-looking statements, whether as a
result of new information, future events or otherwise. Risk factors including, without limitation, the following:
• negative reactions to our recent or future acquisitions of each bank’s customers, employees, and counterparties or difficulties related to the transition of services;
• our ability to achieve anticipated results from the transactions with NBG Bancorp and S Bankshares will depend on the state of the economic and financial
markets going forward;
• economic conditions (both generally and in our markets) may be less favorable than expected, which could result in, among other things, a deterioration in credit
quality, a reduction in demand for credit and a decline in real estate values;
• a general decline in the real estate and lending markets, particularly in our market areas, could negatively affect our financial results;
• risk associated with income taxes including the potential for adverse adjustments and the inability to fully realize deferred tax benefits;
• increased cybersecurity risk, including potential network breaches, business disruptions, or financial losses;
• restrictions or conditions imposed by our regulators on our operations may make it more difficult for us to achieve our goals;
• legislative or regulatory changes, including changes in accounting standards and compliance requirements, may adversely affect us;
• competitive pressures among depository and other financial institutions may increase significantly;
• changes in the interest rate environment may reduce margins or the volumes or values of the loans we make or have acquired;
• other financial institutions have greater financial resources and may be able to develop or acquire products that enable them to compete more successfully than
we can;
• our ability to attract and retain key personnel can be affected by the increased competition for experienced employees in the banking industry;
• adverse changes may occur in the bond and equity markets;
• war or terrorist activities may cause deterioration in the economy or cause instability in credit markets; and
• economic, governmental, or other factors may prevent the projected population, residential, and commercial growth in the markets in which we operate.
In addition, risk factors include, but are not limited to, the risk factors described in Item 1A, Risk Factors, in our Annual Report on Form 10-K for the most recently
ended fiscal year. These and other risk factors are representative of the risk factors that may emerge and could cause a difference between an ultimate actual
outcome and a forward-looking statement.

3
Headquartered in Atlanta, Georgia
State Bank operates 31 full-service banking
offices and 8 mortgage origination offices in 7 of
the 8 largest MSAs in Georgia
Completed mergers with The National Bank of
Georgia and S Bank on December 31, 2016
These acquisitions expanded our statewide
footprint and provided entry into the attractive
markets of Athens, Gainesville, and Savannah
Atlanta
Macon
Warner
Robins
Augusta
Savannah
Athens
Gainesville
State Bank Financial Corporation Profile
Source: SNL Financial
Note: Financial metrics as of 3/31/17; dividend yield and market cap as of 5/3/17
STBZ Profile
Total Assets $4.2 billion TCE Ratio 12.9%
Total Loans $2.9 billion Cost of Funds .37%
Total Deposits $3.4 billion Dividend Yield 2.11%
Total Equity $620 million Market Cap $1.0 billion
Key Metrics

4
Investment Thesis
Executive management team with a 30+ year track record in Georgia of
successful acquisitions / integrations and building long-term shareholder value
Strong historical growth in core deposits and organic loans
Excellent credit metrics with minimal levels of NPAs, NCOs, and past due loans
Asset-sensitive balance sheet
Robust capital levels to support growth and opportunistic transactions
Attractive dividend yield and payout ratio
Concentrated branch footprint in high-quality metro markets
Well-positioned acquirer as one of only three publicly traded banks
headquartered in Georgia with $2 billion to $5 billion in assets

5
Acquisition History
July 2009 – October 2011
12 FDIC-assisted acquisitions
Total Assets: $3.9 billion
Total Deposits: $3.6 billion
January 2015
First Bank of Georgia
Assets: $527 million
Deposits: $418 million
December 2016
National Bank of Georgia
Assets: $378 million
Deposits: $288 million
February 2015
Boyett Insurance
Agency
October 2012
Altera Payroll
Services
October 2014
Bank of Atlanta
Assets: $186 million
Deposits: $149 million
October 2015
Patriot Capital
Equipment Finance
December 2016
S Bank
Assets: $106 million
Deposits: $94 million
$4.2 billion in
assets as of 1Q17
Prior to July 2009 Change of Control
$35 million in assets
2 Branches in Middle Georgia
2009 - 2011 2012 - 2014 2015 2016

6
Strong Core Deposit Base with
Significant Opportunity for Growth
1 Region represents individual or combined MSAs; Savannah region includes Savannah and Hinesville MSAs and Tattnall County, GA
Source: SNL Financial; FDIC deposit data as of 6/30/16
Atlanta – less than 1% market share of $153 billion in deposits; over 75% of the market is
dominated by large regional and national competitors
Savannah – new market where State Bank executive management has significant in-market
experience
Significant
Growth
Opportunities
Leading
Market Share
Top 10
Market Share
Augusta – remain well-positioned to take advantage of recent market disruption
Athens / Gainesville – strong local leadership team; opportunity to leverage State Bank’s
existing treasury and payroll capabilities in these new markets
Macon / Warner Robins – mature franchise with #1 market share since 2005 (including
predecessor bank)
($ in 000)
Region1 Deposits
% of
Deposits
Deposits /
Branch
# of
Branches
Market
Share Deposits
Deposits /
Branch
Atlanta $1,232,279 37% $205,380 6 0.8% $152,829,823 $122,069
Macon / Warner Robins 1,281,920 38% 106,827 12 25.1% 5,114,867 55,596
Augusta 424,956 13% 60,708 7 5.3% 7,995,226 62,955
Athens / Gainesville 323,661 10% 161,831 2 4.5% 7,154,932 73,762
Savannah 91,379 3% 22,845 4 1.2% 7,815,113 66,796
STBZ Total Region

7
Grow Commercial
Relationships by
Targeting Net
Funding Segments
Scale Efficient
Asset-Generating
Lines of Business
Foster a Culture
of Efficiency
Maintain Focus on
Noninterest Income
Strategic Outlook
Management Depth
Disciplined and
Experienced Acquirer
Balance Sheet Strength
Strong Credit Quality
Metrics
Shareholder Focused
Management Team with
Significant Insider
Ownership
Solid Foundation Built on
Proven Performance
Forward Vision

8
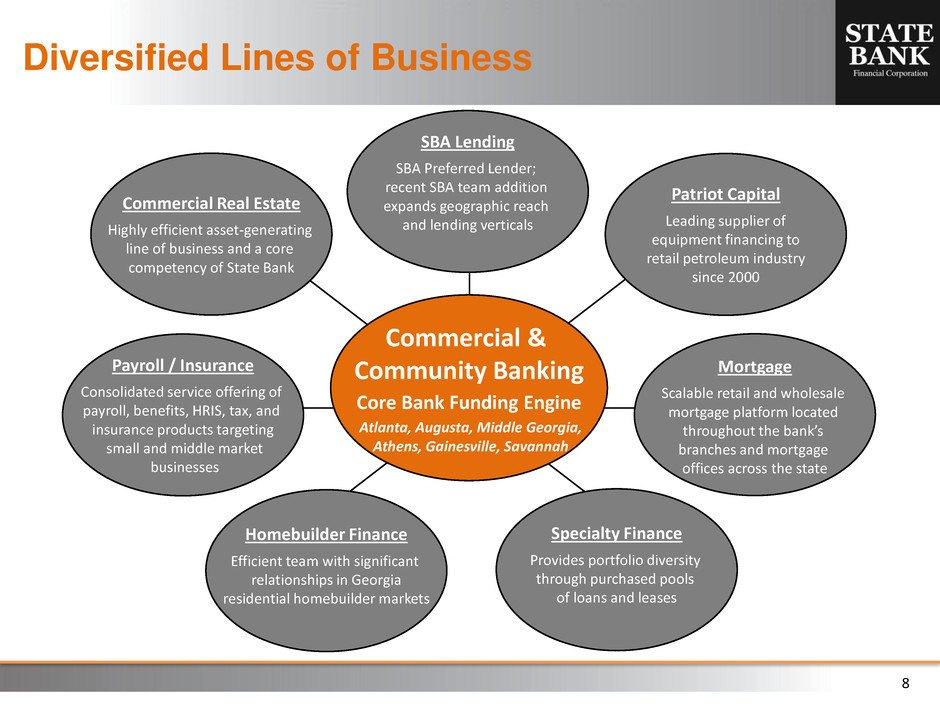
Diversified Lines of Business
Commercial &
Community Banking
Core Bank Funding Engine
Atlanta, Augusta, Middle Georgia,
Athens, Gainesville, Savannah
Mortgage
Scalable retail and wholesale
mortgage platform located
throughout the bank’s
branches and mortgage
offices across the state
Patriot Capital
Leading supplier of
equipment financing to
retail petroleum industry
since 2000
SBA Lending
SBA Preferred Lender;
recent SBA team addition
expands geographic reach
and lending verticals
Specialty Finance
Provides portfolio diversity
through purchased pools
of loans and leases
Payroll / Insurance
Consolidated service offering of
payroll, benefits, HRIS, tax, and
insurance products targeting
small and middle market
businesses
Commercial Real Estate
Highly efficient asset-generating
line of business and a core
competency of State Bank
Homebuilder Finance
Efficient team with significant
relationships in Georgia
residential homebuilder markets

9
1Q 2017 Financial Results

10
Income Statement Highlights
($ in 000s, except per share data) 1Q17 4Q16 1Q16
Interest income on loans $34,060 $26,696 $24,342
Accretion income on loans 7,677 10,271 9,743
Interest income on invested funds 5,460 4,810 4,673
Total interest income 47,197 41,777 38,758
Interest expense 3,239 2,631 2,113
Net interest income 43,958 39,146 36,645
Provision for loan and lease losses 1,002 277 (134)
Net interest income after provision for loan losses 42,956 38,869 36,779
Total noninterest income 9,459 9,911 9,391
Total noninterest expense 34,565 32,875 28,898
Income before income taxes 17,850 15,905 17,272
Income tax expense 6,292 5,578 6,434
Net income $11,558 $10,327 $10,838
Diluted earnings per share .30 .28 .29
Dividends per share .14 .14 .14
Tangible book value per share 13.66 13.48 13.49
Balance Sheet Highlights (period-end)
Total loans $2,854,780 $2,814,572 $2,258,533
Organic 2,172,555 2,090,564 1,895,340
Purchased non-credit impaired 528,065 563,362 223,398
Purchased credit impaired 154,160 160,646 139,795
Total assets 4,202,681 4,225,265 3,533,213
Noninterest-bearing deposits 944,838 984,419 891,511
Total deposits 3,409,775 3,431,165 2,905,598
Shareholders’ equity 620,283 613,633 545,855
1Q 2017 Results Summary
1 Denotes a non-GAAP financial measure; for more information, refer to Table 7 of the 1Q17 earnings press release
Note: Consolidated financial results contained throughout this presentation are unaudited; numbers may not add due to rounding
1Q17 net income of $11.6
million, or $.30 per diluted
share
Interest income on loans
and invested funds up 25%
from 4Q16
Successful integration and
conversion of National Bank
of Georgia and S Bank
completed in February
Noninterest expense higher
due to two recent
acquisitions, with majority
of cost savings expected to
be realized in 2Q17
Asset sensitivity contributed
to net interest margin
expansion in 1Q17
1

11
Revenue Trends – Interest Income
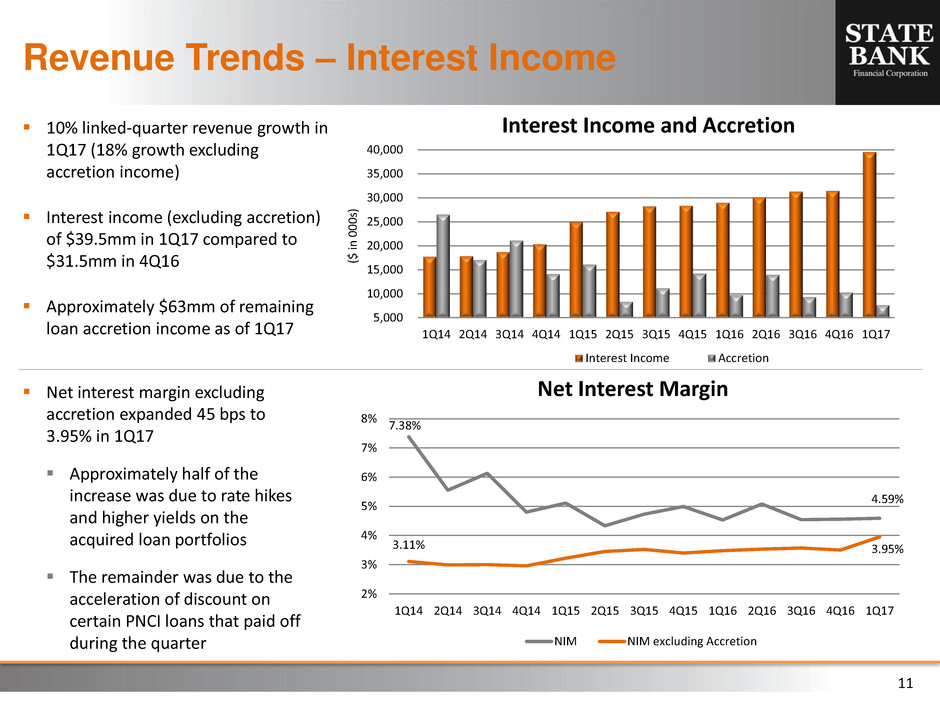
10% linked-quarter revenue growth in
1Q17 (18% growth excluding
accretion income)
Interest income (excluding accretion)
of $39.5mm in 1Q17 compared to
$31.5mm in 4Q16
Approximately $63mm of remaining
loan accretion income as of 1Q17
($ i
n
000
s)
Net interest margin excluding
accretion expanded 45 bps to
3.95% in 1Q17
Approximately half of the
increase was due to rate hikes
and higher yields on the
acquired loan portfolios
The remainder was due to the
acceleration of discount on
certain PNCI loans that paid off
during the quarter
7.38%
4.59%
3.11% 3.95%
2%
3%
4%
5%
6%
7%
8%
1Q14 2Q14 3Q14 4Q14 1Q15 2Q15 3Q15 4Q15 1Q16 2Q16 3Q16 4Q16 1Q17
Net Interest Margin
NIM NIM excluding Accretion
5,000
10,000
15,000
20,000
25,000
30,000
35,000
40,000
1Q14 2Q14 3Q14 4Q14 1Q15 2Q15 3Q15 4Q15 1Q16 2Q16 3Q16 4Q16 1Q17
Interest Income and Accretion
Interest Income Accretion

12
SBA income declined to $1.2mm in 1Q17; rebuilding
loan pipeline in 1Q17 after a strong 4Q16
Payroll and insurance income of $1.5mm in 1Q17;
continue to add payroll clients at relatively steady pace
Revenue Trends – Noninterest Income
Mortgage banking income increased 15% linked-quarter in
1Q17 on production of $115mm
Total 1Q17 noninterest income of $9.5mm, with
diversity across lines of business
($ i
n
000
s)
0
2,000
4,000
6,000
8,000
10,000
12,000
1Q16 2Q16 3Q16 4Q16 1Q17
Service Charge Other Mortgage Payroll SBA
0
50
100
150
200
0
1,000
2,000
3,000
4,000
1Q16 2Q16 3Q16 4Q16 1Q17
Pr
o
d
u
cti
o
n
($
in
m
m
)
N
o
n
in
ter
es
t
In
com
e
($ i
n
000
s)
Income Production
0
5
10
15
20
25
30
35
0
500
1,000
1,500
2,000
1Q16 2Q16 3Q16 4Q16 1Q17
Pr
o
d
u
cti
o
n
($
in
m
m
)
N
o
n
in
ter
es
t
In
com
e
($ i
n
000
s)
Income Production
1,100
1,125
1,150
1,175
1,200
0
500
1,000
1,500
2,000
1Q16 2Q16 3Q16 4Q16 1Q17
# o
f P
ayro
ll C
lien
ts
N
o
n
in
ter
es
t
In
com
e
($ i
n
000
s)
Income Number of Payroll Clients

13
Focused on Improving Efficiency
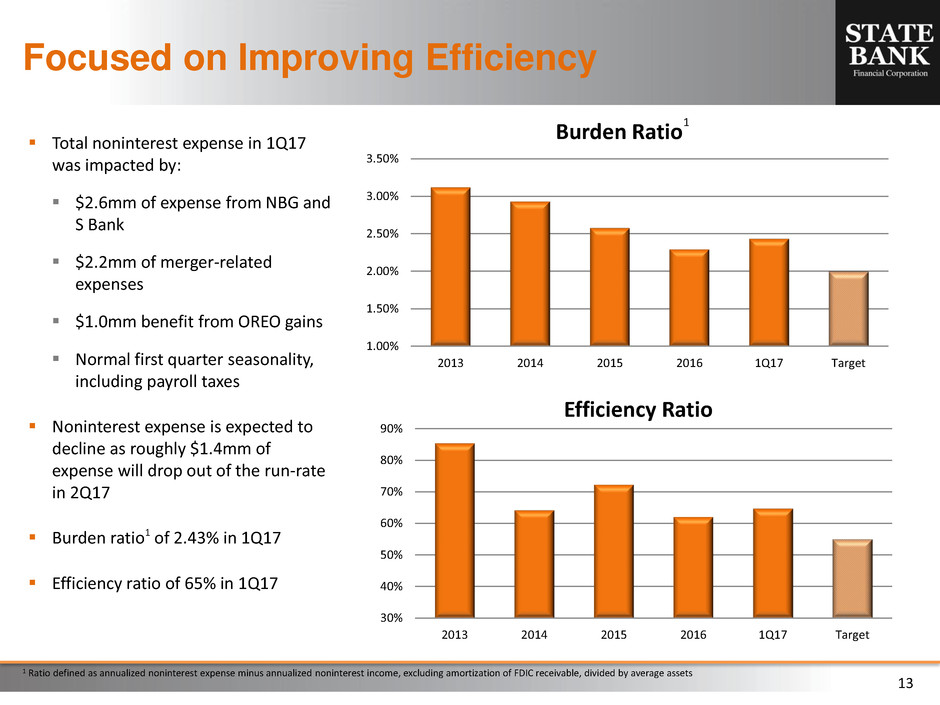
Total noninterest expense in 1Q17
was impacted by:
$2.6mm of expense from NBG and
S Bank
$2.2mm of merger-related
expenses
$1.0mm benefit from OREO gains
Normal first quarter seasonality,
including payroll taxes
Noninterest expense is expected to
decline as roughly $1.4mm of
expense will drop out of the run-rate
in 2Q17
Burden ratio1 of 2.43% in 1Q17
Efficiency ratio of 65% in 1Q17
1 Ratio defined as annualized noninterest expense minus annualized noninterest income, excluding amortization of FDIC receivable, divided by average assets
1.00%
1.50%
2.00%
2.50%
3.00%
3.50%
2013 2014 2015 2016 1Q17 Target
Burden Ratio
1
30%
40%
50%
60%
70%
80%
90%
2013 2014 2015 2016 1Q17 Target
Efficiency Ratio

14
Core Deposit Funding
($ i
n
m
m
)
N
IB
/ Tot
al D
ep
o
sit
s
Attractive, low-cost core deposit mix focused on transaction-based funding
1
10%
15%
20%
25%
30%
35%
0
500
1,000
1,500
2,000
2,500
3,000
3,500
4,000
2013 2014 2015 2016 2017 YTD
Average Deposit Composition
NIB IB Transaction Savings & MMA CDs NIB / Total Deposits
($ in mm)
2013 % 2014 % 2015 % 2016 % 1Q17 %
Noninterest-bearing 413 20% 490 23% 758 27% 852 29% 956 28%
Interest-bearing transaction 336 16% 386 18% 519 19% 541 19% 602 18%
Savings & MMA 928 44% 911 42% 1,060 38% 1,078 37% 1,389 41%
CDs 431 20% 380 18% 437 16% 422 15% 477 14%
Total Average Deposits $2,107 $2,166 $2,773 $2,893 $3,424

15
Core Deposit Funding
Continued focus on increasing
transaction deposits, which include
noninterest-bearing demand
deposits and interest-bearing
transaction accounts
Average noninterest-bearing
deposits represent 28% of total
deposits
Maintain leading market share in
middle Georgia, with strong market
share in Augusta and Athens, and
significant opportunity for growth in
Atlanta and Savannah
($ i
n
m
m
)
.00%
.10%
.20%
.30%
.40%
.50%
0
200
400
600
800
1,000
1,200
1Q14 2Q14 3Q14 4Q14 1Q15 2Q15 3Q15 4Q15 1Q16 2Q16 3Q16 4Q16 1Q17
Average Transaction Deposits
Interest-bearing Noninterest-bearing Cost of Funds
Deposit Region
($ in mm)
2013 % 2014 % 2015 % 2016 % 1Q17 %
Atla ta 798 38% 869 40% 1,080 39% 1,134 39% 1,145 33%
Middle Ge rgia 1,309 62% 1,297 60% 1,271 46% 1,337 46% 1,376 40%
Augusta - - - - 422 15% 422 15% 433 13%
Athens / Gainesville - - - - - - - - 378 11%
Greater Savannah - - - - - - - - 92 3%
Total Average Deposits $2,107 $2,166 $2,773 $2,893 $3,424

16
0
125
250
375
500
500
1,000
1,500
2,000
2,500
3,000
1Q14 2Q14 3Q14 4Q14 1Q15 2Q15 3Q15 4Q15 1Q16 2Q16 3Q16 4Q16 1Q17
Total Loan Portfolio
Organic PNCI PCI New Loan Fundings
Loan Portfolio
To
ta
l L
o
an
s
($
in
m
m
)
1 New loan fundings include new loans funded and net loan advances on existing commitments
1
New loan originations in
excess of $420mm in 1Q17,
in line with prior quarters
Organic and PNCI loans
increased $46.7mm in
1Q17, as organic growth
of $82.0mm was partially
offset by a $35.3mm
decline in PNCI loans
N
ew
Lo
an
Fu
n
d
in
gs ($ i
n
m
m
)
Loan Composition (period-end)
($ in mm)
2013 2014 2015 2016 1Q17
Construction, land & land development $251 $313 $501 $551 $462
Other commercial real estate 550 636 736 964 1,074
Total commercial real estate 802 949 1,236 1,516 1,536
Residential real estate 67 135 210 289 299
Owner-occupied real estate 175 212 281 372 372
C&I and eases 71 123 267 435 433
Consumer 9 9 21 42 61
Total Organic & PNCI Loans 1,123 1,428 2,015 2,654 2,701
PCI Loans 257 206 146 161 154
Total Loans $1,381 $1,635 $2,160 $2,815 $2,855

17
Loan Portfolio and CRE Composition
1 Organic and PNCI loans as of March 31, 2017
Commercial Real Estate Composition
Significant industry, client, source of
repayment, and geographic diversity in
the CRE portfolio
Construction, land & land development
(AD&C) comprises both residential and
commercial construction, which make up
11% and 9%, respectively, of total CRE
CRE
40%
AD&C
17%
OORE
14%
C&I
14%
SFR
11%
Leases
2%
Consumer
2%
Loan Portfolio
1
($ in mm) Organic PNCI Total % of Total CRE
CRE
Retail $267 $57 $324 21%
Office 153 29 182 12%
Hospitality 135 19 154 10%
Multifamily 114 32 146 10%
Industrial 65 20 85 6%
Sr. Housing 36 10 46 3%
Farmland 26 5 31 2%
Restaurant 24 5 30 2%
Mini Storage 26 2 29 2%
C-Store 21 5 26 2%
Other 17 4 21 1%
Total $886 $189 $1,074 70%
Construction, Land & Land Development
Residential Construction $163 $10 $173 11%
Land & Development 129 26 155 10%
Commercial Construction 126 8 133 9%
Total $418 $44 $462 30%
Total Commercial Real Estate $1,304 $233 $1,536

18
Purchased credit impaired loans
declined $6.5mm to $154.2mm as
of 1Q17
Over 89% of PCI loans are current
as of 1Q17
OREO balances declined to
$3.8mm at 1Q17, down from
$10.9mm in the previous quarter
Asset Quality
($ i
n
m
m
)
Total organic NPAs of $6.3mm,
representing .29% of organic loans
and OREO
Past due organic loans of just .08% at
1Q17
Average net charge-offs were .09%
in 1Q17
Allowance for organic loans is 1.01%
and covers NPAs by 3.4 times
0.00%
0.50%
1.00%
1.50%
2.00%
0
5
10
15
20
2013 2014 2015 2016 1Q17
Nonperforming Loans
Organic PNCI NPLs / Organic Loans
0
10
20
30
40
50
0
100
200
300
2013 2014 2015 2016 1Q17
OR
EO
($ i
n
m
m
)
PCI
Lo
an
s ($
in
m
m
)
PCI Loans & OREO
PCI Loans OREO
