Attached files
| file | filename |
|---|---|
| EX-99.1 - EX-99.1 - Green Bancorp, Inc. | gnbc-20170508ex99175b9ee.pdf |
| 8-K - 8-K - Green Bancorp, Inc. | gnbc-20170508x8k.htm |
Exhibit 99.1
|
|
Gulf South Bank Conference NASDAQ: GNBC May 2017 |
|
|
Safe Harbor The following information contains, or may be deemed to contain, "forward-looking statements" (as defined in the U.S. Private Securities Litigation Reform Act of 1995) giving Green Bancorp, Inc.’s (“Green Bancorp”) expectations or predictions of future financial or business performance or conditions. Most forward-looking statements contain words that identify them as forward-looking, such as "plan", "seek", "expect", "intend", "estimate", "anticipate", "believe", "project", "opportunity", "target", "goal", "growing“, "continue“, “positions,” “prospects” or “potential,” by future conditional verbs such as “will,” “would,” “should,” “could” or “may”, or by variations of such words or by similar expressions that relate to future events, as opposed to past or current events. By their nature, forward-looking statements are not statements of historical facts and involve risks and uncertainties because they relate to events and depend on circumstances that may or may not occur in the future. These statements give Green Bancorp's current expectation of future events or its future performance and do not relate directly to historical or current events or Green Bancorp's historical or future performance. As such, Green Bancorp's future results may vary from any expectations or goals expressed in, or implied by, the forward-looking statements included in this presentation, possibly to a material degree. Green Bancorp cannot assure you that the assumptions made in preparing any of the forward-looking statements will prove accurate or that any long-term financial goals will be realized. All forward-looking statements included in this presentation speak only as of the date made, and Green Bancorp undertakes no obligation to update or revise publicly any such forward-looking statements, whether as a result of new information, future events, or otherwise. In particular, Green Bancorp cautions you not to place undue weight on certain forward-looking statements pertaining to potential growth opportunities or long-term financial goals set forth herein. Green Bancorp's business is subject to numerous risks and uncertainties, which may cause future results of operations to vary significantly from those presented herein. In addition to factors previously disclosed in Green Bancorp’s reports filed with the SEC and those identified elsewhere in this communication, the following factors among others, could cause actual results to differ materially from forward-looking statements: difficulties and delays in integrating the Green Bancorp and Patriot Bancshares, Inc. businesses or fully realizing cost savings and other benefits; business disruption following the proposed transaction; changes in asset quality and credit risk; the inability to sustain revenue and earnings growth; changes in interest rates and capital markets; inflation; customer borrowing, repayment, investment and deposit practices; customer disintermediation; the introduction, withdrawal, success and timing of business initiatives; competitive conditions; the inability to realize cost savings or revenues or to implement integration plans and other consequences associated with mergers, acquisitions and divestitures; economic conditions; and the impact, extent and timing of technological changes, capital management activities, and other actions of the Federal Reserve Board and legislative and regulatory actions and reforms. Annualized, pro forma, projected and estimated numbers are used for illustrative purpose only, are not forecasts and may not reflect actual results. |
|
|
Non-GAAP Financial Information This document includes the presentation of both GAAP (generally accepted accounting principles) and non-GAAP financial measures. Green Bancorp’s management uses certain non−GAAP financial measures to evaluate its performance and believes that the presentation of non-GAAP financial measures is useful to investors because it provides investors with a more complete understanding of Green Bancorp’s operational results and a meaningful comparison of Green Bancorp’s performance between periods. Non-GAAP financial measures presented in this presentation or other presentations, press releases and similar documents issued by Green Bancorp may include, but are not limited to, pre-tax pre-provision return on average assets, tangible book value per common share, the tangible common equity to tangible assets ratio, the return on average tangible common equity ratio, allowance for loan losses less allowance for loan losses on acquired loans to total loans excluding acquired loans, and allowance for loan losses plus acquired loans net discount to total loans adjusted for acquired loan net discount. These non-GAAP financial measures do not have any standardized meaning and, therefore, are unlikely to be comparable to similar measures presented by comparable companies. Management may use these non-GAAP financial measures to establish operational goals and, in some cases, for measuring the performance of Green Bancorp. Please refer to the “GAAP to Non-GAAP Reconciliations” in the Annex of this presentation for a reconciliation of non-GAAP financial measures used in this presentation. |
|
|
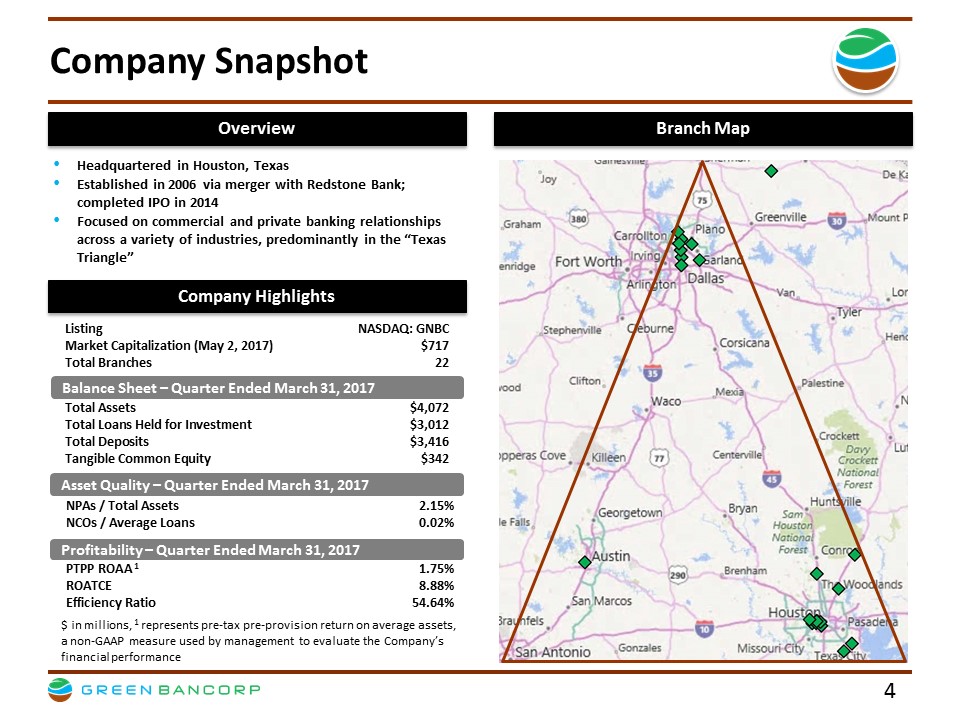
Company Snapshot Company Highlights Headquartered in Houston, Texas Established in 2006 via merger with Redstone Bank; completed IPO in 2014 Focused on commercial and private banking relationships across a variety of industries, predominantly in the “Texas Triangle” Balance Sheet – Quarter Ended March 31, 2017 Asset Quality – Quarter Ended March 31, 2017 Profitability – Quarter Ended March 31, 2017 Total Assets $4,072 Total Loans Held for Investment $3,012 Total Deposits $3,416 Tangible Common Equity $342 NPAs / Total Assets 2.15% NCOs / Average Loans 0.02% PTPP ROAA 1 1.75% ROATCE 8.88% Efficiency Ratio 54.64% Listing NASDAQ: GNBC Market Capitalization (May 2, 2017) $717 Total Branches 22 $ in millions, 1 represents pre-tax pre-provision return on average assets, a non-GAAP measure used by management to evaluate the Company’s financial performance Overview Branch Map |
|
|
First Quarter 2017 Highlights First quarter 2017 net income totaled $7.2 million, or $0.19 per diluted common share Pre-tax pre-provision return on average assets of 1.75% for 1Q17, up from 1.36% in 4Q16 Efficiency ratio of 54.6% for 1Q17, an improvement of 6.4% over the 4Q16 efficiency ratio of 61.0% Total energy loans have been reduced to $93.7 million, comprised of $76.3 million in loans held for investment (“HFI”) and $17.4 million in loans held for sale (“HFS”), at March 31, 2017 from $292.6 million at December 31, 2015 This represents energy exposure of 3.1% of total gross loans and 2.5% of HFI loans, of which 0.5% is related to energy production loans Total deposits increased $41.4 million or 5.0% on an annualized basis in Q1 2017, with the growth bringing non-interest bearing deposits to 20.7% of total deposits Tangible book value per common share increased $0.19 to $9.25 |
|
|
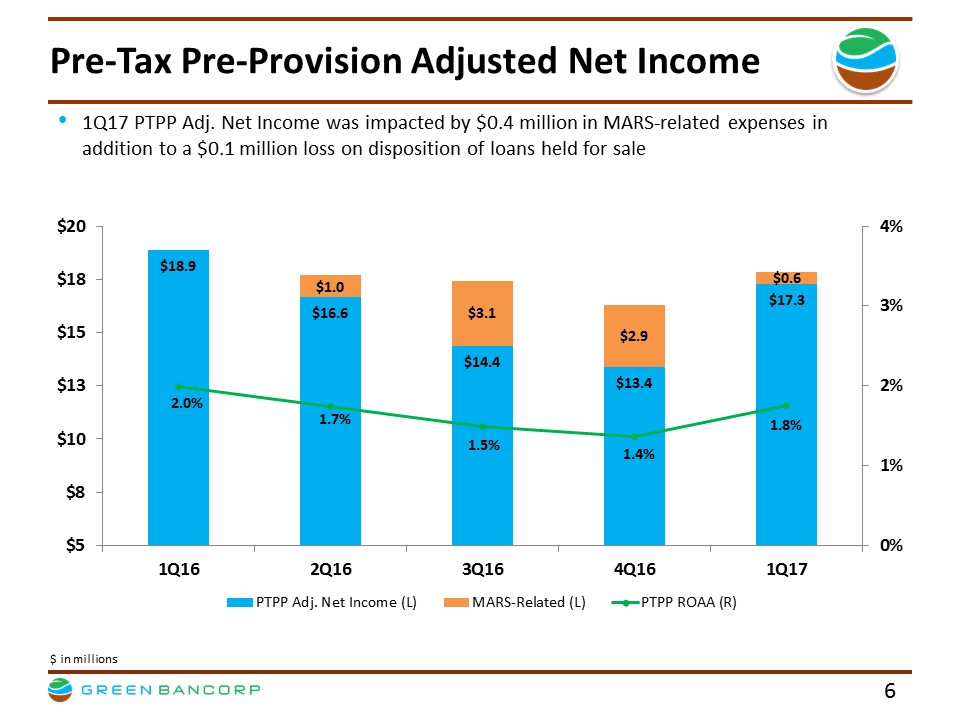
Pre-Tax Pre-Provision Adjusted Net Income 1Q17 PTPP Adj. Net Income was impacted by $0.4 million in MARS-related expenses in addition to a $0.1 million loss on disposition of loans held for sale $ in millions $18.9 $16.6 $14.4 $13.4 $17.3 $1.0 $3.1 $2.9 $0.6 2.0% 1.7% 1.5% 1.4% 1.8% 0% 1% 2% 3% 4% $5 $8 $10 $13 $15 $18 $20 1Q16 2Q16 3Q16 4Q16 1Q17 PTPP Adj. Net Income (L) MARS-Related (L) PTPP ROAA (R) |
|
|
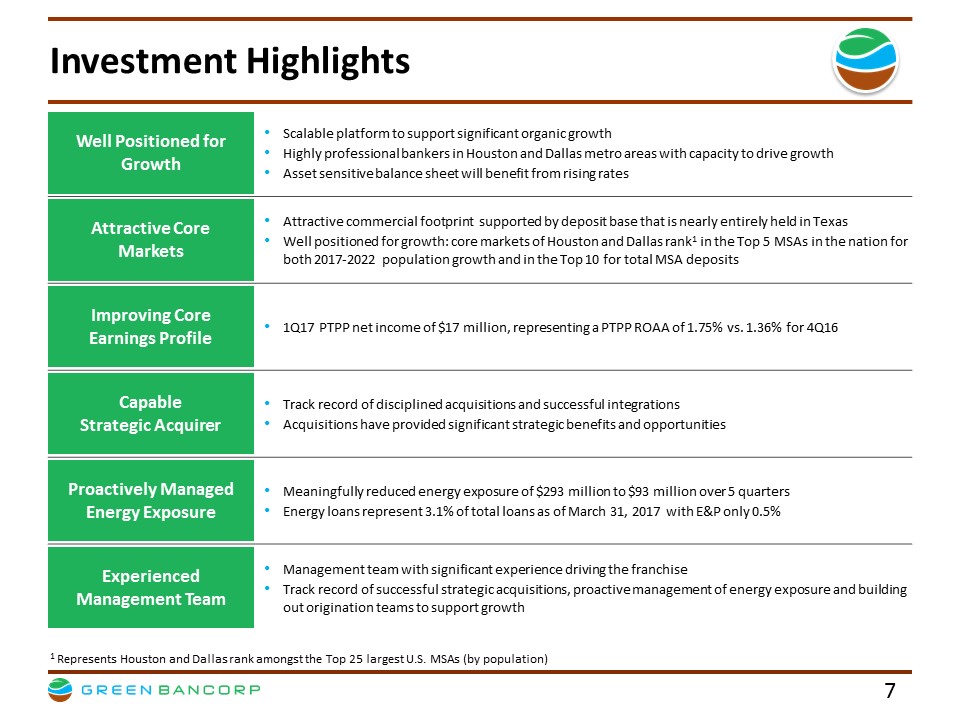
Investment Highlights Well Positioned for Growth Scalable platform to support significant organic growth Highly professional bankers in Houston and Dallas metro areas with capacity to drive growth Asset sensitive balance sheet will benefit from rising rates Attractive Core Markets Attractive commercial footprint supported by deposit base that is nearly entirely held in Texas Well positioned for growth: core markets of Houston and Dallas rank1 in the Top 5 MSAs in the nation for both 2017-2022 population growth and in the Top 10 for total MSA deposits Improving Core Earnings Profile 1Q17 PTPP net income of $17 million, representing a PTPP ROAA of 1.75% vs. 1.36% for 4Q16 Capable Strategic Acquirer Track record of disciplined acquisitions and successful integrations Acquisitions have provided significant strategic benefits and opportunities Proactively Managed Energy Exposure Meaningfully reduced energy exposure of $293 million to $93 million over 5 quarters Energy loans represent 3.1% of total loans as of March 31, 2017 with E&P only 0.5% Experienced Management Team Management team with significant experience driving the franchise Track record of successful strategic acquisitions, proactive management of energy exposure and building out origination teams to support growth 1 Represents Houston and Dallas rank amongst the Top 25 largest U.S. MSAs (by population) |
|
|
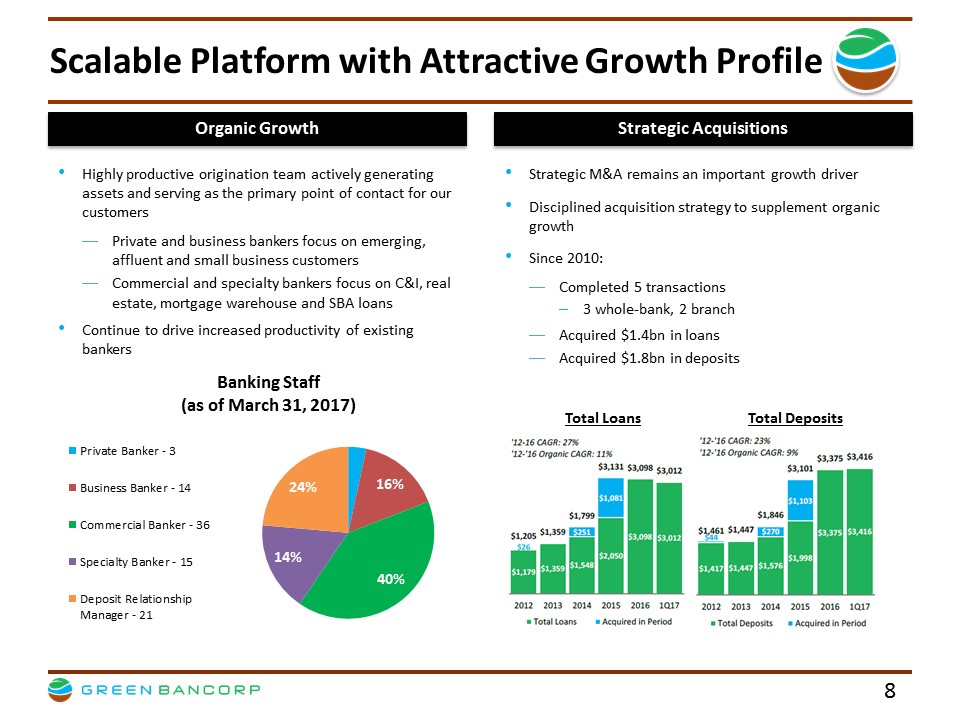
Scalable Platform with Attractive Growth Profile Highly productive origination team actively generating assets and serving as the primary point of contact for our customers Private and business bankers focus on emerging, affluent and small business customers Commercial and specialty bankers focus on C&I, real estate, mortgage warehouse and SBA loans Continue to drive increased productivity of existing bankers Strategic M&A remains an important growth driver Disciplined acquisition strategy to supplement organic growth Since 2010: Completed 5 transactions 3 whole-bank, 2 branch Acquired $1.4bn in loans Acquired $1.8bn in deposits Total Loans Total Deposits Organic Growth Strategic Acquisitions $1,179 $1,359 $1,548 $2,050 $3,098 $3,012 $26 $251 $1,081 $1,205 $1,359 $1,799 $3,131 $3,098 $3,012 2012 2013 2014 2015 2016 1Q17 Total Loans Acquired in Period '12 - 16 CAGR: 27% '12 - '16 Organic CAGR: 11% $1,417 $1,447 $1,576 $1,998 $3,375 $3,416 $44 $270 $1,103 $1,461 $1,447 $1,846 $3,101 $3,375 $3,416 2012 2013 2014 2015 2016 1Q17 Total Deposits Acquired in Period '12 - '16 CAGR: 23% '12 - '16 Organic CAGR: 9% 3% 16% 40% 14 % 24% Banking Staff (as of March 31, 2017) Private Banker - 3 Business Banker - 14 Commercial Banker - 36 Specialty Banker - 15 Deposit Relationship Manager - 21 |
|
|
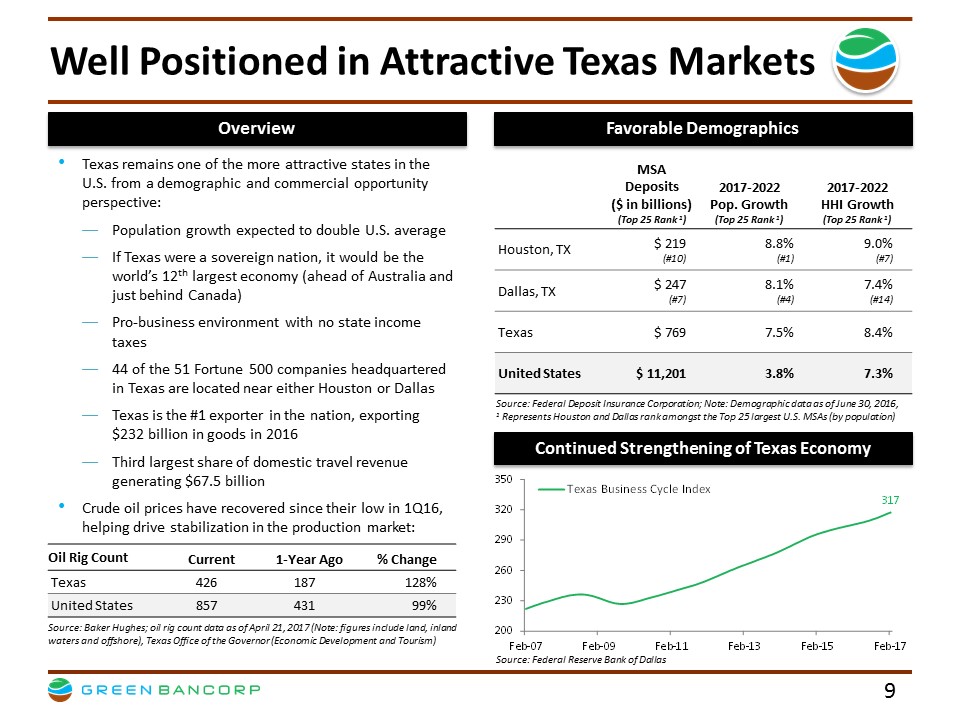
Well Positioned in Attractive Texas Markets Overview Favorable Demographics Texas remains one of the more attractive states in the U.S. from a demographic and commercial opportunity perspective: Population growth expected to double U.S. average If Texas were a sovereign nation, it would be the world’s 12th largest economy (ahead of Australia and just behind Canada) Pro-business environment with no state income taxes 44 of the 51 Fortune 500 companies headquartered in Texas are located near either Houston or Dallas Texas is the #1 exporter in the nation, exporting $232 billion in goods in 2016 Third largest share of domestic travel revenue generating $67.5 billion Crude oil prices have recovered since their low in 1Q16, helping drive stabilization in the production market: MSA Deposits ($ in billions) (Top 25 Rank 1) 2017-2022 Pop. Growth (Top 25 Rank 1) 2017-2022 HHI Growth (Top 25 Rank 1) Houston, TX $ 219 (#10) 8.8% (#1) 9.0% (#7) Dallas, TX $ 247 (#7) 8.1% (#4) 7.4% (#14) Texas $ 769 7.5% 8.4% United States $ 11,201 3.8% 7.3% Continued Strengthening of Texas Economy Oil Rig Count Current 1-Year Ago % Change Texas 426 187 128% United States 857 431 99% Source: Baker Hughes; oil rig count data as of April 21, 2017 (Note: figures include land, inland waters and offshore), Texas Office of the Governor (Economic Development and Tourism) Source: Federal Reserve Bank of Dallas Source: Federal Deposit Insurance Corporation; Note: Demographic data as of June 30, 2016, 1 Represents Houston and Dallas rank amongst the Top 25 largest U.S. MSAs (by population) 200 230 260 290 320 350 Feb-07 Feb-09 Feb-11 Feb-13 Feb-15 Feb-17 Texas Business Cycle Index 317 |
|
|
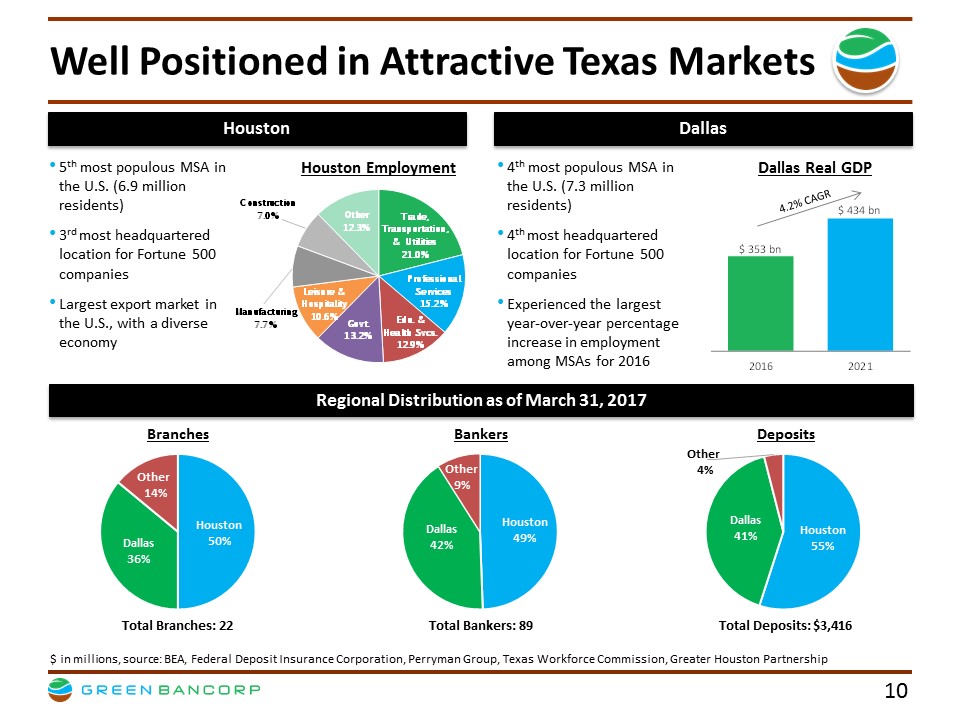
Well Positioned in Attractive Texas Markets Houston Dallas 5th most populous MSA in the U.S. (6.9 million residents) 3rd most headquartered location for Fortune 500 companies Largest export market in the U.S., with a diverse economy 4th most populous MSA in the U.S. (7.3 million residents) 4th most headquartered location for Fortune 500 companies Experienced the largest year-over-year percentage increase in employment among MSAs for 2016 Houston Employment Dallas Real GDP $ in millions, source: BEA, Federal Deposit Insurance Corporation, Perryman Group, Texas Workforce Commission, Greater Houston Partnership Branches Bankers Deposits Regional Distribution as of March 31, 2017 Total Branches: 22 Total Bankers: 89 Total Deposits: $3,416 ? Trade, Transportation, & Utilities 21.0% ? Professional Services 15.2% ? Edu. & Health Svcs. 12.9% ? Govt. 13.2% ? Leisure & Hospitality 10.6% ? Manufacturing 7.7% ? Construction 7.0% ? Other 12.3% 2016 2021 $ 353 bn $ 434 bn Houston 50% Dallas 36% Other 14% Houston 49% Dallas 42% Other 9% Houston 55% Dallas 41% Other 4% |
|
|
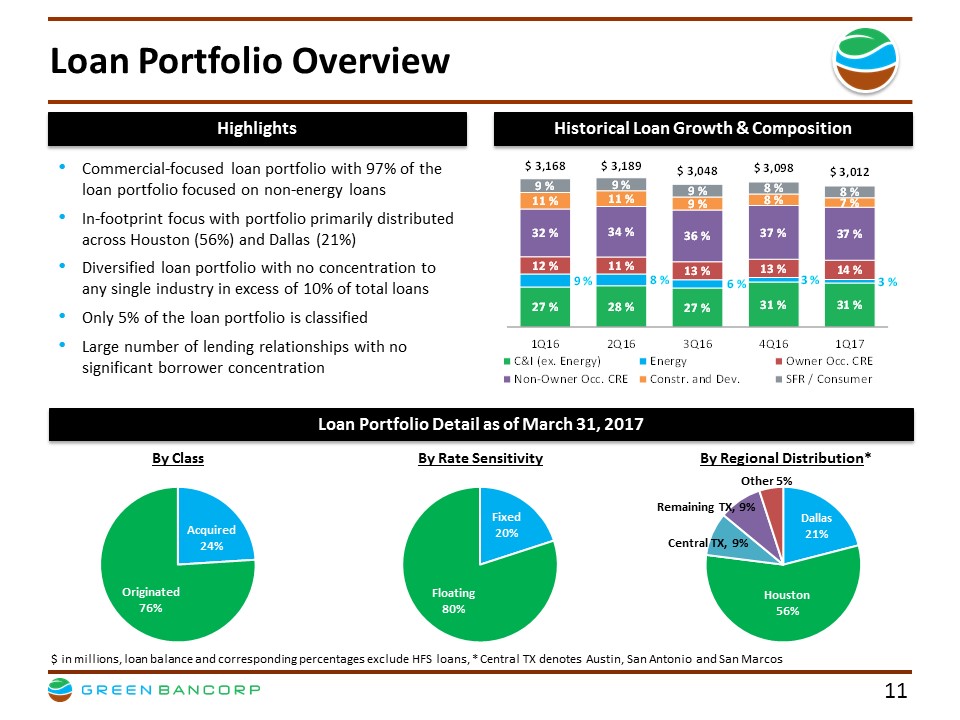
Loan Portfolio Overview Commercial-focused loan portfolio with 97% of the loan portfolio focused on non-energy loans In-footprint focus with portfolio primarily distributed across Houston (56%) and Dallas (21%) Diversified loan portfolio with no concentration to any single industry in excess of 10% of total loans Only 5% of the loan portfolio is classified Large number of lending relationships with no significant borrower concentration Loan Portfolio Detail as of March 31, 2017 By Class By Rate Sensitivity By Regional Distribution* $ in millions, loan balance and corresponding percentages exclude HFS loans, * Central TX denotes Austin, San Antonio and San Marcos Highlights Historical Loan Growth & Composition Acquired 24% Originated 76% Fixed 20% Floating 80% Dallas 21% Houston 56% Central TX, 9% Remaining TX, 9% Other 5% 31 % 31 % 27 % 28 % 27 % 3 % 3 % 6 % 8 % 9 % 14 % 13 % 13 % 11 % 12 % 37 % 37 % 36 % 34 % 32 % 7 % 8 % 9 % 11 % 11 % 8 % 8 % 9 % 9 % 9 % $ 3,012 $ 3,098 $ 3,048 $ 3,189 $ 3,168 1Q17 4Q16 3Q16 2Q16 1Q16 C&I (ex. Energy) Energy Owner Occ. CRE Non-Owner Occ. CRE Constr. and Dev. SFR / Consumer |
|
|
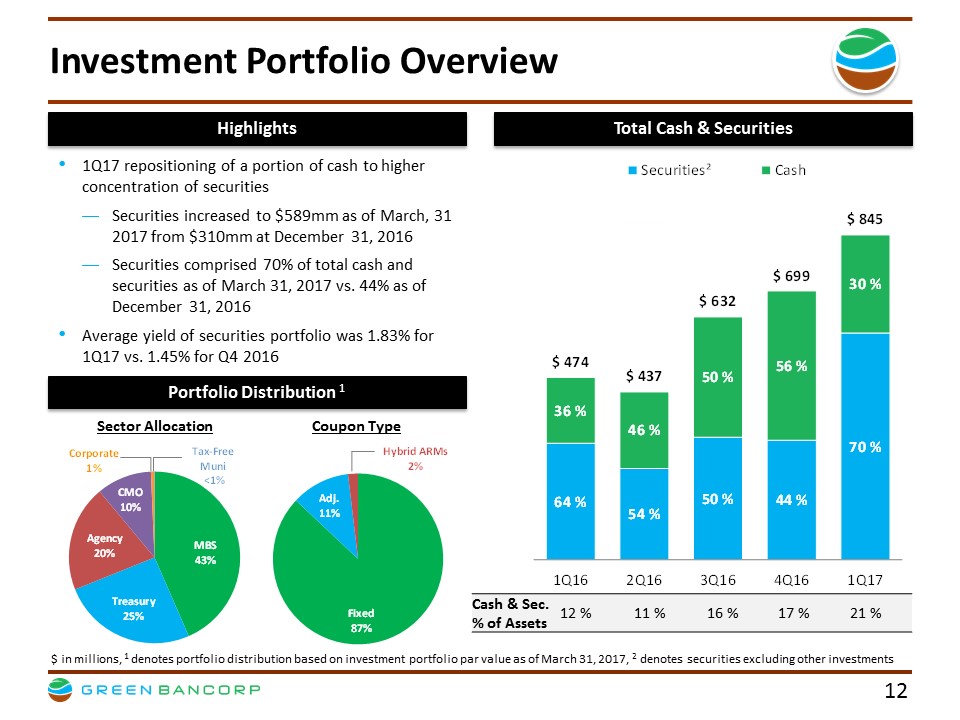
Investment Portfolio Overview Highlights 1Q17 repositioning of a portion of cash to higher concentration of securities Securities increased to $589mm as of March, 31 2017 from $310mm at December 31, 2016 Securities comprised 70% of total cash and securities as of March 31, 2017 vs. 44% as of December 31, 2016 Average yield of securities portfolio was 1.83% for 1Q17 vs. 1.45% for Q4 2016 Portfolio Distribution 1 Total Cash & Securities Sector Allocation Coupon Type Cash & Sec. % of Assets 12 % 11 % 16 % 17 % 21 % $ in millions, 1 denotes portfolio distribution based on investment portfolio par value as of March 31, 2017, 2 denotes securities excluding other investments ?MBS 43% ?Treasury 25% ?Agency 20% ?CMO 10% ?Corporate 1% Tax - Free Muni <1% ?Fixed 87% ?Adj. 11% ?Hybrid ARMs 2% 70 % 44 % 50 % 54 % 64 % 30 % 56 % 50 % 46 % 36 % $ 845 $ 699 $ 632 $ 437 $ 474 1Q17 4Q16 3Q16 2Q16 1Q16 Securities² Cash |
|
|
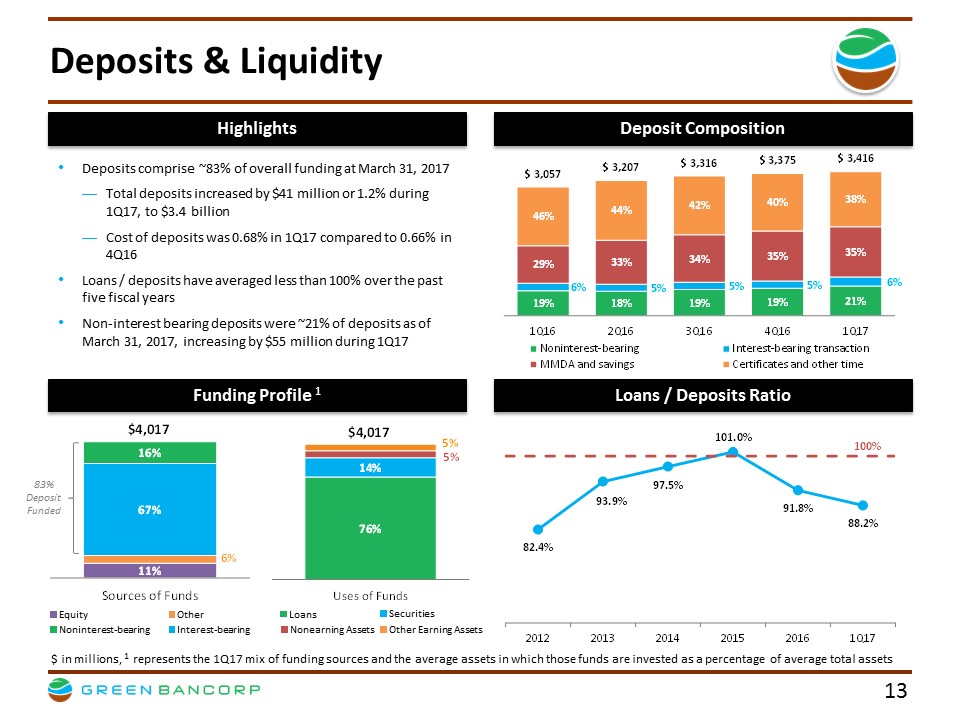
Deposits & Liquidity $ in millions, 1 represents the 1Q17 mix of funding sources and the average assets in which those funds are invested as a percentage of average total assets Deposits comprise ~83% of overall funding at March 31, 2017 Total deposits increased by $41 million or 1.2% during 1Q17, to $3.4 billion Cost of deposits was 0.68% in 1Q17 compared to 0.66% in 4Q16 Loans / deposits have averaged less than 100% over the past five fiscal years Non-interest bearing deposits were ~21% of deposits as of March 31, 2017, increasing by $55 million during 1Q17 Funding Profile 1 Loans / Deposits Ratio 83% Deposit Funded Equity Other Noninterest-bearing Interest-bearing Loans Securities Nonearning Assets Highlights Deposit Composition Other Earning Assets 19% 18% 19% 19% 21% 6% 5% 5% 5% 6% 29% 33% 34% 35% 35% 46% 44% 42% 40% 38% $ 3,057 $ 3,207 $ 3,316 $ 3,375 $ 3,416 1Q16 2Q16 3Q16 4Q16 1Q17 Noninterest-bearing Interest-bearing transaction MMDA and savings Certificates and other time 82.4% 93.9% 97.5% 101.0% 91.8% 88.2% 2012 2013 2014 2015 2016 1Q17 100% 76% 14% 5% 5% Uses of Funds $4,017 11% 6% 67% 16% Sources of Funds $4,017 |
|
|
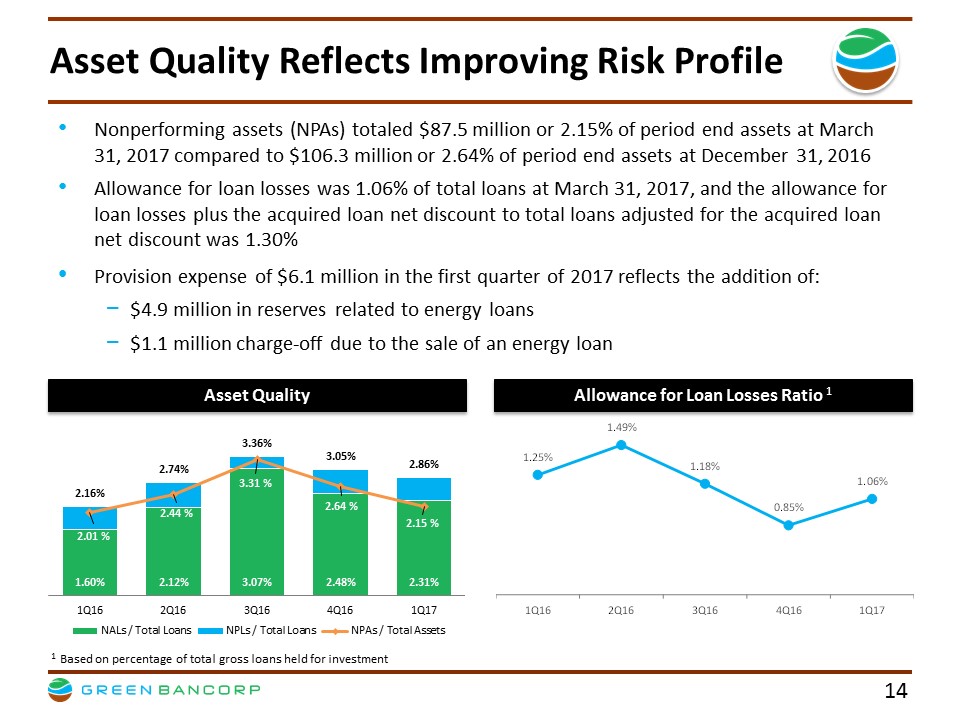
Asset Quality Reflects Improving Risk Profile 1 Based on percentage of total gross loans held for investment Asset Quality Allowance for Loan Losses Ratio 1 Nonperforming assets (NPAs) totaled $87.5 million or 2.15% of period end assets at March 31, 2017 compared to $106.3 million or 2.64% of period end assets at December 31, 2016 Allowance for loan losses was 1.06% of total loans at March 31, 2017, and the allowance for loan losses plus the acquired loan net discount to total loans adjusted for the acquired loan net discount was 1.30% Provision expense of $6.1 million in the first quarter of 2017 reflects the addition of: $4.9 million in reserves related to energy loans $1.1 million charge-off due to the sale of an energy loan 1.25% 1.49% 1.18% 0.85% 1.06% 1Q16 2Q16 3Q16 4Q16 1Q17 2.31% 2.48% 3.07% 2.12% 1.60% 2.86% 3.05% 3.36% 2.74% 2.16% 2.15 % 2.64 % 3.31 % 2.44 % 2.01 % 1Q17 4Q16 3Q16 2Q16 1Q16 NALs / Total Loans NPLs / Total Loans NPAs / Total Assets |
|
|
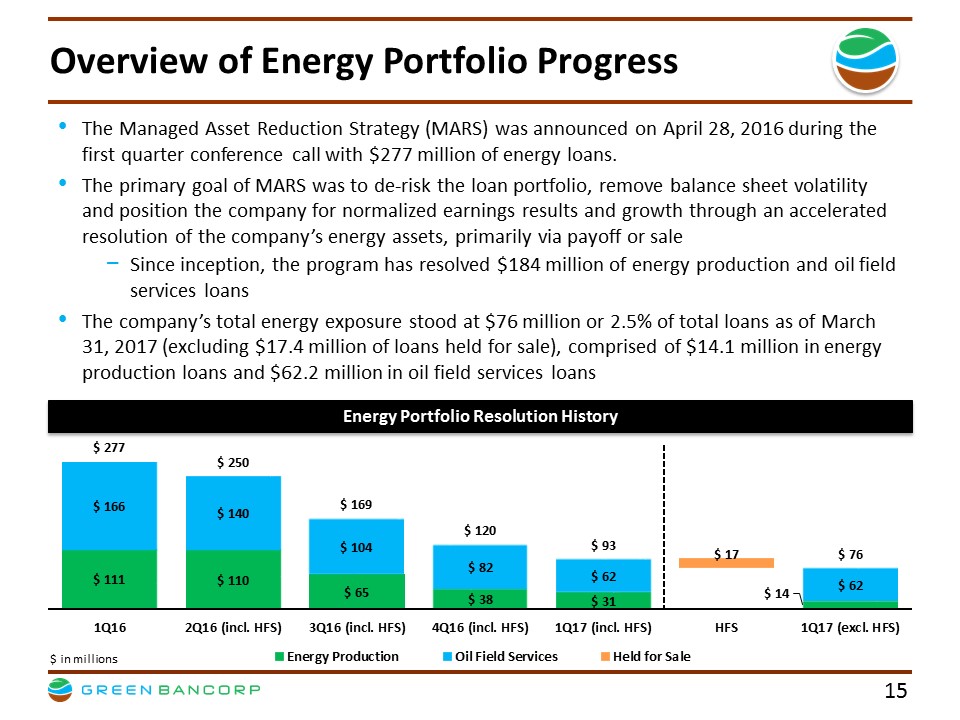
Overview of Energy Portfolio Progress The Managed Asset Reduction Strategy (MARS) was announced on April 28, 2016 during the first quarter conference call with $277 million of energy loans. The primary goal of MARS was to de-risk the loan portfolio, remove balance sheet volatility and position the company for normalized earnings results and growth through an accelerated resolution of the company’s energy assets, primarily via payoff or sale Since inception, the program has resolved $184 million of energy production and oil field services loans The company’s total energy exposure stood at $76 million or 2.5% of total loans as of March 31, 2017 (excluding $17.4 million of loans held for sale), comprised of $14.1 million in energy production loans and $62.2 million in oil field services loans Energy Portfolio Resolution History $ in millions $ 111 $ 110 $ 65 $ 38 $ 31 $ 14 $ 166 $ 140 $ 104 $ 82 $ 62 $ 62 $ 277 $ 250 $ 169 $ 120 $ 93 $ 17 $ 76 1Q16 2Q16 (incl. HFS) 3Q16 (incl. HFS) 4Q16 (incl. HFS) 1Q17 (incl. HFS) HFS 1Q17 (excl. HFS) Energy Production Oil Field Services Held for Sale |
|
|
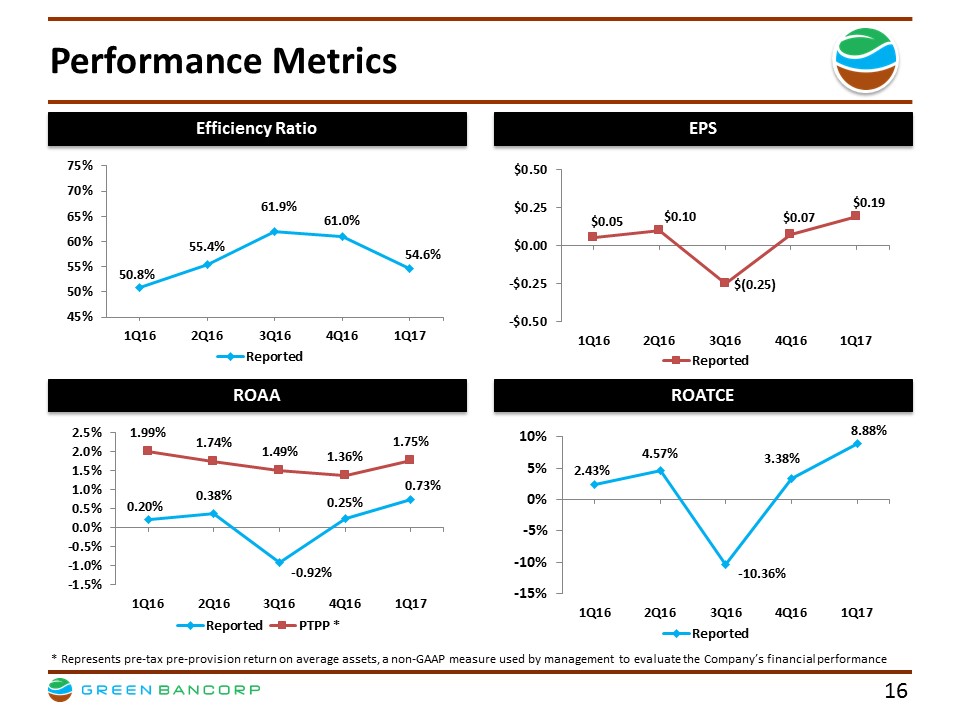
Performance Metrics ROAA ROATCE Efficiency Ratio EPS * Represents pre-tax pre-provision return on average assets, a non-GAAP measure used by management to evaluate the Company’s financial performance 50.8% 55.4% 61.9% 61.0% 54.6% 45% 50% 55% 60% 65% 70% 75% 1Q16 2Q16 3Q16 4Q16 1Q17 Reported 0.20% 0.38% - 0.92% 0.25% 0.73% 1.99% 1.74% 1.49% 1.36% 1.75% -1.5% -1.0% -0.5% 0.0% 0.5% 1.0% 1.5% 2.0% 2.5% 1Q16 2Q16 3Q16 4Q16 1Q17 Reported PTPP * 2.43% 4.57% - 10.36% 3.38% 8.88% -15% -10% -5% 0% 5% 10% 1Q16 2Q16 3Q16 4Q16 1Q17 Reported $0.05 $0.10 $(0.25) $0.07 $0.19 -$0.50 -$0.25 $0.00 $0.25 $0.50 1Q16 2Q16 3Q16 4Q16 1Q17 Reported |
|
|
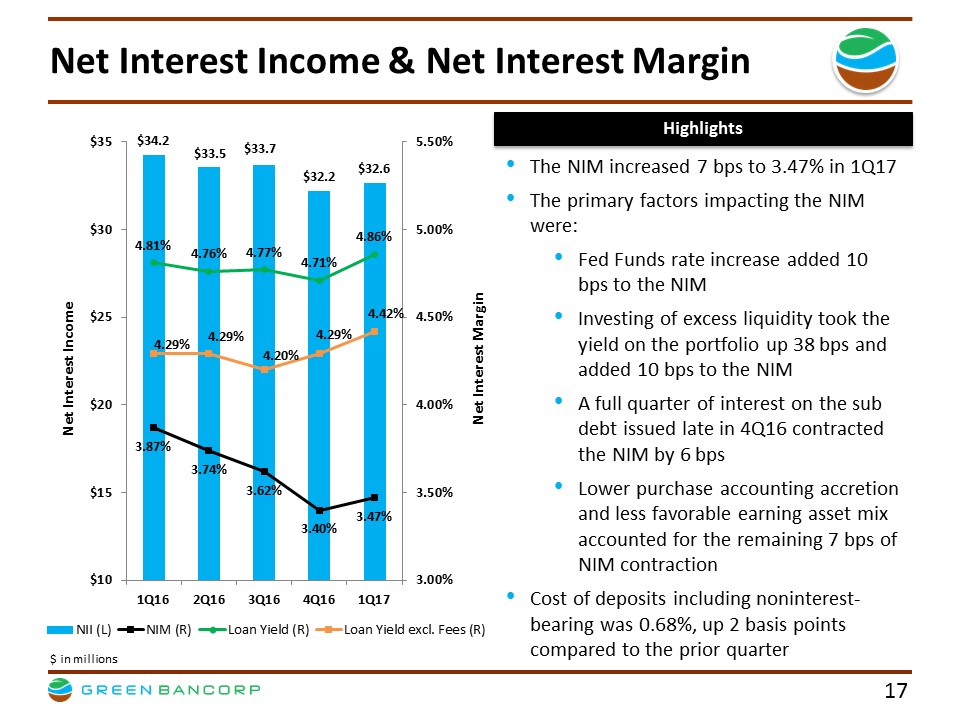
Net Interest Income & Net Interest Margin $ in millions The NIM increased 7 bps to 3.47% in 1Q17 The primary factors impacting the NIM were: Fed Funds rate increase added 10 bps to the NIM Investing of excess liquidity took the yield on the portfolio up 38 bps and added 10 bps to the NIM A full quarter of interest on the sub debt issued late in 4Q16 contracted the NIM by 6 bps Lower purchase accounting accretion and less favorable earning asset mix accounted for the remaining 7 bps of NIM contraction Cost of deposits including noninterest-bearing was 0.68%, up 2 basis points compared to the prior quarter Highlights $34.2 $33.5 $33.7 $32.2 $32.6 3.87% 3.74% 3.62% 3.40% 3.47% 4.81% 4.76% 4.77% 4.71% 4.86% 4.29% 4.29% 4.20% 4.29% 4.42% 3.00% 3.50% 4.00% 4.50% 5.00% 5.50% $10 $15 $20 $25 $30 $35 1Q16 2Q16 3Q16 4Q16 1Q17 Net Interest Margin Net Interest Income NII (L) NIM (R) Loan Yield (R) Loan Yield excl. Fees (R) |
|
|
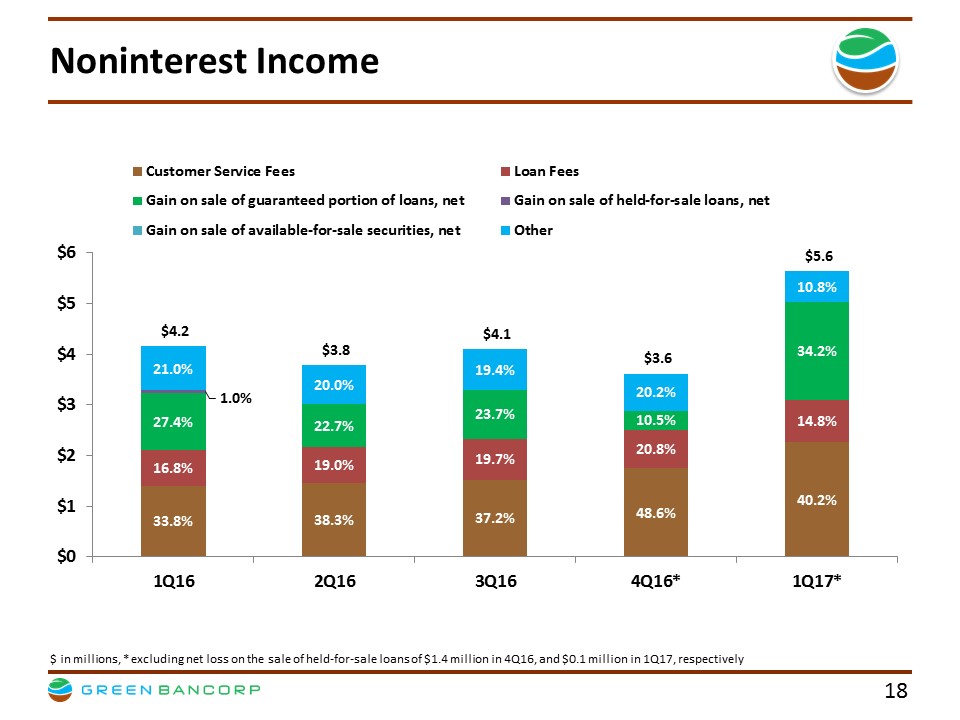
Noninterest Income $ in millions, * excluding net loss on the sale of held-for-sale loans of $1.4 million in 4Q16, and $0.1 million in 1Q17, respectively 33.8% 38.3% 37.2% 48.6% 40.2% 16.8% 19.0% 19.7% 20.8% 14.8% 27.4% 22.7% 23.7% 10.5% 34.2% 1.0% 21.0% 20.0% 19.4% 20.2% 10.8% $4.2 $3.8 $4.1 $3.6 $5.6 $0 $1 $2 $3 $4 $5 $6 1Q16 2Q16 3Q16 4Q16* 1Q17* Customer Service Fees Loan Fees Gain on sale of guaranteed portion of loans, net Gain on sale of held-for-sale loans, net Gain on sale of available-for-sale securities, net Other |
|
|
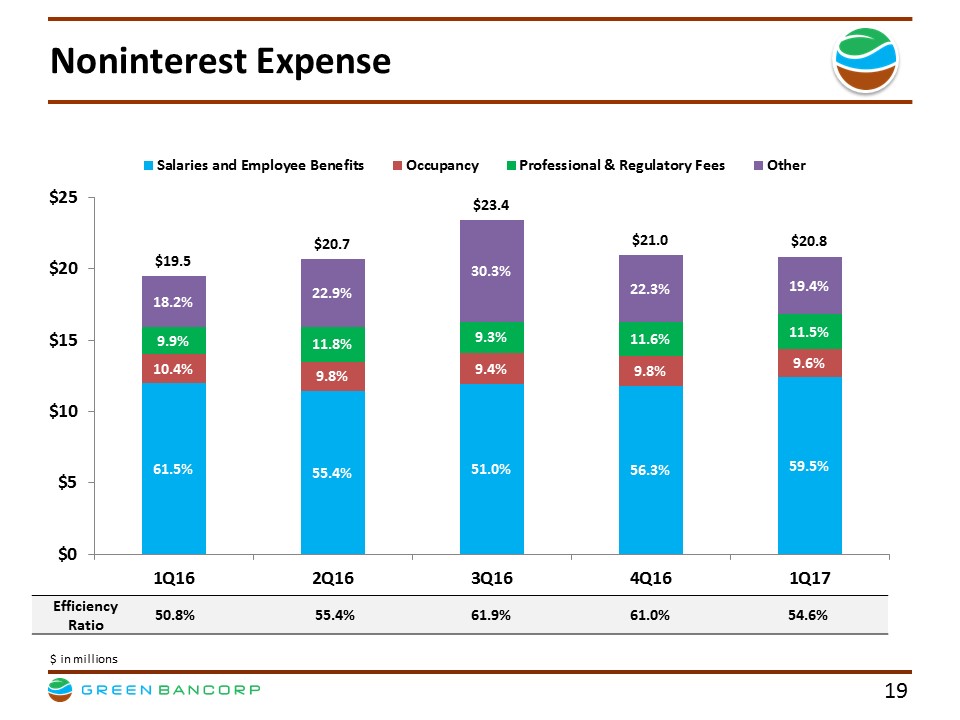
Noninterest Expense Efficiency Ratio 50.8% 55.4% 61.9% 61.0% 54.6% $ in millions 61.5% 55.4% 51.0% 56.3% 59.5% 10.4% 9.8% 9.4% 9.8% 9.6% 9.9% 11.8% 9.3% 11.6% 11.5% 18.2% 22.9% 30.3% 22.3% 19.4% $19.5 $20.7 $23.4 $21.0 $20.8 $0 $5 $10 $15 $20 $25 1Q16 2Q16 3Q16 4Q16 1Q17 Salaries and Employee Benefits Occupancy Professional & Regulatory Fees Other |
|
|
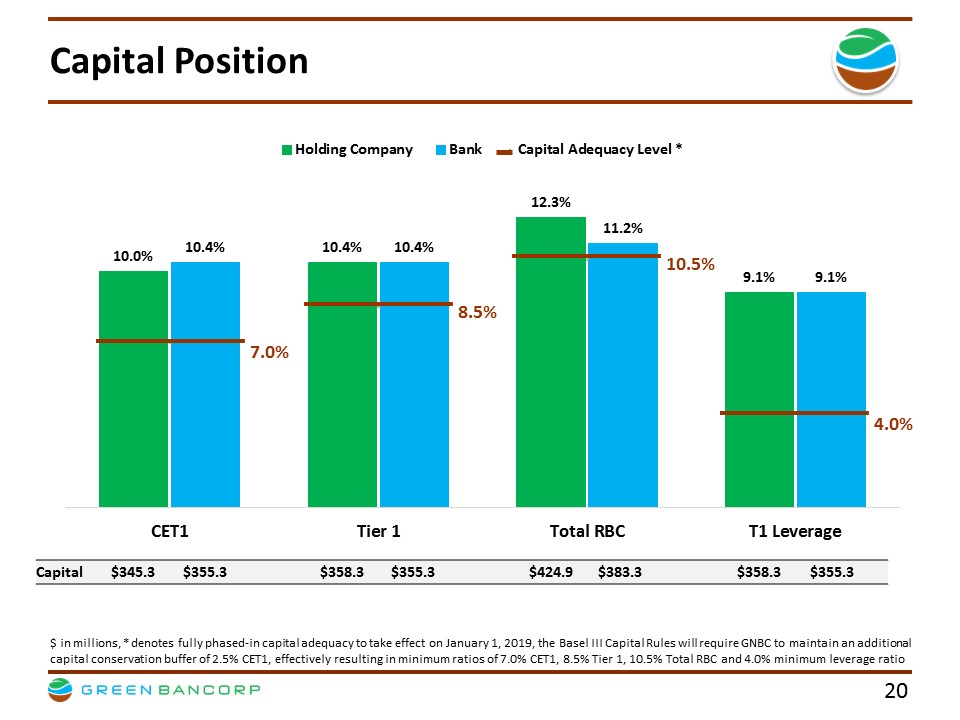
Capital Position Capital $345.3 $355.3 $358.3 $355.3 $424.9 $383.3 $358.3 $355.3 $ in millions, * denotes fully phased-in capital adequacy to take effect on January 1, 2019, the Basel III Capital Rules will require GNBC to maintain an additional capital conservation buffer of 2.5% CET1, effectively resulting in minimum ratios of 7.0% CET1, 8.5% Tier 1, 10.5% Total RBC and 4.0% minimum leverage ratio 4.0% 10.5% 8.5% 10.0% 10.4% 12.3% 9.1% 10.4% 10.4% 11.2% 9.1% CET1 Tier 1 Total RBC T1 Leverage Holding Company Bank Capital Adequacy Level * 7.0% |
|
|
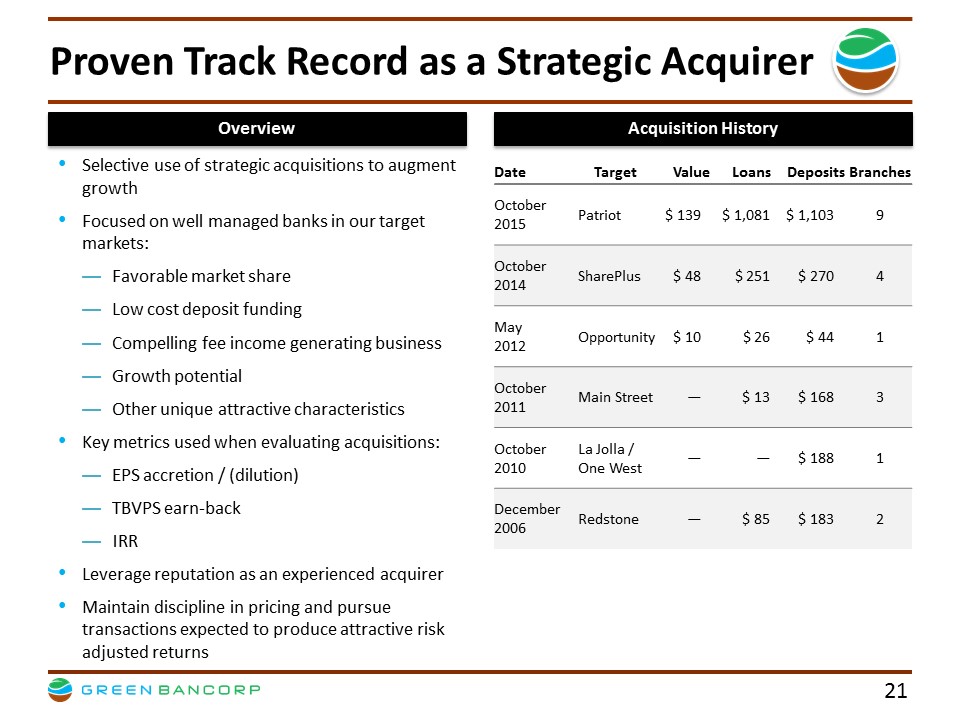
Proven Track Record as a Strategic Acquirer Date Target Value Loans Deposits Branches October 2015 Patriot $ 139 $ 1,081 $ 1,103 9 October 2014 SharePlus $ 48 $ 251 $ 270 4 May 2012 Opportunity $ 10 $ 26 $ 44 1 October 2011 Main Street — $ 13 $ 168 3 October 2010 La Jolla / One West — — $ 188 1 December 2006 Redstone — $ 85 $ 183 2 Selective use of strategic acquisitions to augment growth Focused on well managed banks in our target markets: Favorable market share Low cost deposit funding Compelling fee income generating business Growth potential Other unique attractive characteristics Key metrics used when evaluating acquisitions: EPS accretion / (dilution) TBVPS earn-back IRR Leverage reputation as an experienced acquirer Maintain discipline in pricing and pursue transactions expected to produce attractive risk adjusted returns Overview Acquisition History |
|
|
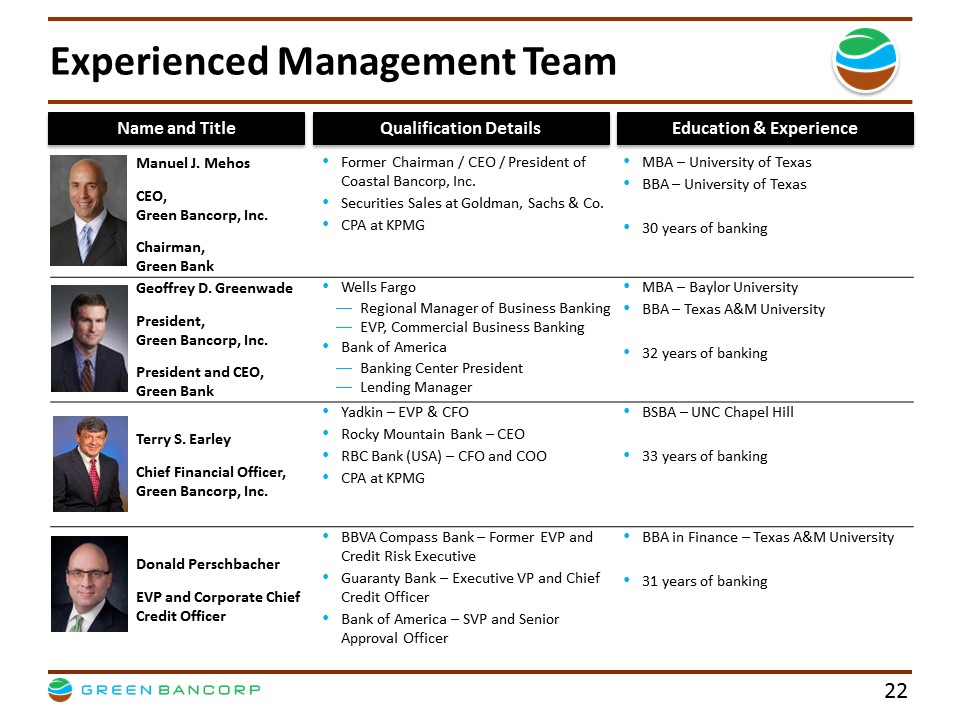
Experienced Management Team Manuel J. Mehos CEO, Green Bancorp, Inc. Chairman, Green Bank Former Chairman / CEO / President of Coastal Bancorp, Inc. Securities Sales at Goldman, Sachs & Co. CPA at KPMG MBA – University of Texas BBA – University of Texas 30 years of banking Geoffrey D. Greenwade President, Green Bancorp, Inc. President and CEO, Green Bank Wells Fargo Regional Manager of Business Banking EVP, Commercial Business Banking Bank of America Banking Center President Lending Manager MBA – Baylor University BBA – Texas A&M University 32 years of banking Terry S. Earley Chief Financial Officer, Green Bancorp, Inc. Yadkin – EVP & CFO Rocky Mountain Bank – CEO RBC Bank (USA) – CFO and COO CPA at KPMG BSBA – UNC Chapel Hill 33 years of banking Donald Perschbacher EVP and Corporate Chief Credit Officer BBVA Compass Bank – Former EVP and Credit Risk Executive Guaranty Bank – Executive VP and Chief Credit Officer Bank of America – SVP and Senior Approval Officer BBA in Finance – Texas A&M University 31 years of banking Name and Title Qualification Details Education & Experience |
|
|
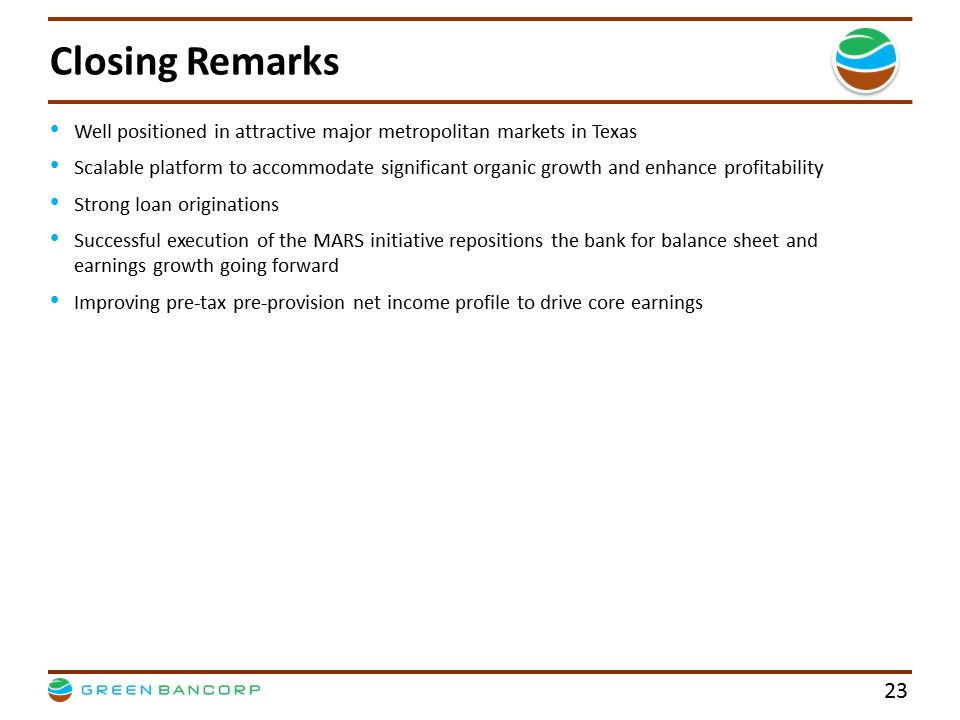
Closing Remarks Well positioned in attractive major metropolitan markets in Texas Scalable platform to accommodate significant organic growth and enhance profitability Strong loan originations Successful execution of the MARS initiative repositions the bank for balance sheet and earnings growth going forward Improving pre-tax pre-provision net income profile to drive core earnings |
|
|
Appendix |
|
|
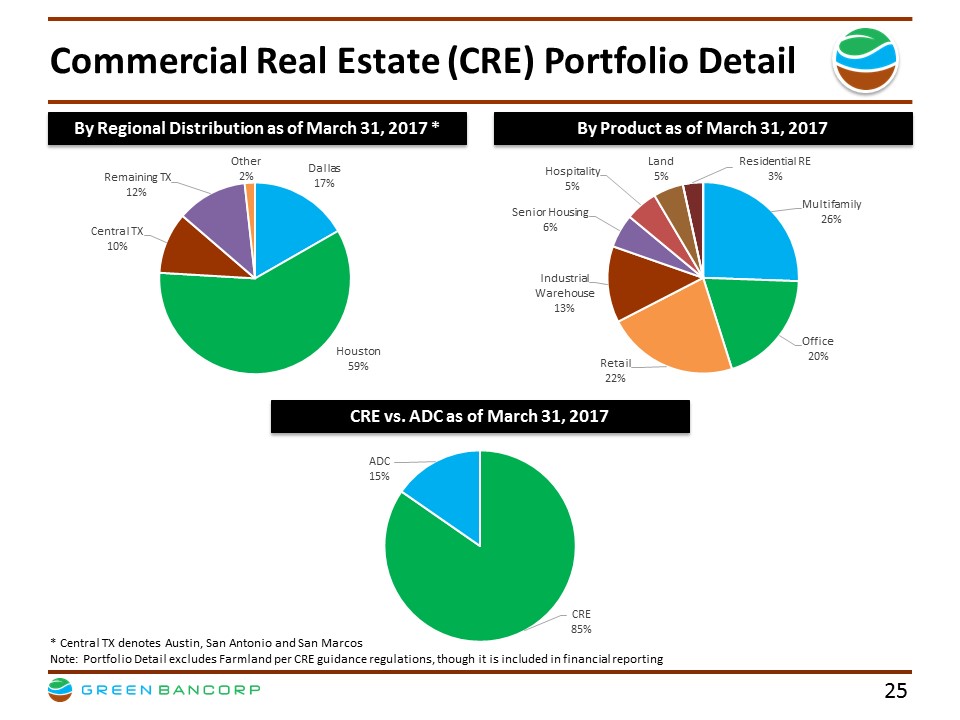
Commercial Real Estate (CRE) Portfolio Detail * Central TX denotes Austin, San Antonio and San Marcos By Regional Distribution as of March 31, 2017 * By Product as of March 31, 2017 CRE vs. ADC as of March 31, 2017 Note: Portfolio Detail excludes Farmland per CRE guidance regulations, though it is included in financial reporting Multifamily 26% Office 20% Retail 22% Industrial Warehouse 13% Senior Housing 6% Hospitality 5% Land 5% Residential RE 3% CRE 85% ADC 15% Dallas 17% Houston 59% Central TX 10% Remaining TX 12% Other 2% |
|
|
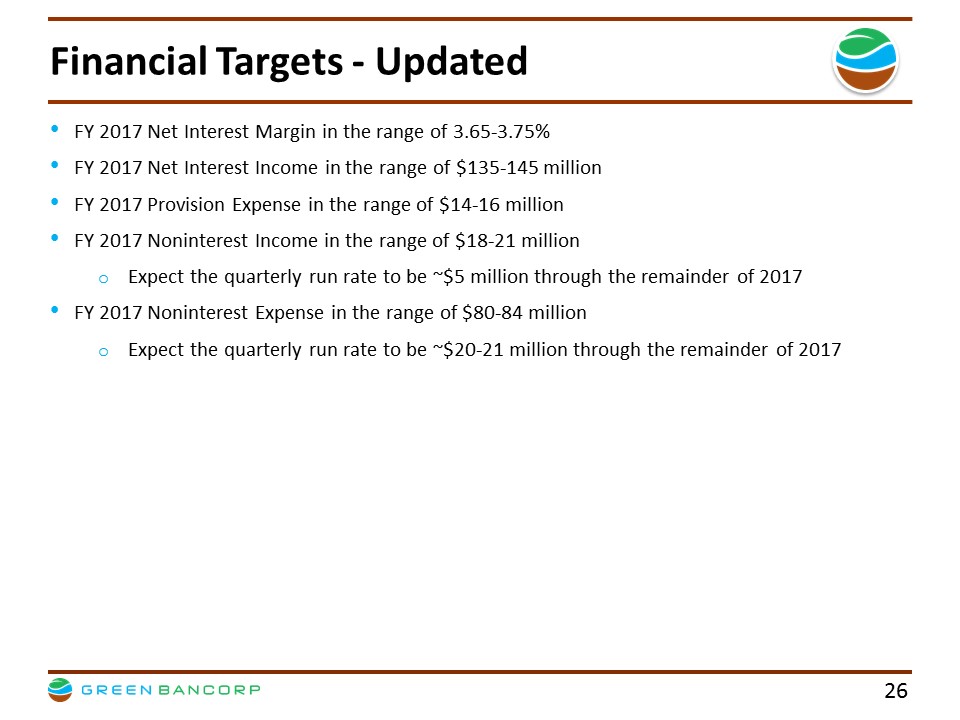
Financial Targets - Updated FY 2017 Net Interest Margin in the range of 3.65-3.75% FY 2017 Net Interest Income in the range of $135-145 million FY 2017 Provision Expense in the range of $14-16 million FY 2017 Noninterest Income in the range of $18-21 million Expect the quarterly run rate to be ~$5 million through the remainder of 2017 FY 2017 Noninterest Expense in the range of $80-84 million Expect the quarterly run rate to be ~$20-21 million through the remainder of 2017 |
|
|
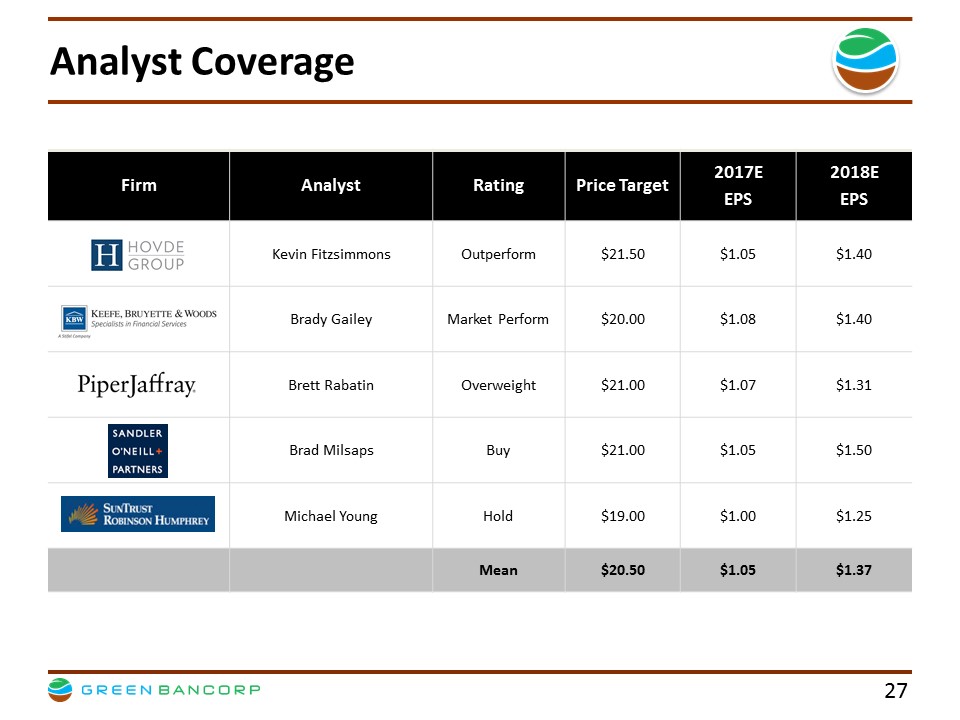
Analyst Coverage Firm Analyst Rating Price Target 2017E EPS 2018E EPS Kevin Fitzsimmons Outperform $21.50 $1.05 $1.40 Brady Gailey Market Perform $20.00 $1.08 $1.40 Brett Rabatin Overweight $21.00 $1.07 $1.31 Brad Milsaps Buy $21.00 $1.05 $1.50 Michael Young Hold $19.00 $1.00 $1.25 Mean $20.50 $1.05 $1.37 |
|
|
GAAP to Non-GAAP Reconciliations |
|
|
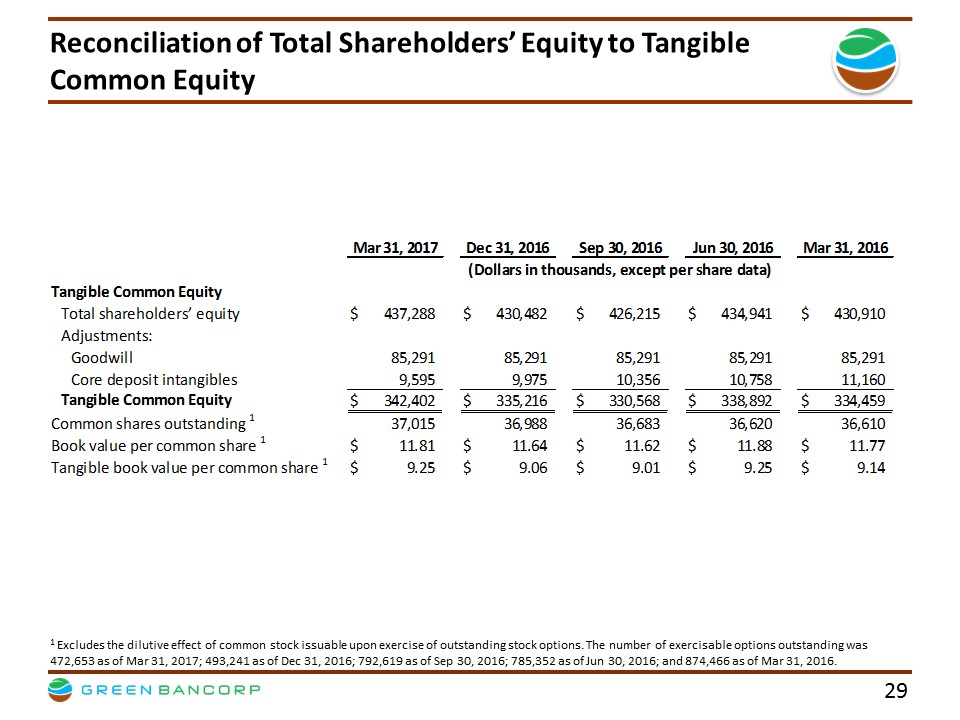
Reconciliation of Total Shareholders’ Equity to Tangible Common Equity 1 Excludes the dilutive effect of common stock issuable upon exercise of outstanding stock options. The number of exercisable options outstanding was 472,653 as of Mar 31, 2017; 493,241 as of Dec 31, 2016; 792,619 as of Sep 30, 2016; 785,352 as of Jun 30, 2016; and 874,466 as of Mar 31, 2016. Tangible Common Equity Total shareholders’ equity $ 437,288 $ 430,482 $ 426,215 $ 434,941 $ 430,910 Adjustments: Goodwill 85,291 85,291 85,291 85,291 85,291 Core deposit intangibles 9,595 9,975 10,356 10,758 11,160 Tangible Common Equity $ 342,402 $ 335,216 $ 330,568 $ 338,892 $ 334,459 Common shares outstanding 1 37,015 36,988 36,683 36,620 36,610 Book value per common share 1 $ 11.81 $ 11.64 $ 11.62 $ 11.88 $ 11.77 Tangible book value per common share 1 $ 9.25 $ 9.06 $ 9.01 $ 9.25 $ 9.14 (Dollars in thousands, except per share data) Mar 31, 2017 Dec 31, 2016 Sep 30, 2016 Jun 30, 2016 Mar 31, 2016 |
|
|
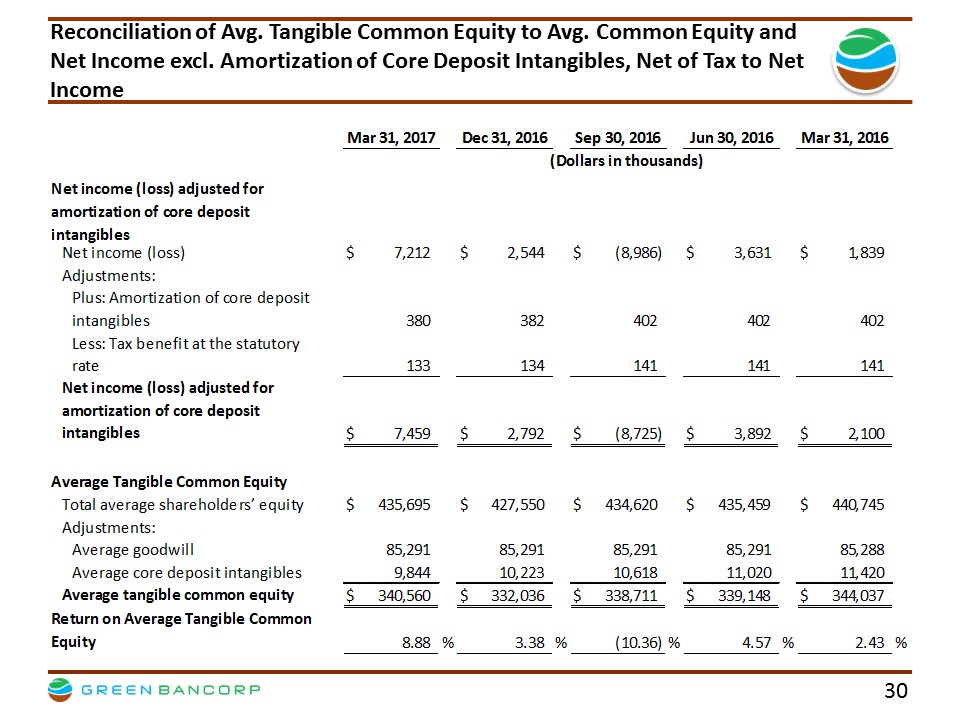
Reconciliation of Avg. Tangible Common Equity to Avg. Common Equity and Net Income excl. Amortization of Core Deposit Intangibles, Net of Tax to Net Income Net income (loss) adjusted for amortization of core deposit intangibles Net income (loss) $ 7,212 $ 2,544 $ (8,986) $ 3,631 $ 1,839 Adjustments: Plus: Amortization of core deposit intangibles 380 382 402 402 402 Less: Tax benefit at the statutory rate 133 134 141 141 141 Net income (loss) adjusted for amortization of core deposit intangibles $ 7,459 $ 2,792 $ (8,725) $ 3,892 $ 2,100 Average Tangible Common Equity Total average shareholders’ equity $ 435,695 $ 427,550 $ 434,620 $ 435,459 $ 440,745 Adjustments: Average goodwill 85,291 85,291 85,291 85,291 85,288 Average core deposit intangibles 9,844 10,223 10,618 11,020 11,420 Average tangible common equity $ 340,560 $ 332,036 $ 338,711 $ 339,148 $ 344,037 Return on Average Tangible Common Equity 8.88 % 3.38 % (10.36) % 4.57 % 2.43 % (Dollars in thousands) Mar 31, 2017 Dec 31, 2016 Sep 30, 2016 Jun 30, 2016 Mar 31, 2016 |
|
|
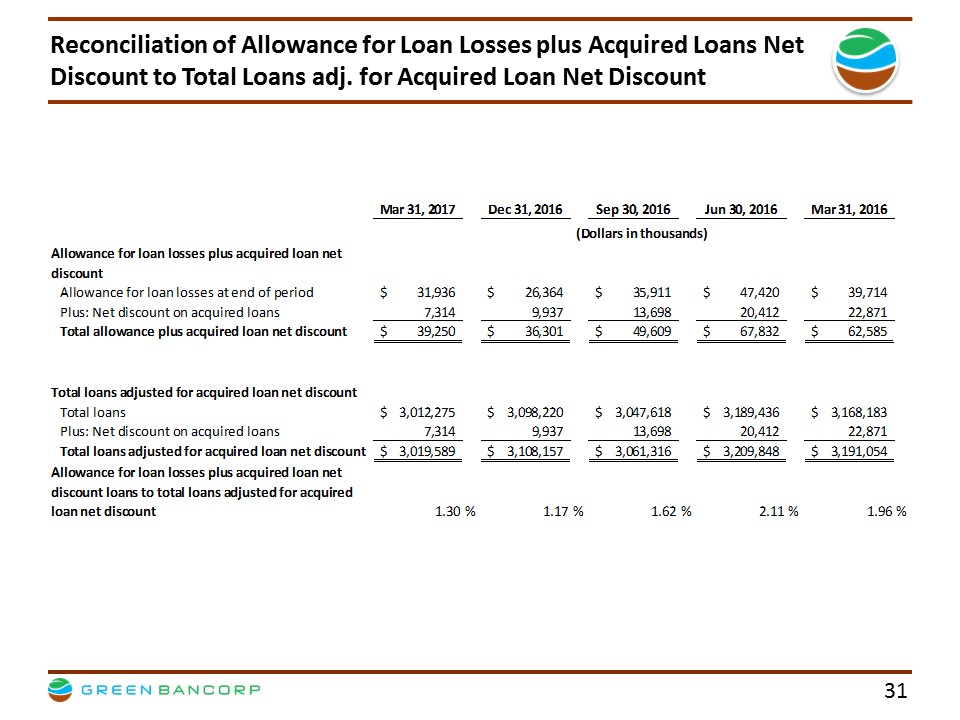
Reconciliation of Allowance for Loan Losses plus Acquired Loans Net Discount to Total Loans adj. for Acquired Loan Net Discount Allowance for loan losses plus acquired loan net discount Allowance for loan losses at end of period $ 31,936 $ 26,364 $ 35,911 $ 47,420 $ 39,714 Plus: Net discount on acquired loans 7,314 9,937 13,698 20,412 22,871 Total allowance plus acquired loan net discount $ 39,250 $ 36,301 $ 49,609 $ 67,832 $ 62,585 Total loans adjusted for acquired loan net discount Total loans $ 3,012,275 $ 3,098,220 $ 3,047,618 $ 3,189,436 $ 3,168,183 Plus: Net discount on acquired loans 7,314 9,937 13,698 20,412 22,871 Total loans adjusted for acquired loan net discount $ 3,019,589 $ 3,108,157 $ 3,061,316 $ 3,209,848 $ 3,191,054 Allowance for loan losses plus acquired loan net discount loans to total loans adjusted for acquired loan net discount 1.30 % 1.17 % 1.62 % 2.11 % 1.96 % (Dollars in thousands) Mar 31, 2017 Dec 31, 2016 Sep 30, 2016 Jun 30, 2016 Mar 31, 2016 |
|
|
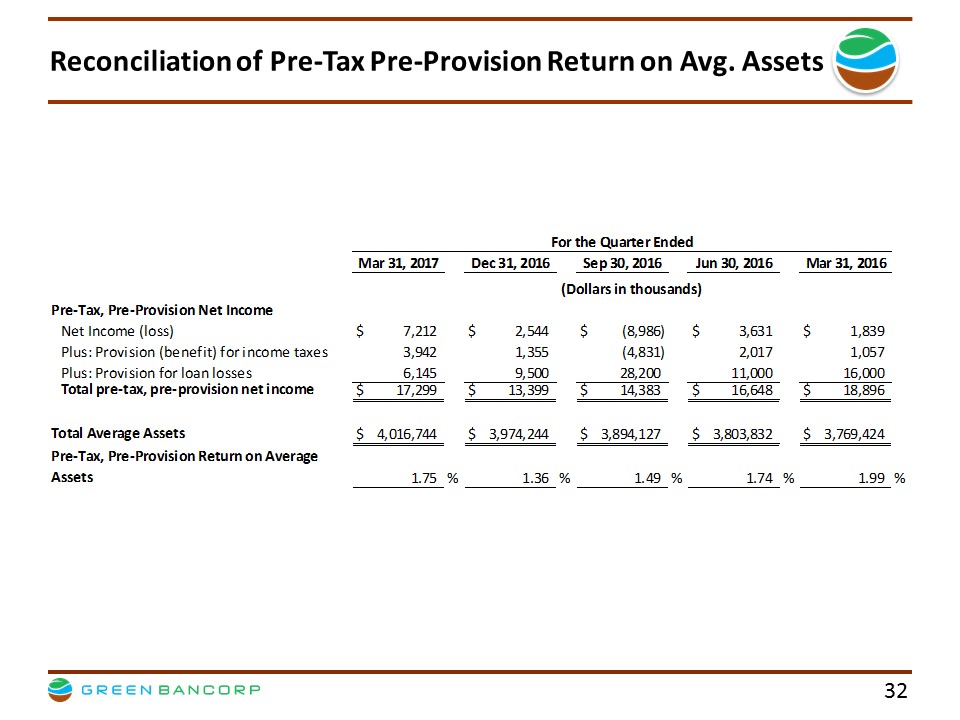
Reconciliation of Pre-Tax Pre-Provision Return on Avg. Assets Pre-Tax, Pre-Provision Net Income Net Income (loss) $ 7,212 $ 2,544 $ (8,986) $ 3,631 $ 1,839 Plus: Provision (benefit) for income taxes 3,942 1,355 (4,831) 2,017 1,057 Plus: Provision for loan losses 6,145 9,500 28,200 11,000 16,000 Total pre-tax, pre-provision net income $ 17,299 $ 13,399 $ 14,383 $ 16,648 $ 18,896 Total Average Assets $ 4,016,744 $ 3,974,244 $ 3,894,127 $ 3,803,832 $ 3,769,424 Pre-Tax, Pre-Provision Return on Average Assets 1.75 % 1.36 % 1.49 % 1.74 % 1.99 % (Dollars in thousands) For the Quarter Ended Mar 31, 2017 Dec 31, 2016 Sep 30, 2016 Jun 30, 2016 Mar 31, 2016 |

