Attached files
| file | filename |
|---|---|
| EX-99.1 - EX-99.1 - Cadence Bancorporation | d393991dex991.htm |
| 8-K - 8-K - Cadence Bancorporation | d393991d8k.htm |
Exhibit 99.2

First Quarter 2017 Financial Results
May 8, 2017
Disclaimers
Thiscommunicationcontainsforward-lookingstatementswithinthemeaningofthePrivateSecuritiesLitigationReformActof1995.Theseforward-looking statements reflect our
current views with respect to, among other things, future events and our results of operations, financial condition and financial performance. These statements are often, but not always, made through the use of words or phrases such as may, should,
could, predict, potential, believe, will likely result, expect, continue, will, anticipate, seek, estimate, intend, plan, projection, would and outlook, orthenegativeversionofthosewordsorother comparablewordsofafuture orforward-lookingnature.These
forward-lookingstatementsare not historical facts, and are based on current expectations, estimates and projections about our industry, management’s beliefs and certain assumptions made by management, many of which, by their nature, are
inherently uncertain and beyond our control. Accordingly, we caution you that any such forward-looking statements are not guarantees of future performance and are subject to risks, assumptions and uncertainties that are difficult to predict.
Although we believe that the expectations reflected in these forward-looking statements are reasonable as of the date made, actual results may prove to bemateriallydifferentfromtheresultsexpressedorimpliedbytheforward-lookingstatements.
Suchfactorsinclude,withoutlimitation,the RiskFactors referenced in our Registration Statement on Form S-1 filed with the Securities and Exchange Commission (SEC), other risks and uncertainties listed from time
to time in our reports and documents filed with the SEC, including our Annual Reports on Form 10-K and Quarterly Reports on Form 10-Q, and the
followingfactors:businessandeconomicconditionsgenerallyandinthefinancialservicesindustry,nationallyandwithinourcurrentand futuregeographic market areas; economic, market, operational, liquidity, credit and interest rate risks associated with our
business; lack of seasoning in our loan portfolio; deteriorating asset quality and higher loan charge-offs;the lawsand regulations applicable to our business;our ability to achieveorganic loan anddeposit
growthandthecompositionofsuchgrowth;increasedcompetitioninthefinancialservicesindustry,nationally,regionallyorlocally;ourability tomaintain our historical earnings trends; our ability to raise additional capital to implement our business plan;
material weaknesses in our internal control over financial reporting; systems failures or interruptions involving our information technology and telecommunications systems or third-party servicers; the composition of our management team and our
ability to attract and retain key personnel; the fiscal position of the U.S. federal government and the soundness of other financial institutions; the composition of our loan portfolio, including the identify of our borrowers and the concentration
of loans in energy-related industries andinour specialized industries;the portionofourloanportfolio that iscomprised ofparticipationsandshared national credits; and the amount ofnonperforming and classified assets we hold. Cadence can give no
assurance that any goal or plan or expectation set forth in forward-looking statements can beachieved and readersare cautioned not toplace unduerelianceon such statements. Theforward-looking statementsare made
asofthedateofthiscommunication,andCadencedoesnotintend,andassumesnoobligation, toupdateanyforward-lookingstatementtoreflect events or circumstances after thedate on which the statement is madeor to reflect the occurrence ofunanticipated events or
circumstances, except asrequired byapplicablelaw.
Certainofthefinancialmeasuresandratioswepresentaresupplementalmeasuresthatarenotrequiredby,orarenotpresentedinaccordancewith, U.S.
generallyacceptedaccountingprinciples(GAAP).Werefertothesefinancialmeasuresandratiosas non-GAAPfinancialmeasures. Weconsidertheuseof select non-GAAP financial measures
and ratios to be useful for financial and operational decision making and useful in evaluating period-to-period comparisons. These
non-GAAP financial measures should not be considered a substitute for financial information presented in accordance with GAAP and you should not rely on non-GAAP
financial measures alone as measures of our performance. More information regarding non-GAAP financial measures, including a reconciliation of non-GAAP financial
measures to the comparable GAAP financial measures, is included in our earnings release and in the appendixtothispresentation.
2 Cadence Bank, N.A. Member FDIC
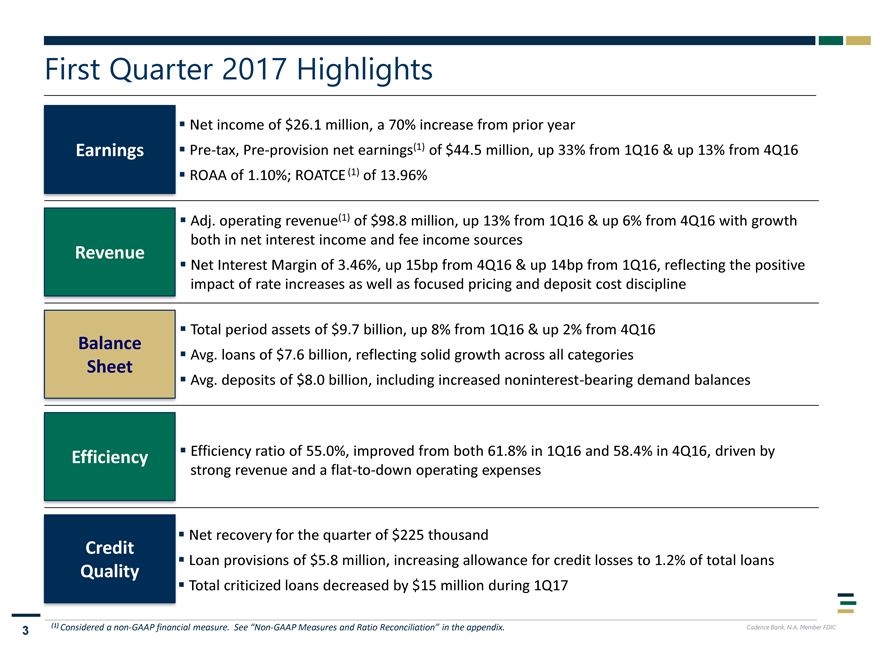
First Quarter 2017 Highlights
Net income of $26.1 million, a 70% increase from prior year
Earnings Pre-tax, Pre-provision net earnings(1) of $44.5 million, up 33% from 1Q16 & up 13% from 4Q16
ROAA of 1.10%; ROATCE(1) of 13.96%
Adj. operating revenue(1) of $98.8 million, up 13%
from 1Q16 & up 6% from 4Q16 with growth
both in net interest income and fee income sources
Revenue
Net Interest Margin of 3.46%, up 15bp from 4Q16 & up 14bp from 1Q16, reflecting
the positive
impact of rate increases as well as focused pricing and deposit cost discipline
Balance Total period assets of $9.7 billion, up 8% from 1Q16 & up 2% from 4Q16
Avg.
loans of $7.6 billion, reflecting solid growth across all categories
Sheet Avg. deposits of $8.0 billion, including increased noninterest-bearing demand
balances
Efficiency Efficiency ratio of 55.0%, improved from both 61.8% in 1Q16 and 58.4% in 4Q16, driven by
strong revenue and a flat-to-down operating expenses
Net recovery for the quarter of $225 thousand
Credit
Loan provisions of $5.8 million, increasing allowance for credit losses to 1.2% of total loans
Quality
Total criticized loans decreased by $15million during 1Q17
3 (1) Considered a non-GAAP financial measure. See Non-GAAP Measures and Ratio Reconciliation in the
appendix. Cadence Bank, N.A. Member FDIC
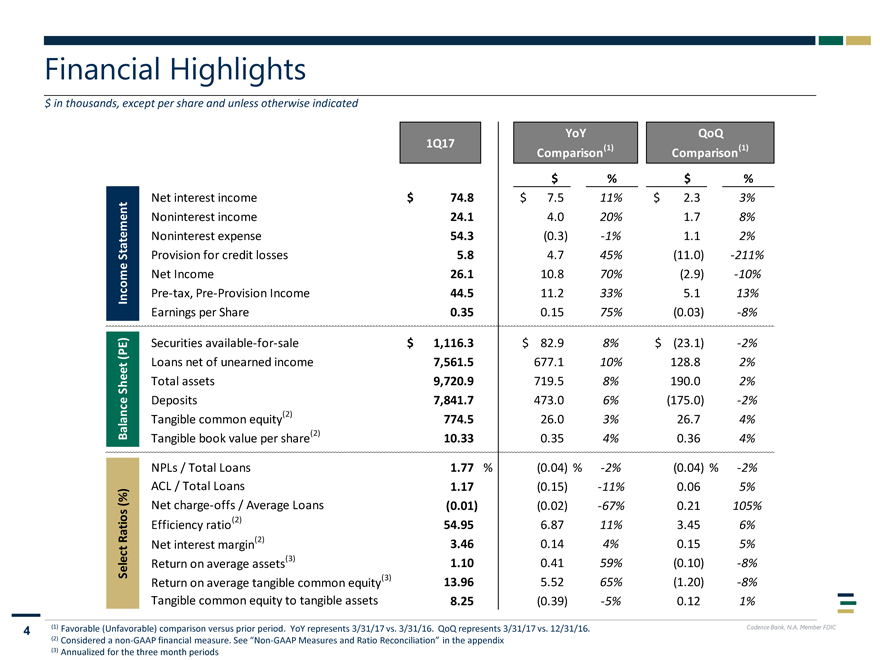
Financial Highlights
$ in thousands, except per share and unless otherwise indicated
YoYQoQ
1Q17(1)(1)
ComparisonComparison
$%$%
Net interest income $ 74.8$7.511%$2.33%
Noninterest income 24.14.020%1.78%
Noninterest
expense 54.3(0.3)-1%1.12%
Provision for credit losses 5.84.745%(11.0)-211%
Net Income 26.110.870%(2.9)-10%
In c o m e Stateme n t Pre-tax, Pre-Provision Income 44.5 11.233%5.113%
Earnings per
Share 0.350.1575%(0.03)-8%
Securities
available-for-sale $ 1,116.3 $82.98%$(23.1)-2%
Loans net of
unearned income 7,561.5 677.110%128.82%
Total assets 9,720.9719.58%190.02%
Deposits 7,841.7473.06%(175.0)-2%
Tangible common
equity(2) 774.5 26.03%26.74%
Balance Sh e et ( PE) (2)
Tangible book value per share 10.33 0.354%0.364%
NPLs / Total
Loans 1.77%(0.04) %-2%(0.04) %-2%
ACL / Total Loans 1.17(0.15)-11%0.065%
Net charge-offs / Average Loans (0.01) (0.02)-67%0.21105%
Efficiency
ratio(2) 54.956.8711%3.456%
Net interest margin(2) 3.460.144%0.155%
Select R atios ( % ) Return on average assets(3) 1.10 0.4159%(0.10)-8%
Return on average tangible common equity(3) 13.96 5.5265%(1.20)-8%
Tangible common equity to tangible assets 8.25 (0.39)-5%0.121%
4 (1)
Favorable (Unfavorable) comparison versus prior period. YoY represents 3/31/17 vs. 3/31/16. QoQrepresents 3/31/17 vs. 12/31/16. Cadence Bank, N.A. Member FDIC
(2)
Considered a non-GAAP financial measure. See Non-GAAP Measures and Ratio Reconciliation in the appendix
(3) Annualized for the three month periods
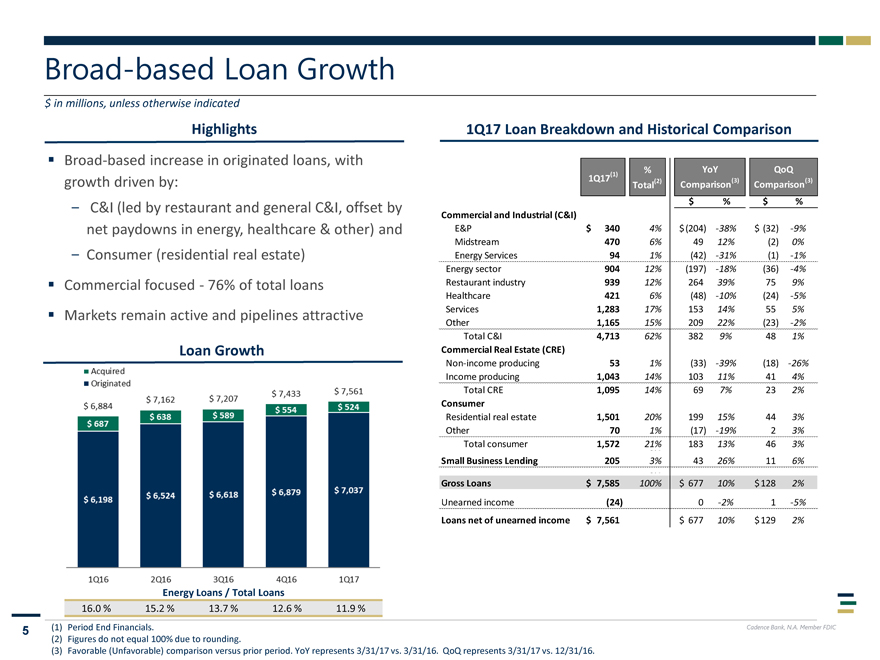
Broad-based Loan Growth
$
in millions, unless otherwise indicated
Highlights
Broad-based increase in
originated loans, with
growth driven by:
C&I (led by restaurant and
general C&I, offset by
net paydowns in energy, healthcare & other) and
Consumer (residential real estate)
Commercial focused—76% of total loans
Markets remain active and pipelines attractive
Loan Growth
Energy Loans /Total Loans
16.0 % 15.2 % 13.7 % 12.6 % 11.9 %
1Q17 Loan Breakdown and Historical Comparison
(1)%YoYQoQ
1Q17 (2)(3)(3)
TotalComparisonComparison
$%$%
Commercial and Industrial (C&I)
E&P $3404%$ (204)-38%$ (32)-9%
Midstream
4706%4912%(2)0%
Energy Services 941%(42)-31%(1)-1%
Energy sector 90412%(197)-18%(36)-4%
Restaurant
industry 93912%26439%759%
Healthcare 4216%(48)-10%(24)-5%
Services 1,28317%15314%555%
Other
1,16515%20922%(23)-2%
Total C&I 4,71362%3829%481%
Commercial Real Estate (CRE)
Non-income producing 531%(33)-39%(18)-26%
Income producing 1,04314%10311%414%
Total CRE 1,09514%697%232%
Consumer
Residential real
estate 1,50120%19915%443%
Other 701%(17)-19%23%
Total consumer 1,57221%18313%463%
Small Business
Lending 2053%4326%116%
Gross Loans $7,585100%$67710%$ 1282%
Unearned income (24)0-2%1-5%
Loans net of unearned
income $7,561$67710%$ 1292%
5 (1) Period End Financials. Cadence Bank, N.A. Member FDIC
(2) Figures do not equal 100% due to rounding.
(3) Favorable (Unfavorable) comparison versus
prior period. YoY represents 3/31/17 vs. 3/31/16. QoQrepresents 3/31/17 vs. 12/31/16.
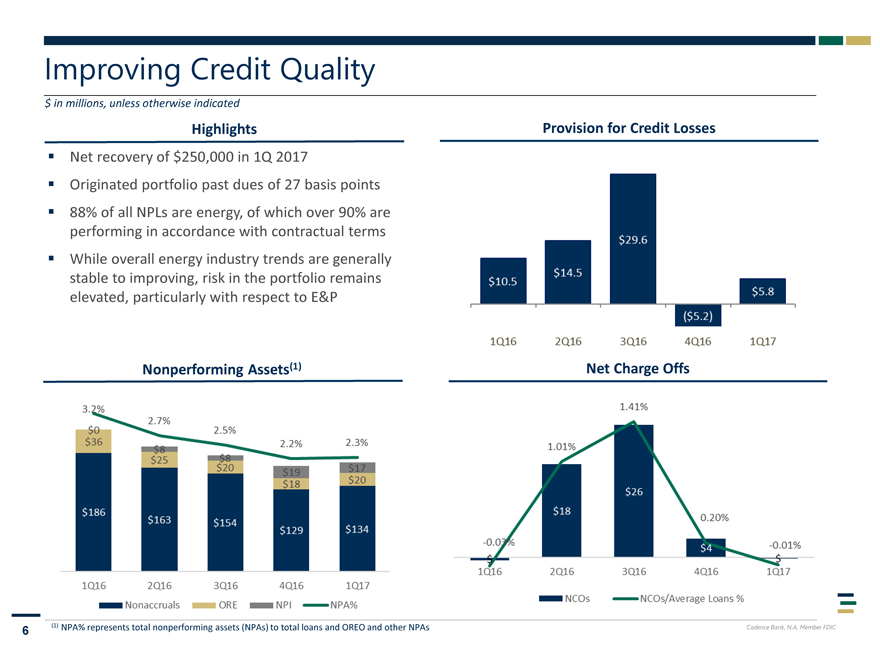
Improving Credit Quality
$ in millions, unless otherwise indicated
Highlights
Provision for Credit Losses
Net recovery of $250,000 in 1Q 2017
Originated portfolio past dues of 27 basis points
88% of all NPLs are energy, of which over
90% are
performing in accordance with contractual terms
While overall energy
industry trends are generally
stable to improving, risk in the portfolio remains
elevated, particularly with respect to E&P
Nonperforming Assets(1)
Net Charge Offs
6 (1) NPA% represents total nonperforming assets (NPAs) to total loans and
OREO and other NPAs
Cadence Bank, N.A. Member FDIC
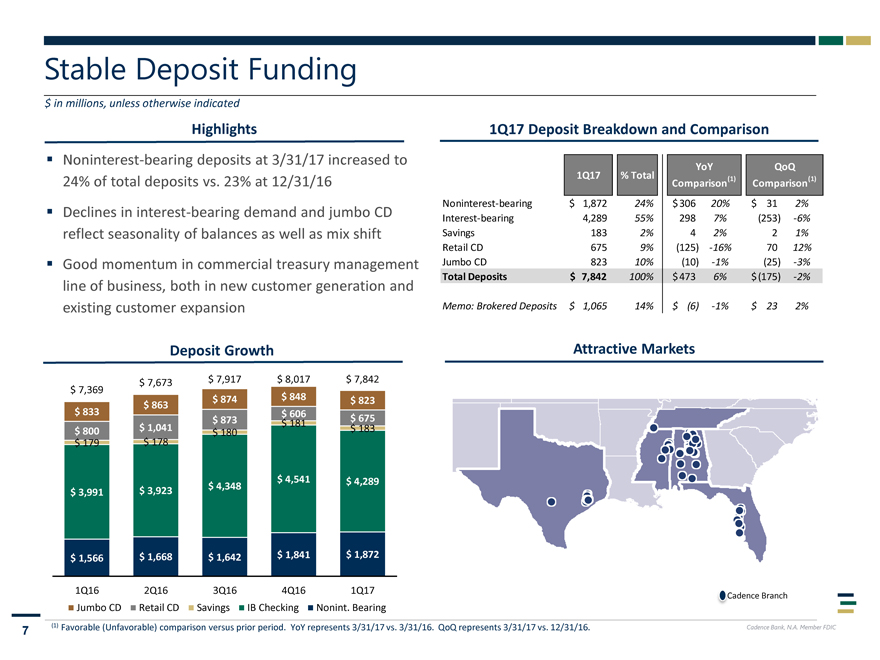
Stable Deposit Funding
$
in millions, unless otherwise indicated
Highlights
Noninterest-bearing
deposits at 3/31/17 increased to
24% of total deposits vs. 23% at 12/31/16
Declines in interest-bearing demand and jumbo CD
reflect seasonality of
balances as well as mix shift
Good momentum in commercial treasury management
line of business, both in new customer generation and
existing customer
expansion
Deposit Growth
1Q17 Deposit Breakdown and
Comparison
YoYQoQ
1Q17% Total(1)(1)
ComparisonComparison
Noninterest-bearing $1,87224%$ 30620%$312%
Interest-bearing 4,28955%2987%(253)-6%
Savings 1832%42%21%
Retail CD
6759%(125)-16%7012%
Jumbo CD 82310%(10)-1%(25)-3%
Total Deposits $7,842100%$ 4736%$(175)-2%
Memo:
Brokered Deposits $1,06514%$ (6)-1%$232%
Attractive Markets
$ 7,673 $ 7,917 $ 8,017 $ 7,842
$ 7,369
$ 863 $ 874 $ 848 $ 823
$ 833 $ 606
$ 873 $ 675
$ 181
$ 800 $ 1,041 $ 183
$ 180
$ 179 $ 178
$ 4,541
$ 4,289
$ 4,348
$ 3,991 $ 3,923
$ 1,566 $ 1,668 $ 1,642 $ 1,841 $ 1,872
1Q16 2Q16 3Q16 4Q16 1Q17
adence Branch
Jumbo CD Retail CD Savings IB Checking Nonint. Bearing
7 (1) Favorable (Unfavorable)
comparison versus prior period. YoY represents 3/31/17 vs. 3/31/16. QoQrepresents 3/31/17 vs. 12/31/16. Cadence Bank, N.A. Member FDIC
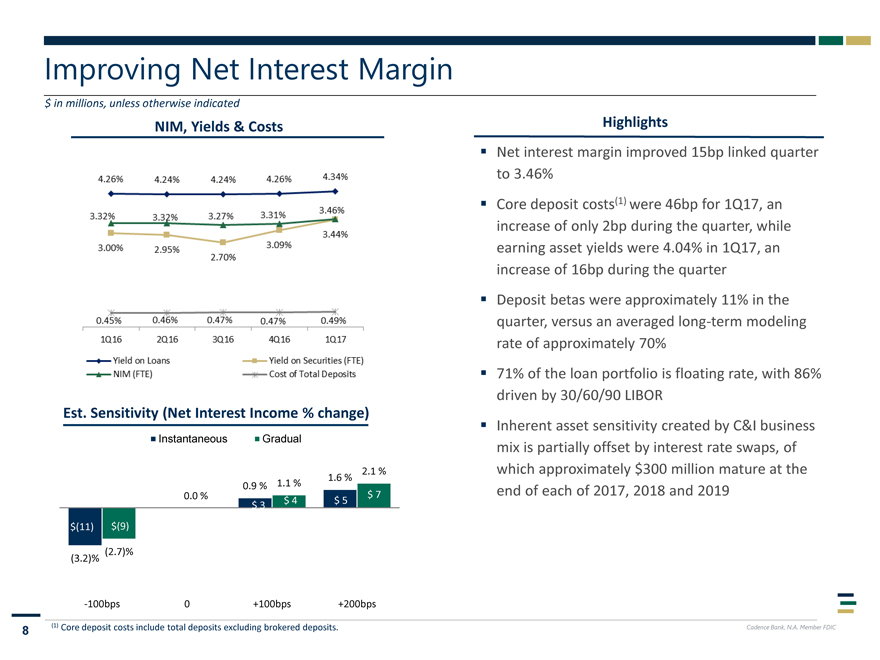
Improving Net Interest Margin
$ in millions, unless otherwise indicated
NIM, Yields & Costs
Est. Sensitivity (Net Interest Income % change)
Instantaneous Gradual
2.1 %
1.6 %
0.9 % 1.1 %
0.0 % $ 7
$ 3 $ 4$ 5
$(11) $(9)
(2.7)% $ 0
(3.2)%
Highlights
Net interest margin improved 15bp linked quarter
to 3.46%
Core deposit costs(1) were 46bp for 1Q17, an
increase of only 2bp during the quarter, while
earning asset yields were 4.04% in 1Q17, an
increase of 16bp during the quarter
Deposit betas were approximately 11% in
the
quarter, versus an averaged long-term modeling
rate of approximately 70%
71% of the loan portfolio is floating rate, with 86%
driven by 30/60/90 LIBOR
Inherent asset sensitivity created by C&I business
mix is partially
offset by interest rate swaps, of
which approximately $300 million mature at the
end of each of 2017, 2018 and 2019
-100bps 0 +100bps +200bps
8 (1) Core deposit costs include total deposits excluding brokered deposits. Cadence Bank, N.A. Member FDIC
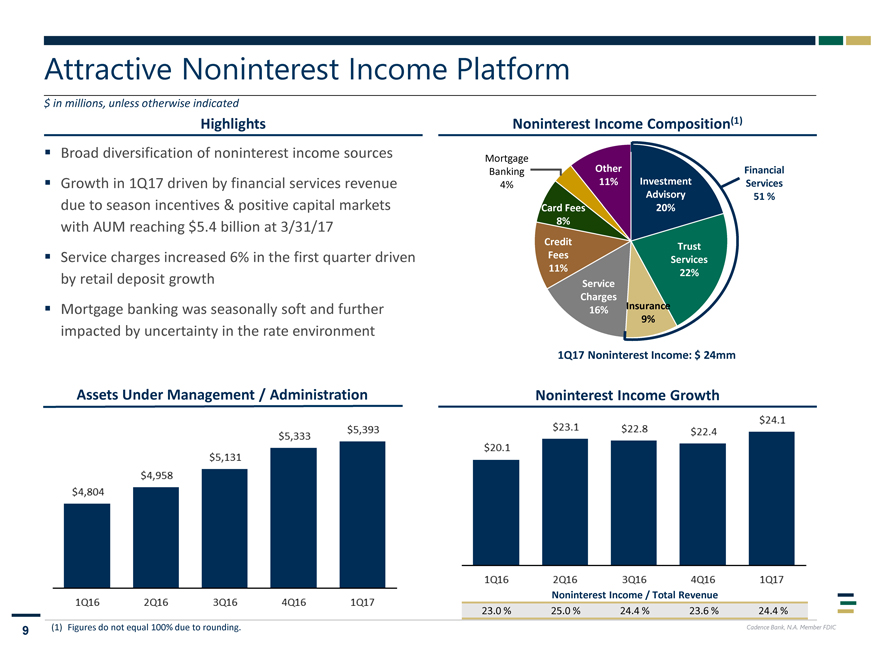
Attractive Noninterest Income Platform
$ in millions, unless otherwise indicated
Highlights
Noninterest Income Composition(1)
Broad diversification of noninterest income sources
Growth in 1Q17 driven by financial services revenue
due to season
incentives & positive capital markets
with AUM reaching $5.4 billion at 3/31/17
Service charges increased 6% in the first quarter driven
by retail deposit growth
Mortgage banking was seasonally soft and further
impacted by uncertainty in the rate
environment
Assets Under Management / Administration
Mortgage
Banking Other Financial
4% 11% Investment Services Advisory 51 %
Card Fees 20% 8%
Credit
Fees Trust
11% Services 22%
Service
Charges
Insurance
16%
9%
1Q17 Noninterest Income: $ 24mm
Noninterest Income Growth
NoninterestIncome / Total Revenue
23.0 % 25.0 % 24.4 % 23.6 % 24.4 %
9 (1) Figures do not equal 100%
due to rounding. Cadence Bank, N.A. Member FDIC
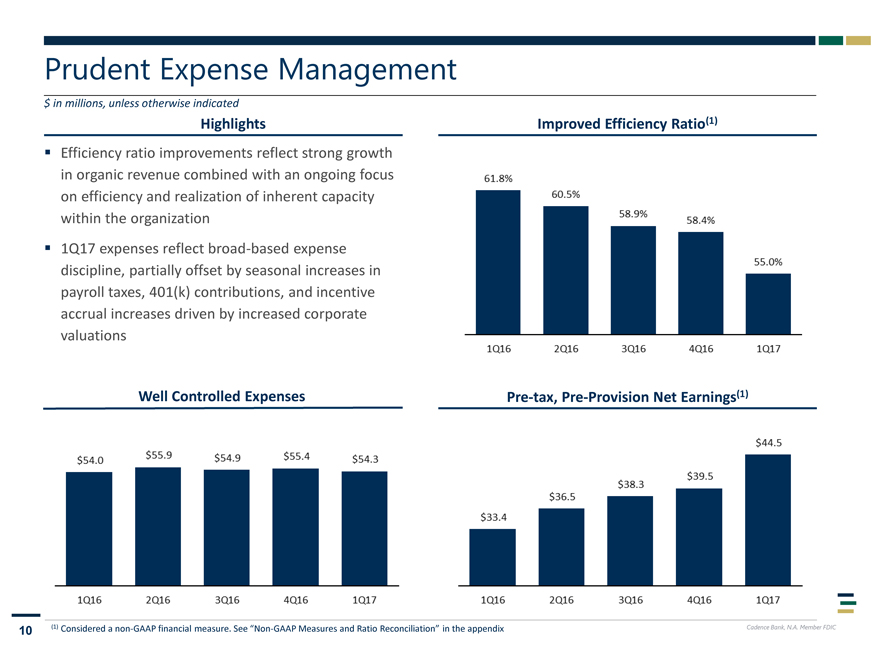
Prudent Expense Management
$ in millions, unless otherwise indicated
Highlights
Improved Efficiency Ratio(1)
Efficiency ratio improvements reflect strong growth
in organic revenue combined with an ongoing focus
on efficiency and realization of inherent
capacity
within the organization
1Q17 expenses reflect broad-based expense
discipline, partially offset by seasonal increases in
payroll taxes, 401(k)
contributions, and incentive
accrual increases driven by increased corporate
valuations
Well Controlled Expenses
Pre-tax, Pre-Provision Net Earnings(1)
10 (1) Considered a non-GAAP financial measure. See Non-GAAP Measures and Ratio Reconciliation in
the appendix
Cadence Bank, N.A. Member FDIC
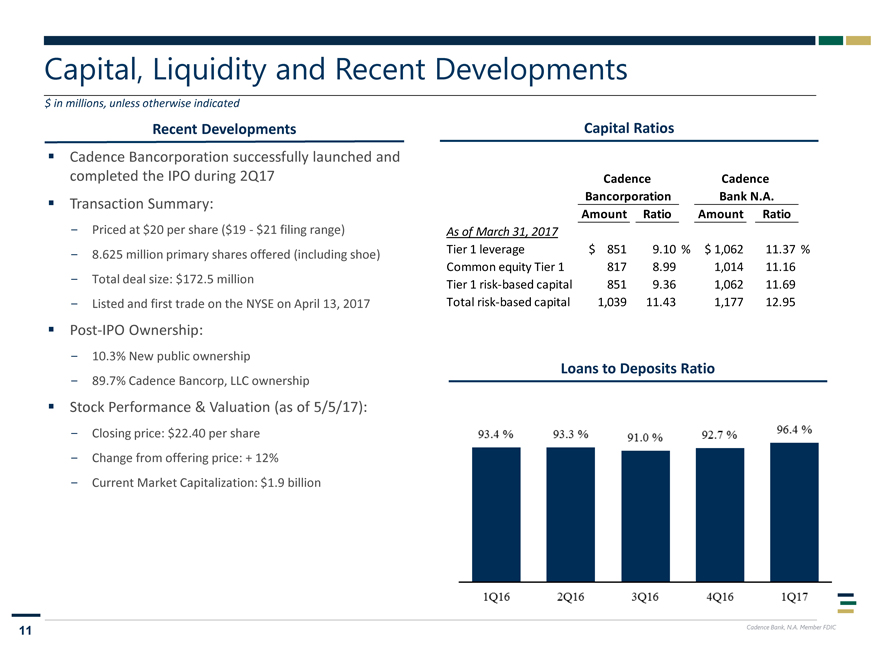
Capital, Liquidity and Recent Developments
$ in millions, unless otherwise indicated
Recent Developments
Cadence Bancorporation successfully launched and
completed the IPO during 2Q17
Transaction Summary:
Priced at $20 per share ($19—$21 filing range)
8.625 million primary shares offered (including shoe)
Total deal size:
$172.5 million
Listed and first trade on the NYSE on April 13, 2017
Post-IPO Ownership:
10.3% New public
ownership
89.7% Cadence Bancorp, LLC ownership
Stock Performance &
Valuation (as of 5/5/17):
Closing price: $22.40 per share
Change from
offering price: + 12%
Current Market Capitalization: $1.9 billion
Capital Ratios
Cadence Cadence
Bancorporation Bank N.A.
Amount RatioAmountRatio
As of March 31,
2017
Tier 1 leverage $ 851 9.10 %$ 1,06211.37 %
Common equity Tier 1 817 8.991,01411.16
Tier 1 risk-based
capital 851 9.361,06211.69
Total risk-based capital 1,039 11.431,17712.95
Loans to Deposits Ratio
11 Cadence Bank, N.A. Member FDIC
Appendix
Cadence Bank,
N.A. Member FDIC
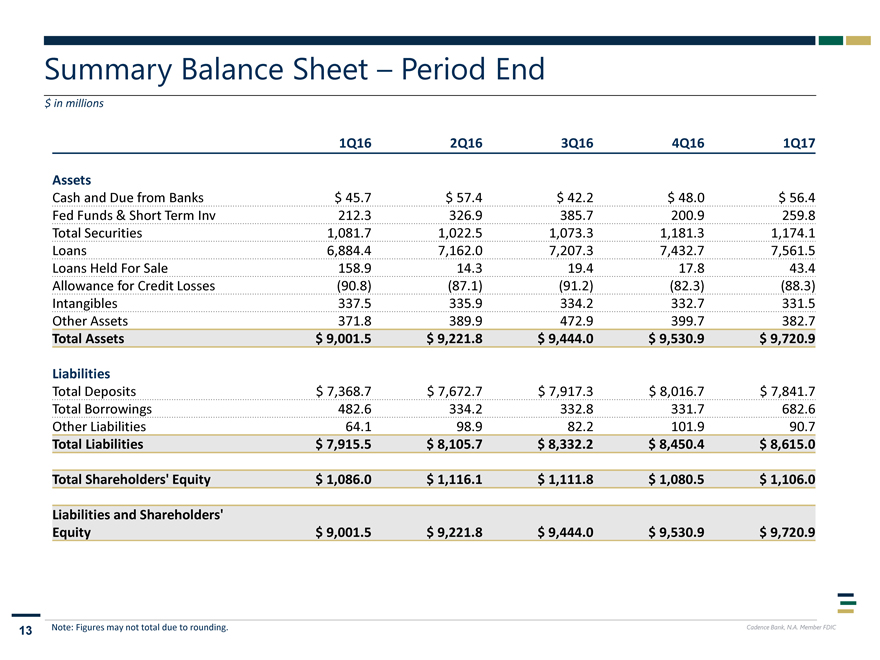
Summary Balance Sheet Period End
$ in millions
1Q16 2Q163Q164Q161Q17
Assets
Cash and Due from Banks $ 45.7 $ 57.4$
42.2$ 48.0$ 56.4
Fed Funds & Short Term Inv 212.3 326.9385.7200.9259.8
Total Securities 1,081.7 1,022.51,073.31,181.31,174.1
Loans 6,884.4 7,162.07,207.37,432.77,561.5
Loans Held
For Sale 158.9 14.319.417.843.4
Allowance for Credit Losses (90.8) (87.1)(91.2)(82.3)(88.3)
Intangibles 337.5 335.9334.2332.7331.5
Other
Assets 371.8 389.9472.9399.7382.7
Total Assets $ 9,001.5 $ 9,221.8$ 9,444.0$ 9,530.9$ 9,720.9
Liabilities
Total Deposits $ 7,368.7 $ 7,672.7$
7,917.3$ 8,016.7$ 7,841.7
Total Borrowings 482.6 334.2332.8331.7682.6
Other Liabilities 64.1 98.982.2101.990.7
Total
Liabilities $ 7,915.5 $ 8,105.7$ 8,332.2$ 8,450.4$ 8,615.0
Total Shareholders’ Equity $ 1,086.0 $ 1,116.1$
1,111.8$ 1,080.5$ 1,106.0
Liabilities and Shareholders’
Equity $ 9,001.5 $ 9,221.8$ 9,444.0$ 9,530.9$ 9,720.9
13 Note: Figures
may not total due to rounding.
Cadence Bank, N.A. Member FDIC
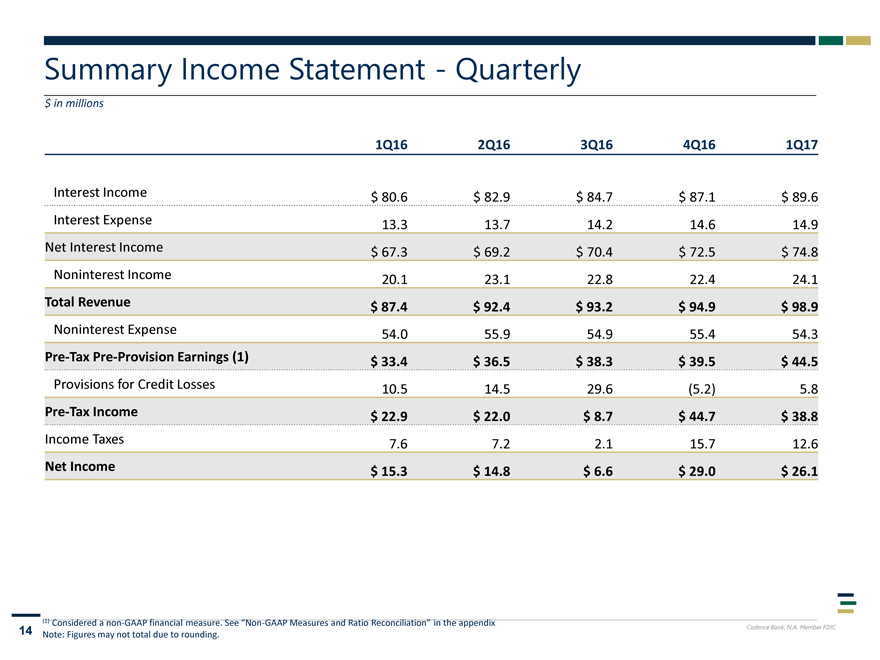
Summary Income Statement—Quarterly
$ in millions
1Q16 2Q16 3Q16 4Q16 1Q17
Interest Income $ 80.6 $ 82.9 $ 84.7 $ 87.1 $ 89.6 Interest Expense 13.3 13.7 14.2 14.6 14.9 Net Interest Income $ 67.3 $ 69.2 $ 70.4 $ 72.5 $ 74.8 Noninterest Income 20.1 23.1
22.8 22.4 24.1
Total Revenue $ 87.4 $ 92.4 $ 93.2 $ 94.9 $ 98.9
Noninterest
Expense 54.0 55.9 54.9 55.4 54.3
Pre-Tax Pre-Provision Earnings (1) $ 33.4 $ 36.5 $
38.3 $ 39.5 $ 44.5
Provisions for Credit Losses 10.5 14.5 29.6 (5.2) 5.8
Pre-Tax Income $ 22.9 $ 22.0 $ 8.7 $ 44.7 $ 38.8
Income Taxes 7.6 7.2 2.1 15.7 12.6
Net Income $ 15.3 $ 14.8 $ 6.6 $ 29.0 $ 26.1
(1) Considered a
non-GAAP financial measure. See Non-GAAP Measures and Ratio Reconciliation in the appendix
14 Note: Figures may not total due to rounding.
Cadence Bank, N.A. Member FDIC
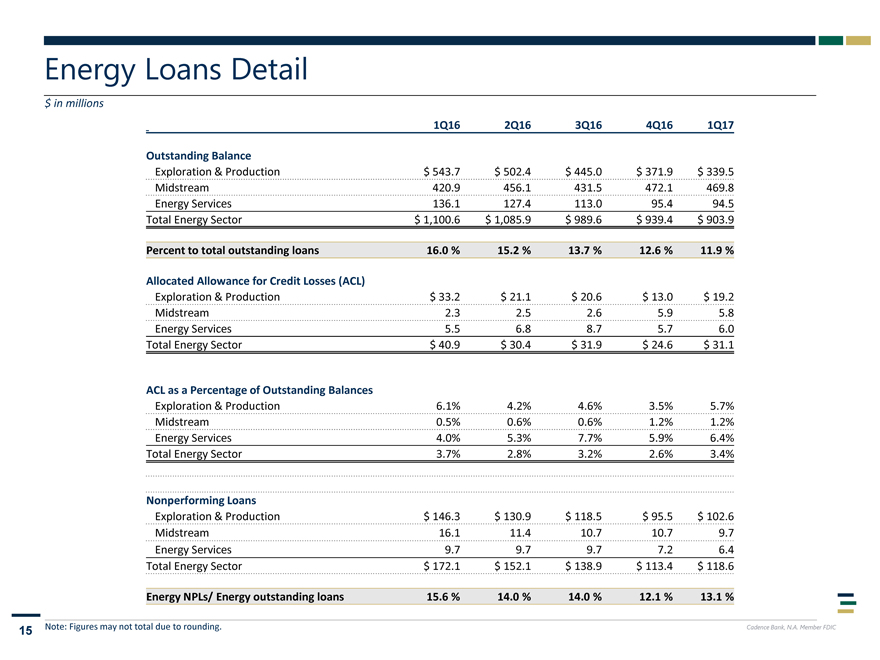
Energy Loans Detail
$ in
millions
1Q16 2Q16 3Q16 4Q16 1Q17
Outstanding Balance
Exploration & Production $ 543.7 $ 502.4 $ 445.0 $ 371.9 $ 339.5 Midstream 420.9 456.1 431.5 472.1 469.8 Energy Services 136.1 127.4 113.0 95.4 94.5 Total Energy Sector $
1,100.6 $ 1,085.9 $ 989.6 $ 939.4 $ 903.9
Percent to total outstanding loans 16.0 % 15.2 % 13.7 % 12.6 % 11.9 %
Allocated Allowance for Credit Losses (ACL)
Exploration & Production $ 33.2 $ 21.1 $
20.6 $ 13.0 $ 19.2 Midstream 2.3 2.5 2.6 5.9 5.8 Energy Services 5.5 6.8 8.7 5.7 6.0 Total Energy Sector $ 40.9 $ 30.4 $ 31.9 $ 24.6 $ 31.1
ACL as a Percentage of
Outstanding Balances
Exploration & Production 6.1% 4.2% 4.6% 3.5% 5.7% Midstream 0.5% 0.6% 0.6% 1.2% 1.2% Energy Services 4.0% 5.3% 7.7% 5.9% 6.4% Total
Energy Sector 3.7% 2.8% 3.2% 2.6% 3.4%
Nonperforming Loans
Exploration & Production $ 146.3 $ 130.9 $ 118.5 $ 95.5 $ 102.6 Midstream 16.1 11.4 10.7 10.7 9.7 Energy Services 9.7 9.7 9.7 7.2 6.4 Total Energy Sector
$ 172.1 $ 152.1 $ 138.9 $ 113.4 $ 118.6
Energy NPLs/ Energy outstanding loans 15.6 % 14.0 % 14.0 % 12.1 % 13.1 %
15 Note: Figures may not total due to rounding. Cadence Bank, N.A. Member FDIC
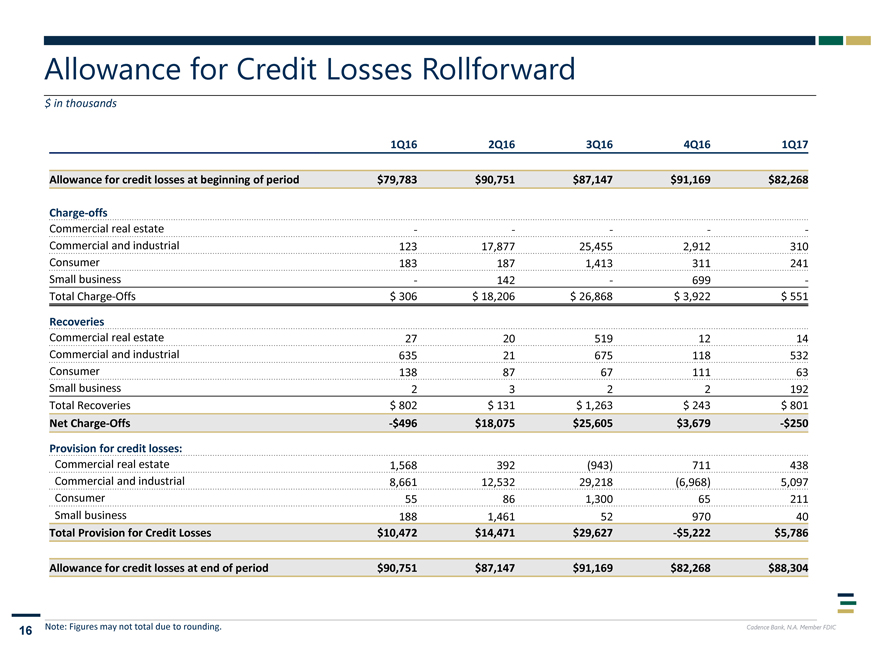
Allowance for Credit Losses Rollforward
$ in thousands
1Q16 2Q16 3Q16 4Q16 1Q17
Allowance for credit losses at beginning of period $79,783 $90,751 $87,147 $91,169 $82,268
Charge-offs
Commercial real estate — — -Commercial and industrial
123 17,877 25,455 2,912 310 Consumer 183 187 1,413 311 241 Small business—142—699 -Total Charge-Offs $ 306 $ 18,206 $ 26,868 $ 3,922 $ 551
Recoveries
Commercial real estate 27 20 519 12 14 Commercial and industrial 635 21 675 118 532 Consumer 138 87 67 111 63 Small business 2 3 2 2 192 Total Recoveries $ 802 $
131 $ 1,263 $ 243 $ 801
Net Charge-Offs -$496 $18,075 $25,605 $3,679 -$250
Provision for credit losses:
Commercial real estate 1,568 392 (943) 711 438
Commercial and industrial 8,661 12,532 29,218 (6,968) 5,097 Consumer 55 86 1,300 65 211 Small business 188 1,461 52 970 40
Total Provision for Credit Losses
$10,472 $14,471 $29,627 -$5,222 $5,786
Allowance for credit losses at end of period $90,751 $87,147 $91,169 $82,268 $88,304
16 Note: Figures may not total due to rounding.
Cadence Bank, N.A. Member FDIC
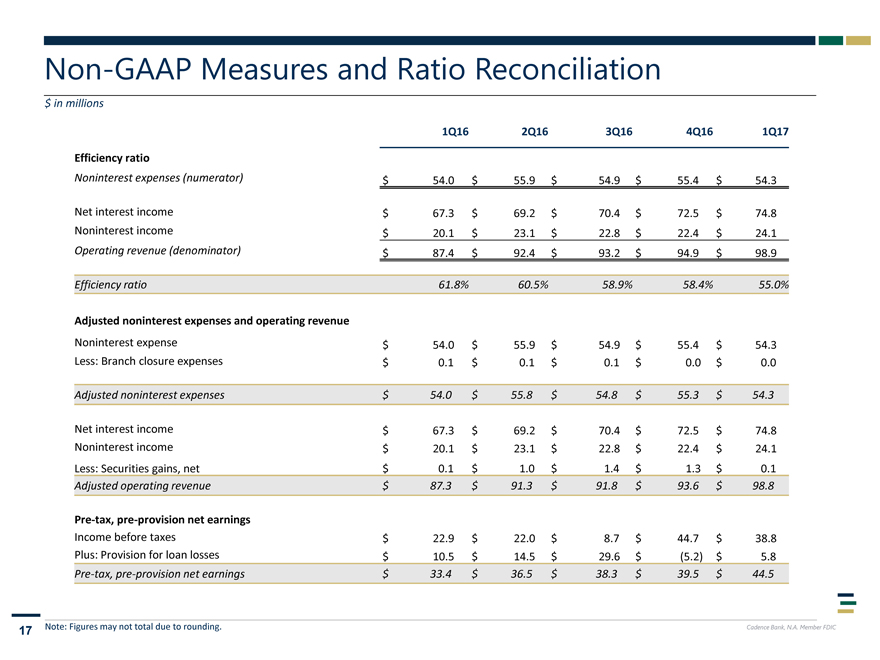
Non-GAAP Measures and Ratio Reconciliation
$ in millions
1Q16 2Q16 3Q16 4Q16 1Q17
Efficiency ratio
Noninterest expenses (numerator) $ 54.0 $ 55.9
$ 54.9 $ 55.4 $ 54.3
Net interest income $ 67.3 $ 69.2 $ 70.4
$ 72.5 $ 74.8 Noninterest income $ 20.1 $ 23.1 $ 22.8 $ 22.4 $ 24.1 Operating revenue (denominator) $ 87.4 $ 92.4
$ 93.2 $ 94.9 $ 98.9
Efficiency ratio 61.8% 60.5% 58.9% 58.4% 55.0%
Adjusted noninterest expenses and operating revenue
Noninterest expense $ 54.0
$ 55.9 $ 54.9 $ 55.4 $ 54.3 Less: Branch closure expenses $ 0.1 $ 0.1 $ 0.1 $ 0.0 $ 0.0
Adjusted noninterest expenses $ 54.0 $ 55.8 $ 54.8 $ 55.3 $ 54.3
Net interest income $67.3 $ 69.2 $ 70.4 $ 72.5 $74.8 Noninterest income $ 20.1 $ 23.1 $ 22.8 $ 22.4 $ 24.1
Less: Securities gains, net $0.1 $ 1.0 $ 1.4 $1.3 $0.1
Adjusted operating revenue $ 87.3 $ 91.3 $ 91.8 $ 93.6
$ 98.8
Pre-tax, pre-provision net earnings
Income before taxes $ 22.9 $ 22.0 $ 8.7 $ 44.7 $ 38.8 Plus: Provision for loan losses $ 10.5
$ 14.5 $ 29.6 $ (5.2) $ 5.8
Pre-tax,
pre-provision net earnings $ 33.4 $ 36.5 $ 38.3 $ 39.5 $ 44.5
17 Note: Figures may not total due to rounding.
Cadence Bank, N.A. Member FDIC
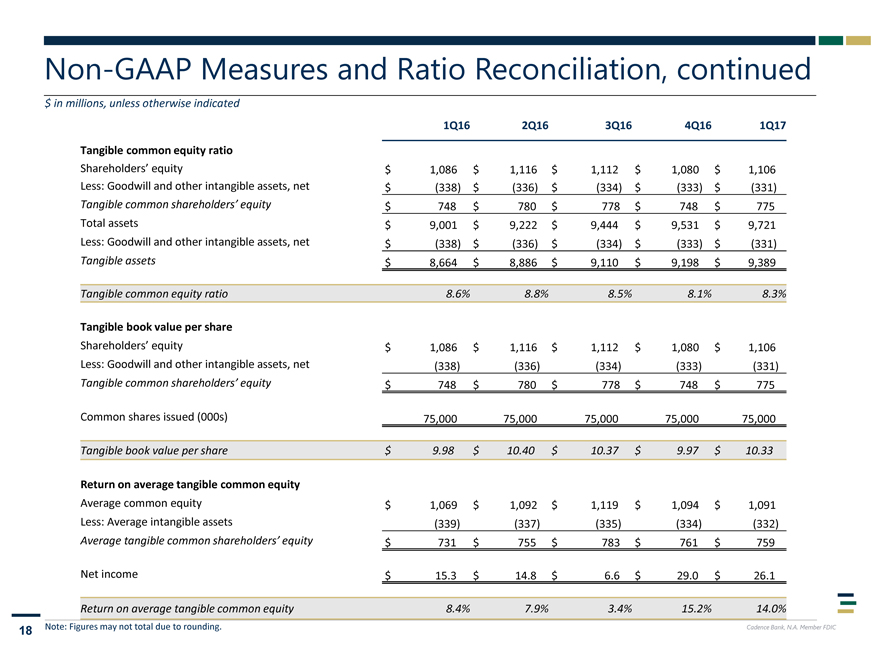
Non-GAAP Measures and Ratio Reconciliation, continued
$ in millions, unless otherwise indicated
1Q16 2Q16 3Q16 4Q16 1Q17
Tangible common equity ratio
Shareholders’ equity $ 1,086 $ 1,116
$ 1,112 $ 1,080 $ 1,106 Less: Goodwill and other intangible assets, net $ (338) $ (336) $ (334) $ (333) $ (331) Tangible common shareholders’ equity
$ 748 $ 780 $ 778 $ 748 $ 775 Total assets $ 9,001 $ 9,222 $ 9,444 $ 9,531 $ 9,721 Less: Goodwill and other intangible assets, net $ (338) $ (336) $ (334)
$ (333) $ (331) Tangible assets $ 8,664 $ 8,886 $ 9,110 $ 9,198 $ 9,389
Tangible common equity ratio 8.6% 8.8% 8.5% 8.1% 8.3%
Tangible book value per
share
Shareholders’ equity $ 1,086 $ 1,116 $ 1,112 $ 1,080 $ 1,106 Less: Goodwill and other intangible assets,
net (338) (336) (334) (333) (331) Tangible common shareholders’ equity $ 748 $ 780 $ 778 $ 748 $ 775
Common
shares issued (000s) 75,000 75,000 75,000 75,000 75,000
Tangible book value per share $ 9.98 $ 10.40 $ 10.37 $ 9.97
$ 10.33
Return on average tangible common equity
Average common equity $ 1,069 $ 1,092 $ 1,119 $ 1,094 $ 1,091 Less: Average intangible assets (339) (337) (335) (334)
(332)
Average tangible common shareholders’ equity $ 731 $ 755 $ 783 $ 761 $ 759
Net income $ 15.3 $ 14.8 $ 6.6 $ 29.0 $ 26.1
Return on average tangible common equity 8.4% 7.9% 3.4% 15.2% 14.0%
18 Note: Figures may not
total due to rounding. Cadence Bank, N.A. Member FDIC