Attached files
| file | filename |
|---|---|
| EX-99.2 - EX-99.2 - CDK Global, Inc. | d360338dex992.htm |
| 8-K - 8-K - CDK Global, Inc. | d360338d8k.htm |
Exhibit 99.1
Our Company
We are a leading global provider of integrated information technology and digital marketing solutions to the automotive retail and adjacent industries. Focused on evolving the automotive retail experience, we provide solutions to dealers in more than 100 countries around the world, covering approximately 28,000 retail locations and most original equipment manufacturers (“OEMs”). We have over 40 years of history providing innovative solutions to automotive retailers and OEMs to better manage, analyze, and grow their businesses. Our solutions automate and integrate all parts of the buying process from targeted digital advertising and marketing campaigns to the sale, financing, insuring, parts supply, repair, and maintenance of vehicles. We believe the breadth of our integrated solutions allows us to more comprehensively address the varied needs of automotive retailers than any other single competitor in our industry.
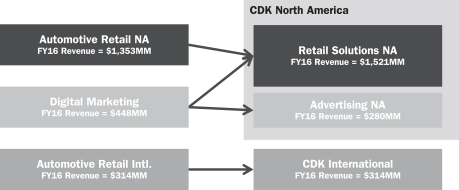
Effective July 1, 2016, we completed a comprehensive plan to streamline our organization that will enable us to deliver an improved customer experience, create significant efficiencies, and better align us to implement our business transformation plan described below. The organizational changes included integrating product management, combining the Digital Marketing and Automotive Retail North America operations into a single organization, creating a single North America sales organization, and forming a global research and development organization.
The Company reorganized into two main operating groups. In connection with this reorganization, our operating segments have changed. Our first operating group is CDK North America which is comprised of two reportable segments, Retail Solutions North America and Advertising North America. The second operating group, which is also a reportable segment, is CDK International.
Below is a graphic representation of CDK Global’s comprehensive reorganization.
1
Our History and Our Spin-off from ADP
We were the Dealer Services business of Automatic Data Processing, Inc. (“ADP”). In 1972, Dealer Services became ADP’s third major business unit, offering accounting, service, management, and inventory processing services to automotive retailers. We have since expanded our role in the industry to encompass the full automotive retail value chain by developing integrated Dealer Management Systems (“DMSs”) and other solutions that help retailers manage and grow their businesses. In 2005, we expanded our international footprint through our acquisition of Kerridge Computer Company Limited (“Kerridge”), which provided us with a multi-country DMS platform in Europe, the Middle East, Asia, Africa, and Latin America and has become the basis for our international business. In 2010, we acquired Cobalt Holding Company (“Cobalt”), a leading provider of automotive digital marketing solutions, which has enabled us to solidify and expand our digital marketing capabilities.
On April 9, 2014, the board of directors of ADP approved the spin-off of the Dealer Services business. On September 30, 2014, the spin-off became effective and ADP distributed 100% of the common stock of the Company to the holders of record of ADP’s common stock as of September 24, 2014 (the “spin-off”).
Operating Segments
Retail Solutions North America
Through our Retail Solutions North America segment, we provide technology-based solutions, including automotive website platforms, that help automotive retailers, OEMs, and other industry participants manage the acquisition, sale, financing, insuring, parts supply, and repair and maintenance of vehicles. Our solutions help our customers streamline their operations, better target and serve their customers, and enhance the financial performance of their retail operations. In addition to providing solutions to retailers and manufacturers of automobiles, we also provide solutions to retailers and manufacturers of heavy trucks, construction equipment, agricultural equipment, motorcycles, boats, and other marine and recreational vehicles.
Advertising North America
Through our Advertising North America segment, we provide advertising solutions, including management of digital advertising spend, for OEMs and automotive retailers. These solutions provide a coordinated offering across multiple marketing channels to help achieve customer marketing and sales objectives and coordinate execution between OEMs and their retailer networks.
CDK International
Through our CDK International segment, we provide technology-based solutions similar to the retail solutions provided in our Retail Solutions North America segment in approximately 100 countries outside of the United States and Canada. The solutions that we provide within this segment allow our customers to streamline their business operations and enhance their financial performance within their local marketplace, and in some cases where we deal directly with OEMs, across international borders. Customers of this segment include automotive retail dealers and OEMs across Europe, the Middle East, Asia, Africa, and Latin America.
Our consolidated revenues were $2,115 million for the fiscal year ended June 30, 2016, compared to total revenues of $2,064 million for the fiscal year ended June 30, 2015. Net earnings attributable to CDK were $239 million for the fiscal year ended June 30, 2016, compared to net earnings attributable to CDK of $178 million for the fiscal year ended June 30, 2015. Adjusted EBITDA was $562 million for the fiscal year ended June 30, 2016 compared to adjusted EBITDA of $462 million for the fiscal year ended June 30, 2015.
2
The charts below depict our revenue split by geography and by segment for fiscal year ended June 30, 2016.
| Revenues by Geography: | Revenues by Segment: | |
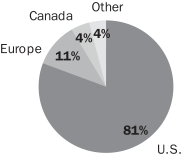
|
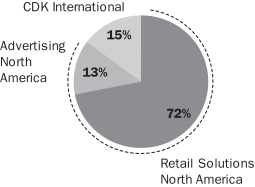
|
Our Market Opportunity
We believe that the following key trends in the automotive retail industry present us with significant business opportunities.
Growing Automotive Sales in North America
North American (United States and Canada) new vehicle sales in 2017 are expected to return to pre-recessionary volumes of 19.3 million annually (after declining to a low of 11.9 million in 2009), according to IHS. We believe that the global economic downturn has created a healthier, right-sized retail structure that benefits both automotive retailers and OEMs. We believe that increased profitability will enable retailers to invest in their businesses and supports the expansion of the information technology and marketing/advertising markets. We believe that there will be continued unit growth in North America due to an aging vehicle population, increased demand for new vehicles by consumers, a better consumer credit environment and the planned introduction of new vehicle models by OEMs.
Significant Growth in Emerging Market Countries
Emerging market countries continue to experience significant growth. For example, new vehicle sales in China in 2017 are expected to be approximately 1% higher than in 2016, according to IHS. New vehicle sales volume in China has eclipsed that of the United States and Japan combined, with 28 million new vehicles sold in China in 2016. New vehicle sales volume in China is anticipated to grow to approximately 30 million in 2020. As a result, many OEMs continue to invest in China in order to gain access to a sizable and growing pool of vehicle buyers. Because automotive retailers in many emerging market countries have not historically invested in their technology solutions, we believe there is an opportunity for us to help retailers in China and other emerging market countries streamline their businesses and more effectively reach their target customers.
Migration to Retail Workflow-Based Solutions
Automotive retailers understand the power of technology to drive every aspect of their business and increasingly demand sophisticated solutions that allow them to manage their entire workflow to drive efficiency, target customers and improve the automotive retail experience. Likewise, consumers increasingly expect a
3
simple, smooth, technologically enabled sales process. Technology-enabled workflow-based solutions can help retailers deliver on this expectation and integrate the consumer’s journey from the web to the in-store retail transaction while utilizing mobile and social media technologies.
Growing Adoption of Data-Based Analytics
We believe that the use of integrated technology solutions across the automotive retail value chain creates a significant opportunity for the pervasive use of data and sophisticated analytics. The ability to provide real-time data analytics, insight and predictive modeling presents a significant business opportunity, as automotive retailers are expected to desire these actionable insights in order to make rapid, informed and effective decisions to win in a competitive marketplace.
Accelerating Shift to Digital Marketing
As with overall advertising spend, automotive advertising is increasingly focused on digital media. According to a 2015 Car Buyer Journey study by Autotrader and IHS, 88% of vehicle buyers now use the internet before purchasing a vehicle. According to a 2016 National Automobile Dealers Association Annual Financial Profile of America’s Franchised New Car Dealerships, automotive retailers allocated 34% of their advertising spend to digital media. The automotive retail industry’s allocation of advertising spend to digital media continues to lag behind consumer shopping behavior and preferences. We expect the share of digital automotive advertising spend to shift to reflect the corresponding share of consumer behavior over time, representing significant future growth potential in digital automotive advertising. By 2020, eMarketer forecasts that annual U.S. digital automotive advertising spend will reach $14.1 billion, representing a 13.7% CAGR from 2014 spend.
Our Competitive Strengths
We believe the following attributes differentiate us from our competitors and have enabled us to become the largest information technology and digital marketing/advertising solutions provider to the automotive retail industry.
Breadth of Integrated Solutions
We offer a broad suite of solutions that enable our automotive retail clients to address technology needs through our offerings to optimize workflows and provide advertising solutions to enhance online presence. We believe the breadth of our integrated automotive retail solutions enables us to function as a strategic partner for our clients globally and allows us to more comprehensively address the varied needs of automotive retailers than any other single competitor in the automotive retail industry. Our product portfolio of software, applications and powerful ancillary services provides integrated solutions across the entire automotive retail value chain. Because of the difficulty in integrating solutions across multiple providers, our ability to provide the broadest solution set is a meaningful differentiator for our clients. Furthermore, our individual offerings are increasingly integrated, improving value for our clients when they purchase multiple solutions from us while increasing overall retention rates.
Innovative, Intuitive and Scalable Technology
Our solutions have been built through decades of focused research, development and investment. These offerings are generally supported by a flexible, secure and scalable infrastructure, and our team of over 1,600 engineers and data scientists is dedicated to developing and enhancing our offerings. In addition, we have augmented many of our offerings by utilizing big data-driven predictive analytics to yield incremental return on investment and a differentiated, optimized client experience for both automotive retailers and OEMs.
4
Our innovative solutions aim to improve the efficiency of the retailer and redefine the way consumers experience automotive retail. For the retailer, our solutions increase the efficiency of workflows, reducing the labor time dedicated to each transaction and improving their sales force effectiveness. For the consumer, we can enhance the purchase process by substantially reducing the number of steps and the wait times throughout the process. In addition, we offer an integrated online, mobile, social and physical experience to meet the evolving demands of consumers. We have invested in dedicated user experience and user interface teams that focus on ensuring that our solutions deliver an intuitive user experience that meaningfully differentiates us from our competitors. Intuitive solutions are easy to use, with low learning curves, reducing training requirements and resulting in a cost effective and efficient solution.
Our business generally utilizes agile product development methodologies to deliver new technology. We are focused on the use of multi-tenant Software-as-a-Service (“SaaS”) and mobile-centric solutions that are highly functional, flexible and fast. With these SaaS and mobile-centric solutions, our clients benefit by moving beyond the limitations associated with traditional on-premises software to highly configurable software solutions that are accessed over the internet. This shift substantially reduces the need for our clients to buy and support a broad range of IT infrastructure, which results in lower total cost of ownership, increased ease of deployment and adoption and improved return on investment. More importantly, this helps to ensure that our solutions are inherently scalable and more readily adapted to the evolving needs of our client base.
Leading Position with Global Capabilities and Local Industry Expertise
We are the largest global provider, both in terms of revenue and geographic reach, of integrated information technology and digital marketing/advertising solutions to the automotive retail industry, with business relationships with automotive retailers and OEMs in over 100 countries with 28,000 DMS client sites and 6,800 Digital Marketing client locations. In the United States, we are the largest provider of Retail Automotive DMS solutions with approximately 40% market share. As a top innovator in the industry across a full suite of solutions, we continue to win new clients around the world in our CDK North America and CDK International businesses and, in the United States, in our Advertising North America business. Our robust technology platforms enable us to take advantage of our scale to more effectively integrate and deliver technology-based solutions that enhance commercial performance on a global basis. As a result, we believe we are uniquely positioned to partner with OEMs on global initiatives and to provide integration across countries while supplying local retail value chain expertise. In addition, we believe that our geographic diversity helps reduce our exposure to business cycles, individual market disruptions and other risks.
Strong Client Relationships with Automotive OEMs and Retail Groups
We have client relationships with some of the largest OEMs in the world and their associated franchised retail networks, which we believe reflect the strength of our solutions and our global scale. We maintain long-standing relationships and high renewal rates with our clients due to the value of the services and solutions we provide. Our clients include 7 of the top 10 largest and 83 of the top 100 largest automotive retailer groups in the United States by total new vehicle sales units. The ability to serve about 28,000 retail locations worldwide creates significant opportunity to expand the scope of our solutions we provide to clients.
The trend of dealership consolidation in the United States has been a tailwind for us as we have relationships with most of the larger dealership groups. So, even though the overall dealership roofs in the United States have remained generally flat, we have been able to pick up additional sites as smaller groups have been consolidated by our clients. We have also leveraged the relationships and execution for our clients to increase our attach rates for additional applications and Customer Relationship Management (“CRM”) solutions.
5
Attractive and Resilient Business Model with a Proven Track Record and Highly Recurring Revenues
We provide highly innovative and mission critical Enterprise Resource Planning (“ERP”) and advertising optimization solutions for customers resulting in low attrition rates and deep, long-standing client relationships. We believe our business model is highly attractive due to the scalability of our solutions, the recurring nature of our revenue, strong operating margins, low capital intensity and high free cash flow conversion. Our global infrastructure and automotive retail focus enables us to provide large-scale technology and service solutions to clients rapidly and cost-effectively. We maintain multi-year contracts with high renewal rates with our customers, resulting in approximately 70% of revenues being generated on a recurring basis. In 2016, we renewed a record of 670 North American dealers, representing approximately 20% of our automotive DMS sites and 10% of all automotive and heavy truck DMS sites. Our recurring revenues have historically been highly resilient, even during cyclical downturns in the automotive industry. For example, during the global economic downturn, our North America revenue (excluding acquisitions) declined by just 4% between fiscal year 2009 and fiscal year 2010, while U.S. car sales volumes declined 20% from calendar year 2008 to 2009 and the entire automotive retail industry experienced a significant decline in profitability. We believe that our significant recurring revenues, combined with our leading market position and new offerings, will continue to contribute to our long-term growth.
Deep and Experienced Management Team
We are led by a talented and experienced global senior management team that has successfully grown our business both organically and through a series of strategic acquisitions and alliances, including the acquisition of Cobalt, which led to our leadership position in digital marketing. The members of our senior management team have a deep understanding of the unique dynamics of the automotive retail industry.
Our Business Strategy
We intend to leverage our broad portfolio, client relationships and industry expertise through various growth initiatives. The key elements of our growth strategy are highlighted below.
Continue to Expand Our Client Base
We have a diversified base of about 28,000 retail locations in over 100 countries. With our acquisition of Cobalt in 2010, we expanded our client value proposition and now address a broader opportunity with sophisticated digital marketing solutions. Through the combination of our leading technology platforms and deep industry expertise, we have built growth platforms that position us to be a more complete partner to our clients and allow us to offer flexible solutions designed to appeal to all retailers. Key elements of this strategy include:
Expand North American Automotive Retailer and OEM Client Base.
In North America, we currently have relationships with approximately 7,350 out of 18,500 franchised automotive retail locations. We believe that there is a substantial opportunity to further penetrate the North American retailer base through network-wide solutions purchased or sponsored by OEMs and through direct sales to automotive retailers. OEMs and automotive retailers are seeking to deliver an efficient and differentiated automotive retail experience that delivers on their brand promise. We intend to leverage our direct channel of over 500 sales professionals, over 1,200 solution delivery experts and over 2,000 client support specialists to take advantage of this opportunity.
6
Expand International OEM Client Base and Achieve Increased Share of Associated Automotive Retailers.
In the international arena, particularly in emerging market countries, OEMs typically have a stronger influence on the retail channel than in North America. As a result, we intend to partner with OEMs, financing partners and other industry participants to deliver OEM-branded or approved solutions and drive adoption of our solutions across those OEMs’ automotive retail networks. As an industry leader, we believe our existing relationships with OEMs provide a powerful platform to help increase our client base internationally.
Deepen Our Relationship with our Existing Client Base
We intend to utilize our broad portfolio of automotive capabilities to deepen our relationships with our existing client base by addressing more of their needs. We are focused on creating deep client relationships and believe that when satisfied clients view us as a strategic partner across the entire automotive retail value chain, they buy more of our solutions. We believe that our growth in average revenue per client location over the last three fiscal years ended June 30, 2016 reflects both the success of our growing solutions portfolio and our commitment to high levels of client satisfaction.
We also believe that our Digital Marketing solutions complement our Automotive Retail solutions and that this presents an additional opportunity to deepen our relationships with our existing Automotive Retail client base. A significant number of our Automotive Retail clients do not use our Digital Marketing solutions, and vice versa. A large cross-selling opportunity exists across the two client bases for our integrated solutions. Through layered application penetration, as we gain a new client we have the opportunity to add additional products and services onto the core. Our applications specific for service area, applications specific for managing inventory, and CRM solutions provide integrated phone solutions that we can offer dealers.
Strengthen and Extend Our Solutions Portfolio
By leveraging our technology platform, industry knowledge and client relationships, we seek to enhance our existing solutions and develop additional solutions that address evolving client demands and provide additional cross-selling opportunities. We will seek to further augment the integration capabilities of our existing solution set, which we believe will further reduce the cost of ownership and increase return on investment for our clients. We will also continue to focus on innovation and delivering solutions that service the unmet needs of the industry. For example, within our Automotive Retail solution set, we engineered our Vehicle Sales solution suite with highly optimized workflow built on a common platform of shared services to help ensure the accuracy of data, simplify the user experience and increase utilization, while at the same time reducing end user training and support needs. In our Digital Marketing business, we are focused on evolving our technology platforms to deliver fully personalized consumer experiences with high conversion to sales results.
We intend to continue investing in our data science capabilities to provide big data-driven predictive analytics and generate actionable insights through all levels of the automotive retail value chain. We believe this area represents a substantial opportunity as our clients require increased differentiation to compete effectively within the global automotive marketplace, and we believe that with our broad reach and deep industry expertise we are well-positioned to provide these data science and predictive technologies.
Selectively Pursue Strategic Acquisitions
We have and expect to continue to acquire assets and businesses that strengthen our value proposition to clients. We have developed internal capabilities to source, evaluate and integrate acquisitions and key partnerships. Since 2000, we have completed 33 acquisitions. These have ranged from acquisitions of small
7
start-up companies that provide a discrete application to a handful of customers, to acquisitions of substantial companies with more mature solutions and a larger customer base, such as our acquisition of Kerridge in 2005, which facilitated our international expansion, and our acquisition of Cobalt in 2010, which is the foundation of our digital marketing and digital advertising business. As part of our ongoing business strategy to expand solutions offerings, acquire new technologies, and strengthen our value proposition to customers, we intend to continue to seek acquisitions and strategic partnerships that provide attractive growth opportunities for our portfolio.
Retail Solutions North America Segment
The table below presents the reconciliation of revenues to constant currency adjusted revenues and earnings before income taxes to constant currency adjusted earnings before income taxes for the Retail Solutions North America segment.
| Years Ended June 30, |
Change |
|||||||||||||||
| 2016 |
2015 |
$ |
% |
|||||||||||||
| Revenues |
$ | 1,521.3 | $ | 1,501.2 | $ | 20.1 | 1 | % | ||||||||
| Internet sales leads revenues |
— | (46.2 | ) | 46.2 | ||||||||||||
|
|
|
|
|
|
|
|||||||||||
| Adjusted revenues |
$ | 1,521.3 | $ | 1,455.0 | $ | 66.3 | 5 | % | ||||||||
| Impact of exchange rates |
13.1 | — | 13.1 | |||||||||||||
|
|
|
|
|
|
|
|||||||||||
| Constant currency adjusted revenues |
$ | 1,534.4 | $ | 1,455.0 | $ | 79.4 | 5 | % | ||||||||
| Earnings before income taxes |
$ | 481.3 | $ | 411.4 | $ | 69.9 | 17 | % | ||||||||
| Margin % |
31.6 | % | 27.4 | % | ||||||||||||
| Stand-alone public company costs |
— | (2.1 | ) | 2.1 | ||||||||||||
| Accelerated trademark amortization |
— | 5.5 | (5.5 | ) | ||||||||||||
| Internet sales leads earnings |
— | (2.5 | ) | 2.5 | ||||||||||||
|
|
|
|
|
|
|
|||||||||||
| Adjusted earnings before income taxes |
$ | 481.3 | $ | 412.3 | $ | 69.0 | 17 | % | ||||||||
| Adjusted margin % |
31.6 | % | 28.3 | % | ||||||||||||
| Impact of exchange rates |
5.4 | — | 5.4 | |||||||||||||
|
|
|
|
|
|
|
|||||||||||
| Constant currency adjusted earnings before income taxes |
$ | 486.7 | $ | 412.3 | $ | 74.4 | 18 | % | ||||||||
The table below presents revenue by type for the Retail Solutions North America segment:
| Years Ended June 30, |
Change |
|||||||||||||||
| 2016 |
2015 |
$ |
% |
|||||||||||||
| Subscription revenue |
$ | 1,191.2 | $ | 1,124.7 | $ | 66.5 | 6 | % | ||||||||
| Transaction revenue |
179.1 | 204.3 | (25.2 | ) | (12 | )% | ||||||||||
| Other revenue |
151.0 | 172.2 | (21.2 | ) | (12 | )% | ||||||||||
|
|
|
|
|
|
|
|||||||||||
| Total |
$ | 1,521.3 | $ | 1,501.2 | $ | 20.1 | 1 | % | ||||||||
Revenues. Retail Solutions North America revenues for fiscal 2016 increased $20.1 million as compared to fiscal 2015. Retail Solutions North America revenues were unfavorably impacted by the strength of the U.S. dollar against the Canadian dollar on a constant currency basis, which contributed to a decrease of $13.1 million. In addition, Retail Solutions North America revenues were unfavorably impacted by the internet sales leads business, which was sold on May 21, 2015, and contributed $46.2 million in revenues during fiscal 2015. The internet sales leads business contributed to a decrease in revenues of approximately 4 percentage points.
Subscription revenues grew due to an increase in average revenue per DMS customer site of 5% , which resulted from a combination of increased sales of new or expanded solutions to our existing customer base and pricing. Additionally, DMS customer site count as of June 30, 2016 was 14,533 sites compared to 14,219 sites as of June 30, 2015, an increase of approximately 2%. This was partially offset by a reduction in the number of websites. On a combined basis, the increase in DMS customer sites and average revenue per DMS customer site contributed $66.5 million of revenue growth that includes an unfavorable currency impact of $11.8 million. Transaction revenues contributed a decrease in revenues of $25.2 million primarily due to the sale of the internet sales leads business. Without the impact of the internet sales leads business, transaction revenues grew $21.0 million due to vehicle registrations, which include the effect of revenues contributed by the AVRS acquisition. Other revenue items contributed a decrease in revenues of $21.2 million that includes an unfavorable currency impact of $1.3 million primarily due to a reduction in hardware sales.
8
Acquisitions contributed approximately 2 percentage points of adjusted Retail Solutions North America revenue growth.
Earnings before Income Taxes. Retail Solutions North America earnings before income taxes for fiscal 2016 increased $69.9 million as compared to fiscal 2015. Margin increased from 27.4% to 31.6%. The impact of foreign exchange rates on Retail Solutions North America earnings before income taxes was a decrease of $5.4 million, or approximately 1 percentage point. During fiscal 2015, the effect of the accelerated trademark amortization was partially offset by the effect of the internet sales leads business and stand-alone public company costs on earnings before income taxes.
Retail Solutions North America earnings before income taxes were favorably impacted by operating efficiencies inclusive of revenue growth as discussed above and benefits obtained from ongoing initiatives under our business transformation plan, primarily related to lower headcount and geographic labor mix, a vendor-related contractual obligation established during fiscal 2015 and extinguished in the first quarter of fiscal 2016, a prior year non-recurring severance accrual, and the sale of the internet sales leads business, which was a lower margin business. The favorable effects of these items were partially offset by increased costs associated with the migration of hosting facilities, an increase in employee-related costs, primarily related to incentive compensation, a reduction of our accounts receivable allowances in fiscal 2015 as a result of a change in estimate, and stand-alone public company costs.
Advertising North America
The table below presents the reconciliation of revenues to constant currency revenues and earnings before income taxes to constant currency adjusted earnings before income taxes for the Advertising North America segment.
|
Years Ended June 30, |
Change |
|||||||||||||||
| 2016 |
2015 |
$ |
% |
|||||||||||||
| Revenues |
$ | 279.7 | $ | 243.1 | $ | 36.6 | 15 | % | ||||||||
| Impact of exchange rates |
0.1 | — | 0.1 | |||||||||||||
|
|
|
|
|
|
|
|||||||||||
| Constant currency revenues |
$ | 279.8 | $ | 243.1 | $ | 36.7 | 15 | % | ||||||||
| Earnings before income taxes |
$ | 27.5 | $ | (0.8 | ) | $ | 28.3 | n/m | ||||||||
| Margin % |
9.8 | % | (0.3 | )% | ||||||||||||
| Accelerated trademark amortization |
— | 10.1 | (10.1 | ) | ||||||||||||
|
|
|
|
|
|
|
|||||||||||
| Adjusted earnings before income taxes |
$ | 27.5 | $ | 9.3 | $ | 18.2 | 196 | % | ||||||||
| Adjusted margin % |
9.8 | % | 3.8 | % | ||||||||||||
| Impact of exchange rates |
0.1 | — | 0.1 | |||||||||||||
|
|
|
|
|
|
|
|||||||||||
| Constant currency adjusted earnings before income taxes |
$ | 27.6 | $ | 9.3 | $ | 18.3 | 197 | % | ||||||||
Revenues. Advertising North America revenues for fiscal 2016 increased $36.6 million as compared to fiscal 2015. The impact of foreign exchange rates on Advertising North America revenues was a decrease of $0.1 million. The overall increase in revenues was due to an increase in OEM driven local marketing association internet advertising placements.
Earnings before Income Taxes. Advertising North America earnings before income taxes for fiscal 2016 increased $28.3 million as compared to fiscal 2015. Margin increased from (0.3%) to 9.8%. The effect of the accelerated trademark amortization during fiscal 2015 contributed a significant increase in earnings before taxes. The impact of foreign exchange rates on Advertising North America earnings before income taxes was a decrease of $0.1 million, or 1 percentage point. Advertising North America earnings before income taxes were also favorably impacted by growth in revenues, including higher margin advertising revenues, and operating efficiencies from lower expenses as a result of headcount scale, geographic labor mix, and labor-related costs and benefits obtained from ongoing initiatives under our business transformation plan. The favorable effects of these items were partially offset by a reduction of our accounts receivable allowances in fiscal 2015 as a result of a change in estimate.
9
REPORT OF INDEPENDENT REGISTERED PUBLIC ACCOUNTING FIRM
To the Board of Directors and Stockholders of
CDK Global, Inc.
Hoffman Estates, Illinois
We have audited the accompanying consolidated balance sheets of CDK Global, Inc. and subsidiaries (the “Company”) as of June 30, 2016 and 2015, and the related consolidated and combined statements of operations, comprehensive income, equity, and cash flows for each of the two years in the period ended June 30, 2016. These financial statements are the responsibility of the Company’s management. Our responsibility is to express an opinion on these financial statements based on our audits.
We conducted our audits in accordance with the standards of the Public Company Accounting Oversight Board (United States). Those standards require that we plan and perform the audit to obtain reasonable assurance about whether the financial statements are free of material misstatement. An audit includes examining, on a test basis, evidence supporting the amounts and disclosures in the financial statements. An audit also includes assessing the accounting principles used and significant estimates made by management, as well as evaluating the overall financial statement presentation. We believe that our audits provide a reasonable basis for our opinion.
In our opinion, such consolidated and combined financial statements referred to above present fairly, in all material respects, the financial position of the Company and subsidiaries as of June 30, 2016 and 2015, and the results of their operations and their cash flows for each of the two years in the period ended June 30, 2016, in conformity with accounting principles generally accepted in the United States of America.
As discussed in Note 1 to the consolidated and combined financial statements, prior to September 30, 2014 the accompanying combined financial statements were derived from the consolidated financial statements and accounting records of Automatic Data Processing, Inc. (“ADP”). The accompanying combined financial statements include expense allocations for certain corporate functions historically provided by ADP. These allocations may not be reflective of the actual expenses which would have been incurred had the Company operated as a separate entity apart from ADP during the periods prior to September 30, 2014.
/s/ DELOITTE & TOUCHE LLP
Chicago, IL
August 9, 2016 (May 5, 2017 as to the effects of the change described in Note 18)
10
CDK GLOBAL, INC.
Consolidated and Combined Statements of Operations
(In millions, except per share amounts)
| Years Ended |
||||||||
| 2016 |
2015 |
|||||||
| Revenues |
$ | 2,114.6 | $ | 2,063.5 | ||||
| Expenses: |
||||||||
| Cost of revenues |
1,243.4 | 1,273.2 | ||||||
| Selling, general and administrative expenses |
448.5 | 431.1 | ||||||
| Restructuring expenses |
20.2 | 2.4 | ||||||
| Separation costs |
— | 34.6 | ||||||
|
|
|
|
|
|||||
| Total expenses |
1,712.1 | 1,741.3 | ||||||
|
|
|
|
|
|||||
| Operating earnings |
402.5 | 322.2 | ||||||
| Interest expense |
(40.2 | ) | (28.8 | ) | ||||
| Other income, net |
6.8 | 6.5 | ||||||
|
|
|
|
|
|||||
| Earnings before income taxes |
369.1 | 299.9 | ||||||
| Provision for income taxes |
(122.3 | ) | (113.6 | ) | ||||
|
|
|
|
|
|||||
| Net earnings |
246.8 | 186.3 | ||||||
| Less: net earnings attributable to noncontrolling interest |
7.5 | 7.9 | ||||||
|
|
|
|
|
|||||
| Net earnings attributable to CDK |
$ | 239.3 | $ | 178.4 | ||||
|
|
|
|
|
|||||
| Net earnings attributable to CDK per common share: |
||||||||
| Basic |
$ | 1.52 | $ | 1.11 | ||||
| Diluted |
$ | 1.51 | $ | 1.10 | ||||
| Weighted-average common shares outstanding: |
||||||||
| Basic |
157.0 | 160.6 | ||||||
| Diluted |
158.0 | 161.6 | ||||||
See notes to the consolidated and combined financial statements.
11
CDK GLOBAL, INC.
Consolidated and Combined Statements of Comprehensive Income
(In millions)
|
Years Ended |
||||||||
| 2016 |
2015 |
|||||||
| Net earnings |
$ | 246.8 | $ | 186.3 | ||||
| Other comprehensive (loss) income: |
||||||||
| Currency translation adjustments |
(45.8 | ) | (34.1 | ) | ||||
|
|
|
|
|
|||||
| Other comprehensive (loss) income |
(45.8 | ) | (34.1 | ) | ||||
|
|
|
|
|
|||||
| Comprehensive income |
201.0 | 152.2 | ||||||
| Less: comprehensive income attributable to noncontrolling interest |
7.5 | 7.9 | ||||||
|
|
|
|
|
|||||
| Comprehensive income attributable to CDK |
$ | 193.5 | $ | 144.3 | ||||
|
|
|
|
|
|||||
See notes to the consolidated and combined financial statements.
12
CDK GLOBAL, INC.
Consolidated Balance Sheets
(In millions, except per share par value)
| June 30, |
||||||||
| 2016 |
2015 |
|||||||
| Assets |
||||||||
| Current assets: |
||||||||
| Cash and cash equivalents |
$ | 219.1 | $ | 408.2 | ||||
| Accounts receivable, net of allowances of $7.1 and $6.8, respectively |
365.5 | 314.6 | ||||||
| Other current assets |
154.1 | 162.4 | ||||||
|
|
|
|
|
|||||
| Total current assets |
738.7 | 885.2 | ||||||
| Property, plant and equipment, net |
118.6 | 100.0 | ||||||
| Other assets |
217.2 | 224.1 | ||||||
| Goodwill |
1,182.7 | 1,209.9 | ||||||
| Intangible assets, net |
107.8 | 99.3 | ||||||
|
|
|
|
|
|||||
| Total assets |
$ | 2,365.0 | $ | 2,518.5 | ||||
|
|
|
|
|
|||||
| Liabilities and Equity |
||||||||
| Current liabilities: |
||||||||
| Current maturities of long-term debt and capital lease obligations |
$ | 26.8 | $ | 13.0 | ||||
| Accounts payable |
38.8 | 21.7 | ||||||
| Accrued expenses and other current liabilities |
165.3 | 154.4 | ||||||
| Accrued payroll and payroll-related expenses |
115.3 | 123.2 | ||||||
| Short-term deferred revenues |
177.2 | 186.1 | ||||||
|
|
|
|
|
|||||
| Total current liabilities |
523.4 | 498.4 | ||||||
| Long-term debt and capital lease obligations |
1,190.3 | 971.1 | ||||||
| Long-term deferred revenues |
157.7 | 162.9 | ||||||
| Deferred income taxes |
46.9 | 58.2 | ||||||
| Other liabilities |
70.5 | 43.8 | ||||||
|
|
|
|
|
|||||
| Total liabilities |
1,988.8 | 1,734.4 | ||||||
|
|
|
|
|
|||||
| Equity: |
||||||||
| Preferred stock, $0.01 par value: Authorized, 50.0 shares; issued and outstanding, none |
— | — | ||||||
| Common stock, $0.01 par value: Authorized, 650.0 shares; issued, 160.3 and 161.3 shares, respectively; outstanding, 150.1 and 160.2 shares, respectively |
1.6 | 1.6 | ||||||
| Additional paid-in-capital |
640.7 | 686.5 | ||||||
| Retained earnings |
238.3 | 81.2 | ||||||
| Treasury stock, at cost: 10.2 and 1.1 shares, respectively |
(526.6 | ) | (50.7 | ) | ||||
| Accumulated other comprehensive income |
5.8 | 51.6 | ||||||
|
|
|
|
|
|||||
| Total CDK stockholders’ equity |
359.8 | 770.2 | ||||||
| Noncontrolling interest |
16.4 | 13.9 | ||||||
|
|
|
|
|
|||||
| Total equity |
376.2 | 784.1 | ||||||
|
|
|
|
|
|||||
| Total liabilities and equity |
$ | 2,365.0 | $ | 2,518.5 | ||||
|
|
|
|
|
|||||
See notes to the consolidated and combined financial statements.
13
CDK GLOBAL, INC.
Consolidated and Combined Statements of Cash Flows
(In millions)
| Years Ended |
||||||||
| 2016 |
2015 |
|||||||
| Cash Flows from Operating Activities: |
||||||||
| Net earnings |
$ | 246.8 | $ | 186.3 | ||||
| Adjustments to reconcile net earnings to cash flows provided by operating activities: |
||||||||
| Depreciation and amortization |
64.0 | 76.5 | ||||||
| Deferred income taxes |
(3.6 | ) | (25.3 | ) | ||||
| Stock-based compensation expense |
36.4 | 30.4 | ||||||
| Pension expense |
— | 0.8 | ||||||
| Other |
(5.6 | ) | (12.6 | ) | ||||
| Changes in operating assets and liabilities, net of effects of acquisitions: |
||||||||
| Increase in accounts receivable |
(57.0 | ) | (16.9 | ) | ||||
| Decrease (increase) in other assets |
3.0 | (24.3 | ) | |||||
| Increase in accounts payable |
15.3 | 3.0 | ||||||
| Increase in accrued expenses and other liabilities |
20.8 | 50.0 | ||||||
|
|
|
|
|
|||||
| Net cash flows provided by operating activities |
320.1 | 267.9 | ||||||
|
|
|
|
|
|||||
| Cash Flows from Investing Activities: |
||||||||
| Capital expenditures |
(50.8 | ) | (44.0 | ) | ||||
| Proceeds from sale of property, plant and equipment |
1.1 | 0.9 | ||||||
| Capitalized software |
(13.5 | ) | (19.9 | ) | ||||
| Acquisitions of businesses, net of cash acquired |
(18.1 | ) | (36.6 | ) | ||||
| Proceeds from the sale of a business |
— | 24.5 | ||||||
| Contributions to investments |
(10.0 | ) | (22.9 | ) | ||||
| Proceeds from investments |
9.7 | 16.6 | ||||||
| Proceeds from (advances on) notes receivable from ADP and its affiliates |
— | 40.6 | ||||||
|
|
|
|
|
|||||
| Net cash flows used in investing activities |
(81.6 | ) | (40.8 | ) | ||||
|
|
|
|
|
|||||
| Cash Flows from Financing Activities: |
||||||||
| Repayments of notes payable to ADP and its affiliates |
— | (21.9 | ) | |||||
| Borrowings on notes payable to ADP and its affiliates |
— | — | ||||||
| Net transactions of parent company investment |
— | (240.8 | ) | |||||
| Proceeds from long-term debt |
250.0 | 1,750.0 | ||||||
| Repayments of long-term debt and capital lease obligations |
(20.0 | ) | (759.5 | ) | ||||
| Dividend paid to ADP at spin-off |
— | (825.0 | ) | |||||
| Dividends paid to stockholders |
(82.3 | ) | (58.2 | ) | ||||
| Repurchases of common stock |
(561.0 | ) | (50.0 | ) | ||||
| Proceeds from exercise of stock options |
6.7 | 9.8 | ||||||
| Excess tax benefit from stock-based compensation awards |
8.9 | 11.2 | ||||||
| Withholding tax payments for stock-based compensation awards |
(8.7 | ) | (0.9 | ) | ||||
| Dividend payments of CVR to noncontrolling owners |
(5.0 | ) | (5.4 | ) | ||||
| Payments of deferred financing costs |
(2.1 | ) | (9.2 | ) | ||||
| Acquisition-related payments |
(6.2 | ) | — | |||||
| Recovery of dividends paid (Note 1D) |
0.4 | — | ||||||
|
|
|
|
|
|||||
| Net cash flows used in financing activities |
(419.3 | ) | (199.9 | ) | ||||
|
|
|
|
|
|||||
| Effect of exchange rate changes on cash and cash equivalents |
(8.3 | ) | (21.8 | ) | ||||
|
|
|
|
|
|||||
| Net change in cash and cash equivalents |
(189.1 | ) | 5.4 | |||||
| Cash and cash equivalents, beginning of period |
408.2 | 402.8 | ||||||
|
|
|
|
|
|||||
| Cash and cash equivalents, end of period |
$ | 219.1 | $ | 408.2 | ||||
|
|
|
|
|
|||||
| Supplemental Disclosure: |
||||||||
| Cash paid for: |
||||||||
| Income taxes and foreign withholding taxes, net of refunds |
$ | 109.4 | $ | 120.8 | ||||
| Interest |
37.8 | 19.2 | ||||||
| Non-cash transactions: |
||||||||
| Non-cash consideration issued for acquisitions (Note 4) |
13.5 | 8.5 | ||||||
See notes to the consolidated and combined financial statements.
14
CDK GLOBAL, INC.
Consolidated and Combined Statements of Equity
(In millions)
| Common Stock |
Additional Capital |
Retained |
Treasury |
Net
Parent |
Accumulated |
Total
CDK |
Non- controlling |
Total |
||||||||||||||||||||||||||||||||
| Shares Issued |
Amount | |||||||||||||||||||||||||||||||||||||||
| Balance as of June 30, 2014 |
— | — | — | — | — | 1,712.2 | 85.7 | 1,797.9 | 11.4 | 1,809.3 | ||||||||||||||||||||||||||||||
|
|
|
|
|
|
|
|
|
|
|
|
|
|
|
|
|
|
|
|
|
|||||||||||||||||||||
| Net earnings |
— | — | — | 139.4 | — | 39.0 | — | 178.4 | 7.9 | 186.3 | ||||||||||||||||||||||||||||||
| Foreign currency translation adjustments |
— | — | — | — | — | — | (34.1 | ) | (34.1 | ) | — | (34.1 | ) | |||||||||||||||||||||||||||
| Net distributions to Parent |
— | — | — | — | — | (271.8 | ) | — | (271.8 | ) | — | (271.8 | ) | |||||||||||||||||||||||||||
| Dividend paid to ADP |
— | — | — | — | — | (825.0 | ) | — | (825.0 | ) | — | (825.0 | ) | |||||||||||||||||||||||||||
| Reclassifications of net parent company investment to common stock and additional paid-in-capital in conjunction with the spin-off |
160.6 | 1.6 | 652.8 | — | — | (654.4 | ) | — | — | — | — | |||||||||||||||||||||||||||||
| Stock-based compensation expense |
— | — | 17.5 | — | — | — | — | 17.5 | — | 17.5 | ||||||||||||||||||||||||||||||
| Common stock issued for the exercise and vesting of stock-based compensation awards, net |
0.7 | — | 8.9 | — | — | — | — | 8.9 | — | 8.9 | ||||||||||||||||||||||||||||||
| Excess tax benefit from stock-based compensation awards |
— | — | 7.3 | — | — | — | — | 7.3 | — | 7.3 | ||||||||||||||||||||||||||||||
| Cash dividends paid to stockholders |
— | — | — | (58.2 | ) | — | — | — | (58.2 | ) | — | (58.2 | ) | |||||||||||||||||||||||||||
| Repurchases of common stock |
— | — | — | — | (50.7 | ) | — | — | (50.7 | ) | — | (50.7 | ) | |||||||||||||||||||||||||||
| Dividend payments of CVR to noncontrolling owners |
— | — | — | — | — | — | — | — | (5.4 | ) | (5.4 | ) | ||||||||||||||||||||||||||||
|
|
|
|
|
|
|
|
|
|
|
|
|
|
|
|
|
|
|
|
|
|||||||||||||||||||||
| Balance as of June 30, 2015 |
161.3 | 1.6 | 686.5 | 81.2 | (50.7 | ) | — | 51.6 | 770.2 | 13.9 | 784.1 | |||||||||||||||||||||||||||||
|
|
|
|
|
|
|
|
|
|
|
|
|
|
|
|
|
|
|
|
|
|||||||||||||||||||||
| Net earnings |
— | — | — | 239.3 | — | — | — | 239.3 | 7.5 | 246.8 | ||||||||||||||||||||||||||||||
| Foreign currency translation adjustments |
— | — | — | — | — | — | (45.8 | ) | (45.8 | ) | — | (45.8 | ) | |||||||||||||||||||||||||||
| Stock-based compensation expense and related dividend equivalents |
— | — | 31.7 | (0.3 | ) | — | — | — | 31.4 | — | 31.4 | |||||||||||||||||||||||||||||
| Common stock issued for the exercise and vesting of stock-based compensation awards, net |
— | — | (32.6 | ) | — | 30.6 | — | — | (2.0 | ) | — | (2.0 | ) | |||||||||||||||||||||||||||
| Excess tax benefit from stock-based compensation awards |
— | — | 8.9 | — | — | — | — | 8.9 | — | 8.9 | ||||||||||||||||||||||||||||||
| Cash dividends paid to stockholders |
— | — | — | (82.3 | ) | — | — | — | (82.3 | ) | — | (82.3 | ) | |||||||||||||||||||||||||||
| Repurchases of common stock |
— | — | (53.8 | ) | — | (506.5 | ) | — | — | (560.3 | ) | — | (560.3 | ) | ||||||||||||||||||||||||||
| Dividend payments of CVR to noncontrolling owners |
— | — | — | — | — | — | — | — | (5.0 | ) | (5.0 | ) | ||||||||||||||||||||||||||||
| Correction of common stock issued in connection with the spin-off and dividends paid (Note 1D) |
(1.0 | ) | — | — | 0.4 | — | — | — | 0.4 | — | 0.4 | |||||||||||||||||||||||||||||
|
|
|
|
|
|
|
|
|
|
|
|
|
|
|
|
|
|
|
|
|
|||||||||||||||||||||
| Balance as of June 30, 2016 |
160.3 | $ | 1.6 | $ | 640.7 | $ | 238.3 | $ | (526.6 | ) | $ | — | $ | 5.8 | $ | 359.8 | $ | 16.4 | $ | 376.2 | ||||||||||||||||||||
|
|
|
|
|
|
|
|
|
|
|
|
|
|
|
|
|
|
|
|
|
|||||||||||||||||||||
See notes to the consolidated and combined financial statements.
15
CDK GLOBAL, INC.
Notes to the Consolidated and Combined Financial Statements
(Tabular amounts in millions, except per share amounts)
Note 1. Basis of Presentation
A. Spin-off
On April 9, 2014, the board of directors of Automatic Data Processing, Inc. (“ADP”) approved the spin-off of the Dealer Services business of ADP. On September 30, 2014, the spin-off became effective and ADP distributed 100% of the common stock of CDK Global, Inc. (the “Company” or “CDK”) to the holders of record of ADP’s common stock as of September 24, 2014 (the “spin-off”).
Concurrent with the spin-off, the Company and ADP entered into several agreements providing for transition services and governing relationships between the Company and ADP. Refer to Notes 8 and 17 for further information.
B. Description of Business
The Company is a leading global provider of integrated information technology and digital marketing solutions to the automotive retail and adjacent industries. The Company’s solutions automate and integrate all parts of the buying process from targeted digital advertising and marketing campaigns to the sale, financing, insuring, parts supply, repair, and maintenance of vehicles.
Effective July 1, 2016, the Company executed a comprehensive reorganization to streamline its organization to enable it to deliver an improved customer experience, create significant efficiencies, and better align it to implement the ongoing business transformation plan discussed in Note 5. The Company reorganized into two main operating groups. In connection with the reorganization, the Company’s operating segments were changed. The company’s first operating group is CDK North America which is comprised of two reportable segments, Retail Solutions North America (“RSNA”) and Advertising North America (“ANA”). The second operating group, which is also a reportable segment, is CDK International (“CDKI”). In addition, the Company has an Other segment, the primary components of which are corporate allocations and other expenses not recorded in the segment results. Refer to Note 18 for further information.
C. Basis of Preparation
The financial statements presented herein represent (i) results of operations, cash flows, and statement of equity for periods subsequent to the spin-off and the balance sheets as of June 30, 2016 and 2015 with the Company reporting as a separate publicly-traded company (referred to as “consolidated financial statements”), and (ii) the results of operations, cash flows, and statement of equity for periods prior to the spin-off when the Company was a wholly owned subsidiary of ADP (referred to as “combined financial statements”). References to the “financial statements” mean the “consolidated and combined financial statements,” unless the context indicates otherwise.
The accompanying financial statements have been prepared in accordance with accounting principles generally accepted in the United States (“GAAP”). The preparation of the financial statements in conformity with GAAP requires management to make estimates and assumptions that affect assets, liabilities, revenues, and expenses that are reported in the accompanying financial statements and footnotes thereto. Actual results may differ from those estimates. These financial statements present the consolidated and combined results of operations of the Company, which was under common control and common management by ADP until the spin-off. The historical financial results in the accompanying financial statements presented may not be indicative of the results that would have been achieved had the Company operated as a separate, stand-alone entity.
16
Prior to the spin-off, the financial statements of the Company included costs for facilities, functions, and services used by the Company at shared ADP sites and costs for certain functions and services performed by centralized ADP organizations and directly charged to the Company based on revenues and headcount. Following the spin-off, the Company performs these functions using internal resources or purchased services, certain of which were provided by ADP during a transitional period that ended September 30, 2015 pursuant to the transition services agreement. Refer to Note 17 for further information on the agreements entered into with ADP as a result of the spin-off. The expenses allocated to the Company for these services are not necessarily indicative of the expenses that would have been incurred if the Company had been a separate, independent entity and had otherwise managed these functions. The financial statements of the Company include the following transactions with ADP or its affiliates:
Separation Costs. The financial statements of the Company include certain incremental costs that are directly attributable to the spin-off. Prior to the spin-off, separation costs were paid by ADP and allocated to the Company. These costs related to professional services and amounted to $34.6 million for the year ended June 30, 2015 (“fiscal 2015.”) The Company did not incur any separation costs during the year ended June 30, 2016 (“fiscal 2016”).
Overhead Expenses. Prior to the spin-off, the financial statements of the Company included an allocation of certain general expenses of ADP and its affiliates, which were in support of the Company, including departmental costs for travel, procurement, treasury, tax, internal audit, risk management, real estate, benefits, and other corporate and infrastructure costs. The Company was allocated overhead costs related to ADP’s shared functions of $7.1 million for fiscal 2015. The Company was not allocated any overhead costs related to ADP’s shared functions following the spin-off. These costs were reported in selling, general and administrative expenses on the consolidated and combined statements of operations. These allocations were based on a variety of factors. The allocation of travel department costs was based on the estimated percentage of travel directly related to the Company. The allocation of benefits was based on the approximate benefit claims or payroll costs directly related to the Company as compared to ADP’s total claims and payroll costs. The allocation of real estate management costs was based on the estimated percentage of square footage of facilities for the Company’s business that was managed by the ADP corporate real estate department in relation to ADP’s total managed facilities. All other allocations were based on an estimated percentage of support staff time or system utilization in comparison to ADP as a whole. Management believes that these allocations were made on a reasonable basis.
Royalty Fees. Prior to the spin-off, the financial statements included a trademark royalty fee charged by ADP to the Company based on revenues for licensing fees associated with the use of the ADP trademark. The Company was charged trademark royalties of $5.7 million and for fiscal 2015. The Company was not charged trademark royalty fees following the spin-off. These charges were included in selling, general and administrative expenses on the consolidated and combined statements of operations. Management believes that these allocations were made on a reasonable basis.
Services Received from Affiliated Companies. Prior to the spin-off, certain systems development functions were outsourced to an ADP shared services facility located in India. This facility provides services to the Company as well as to other ADP affiliates. The Company purchased $5.5 million of services from this facility for fiscal 2015. These functions were no longer outsourced to an ADP shared services facility following the spin-off. The charges for these services were included within cost of revenues on the consolidated and combined statements of operations.
Notes Receivable from ADP and its Affiliates and Notes Payable to ADP and its Affiliates. Prior to the spin-off, notes receivable from ADP and its affiliates and notes payable to ADP and its affiliates were settled; therefore, there were no outstanding notes receivable from or payable to ADP and its affiliates in the accompanying consolidated balance sheets as of June 30, 2016 and 2015. Interest income on notes receivable from ADP and its affiliates was $0.2 million for fiscal 2015. The Company recorded interest income on notes receivable from ADP and its affiliates within other income, net on the consolidated and combined statements of
17
operations. Interest expense on notes payable to ADP and its affiliates was $0.2 million for fiscal 2015. The Company recorded interest expense on notes payable to ADP and its affiliates within interest expense on the consolidated and combined statements of operations. There was no interest income or interest expense under similar arrangements following the spin-off.
Other Services. Prior to the spin-off, the Company received other services from ADP and its affiliates (e.g., payroll processing services). The Company was charged primarily at a fixed rate per employee per month for such payroll processing services. Expenses incurred for such services were $0.4 million for fiscal 2015. The Company did not incur expenses for such services following the spin-off. These expenses were included in selling, general and administrative expenses on the consolidated and combined statements of operations.
D. Spin-off Common Stock Issued
During the three months ended September 30, 2015, the Company became aware that 1.0 million shares of common stock were inadvertently issued and distributed to ADP at the spin-off with respect to certain unvested ADP equity awards. The Company previously reported that 160.6 million shares were issued in connection with the spin-off, which was overstated by 1.0 million shares. In addition, dividends paid to stockholders in fiscal 2015 were overstated by $0.4 million. The Company assessed the materiality and concluded that the impact was not material to previously reported results of operations, financial condition, or cash flows. During the three months ended September 30, 2015, the Company and ADP took corrective action to cancel the 1.0 million shares of common stock effective as of September 30, 2014 and the Company recovered the $0.4 million of cumulative dividends paid on such shares, thereby increasing the Company’s retained earnings. The effects of these adjustments were reflected in the accompanying financial statements for the fiscal year ended June 30, 2016.
Note 2. Summary of Significant Accounting Policies
A. Consolidation
The financial statements include the accounts of the Company and its wholly owned subsidiaries. In addition, the financial statements include the accounts of Computerized Vehicle Registration, Inc. (“CVR”) in which CDK holds a controlling financial or management interest. Intercompany transactions and balances between consolidated CDK businesses have been eliminated.
The Company’s share of earnings or losses of non-controlled affiliates, over which the Company exercises significant influence (generally a 20% to 50% ownership interest), are included in the consolidated and combined operating results using the equity method of accounting. Equity method investments were not significant for fiscal 2016 and 2015.
B. Business Combinations
The purchase price allocations for acquisitions are based on estimates of the fair value of tangible and intangible assets acquired and liabilities assumed. The Company engages independent valuation specialists, when necessary, to assist with purchase price allocations and uses recognized valuation techniques, including the income and market approaches, to determine fair value. Management makes estimates and assumptions in determining purchase price allocations and valuation analyses, which may involve significant unobservable inputs. The excess of the purchase price over the estimated fair values of the underlying assets acquired and liabilities assumed is allocated to goodwill. In certain circumstances, the determination of the purchase price and allocation to assets acquired and liabilities assumed are based upon preliminary estimates and assumptions. Accordingly, the allocation may be subject to revision during the measurement period, which may be up to one year from the acquisition date, when the Company receives final information, including appraisals and other analyses. Measurement period adjustments are recorded to goodwill in the reporting period in which the adjustments to the provisional amounts are determined.
18
Assets acquired and liabilities assumed in business combinations are recorded on the Company’s consolidated balance sheets as of the respective acquisition dates based upon their estimated fair values at such dates. The results of operations of businesses acquired by the Company are included in the Company’s consolidated and combined statements of operations since their respective acquisition dates.
C. Restructuring
Restructuring expenses consist of employee-related costs, including severance and other termination benefits calculated based on long-standing benefit practices and local statutory requirements, and contract termination costs. Restructuring liabilities are recognized at fair value in the period the liability is incurred. In some jurisdictions, the Company has ongoing benefit arrangements under which the Company records the estimated severance and other termination benefits when such costs are deemed probable and estimable, approved by the appropriate corporate management, and if actions required to complete the termination plan indicate that it is unlikely that significant changes to the plan will be made or the plan will be withdrawn. In jurisdictions where there is not an ongoing benefit arrangement, the Company records estimated severance and other termination benefits when appropriate corporate management has committed to the plan and the benefit arrangement is communicated to the affected employees. A liability for costs to terminate a contract before the end of its term is recognized at fair value when the Company terminates the contract in accordance with its terms. Estimates are evaluated periodically to determine whether an adjustment is required.
D. Revenue Recognition
The Company recognizes software revenues in accordance with Accounting Standards Codification (“ASC”) 985-605, “Software—Revenue Recognition,” and non-software related revenue, including Software-as-a-Service (“SaaS”), in accordance with ASC 605, “Revenue Recognition” (“ASC 605”).
The Company generates revenues from four categories: subscription, digital advertising, transactional services, and other. Taxes collected from customers and remitted to governmental authorities are presented on a net basis; that is, such taxes are excluded from revenues.
Subscription. In the Retail Solutions North America (“RSNA”) and CDK International (“CDKI”) segments, CDK provides software and technology solutions for automotive retailers and original equipment manufacturers (“OEMs”), which includes:
| • | Dealer Management Systems (“DMSs”) and layered applications, where the software may be installed onsite at the customer’s location, or hosted and provided on a SaaS basis, including ongoing maintenance and support; |
| • | Interrelated services such as installation, initial training, and data updates; |
| • | Websites, search marketing, and reputation management services (RSNA only); and |
| • | Hardware on a service basis, meaning no specific assets are identified or a substantive right of substitution exists. |
Revenues for term licenses are recognized ratably over the software license term, as vendor-specific objective evidence of the fair values of the individual elements in the sales arrangement does not exist. Revenue recognition commences at the installation dates, when customer acceptance has occurred, and collectability of a determinable amount is probable. In the case of hosted applications, the customer does not have the contractual right to take possession of the software and the items delivered at the outset of the contract (e.g., installation, training, etc.) do not have value to the customer without the software license and ongoing support and maintenance. Any upfront fees charged in the case of hosted arrangements are recognized ratably over the expected benefit period of the arrangement, typically five years. The unrecognized portion of these revenue elements is recorded as deferred revenue.
19
Advertising services. In the Advertising North America (“ANA”) segment, the Company receives revenues from the placement of internet advertising for automotive retailers and OEMs. Advertising revenues are recognized when the services are rendered.
Transaction revenues. In the RSNA segment, the Company receives fees per transaction for providing auto retailers interfaces with third parties to process credit reports, vehicle registrations, and automotive equity mining. Revenue is recognized at the time the services are rendered. Transaction revenues are recorded in revenues gross of costs incurred for credit report processing, vehicle registrations, and automotive equity mining as the Company is contractually responsible for providing the service, software, and/or connectivity to the customers, and therefore, the Company is the primary obligor under ASC 605.
Other. The Company provides consulting and professional services and sells hardware such as laser printers, networking and telephony equipment, and related items. These revenues are recognized upon their delivery or service completion.
E. Income Taxes
Income tax expense is recognized for the amount of taxes payable or refundable for the current year. Deferred tax assets and liabilities are recognized for the expected future tax consequences of temporary differences between the financial reporting and tax bases of assets and liabilities, and for operating losses and tax credit carryforwards. Management must make assumptions, judgments, and estimates to determine the provision for income taxes, taxes payable or refundable, and deferred tax assets and liabilities. The Company’s assumptions, judgments, and estimates take into consideration the realization of deferred tax assets and changes in tax laws or interpretations thereof. The Company’s income tax returns are subject to examination by various tax authorities. A change in the assessment of the outcomes of such matters could materially impact the Company’s consolidated and combined financial statements.
The Company records a valuation allowance to reduce deferred tax assets to the amount that is more likely than not to be realized. In determining the need for a valuation allowance, the Company considers future market growth, forecasted earnings, future taxable income, and prudent and feasible tax planning strategies. In the event the Company determines that it is more likely than not that an entity will be unable to realize all or a portion of its deferred tax assets in the future, the Company would increase the valuation allowance and recognize a corresponding charge to earnings in the period in which such a determination is made. Likewise, if the Company later determines that it is more likely than not that the deferred tax assets will be realized, the Company would reverse the applicable portion of the previously recognized valuation allowance. In order to realize deferred tax assets, the Company must be able to generate sufficient taxable income of the appropriate character in the jurisdictions in which the deferred tax assets are located.
The Company recognizes tax benefits for tax positions that are more likely than not to be sustained upon examination by tax authorities. The amount recognized is measured as the largest amount of benefit that is greater than 50 percent likely to be realized upon ultimate settlement. Unrecognized tax benefits are tax benefits claimed in the Company’s income tax returns that do not meet these recognition and measurement standards. Assumptions, judgments, and the use of estimates are required in determining whether the “more likely than not” standard has been met when developing the provision for income taxes.
If certain pending tax matters settle within the next twelve months, the total amount of unrecognized tax benefits may increase or decrease for all open tax years and jurisdictions. Audit outcomes and the timing of audit settlements are subject to significant uncertainty. The Company continually assesses the likelihood and amount of potential adjustments and adjusts the income tax provision, the current taxes payable and deferred taxes in the period in which the facts that give rise to a revision become known.
Prior to the spin-off, the Company computed the provision for income taxes under the Separate Return Method, which applies the accounting guidance for income taxes to the stand-alone financial statements “as if”
20
the Company were a separate taxpayer and a stand-alone enterprise for the periods presented. For tax periods prior to the spin-off, the Company’s operations were included in the income tax returns of ADP for United States (“U.S.”) federal income tax purposes and for certain consolidated, combined, unitary, or similar group filings for U.S. state and local and foreign tax jurisdictions. Subsequent to the spin-off, the Company files its own U.S. federal, state, and foreign income tax returns.
F. Stock-Based Compensation
Certain of the Company’s employees (a) have been granted stock options to purchase shares of the Company’s common stock and (b) have been granted restricted stock or restricted stock units under which shares of the Company’s common stock vest based on the passage of time or achievement of performance and market conditions.
The Company recognizes stock-based compensation expense in net earnings based on the fair value of the award on the date of the grant. The Company determines the fair value of stock options issued using a binomial option-pricing model. The binomial option-pricing model considers a range of assumptions related to volatility, dividend yield, risk-free interest rate, and employee exercise behavior. Expected volatilities utilized in the binomial option pricing model are based on a combination of implied market volatilities and historical volatilities of peer companies. Similarly, the dividend yield is based on historical experience and expected future dividend payments. The risk-free rate is derived from the U.S. Treasury yield curve in effect at the time of grant. The binomial option pricing model also incorporates exercise and forfeiture assumptions based on an analysis of historical data. The expected life of a stock option grant is derived from the output of the binomial model and represents the period of time that options granted are expected to be outstanding.
The grant date fair value of restricted stock and restricted stock units that vest upon achievement of service conditions is based on the closing price of the Company’s common stock on the date of grant. The Company also grants performance-based awards that vest over a performance period. Certain performance-based awards are further subject to adjustment (increase or decrease) based on a market condition defined as total shareholder return of the Company’s common stock compared to a peer group of companies. The fair value of performance-based awards subject to a market condition is determined using a Monte Carlo simulation model. The principal variable assumptions utilized in determining the grant date fair value of performance-based awards subject to a market condition include the risk-free rate, stock volatility, dividend yield, and correlations between the Company’s stock price and the stock prices of the peer group of companies.
G. Cash and Cash Equivalents
Investment securities with an original maturity of three months or less at the time of purchase are considered cash equivalents. Prior to the spin-off, the Company participated in a centralized approach to cash management and financing of operations governed by ADP. The Company’s cash was available for use and was regularly “swept” by ADP. Transfers of cash both to and from ADP are reflected as a financing activity in the consolidated and combined statements of cash flows for fiscal 2015.
H. Accounts Receivable, Net
Accounts receivable, net is comprised of trade receivables and lease receivables, net of allowances. Trade receivables consist of amounts due to the Company in the normal course of business, which are not collateralized and do not bear interest. Lease receivables primarily relate to sales-type leases arising from the sale of hardware elements in bundled DMS or other integrated solutions. Lease receivables represent the current portion of the present value of the minimum lease payments at the beginning of the lease term. The long-term portion of the present value of the minimum lease payments is included within other assets on the consolidated balance sheets. The Company considers lease receivables to be a single portfolio segment.
21
The accounts receivable allowances for both trade receivables and lease receivables are estimated based on historical collection experience, an analysis of the age of outstanding accounts receivable, and credit issuance experience. Receivables are considered past due if payment is not received by the date agreed upon with the customer. Write-offs are made when management believes it is probable a receivable will not be recovered.
I. Deferred Costs
Costs to deliver services are expensed to cost of revenues as incurred with the exception of specific costs directly related to transition or installation activities, including payroll-related costs for the Company’s implementation and training teams, as well as commission costs for the sale. These costs are deferred and expensed proportionately over the same period that deferred revenues are recognized as revenues. Deferred amounts are monitored regularly to ensure appropriate asset and expense recognition. Current deferred costs classified within other current assets on the consolidated balance sheets were $104.0 million and $105.3 million as of June 30, 2016 and 2015, respectively. Long-term deferred costs classified within other assets on the consolidated balance sheets were $135.5 million and $144.7 million as of June 30, 2016 and 2015, respectively.
J. Time Deposits
From time to time, the Company enters into various time deposit agreements whereby certain funds on deposit with financial institutions may not be withdrawn for a specified period of time. Time deposits with original maturity periods greater than three months are included within other current assets on the consolidated balance sheets. There were no time deposits as of June 30, 2016 and $5.8 million time deposits as of June 30, 2015.
K. Property, Plant and Equipment, Net
Property, plant and equipment, net is stated at cost and depreciated over the estimated useful lives of the assets using the straight-line method. Leasehold improvements are amortized over the shorter of the term of the lease or the estimated useful lives of the improvements. The estimated useful lives of assets are primarily as follows:
| Buildings |
20 to 40 years | |
| Furniture and fixtures |
4 to 7 years | |
| Data processing equipment |
2 to 5 years |
L. Goodwill
The Company tests goodwill for impairment annually and whenever events or changes in circumstances indicate the carrying value may not be recoverable. The Company tests goodwill for impairment at the reporting unit level. A reporting unit is an operating segment or a component of an operating segment. In July 2016, the Company revised its reportable segments and reporting units due to changes in how the chief operating decision maker regularly reviews information for purposes of allocating resources and assessing performance. Due to the change in organization structure, the Company expanded its reporting units from three to five.
The Company tests impairment by first comparing the fair value of each reporting unit to its carrying amount. If the carrying value for a reporting unit exceeds its fair value, the Company then compares the implied fair value of the Company’s goodwill to the carrying amount in order to determine the amount of the impairment, if any.
The Company estimates the fair value of the Company’s reporting units by weighting the results from the income approach, which is the present value of expected cash flows discounted at a risk-adjusted weighted-average cost of capital, and the market approach, which uses market multiples of companies in similar lines of
22
business. These valuation approaches require significant judgment and consider a number of factors including assumptions about the future growth and profitability of the Company’s reporting units, the determination of appropriate comparable publicly traded companies in the Company’s industry, discount rates, and terminal growth rates.
M. Impairment of Long-Lived Assets
Long-lived assets are reviewed for impairment whenever events or changes in circumstances indicate that the carrying amount of an asset may not be recoverable. Recoverability of assets to be held and used is measured by a comparison of the carrying amount of an asset group to estimated undiscounted future cash flows expected to be generated by the asset group. If the carrying amount of an asset exceeds its estimated future cash flows, an impairment charge is recognized for the amount by which the carrying amount exceeds the fair value.
N. Internal Use Software
The Company’s policy provides for the capitalization of external direct costs of materials and services associated with developing or obtaining internal use computer software. In addition, the Company’s policy also provides for the capitalization of certain payroll and payroll-related costs for employees who are directly associated with the internal use computer software projects. The amount of capitalizable payroll costs with respect to these employees is limited to the time directly spent on such projects. Costs associated with preliminary project stage activities, training, maintenance, and all other post-implementation stage activities are expensed as incurred. The Company also expenses internal costs related to minor upgrades and enhancements, as it is impracticable to separate these costs from normal maintenance activities. The Company amortizes internal use software typically over a three to five year life.
O. Computer Software to be Sold, Leased, or Otherwise Marketed
The Company’s policy provides for the capitalization of certain costs of computer software to be sold, leased, or otherwise marketed. The Company’s policy provides for the capitalization of all software production costs upon reaching technological feasibility for a specific product. Technological feasibility is attained when software products have a completed working model whose consistency with the overall product design has been confirmed by testing. Costs incurred prior to the establishment of technological feasibility are expensed as incurred. The establishment of technological feasibility requires judgment by management and in many instances is only attained a short time prior to the general release of the software. Maintenance-related costs are expensed as incurred.
Pursuant to this policy, the Company incurred expenses of $161.0 million and $170.1 million for fiscal 2016 and 2015, respectively. These expenses were classified within cost of revenues on the consolidated and combined statements of operations.
P. Foreign Currency
For foreign subsidiaries where the local currency is the functional currency, net assets are translated into U.S. dollars based on exchange rates in effect for each period, and revenues and expenses are translated at average exchange rates in the periods. Gains or losses from balance sheet translation of such entities are included in accumulated other comprehensive income on the consolidated balance sheets. Currency transaction gains or losses relate to intercompany loans denominated in a currency other than that of the loan counterparty, which do not eliminate upon consolidation. Currency transaction gains or losses are included within other income, net on the consolidated and combined statements of operations.
Q. Fair Value Measurements
Fair value is defined as the exchange price that would be received for an asset or paid to transfer a liability (an exit price) in the principal or most advantageous market for the asset or liability in an orderly
23
transaction between market participants on the measurement date. Valuation techniques used to measure fair value must maximize the use of observable inputs and minimize the use of unobservable inputs. A fair value hierarchy has been established based on three levels of inputs, of which the first two are considered observable and the last unobservable.
| • | Level 1: Inputs that are based upon quoted prices in active markets for identical assets or liabilities. |
| • | Level 2: Inputs, other than quoted prices included within Level 1, which are observable for the asset or liability, either directly or indirectly. |
| • | Level 3: Unobservable inputs where there is little or no market activity for the asset or liability. These inputs reflect management’s best estimate of what market participants would use to price the assets or liabilities at the measurement date. |
The Company determines the fair value of financial instruments in accordance with ASC 820, “Fair Value Measurements.” This standard defines fair value and establishes a framework for measuring fair value in accordance with GAAP. Cash and cash equivalents, accounts receivable, other current assets, accounts payable, and other current liabilities are reflected in the consolidated balance sheets at cost, which approximates fair value due to the short-term nature of these instruments. The carrying value of the Company’s term loan facilities (as described in Note 13), including accrued interest, approximates fair value based on the Company’s current estimated incremental borrowing rate for similar types of arrangements. The approximate aggregate fair value of the Company’s senior notes as of June 30, 2016 and 2015 was $748.5 million and $747.8 million, respectively, based on quoted market prices for the same or similar instruments compared to a carrying value of $750.0 million as of both June 30, 2016 and 2015. The term loan facilities and the senior notes are considered Level 2 fair value measurements in the fair value hierarchy.
R. Concentrations
The Company maintains deposits in federally insured financial institutions in excess of federally insured limits. The Company maintains deposits in a diversified group of financial institutions, has not experienced any losses to date, and monitors the credit ratings of the primary depository institutions where deposits reside.
For fiscal 2016 and 2015, revenues to one customer represented approximately 11% and 10%, respectively, of the Company’s revenues. Accounts receivable from this customer represented approximately 17% and 10% of the Company’s accounts receivable as of June 30, 2016 and 2015, respectively. Revenues and accounts receivable from this customer were primarily generated by the ANA segment.
Note 3. New Accounting Pronouncements
Recently Adopted Accounting Pronouncements
In November 2015, the Financial Accounting Standards Board (“FASB”) issued Accounting Standards Update (“ASU”) 2015-17, “Income Taxes (Topic 740): Balance Sheet Classification of Deferred Taxes.” ASU 2015-17 requires that deferred tax assets and liabilities be classified as non-current in a classified statement of financial position. The current requirement that deferred tax assets and liabilities of a tax-paying component of an entity be offset and presented as a single amount is not affected by the amendments in this ASU. ASU 2015-17 is effective for financial statements issued for annual periods beginning after December 15, 2016, and interim periods within those annual periods, with early adoption permitted.
The Company elected to adopt ASU 2015-17 during fiscal 2016 on a prospective basis. The Company concluded that the simplified presentation requirement permitted by ASU 2015-17 is preferable because the current and non-current classification does not necessarily reflect when the temporary difference will reverse and
24
become a taxable or deductible item. As a result, deferred tax assets and liabilities are presented as long-term in the consolidated balance sheet as of June 30, 2016. Because ASU 2015-17 was adopted prospectively, the Company did not adjust the classification of deferred tax assets and liabilities in the consolidated balance sheet as of June 30, 2015. The consolidated balance sheet as of June 30, 2015 includes current deferred tax assets of $13.0 million, which are included within other current assets, and current deferred tax liabilities of $1.4 million, which are included within accrued expenses and other current liabilities.
In September 2015, the FASB issued ASU 2015-16, “Business Combinations (Topic 805): Simplifying the Accounting for Measurement-Period Adjustments.” ASU 2015-16 eliminates the requirement to retrospectively account for measurement period adjustments and allows such adjustments to be recorded to goodwill in the reporting period in which the adjustments to the provisional amounts are determined. ASU 2015-16 is effective for financial statements issued for annual periods beginning after December 15, 2015, and interim periods within those annual periods, with early adoption permitted. The Company elected to adopt ASU 2015-16 during the three months ended March 31, 2016.
In May 2015, the FASB issued ASU 2015-05, “Intangibles—Goodwill and Other—Internal-Use Software (Subtopic 350-40): Customer’s Accounting for Fees Paid in a Cloud Computing Arrangement.” ASU 2015-05 requires that if the arrangement contains a software license, the customer would account for the fees related to the software license element in a manner consistent with how the acquisition of other software licenses is accounted for under ASC 350-40; if the arrangement does not contain a software license, the customer would account for the arrangement as a service contract. ASU 2015-05 is effective for fiscal years, and interim reporting periods within those years, beginning after December 15, 2015, with early adoption permitted. The Company elected to adopt ASU 2015-05 during the three months ended March 31, 2016 on a prospective basis. Depending on the nature and purpose of the cloud-based software, expenses will be recognized in cost of revenues or selling, general, and administrative expenses.
Recently Issued Accounting Pronouncements
In March 2016, the FASB issued ASU 2016-09, “Compensation—Stock Compensation (Topic 718): Improvements to Employee Share-Based Payment Accounting.” ASU 2016-09 simplifies several aspects of accounting for share-based payment transactions, including income tax consequences, accounting for forfeitures, classification of awards as either equity or liability, and classification on the statement of cash flows. The simplification of income tax accounting for share-based payment transactions also impacts the computation of weighted-average diluted shares outstanding under the treasury stock method. ASU 2016-09 is effective for fiscal years, and interim reporting periods within those years, beginning after December 15, 2016 with early adoption permitted. The Company intends to adopt ASU 2016-09 on July 1, 2016. Upon adoption, the Company intends to elect to account for forfeitures of stock-based compensation awards when they occur. Excess tax benefits and tax deficiencies will be recognized in the provision for income taxes on the consolidated statement of operations beginning July 1, 2016 and will be presented within operating activities in the consolidated statement of cash flows prospectively in fiscal 2017. In addition, the calculation of diluted shares outstanding under the treasury stock method will exclude excess tax benefits in future periods.
In February 2016, the FASB issued ASU 2016-02, “Leases (Topic 842).” ASU 2016-02 requires that lessees recognize right-of-use assets and lease liabilities for any lease classified as either a finance or operating lease that is not considered short-term. The accounting applied by lessors is largely consistent from the existing lease standard. ASU 2016-02 is effective for fiscal years, and interim reporting periods within those years, beginning after December 15, 2018. The Company has obligations under lease agreements for facilities and equipment, which are classified as operating leases under the existing lease standard. While the Company is still evaluating the impact ASU 2016-02 will have on the consolidated results of operations, financial condition, or cash flows, the Company’s financial statements will reflect an increase in both assets and liabilities due to the requirement to recognize right-of-use assets and lease liabilities on the consolidated balance sheets for its facility and equipment leases.
25
In June 2014, the FASB issued ASU 2014-12, “Compensation—Stock Compensation (Topic 718): Accounting for Share-Based Payments When the Terms of an Award Provide That a Performance Target Could Be Achieved after the Requisite Service Period (a consensus of the FASB Emerging Issues Task Force).” ASU 2014-12 requires that a performance target that affects vesting and that could be achieved after the requisite service period be treated as a performance condition. ASU 2014-12 is effective for annual, and interim periods within those annual periods, beginning after December 15, 2015. The adoption of ASU 2014-12 on July 1, 2016 will not have an impact on the Company’s consolidated results of operations, financial condition, or cash flows.
In May 2014, the FASB issued ASU 2014-09, “Revenue from Contracts with Customers,” which outlines a single comprehensive model for entities to use in accounting for revenue arising from contracts with customers and supersedes most current revenue recognition guidance, including industry-specific guidance. ASU 2014-09 requires an entity to recognize revenue depicting the transfer of goods or services to customers in an amount that reflects the consideration to which the entity expects to be entitled in exchange for those goods or services. ASU 2014-09 will also result in enhanced revenue related disclosures. The guidance permits two methods of adoption: retrospectively to each prior reporting period presented or retrospectively with the cumulative effect of initially applying the guidance recognized at the date of initial application (the cumulative catch-up transition method). In July 2015, the FASB decided to defer the effective date of ASU 2014-09 by one year and subsequently issued ASU 2015-14, “Revenue from Contracts with Customers (Topic 606): Deferral of the Effective Date.” As a result, this standard, and subsequent amendments thereto, will be effective for fiscal years, and interim reporting periods within those years, beginning after December 15, 2017. While the Company is currently evaluating the impact of ASU 2014-09 on its consolidated results of operations, financial condition, or cash flows, the Company has concluded that it will adopt this standard on a modified retrospective basis, which results in a cumulative effect adjustment to retained earnings when the standard is adopted on July 1, 2018.
Note 4. Acquisitions and Divestiture
Acquisitions
RedBumper, LLC and NewCarIQ, LLC
On February 1, 2016, the Company acquired certain assets of RedBumper, LLC and NewCarIQ, LLC, providers of technology solutions for new and used car pricing. The Company had a pre-existing relationship with these entities under which CDK was a reseller of their products. The acquisitions were made pursuant to asset purchase agreements, which contain customary representations, warranties, covenants, and indemnities by the sellers and the Company. The acquisition date fair value of total consideration to be transferred was $32.4 million, which consists primarily of an initial cash price of $17.7 million and a liability for contingent consideration of $14.3 million. Contingent consideration payments occurring within three months following the acquisition date are classified within investing activities on the statement of cash flows; subsequent payments are included within financing activities. Accordingly, $0.4 million of contingent consideration payments made during the three months following the acquisition date are included in investing activities as cash paid for the acquisitions. The minimum contingent consideration payable under the asset purchase agreements is $14.7 million and is payable in installments over a four-year period; there is no maximum payment amount. The Company funded the initial payment with cash on hand.
The estimated fair value of acquired software intangible assets and other assets was $15.0 million and $0.6 million, respectively. The excess of the acquisition consideration over the estimated fair value of the acquired assets of $16.8 million was allocated to goodwill. The acquired assets and goodwill are included in the RSNA segment. The software intangible assets will be amortized over a weighted-average useful life of 8 years. The goodwill recognized from these acquisitions reflects expected synergies resulting from direct ownership of the products and processes, allowing greater flexibility for future product development and bundling, as opposed to licensing these products for sale. The acquired goodwill is deductible for tax purposes.
26
The fair values of intangible assets and the contingent consideration liability were based on a preliminary valuation analysis. These estimates and assumptions are subject to change within the one-year measurement period if additional information, which existed as of the acquisition date, becomes known to the Company.
The pro forma effects of these acquisitions are not significant to the Company’s reported results for any period presented. Accordingly, no pro forma financial statements have been presented herein.
AVRS, Inc.
On April 2, 2015, the Company, through its majority owned subsidiary, CVR, acquired AVRS, Inc. (“AVRS”), a provider of electronic vehicle registration software in California. The acquisition was made pursuant to an agreement of merger, which contains customary representations, warranties, covenants, and indemnities by the sellers and CVR. CVR acquired all of the outstanding stock of AVRS for an initial cash purchase price of $36.6 million, net of cash acquired of $4.4 million. The acquisition date fair value of total consideration to be transferred was $49.5 million, which includes a liability for contingent consideration of $3.9 million and a guaranteed payment to the sellers of $3.6 million, which were included within accrued expenses and other current liabilities on the consolidated balance sheet as of June 30, 2015.
The purchase price for this acquisition was allocated to the assets acquired and liabilities assumed based on their fair values as follows:
| Accounts receivable |
$ | 2.6 | ||
| Other current assets |
0.4 | |||
| Property, plant and equipment |
1.1 | |||
| Intangible assets |
19.3 | |||
| Accrued expenses and other current liabilities |
(6.6 | ) | ||
| Deferred tax liabilities |
(7.4 | ) | ||
|
|
|
|||
| Total identifiable net assets |
9.4 | |||
| Goodwill |
35.7 | |||
|
|
|
|||
| Net assets acquired |
$ | 45.1 | ||
|
|
|
The intangible assets acquired primarily relate to customer lists, software, and trademarks, which will be amortized over a weighted-average useful life of 12 years. The goodwill resulting from this acquisition reflects expected synergies resulting from adding AVRS products and processes to CVR’s current products and processes. This acquired goodwill is not deductible for tax purposes.
The pro forma effects of this acquisition are not significant to the Company’s reported results for any period presented. Accordingly, no pro forma financial statements have been presented herein.
During fiscal 2016, the Company recognized a measurement period adjustment related to the acquisition of AVRS that resulted in a $3.0 million reduction of goodwill.
Divestiture
The Company evaluates its businesses periodically in order to improve efficiencies in its operations and focus on the more profitable lines of business. On May 21, 2015, the Company sold its internet sales leads business, which was comprised of Dealix Corporation and Autotegrity, Inc., and operated in the RSNA segment. The Company did not have significant continuing involvement following the sale. The sale of the internet sales leads business unit did not constitute a strategic shift that will have a major effect on the Company’s financial results and business activities. Accordingly, this disposal did not qualify for discontinued operations presentation.
27
As a result of the sale, the Company recognized a loss of $0.8 million in selling, general and administrative expenses on the consolidated and combined statement of operations in fiscal 2015. In determining the loss on sale, $1.9 million of goodwill was allocated on a relative fair value basis comparing the fair value of the internet sales leads business to the fair value of the RSNA segment.
The following table summarizes revenues and earnings before taxes for the internet sales leads business unit:
| June 30, |
||||
| 2015 |
||||
| Revenues |
$ | 46.2 | ||
| Earnings before income taxes (1) |
2.5 | |||
| (1) | Earnings before income taxes for the fiscal year ended June 30, 2015 includes the loss of $0.8 million. |
Note 5. Restructuring
During fiscal 2015, the Company initiated a three-year business transformation plan intended to increase operating efficiency and improve the Company’s cost structure within its global operations. The business transformation plan is expected to produce significant benefits in the Company’s long-term business performance.
Restructuring expenses associated with the business transformation plan included employee-related costs, which represent severance and other termination-related benefits calculated based on long-standing benefit practices and local statutory requirements, and contract termination costs, which include costs to terminate facility leases. The Company expects to incur total restructuring expenses under the business transformation plan of approximately $55.0 million through fiscal 2018. The Company will continue to evaluate its estimate of total restructuring expenses as it executes the business transformation plan. The Company recognized $20.2 million and $2.4 million of restructuring expenses for fiscal 2016 and 2015, respectively. Since the inception of the business transformation plan in fiscal 2015, the Company has recognized cumulative restructuring expenses of $22.6 million. Restructuring expenses are presented separately on the consolidated and combined statements of operations. Restructuring expenses are recorded in the Other segment, as these initiatives are predominantly centrally directed and are not included in internal measures of segment operating performance.
Accruals for restructuring expenses were included within accrued expenses and other current liabilities on the consolidated balance sheets as of June 30, 2016 and 2015. The following table summarizes the fiscal 2016 activity for the restructuring accrual:
|
Employee- |
Contract |
Total |
||||||||||
| Balance as of June 30, 2015 |
$ | 2.4 | $ | — | $ | 2.4 | ||||||
| Charges |
17.7 | 2.9 | 20.6 | |||||||||
| Cash payments |
(10.6 | ) | (2.0 | ) | (12.6 | ) | ||||||
| Adjustments |
(0.4 | ) | — | (0.4 | ) | |||||||
| Foreign exchange |
(0.1 | ) | — | (0.1 | ) | |||||||
|
|
|
|
|
|
|
|||||||
| Balance as of June 30, 2016 |
$ | 9.0 | $ | 0.9 | $ | 9.9 | ||||||
|
|
|
|
|
|
|
|||||||
Note 6. Stock-Based Compensation
Incentive Equity Awards Converted from ADP Awards
On October 1, 2014, ADP’s outstanding equity awards for employees of the Company were converted into equity awards of CDK at a ratio of 2.757 CDK equity awards for every ADP equity award held immediately
28
prior to the spin-off. The converted equity awards have the same terms and conditions as the ADP equity awards. As a result, the Company issued 2.3 million stock options with a weighted-average exercise price of $19.64, 0.7 million time-based restricted shares, and 0.2 million performance-based restricted shares upon completion of the conversion of existing ADP equity awards into the Company’s equity awards. As the conversion was considered a modification of an award in accordance with ASC 718, “Compensation—Stock Compensation,” the Company compared the fair value of the award immediately prior to the spin-off to the fair value immediately after the spin-off to measure the incremental compensation cost. The fair values immediately prior to and after the spin-off were estimated using a binomial option-pricing model. The conversion resulted in an increase in the fair value of the awards by $1.4 million, which was recognized in full as of June 30, 2016.
Incentive Equity Awards Granted by the Company
The 2014 Omnibus Award Plan (“2014 Plan”) provides for the granting of incentive stock options, nonqualified stock options, stock appreciation rights, restricted stock, restricted stock units, other stock-based awards, and performance compensation awards to employees, directors, officers, consultants, advisors, and those of the Company’s affiliates. The 2014 Plan provides for an aggregate of 12.0 million shares of the Company’s common stock to be reserved for issuance and is effective for a period of ten years. As of June 30, 2016, there were 7.4 million shares available for issuance under the 2014 Plan after considering awards granted by the Company and converted as a result of the spin-off from ADP. In fiscal 2016, the Company began reissuing treasury stock to satisfy issuances of common stock upon option exercise or vesting.
Prior to the spin-off, all employee equity awards (stock options and restricted stock) were granted by ADP. All subsequent awards, including all incentive equity awards converted from ADP awards, were granted under the 2014 Plan. The Company recognizes stock-based compensation expense associated with employee equity awards in net earnings based on the fair value of the awards on the date of grant. Stock-based compensation primarily consisted of the following:
Stock Options: Stock options are granted to employees at exercise prices equal to the fair market value of the Company’s common stock on the date of grant. Stock options are issued under a graded vesting schedule with a term of ten years. Compensation expense is measured based on the fair value of the stock option on the grant date and recognized over the requisite service period for each separately vesting portion of the stock option award. Upon termination of employment, unvested stock options are evaluated for forfeiture or modification, subject to the terms of the awards and Company policies.
Time-Based Restricted Stock and Time-Based Restricted Stock Units. Time-based restricted stock and restricted stock units generally vest over a two- to five-year period. Upon termination of employment, unvested awards are evaluated for forfeiture or modification, subject to the terms of the awards and Company policies.
Time-based restricted stock cannot be transferred during the vesting period. Compensation expense related to the issuance of time-based restricted stock is measured based on the fair value of the award on the grant date and recognized on a straight-line basis over the vesting period. Employees are eligible to receive dividends on the shares awarded under the time-based restricted stock program during the restricted period.
Time-based restricted stock units are primarily settled in cash, but may also be settled in stock. Compensation expense related to the issuance of time-based restricted stock units is recorded over the vesting period, and is initially based on the fair value of the award on the grant date. Cash settled, time-based restricted stock units are subsequently remeasured at each reporting date during the vesting period to the current stock value. No dividend equivalents are paid on units awarded under the time-based restricted stock unit program during the restricted period.
Performance-Based Restricted Stock and Performance-Based Restricted Stock Units. Performance-based restricted stock generally vests over a one-year performance period and performance-based restricted stock
29
units generally vest over a three-year performance period. Certain performance-based awards are further subject to adjustment (increase or decrease) based on a market condition defined as total shareholder return of the Company’s common stock compared to a peer group of companies. Under these programs, the Company communicates “target awards” at the beginning of the performance period with possible payouts at the end of the performance period ranging from 0% to 250% of the “target awards.” The probability associated with the achievement of performance conditions affects the vesting of the Company’s performance-based awards. Expense is only recognized for those shares expected to vest. Upon termination of employment, unvested awards are evaluated for forfeiture or modification, subject to the terms of the awards and Company policies.
Performance-based restricted stock cannot be transferred during the vesting period. Compensation expense related to the issuance of performance-based restricted stock is measured based upon the fair value of the award on the grant date and recognized on a straight-line basis over the vesting period.
Performance-based restricted stock units are settled in either cash or stock, depending on the employee’s home country, and cannot be transferred during the vesting period. Compensation expense related to the issuance of performance-based restricted stock units settled in cash is recorded over the vesting period, is initially based on the fair value of the award on the grant date, and is subsequently remeasured at each reporting date to the current stock value during the performance period. Compensation expense related to the issuance of performance-based restricted stock units settled in stock is recorded over the vesting period based on the fair value of the award on the grant date. Prior to settlement, dividend equivalents are paid on awards under the performance-based restricted stock unit program.
The following table represents stock-based compensation expense and the related income tax benefits for fiscal 2016 and 2015, respectively:
| June 30, |
||||||||
| 2016 |
2015 |
|||||||
| Cost of revenues |
$ | 6.2 | $ | 7.8 | ||||
| Selling, general and administrative expenses |
30.2 | 22.6 | ||||||
|
|
|
|
|
|||||
| Total pre-tax stock-based compensation expense |
$ | 36.4 | $ | 30.4 | ||||
|
|
|
|
|
|||||
| Income tax benefit |
$ | 12.9 | $ | 10.1 | ||||
|
|
|
|
|
|||||
Stock-based compensation expense for fiscal 2016 consisted of $31.4 million of expense related to equity-classified awards and $5.0 million of expense related to liability-classified awards. Stock-based compensation expense for fiscal 2016 includes $3.5 million of incremental stock-based compensation expense for awards that were modified or expense recognition was accelerated related to the Transition and Release Agreement entered into with Mr. Anenen on February 2, 2016. Stock-based compensation expense for fiscal 2015 consisted of $17.5 million of expense related to equity-classified awards, $7.5 million of expense related to liability-classified awards, and $5.4 million of expense allocated from ADP during fiscal 2015 prior to the spin-off.
As of June 30, 2016, the total unrecognized compensation cost related to non-vested stock options, restricted stock units, and restricted stock awards was $1.0 million, $20.5 million, and $9.0 million, respectively, which will be amortized over the weighted-average remaining requisite service periods of 1.7 years, 1.6 years, and 1.3 years, respectively.
30
The activity related to the Company’s incentive equity awards for fiscal 2016 consisted of the following:
Stock Options
| Number of Options (in thousands) |
Weighted- (in dollars) |
Weighted- |
Aggregate |
|||||||||||||
| Options outstanding as of June 30, 2015 |
2,021 | $ | 24.88 | |||||||||||||
| Options granted |
147 | 50.80 | ||||||||||||||
| Options exercised |
(400 | ) | 17.11 | |||||||||||||
| Options canceled |
(174 | ) | 39.31 | |||||||||||||
|
|
|
|||||||||||||||
| Options outstanding as of June 30, 2016 |
1,594 | $ | 27.64 | 6.6 | $ | 44.4 | ||||||||||
|
|
|
|||||||||||||||
| Vested and expected to vest as of June 30, 2016 |
1,589 | $ | 27.60 | 6.5 | $ | 44.3 | ||||||||||
| Exercisable as of June 30, 2016 |
953 | $ | 21.97 | 5.6 | $ | 31.8 | ||||||||||
The Company received proceeds from the exercise of stock options of $6.7 million and $9.8 million during fiscal 2016 and 2015, respectively. The aggregate intrinsic value of stock options exercised during fiscal 2016 and 2015 was approximately $12.4 million and $17.5 million, respectively.
Time-Based Restricted Stock and Time-Based Restricted Stock Units
| Restricted Stock |
Restricted Stock Units |
|||||||||||||||
| Number of Shares (in thousands) |
Weighted- Average Grant Date Fair Value (in dollars) |
Number of Units (in thousands) |
Weighted- Average Grant Date Fair Value (in dollars) |
|||||||||||||
| Non-vested restricted shares/units as of June 30, 2015 |
967 | $ | 29.36 | 300 | $ | 31.12 | ||||||||||
| Restricted shares/units granted |
263 | 50.82 | 183 | 47.07 | ||||||||||||
| Restricted shares/units vested |
(498 | ) | 26.65 | (195 | ) | 31.11 | ||||||||||
| Restricted shares/units forfeited |
(116 | ) | 38.17 | (17 | ) | 34.58 | ||||||||||
|
|
|
|
|
|||||||||||||
| Non-vested restricted shares/units as of June 30, 2016 |
616 | $ | 40.93 | 271 | $ | 53.09 | ||||||||||
|
|
|
|
|
|||||||||||||
Performance-Based Restricted Stock and Performance-Based Restricted Stock Units
| Restricted Stock |
Restricted Stock Units |
|||||||||||||||
| Number of Shares (in thousands) |
Weighted- Average Grant Date Fair Value (in dollars) |
Number of Units (in thousands) |
Weighted- Average Grant Date Fair Value (in dollars) |
|||||||||||||
| Non-vested restricted shares/units as of June 30, 2015 |
70 | $ | 25.90 | 222 | $ | 32.90 | ||||||||||
| Restricted shares/units granted |
— | — | 425 | 50.25 | ||||||||||||
| Dividend equivalents |
— | — | 5 | 47.44 | ||||||||||||
| Restricted shares/units vested |
(70 | ) | 25.90 | (114 | ) | 39.63 | ||||||||||
| Restricted shares/units forfeited |
— | — | (62 | ) | 50.45 | |||||||||||
|
|
|
|
|
|||||||||||||
| Non-vested restricted shares/units as of June 30, 2016 |
— | $ | — | 476 | $ | 55.63 | ||||||||||
|
|
|
|
|
|||||||||||||
The Monte Carlo simulation model used to determine the grant date fair value of the three-year performance-based restricted stock units granted in fiscal 2016 used an expected volatility based on historical stock price volatility for the Company and the peer companies, the average of which was 31.5% and a risk-free interest rate of 1.1%. Because these awards earn dividend equivalents, the model did not assume an expected dividend yield.
31
The following table presents the assumptions used to determine the fair value of the stock options granted by the Company following the spin-off, and converted from ADP awards to CDK awards at the time of the spin-off:
| Fiscal 2015 |
||||||||||||
| Fiscal |
Post |
Spin-Off |
||||||||||
| Risk-free interest rate |
1.8 | % | 1.6 | % | 1.1 | % | ||||||
| Dividend yield |
0.9 | % | 1.1 | % | 1.1 | % | ||||||
| Weighted-average volatility factor |
24.7 | % | 25.6 | % | 23.9 | % | ||||||
| Weighted-average expected life (in years) |
6.3 | 6.3 | 3.4 | |||||||||
| Weighted-average fair value (in dollars) |
$ | 12.55 | $ | 10.24 | $ | 12.50 | ||||||
Note 7. Employee Benefit Plans
Defined Contribution Savings Plan. The Company’s Board of Directors approved a CDK-sponsored defined contribution plan covering eligible full-time domestic employees of the Company after the spin-off date. This plan provides company matching contributions on a portion of employee contributions. In addition, this plan includes a transitional contribution for certain employees who were previously eligible to participate under ADP’s domestic defined benefit plan since the Company did not adopt a similar plan. The costs recorded by the Company for this plan were $18.9 million and $12.4 million for fiscal 2016 and 2015, respectively.
Prior to the spin-off, most domestic employees were covered under ADP’s defined contribution plan. This 401(k) plan provided company matching under various formulas. Costs allocated to the Company for domestic associates for fiscal 2015 prior to the spin-off were $4.0 million.
International Savings Plan. The Company’s foreign subsidiaries have retirement savings-type plans that cover certain international employees. The Company funds these retirement savings-type plans through periodic contributions under statutorily prescribed formulas. The Company’s expense for these plans was approximately $14.1 million, and $12.9 million, for fiscal 2016, and 2015, respectively.
Defined Benefit Pension Plans. Prior to the spin-off, certain employees of the Company were covered by ADP’s domestic defined benefit plans. In addition, certain employees of the Company were part of ADP’s Supplemental Officer Retirement Plan (“SORP”). The SORP is a defined benefit plan pursuant to which ADP will pay supplemental pension benefits to certain key officers upon retirement based upon the officers’ years of service and compensation. Liabilities and assets related to these plans remained with ADP. Domestic pension expense allocated to the Company for fiscal 2015 prior to the spin-off was $0.6 million. SORP expense allocated to the Company for fiscal 2015 prior to the spin-off was $0.4 million. The Company did not adopt a defined benefit plan or SORP plan for CDK employees in connection with the spin-off.
Note 8. Income Taxes
Tax Matters Agreement
The Company and ADP entered into a tax matters agreement as part of the spin-off that governs the rights and obligations of both parties after the spin-off with respect to taxes for both pre and post spin-off periods. Under this agreement, ADP is generally required to indemnify the Company for any income taxes attributable to ADP’s operations or the Company’s operations and for any non-income taxes attributable to ADP’s operations, in each case for all pre spin-off periods as well as any taxes arising from transactions effected to consummate the spin-off, and the Company generally is required to indemnify ADP for any non-income taxes attributable to the Company’s operations for all pre spin-off periods and for any income taxes attributable to the Company’s operations for post spin-off periods.
32
The Company is generally required to indemnify ADP against any tax resulting from the spin-off (and against any claims made against ADP in respect of any tax imposed on its stockholders), in each case if that tax results from (i) an issuance of a significant amount of the Company’s equity securities, a redemption of a significant amount of the Company’s equity securities or the Company’s involvement in other significant acquisitions of the Company’s equity securities (excluding the spin-off), (ii) other actions or failures to act by the Company, or (iii) any of the Company’s representations or undertakings referred to in the tax matters agreement being incorrect or violated. ADP will generally be required to indemnify the Company for any tax resulting from the spin-off if that tax results from (a) ADP’s issuance of its equity securities, redemption of its equity securities, or involvement in other acquisitions of its equity securities, (b) other actions or failures to act by ADP, or (c) any of ADP’s representations or undertakings referred to in the tax matters agreement being incorrect or violated.
The Company recognized receivables from ADP of $1.1 million and $0.5 million as of June 30, 2016 and 2015, respectively, and payables to ADP of $1.6 million and $3.7 million as of June 30, 2016 and 2015, respectively, under the tax matters agreement. In accordance with the tax matters agreement, the Company recognized a net gain of $2.6 million in fiscal 2016 in other income, net in the consolidated statement of operations associated with an indemnification receivable from ADP for pre spin-off tax periods and a net loss of $1.1 million in fiscal 2015 in other income, net in the consolidated and combined statement of operations associated with an indemnification payable to ADP for pre spin-off tax refunds.
Provision for Income Taxes
Prior to the spin-off, the provision for income taxes and the income tax balances were calculated as if the Company filed income tax returns separate from ADP. Subsequent to the spin-off, the provision for income tax and income tax balances represent the Company’s income tax liabilities as an independent company.
Earnings before income taxes presented below is based on the geographic location to which such earnings were attributable.
| June 30, |
||||||||
| 2016 |
2015 |
|||||||
| Earnings before income taxes: |
||||||||
| U.S. |
$ | 293.1 | $ | 224.7 | ||||
| Foreign |
76.0 | 75.2 | ||||||
|
|
|
|
|
|||||
| $ | 369.1 | $ | 299.9 | |||||
|
|
|
|
|
|||||
The provision (benefit) for income taxes consisted of the following components:
| June 30, |
||||||||
| 2016 |
2015 |
|||||||
| Current: |
||||||||
| Federal |
$ | 84.9 | $ | 104.6 | ||||
| Foreign |
24.5 | 18.3 | ||||||
| State |
16.5 | 16.0 | ||||||
|
|
|
|
|
|||||
| Total current |
125.9 | 138.9 | ||||||
| Deferred: |
||||||||
| Federal |
(3.3 | ) | (19.2 | ) | ||||
| Foreign |
1.3 | (2.3 | ) | |||||
| State |
(1.6 | ) | (3.8 | ) | ||||
|
|
|
|
|
|||||
| Total deferred |
(3.6 | ) | (25.3 | ) | ||||
|
|
|
|
|
|||||
| Total provision for income taxes |
$ | 122.3 | $ | 113.6 | ||||
|
|
|
|
|
|||||
33
A reconciliation between the Company’s effective tax rate and the U.S. federal statutory rate is as follows:
| June 30, |
||||||||||||||||
| 2016 |
% |
2015 |
% |
|||||||||||||
| Provision for taxes at U.S. statutory rate |
$ | 129.2 | 35.0 | % | $ | 105.0 | 35.0 | % | ||||||||
| Increase (decrease) in provision from: |
||||||||||||||||
| State taxes, net of federal benefit |
9.7 | 2.6 | % | 8.8 | 2.9 | % | ||||||||||
| Noncontrolling interest |
(2.5 | ) | (0.7 | )% | (2.8 | ) | (0.9 | )% | ||||||||
| Foreign tax rate differential |
(7.8 | ) | (2.1 | )% | (4.3 | ) | (1.4 | )% | ||||||||
| Tax on repatriated foreign earnings |
0.8 | 0.2 | % | — | — | % | ||||||||||
| Foreign tax credits |
(1.5 | ) | (0.4 | )% | (1.7 | ) | (0.6 | )% | ||||||||
| Resolution of tax matters |
— | — | % | (3.4 | ) | (1.1 | )% | |||||||||
| Non-deductible separation costs |
— | — | % | 7.8 | 2.6 | % | ||||||||||
| Tax law changes |
— | — | % | 4.6 | 1.5 | % | ||||||||||
| Capital losses |
— | — | % | (29.2 | ) | (9.7 | )% | |||||||||
| Valuation allowances |
1.1 | 0.3 | % | 27.1 | 9.0 | % | ||||||||||
| Domestic production activities deduction |
(6.4 | ) | (1.7 | )% | — | — | % | |||||||||
| Pre spin-off tax return adjustments |
(0.4 | ) | (0.1 | )% | 0.5 | 0.2 | % | |||||||||
| Other |
0.1 | — | % | 1.2 | 0.4 | % | ||||||||||
|
|
|
|
|
|
|
|
|
|||||||||
| Provision for income taxes |
$ | 122.3 | 33.1 | % | $ | 113.6 | 37.9 | % | ||||||||
|
|
|
|
|
|
|
|
|
|||||||||
During fiscal 2015, the Company incurred non-deductible separation costs which unfavorably impacted the effective tax rate.
On December 19, 2014, the Tax Increase Prevention Act of 2014 was signed into law. Among the changes included in the law was a provision allowing for additional first year depreciation for assets placed into service during calendar year 2015, commonly known as “bonus depreciation.” The bonus depreciation provision related to pre spin-off tax periods for which ADP was entitled under the tax law and in accordance with the tax matters agreement to claim additional tax depreciation for assets associated with the Company’s business. During fiscal 2015, the Company recorded tax expense of $4.6 million to adjust deferred taxes for the additional tax depreciation to be taken by ADP in pre spin-off tax periods.
34
The balance sheet classification and significant components of deferred income tax assets and liabilities are as follows:
| June 30, |
||||||||
| 2016 |
2015 |
|||||||
| Classification: |
||||||||
| Current deferred tax assets (included in other current assets) |
$ | — | 13.0 | |||||
| Current deferred tax liabilities (included in accrued expenses and other current liabilities) |
— | (1.4 | ) | |||||
| Long term deferred tax assets (included in other assets) |
23.9 | 17.8 | ||||||
| Long term deferred tax liabilities (included in deferred income taxes) |
(46.9 | ) | (58.2 | ) | ||||
|
|
|
|
|
|||||
| Net deferred tax liabilities |
$ | (23.0 | ) | (28.8 | ) | |||
|
|
|
|
|
|||||
| Components: |
||||||||
| Deferred tax assets: |
||||||||
| Accrued expenses |
$ | 15.4 | 9.4 | |||||
| Compensation and benefits |
57.7 | 41.2 | ||||||
| Deferred revenue |
57.6 | 32.0 | ||||||
| Net operating losses |
13.5 | 15.1 | ||||||
| Capital losses |
28.7 | 29.2 | ||||||
|
|
|
|
|
|||||
| 172.9 | 126.9 | |||||||
| Less: valuation allowances |
(34.3 | ) | (33.4 | ) | ||||
|
|
|
|
|
|||||
| Net deferred tax assets |
138.6 | 93.5 | ||||||
| Deferred tax liabilities: |
||||||||
| Deferred expenses |
76.6 | 54.5 | ||||||
| Property, plant and equipment and intangible assets |
76.5 | 62.5 | ||||||
| Prepaid expenses |
5.9 | 4.9 | ||||||
| Other |
2.6 | 0.4 | ||||||
|
|
|
|
|
|||||
| Deferred tax liabilities |
161.6 | 122.3 | ||||||
|
|
|
|
|
|||||
| Net deferred tax liabilities |
$ | (23.0 | ) | (28.8 | ) | |||
|
|
|
|
|
|||||
As discussed in Note 3, the Company adopted a new accounting standard in fiscal 2016 that requires non-current classification of all deferred tax assets and liabilities. The standard was adopted prospectively. Accordingly, the Company did not adjust the classification of deferred tax assets and liabilities in the consolidated balance sheet as of June 30, 2015.
Undistributed foreign earnings that the Company intends to indefinitely reinvest, and for which no taxes have been provided, aggregated to approximately $166.4 million as of June 30, 2016. During fiscal 2016, the Company concluded that $31.6 million of prior year earnings of certain foreign subsidiaries were no longer considered indefinitely reinvested and recognized income tax expense of $0.8 million for the associated foreign withholding and U.S. income taxes, net of foreign tax credits. The foreign earnings identified for repatriation during the third quarter of fiscal 2016 in order to manage worldwide cash in a tax-efficient manner were repatriated to the U.S. during the fourth quarter of fiscal 2016. The remaining foreign earnings are considered indefinitely reinvested since the Company’s intent is to use these earnings outside of the U.S. to fund local working capital needs and future foreign investments, including potential acquisitions, and the U.S. can meet its cash needs without repatriation of foreign cash.
The Company had federal net operating losses of approximately $7.2 million as of June 30, 2016 which expire in 2018 through 2035. The Company had federal capital losses of $75.5 million which expire in 2020 and state capital losses of $75.5 million which expire in 2020 through 2030. The Company had foreign net operating
35
loss carryforwards of approximately $39.3 million as of June 30, 2016, of which $11.1 million expires in 2017 through 2035 and $28.2 million has an indefinite carryforward period.
Valuation Allowance
The Company recorded valuation allowances of $34.3 million and $33.4 million as of June 30, 2016 and 2015, respectively, because the Company has concluded it is more likely than not that it will be unable to utilize net operating and capital loss carryforwards of certain subsidiaries to offset future taxable earnings. As of each reporting date, the Company’s management considers new evidence, both positive and negative, which could impact management’s view with regard to future realization of deferred tax assets.
During fiscal 2016, the Company determined that sufficient positive evidence did not exist to realize certain foreign deferred tax assets. Based on a three-year cumulative loss position and forecasts of future year pre-tax income, the Company increased the valuation allowance by $1.1 million in relation to these deferred tax assets. The valuation allowance for 2016 was also adjusted for current year deferred tax movements and foreign currency translation.
During fiscal 2015, based on achieving three years of cumulative pre-tax income and forecasts of future pre-tax income, management determined that sufficient positive evidence existed to conclude that it is more likely than not that certain non-U.S. tax losses were realizable, and therefore, recorded tax benefits to adjust the valuation allowance by $2.7 million. In addition, tax expense was recorded to increase the deferred tax valuation allowance in fiscal 2015 by $29.2 million for capital losses realized on the internet sales leads business disposition. The Company concluded a full valuation allowance against the capital losses was necessary due to the short carryforward period and limitations on the Company’s ability to utilize the losses to offset income. The net impact of the adjustments related to the deferred tax valuation allowance and the capital losses realized on the internet sales leads business disposition are included in the fiscal 2015 effective tax rate reconciliation. The valuation allowance for fiscal 2015 was also impacted by foreign currency translation.
Income tax payments, net of refunds were $109.4 million and $120.8 million for fiscal 2016 and 2015, respectively. The income tax payments exclude payments made by ADP prior to the spin-off on behalf of the Company as these amounts are recorded within group equity in the historical combined financial statements. Income tax payments paid by ADP on behalf of the Company were $20.3 million for fiscal 2015.
Unrecognized Income Tax Benefits
As of June 30, 2016 and 2015, the Company had unrecognized income tax benefits of $4.7 million and $1.9 million, respectively, of which $3.6 million and $1.6 million, respectively, would impact the effective tax rate, if recognized. The remainder, if recognized, would principally affect deferred taxes.
A roll-forward of unrecognized tax benefits is as follows:
| June 30, |
||||||||
| 2016 |
2015 |
|||||||
| Beginning of the year balance |
$ | 1.9 | $ | 0.2 | ||||
| Additions for current year tax positions |
1.9 | 0.6 | ||||||
| Additions for tax positions of prior years |
1.1 | 1.1 | ||||||
| Reductions for tax positions of prior years |
(0.1 | ) | — | |||||
| Settlement with tax authorities |
— | — | ||||||
| Expiration of the statute of limitations |
— | — | ||||||
| Impact of foreign exchange rate fluctuations |
(0.1 | ) | — | |||||
|
|
|
|
|
|||||
| End of year balance |
$ | 4.7 | $ | 1.9 | ||||
|
|
|
|
|
|||||
36
During fiscal 2016 and 2015, the Company increased its unrecognized income tax benefits by $2.8 million and $1.7 million, respectively, based on information that indicated the extent to which certain tax positions were more likely than not to be sustained. Penalties and interest expense associated with uncertain tax positions have been recorded in the provision for income taxes on the consolidated and combined statements of operations. Penalties and interest incurred during fiscal 2016 and 2015 were not significant. As of June 30, 2016 and 2015, the Company had an insignificant amount of accrued penalty and interest associated with uncertain tax positions, which was included within other liabilities on the consolidated balance sheets.
The Company conducts business globally and, as a result, files income tax returns in the U.S. federal jurisdiction and various state, local and foreign jurisdictions. In the normal course of business, the Company is subject to examination by taxing authorities. The tax years currently under examination vary by jurisdiction. The Company is included in the U.S. Internal Revenue Service (“IRS”) examination of ADP’s consolidated federal tax returns through the tax year ended September 30, 2014. In fiscal 2016, ADP reached agreement with the IRS regarding all outstanding audit issues for tax years through and including June 30, 2014, which did not have a material impact on the consolidated and combined financial statements of the Company. The Company is currently under examination by the IRS for the tax year ending June 30, 2015. The Company regularly considers the likelihood of assessments in each of the jurisdictions resulting from examinations. The Company has established a liability for unrecognized income tax benefits which it believes to be adequate in relation to the potential assessments. Once established, the liability for unrecognized tax benefits is adjusted when there is more information available, when an event occurs necessitating a change, or the statute of limitations for the relevant taxing authority to examine the tax position has expired.
Examinations currently in progress in which the Company has significant business operations are as follows:
| Tax Jurisdictions |
Fiscal Years Ended | |
| U.S. (IRS) | 9/30/2014 thru 6/30/2015 | |
| New Jersey | 6/30/2008 thru 6/30/2011 | |
| Canada | 6/30/2012 thru 6/30/2015 | |
| Kuwait | 6/30/2011 thru 6/30/2012 | |
| Spain | 6/30/2010 |
Based on the possible outcomes of the Company’s tax audits and expiration of the statute of limitations, it is reasonably possible that the liability for uncertain tax positions will change within the next twelve months. The associated net tax impact on the effective tax rate is estimated to be a $1.2 million tax benefit, with minimal cash payments.
Although the final resolution of the Company’s tax disputes is uncertain, based on current information, the resolution of tax matters is not expected to have a material effect on the Company’s consolidated financial condition, liquidity, or results of operations. However, an unfavorable resolution could have a material impact on the Company’s consolidated financial condition, liquidity, or results of operations in the periods in which the matters are ultimately resolved.
Note 9. Earnings per Share
The numerator for both basic and diluted earnings per share is net earnings attributable to CDK. The denominator for basic and diluted earnings per share is based upon the number of weighted-average shares of the Company’s common stock outstanding during the reporting periods. Diluted earnings per share also reflects the dilutive effect of unexercised in-the-money stock options and unvested restricted stock. On September 30, 2014, ADP stockholders of record as of the close of business on September 24, 2014 received one share of the Company’s common stock for every three shares of ADP common stock held as of the record date. For periods ended September 30, 2014 and prior, basic and diluted earnings per share were computed using the number of
37
shares of the Company’s stock outstanding on September 30, 2014, the date on which the Company’s common stock was distributed to the stockholders of ADP. The same number of shares was used to calculate basic and diluted earnings per share for fiscal 2014 since there were no dilutive securities until after the spin-off.
Holders of certain stock-based compensation awards are eligible to receive dividends as described in Note 6. Net earnings allocated to participating securities were not significant for fiscal 2016 and 2015.
The following table summarizes the components of basic and diluted earnings per share.
| June 30, |
||||||||
| 2016 |
2015 |
|||||||
| Net earnings attributable to CDK |
$ | 239.3 | $ | 178.4 | ||||
| Weighted-average shares outstanding: |
||||||||
| Basic |
157.0 | 160.6 | ||||||
| Effect of employee stock options |
0.5 | 0.5 | ||||||
| Effect of employee restricted stock |
0.5 | 0.5 | ||||||
|
|
|
|
|
|||||
| Diluted |
158.0 | 161.6 | ||||||
|
|
|
|
|
|||||
| Basic earnings attributable to CDK per share |
$ | 1.52 | $ | 1.11 | ||||
| Diluted earnings attributable to CDK per share |
$ | 1.51 | $ | 1.10 | ||||
There were no options to purchase common stock or unvested restricted stock excluded from the calculation of diluted earnings per share for periods prior to the spin-off. The weighted-average number of shares outstanding used in the calculation of diluted earnings per share does not include the effect of the following anti-dilutive securities.
| June 30, |
||||||||
| 2016 |
2015 |
|||||||
| Stock-based awards |
0.5 | 0.3 | ||||||
Note 10. Accounts Receivable, Net
Accounts receivable, net comprised of the following:
| June 30, |
||||||||
| 2016 |
2015 |
|||||||
| Trade receivables |
$ | 359.6 | $ | 306.5 | ||||
| Lease receivables |
13.0 | 14.9 | ||||||
|
|
|
|
|
|||||
| Accounts receivable, gross |
372.6 | 321.4 | ||||||
| Less: allowances |
7.1 | 6.8 | ||||||
|
|
|
|
|
|||||
| Account receivable, net |
$ | 365.5 | $ | 314.6 | ||||
|
|
|
|
|
|||||
The investment in lease receivables consisted of the following:
| June 30, |
||||||||
| 2016 |
2015 |
|||||||
| Lease receivables, gross: |
||||||||
| Minimum lease payments |
$ | 38.0 | $ | 51.6 | ||||
| Unearned income |
(3.2 | ) | (5.1 | ) | ||||
|
|
|
|
|
|||||
| 34.8 | 46.5 | |||||||
| Less: lease receivables, current (included in accounts receivable, net) |
13.0 | 14.9 | ||||||
|
|
|
|
|
|||||
| Lease receivables, long-term (included in other assets) |
$ | 21.8 | $ | 31.6 | ||||
|
|
|
|
|
|||||
38
Scheduled minimum payments on lease receivables as of June 30, 2016 were as follows:
| Amount |
||||
| Fiscal year ending 2017 |
$ | 14.8 | ||
| Fiscal year ending 2018 |
11.5 | |||
| Fiscal year ending 2019 |
7.9 | |||
| Fiscal year ending 2020 |
3.6 | |||
| Fiscal year ending 2021 |
0.2 | |||
|
|
|
|||
| $ | 38.0 | |||
|
|
|
|||
The Company recognized interest income on sales-type leases of $2.4 million and $3.4 million in fiscal 2016 and 2015, respectively, within other income, net on the consolidated and combined statements of operations.
Note 11. Property, Plant and Equipment, Net
Depreciation expense for property, plant and equipment was $35.1 million and $28.3 million for fiscal 2016 and 2015, respectively. Property, plant, and equipment at cost and accumulated depreciation consisted of the following:
| June 30, |
||||||||
| 2016 |
2015 |
|||||||
| Property, plant and equipment: |
||||||||
| Land and buildings |
$ | 38.7 | $ | 41.5 | ||||
| Data processing equipment |
188.6 | 161.7 | ||||||
| Furniture and fixtures, leasehold improvements, and other |
86.2 | 81.8 | ||||||
|
|
|
|
|
|||||
| Total property, plant and equipment |
313.5 | 285.0 | ||||||
| Less: accumulated depreciation |
194.9 | 185.0 | ||||||
|
|
|
|
|
|||||
| Property, plant and equipment, net |
$ | 118.6 | $ | 100.0 | ||||
|
|
|
|
|
|||||
Note 12. Goodwill and Intangible Assets, Net
In July 2016, the Company revised its reportable segments and reporting units due to how the chief operating decision maker regularly reviews information for purposes of allocating resources and assessing performance. Due to the change in organization structure, the Company expanded its reporting units from three to five. As a result, goodwill was reallocated to the new reporting units using a relative fair value approach. The indicated fair values substantially exceeded the carrying values of all reporting units. Goodwill has been restated to reflect the reallocation of goodwill based on the current reportable segments. Refer to Note 18 for further information.
Changes in goodwill were as follows:
|
Retail |
Advertising |
CDK |
Total |
|||||||||||||
| Balance as of June 30, 2015 |
592.1 | 214.3 | 403.5 | 1,209.9 | ||||||||||||
|
|
|
|
|
|
|
|
|
|||||||||
| Additions (Note 4) |
16.8 | — | — | 16.8 | ||||||||||||
| Measurement period adjustment (Note 4) |
(3.0 | ) | — | — | (3.0 | ) | ||||||||||
| Currency translation adjustments |
(1.2 | ) | — | (39.8 | ) | (41.0 | ) | |||||||||
|
|
|
|
|
|
|
|
|
|||||||||
| Balance as of June 30, 2016 |
$ | 604.7 | $ | 214.3 | $ | 363.7 | $ | 1,182.7 | ||||||||
|
|
|
|
|
|
|
|
|
|||||||||
39
Components of intangible assets, net were as follows:
| June 30, |
||||||||||||||||||||||||
| 2016 |
2015 |
|||||||||||||||||||||||
| Original |
Accumulated |
Intangible |
Original |
Accumulated |
Intangible |
|||||||||||||||||||
| Customer lists |
$ | 175.5 | $ | (117.5 | ) | $ | 58.0 | $ | 199.1 | $ | (125.5 | ) | $ | 73.6 | ||||||||||
| Software |
141.0 | (96.1 | ) | 44.9 | 115.6 | (92.0 | ) | 23.6 | ||||||||||||||||
| Trademarks |
25.0 | (23.5 | ) | 1.5 | 25.0 | (22.9 | ) | 2.1 | ||||||||||||||||
| Other intangibles |
6.1 | (2.7 | ) | 3.4 | 2.4 | (2.4 | ) | — | ||||||||||||||||
|
|
|
|
|
|
|
|
|
|
|
|
|
|||||||||||||
| $ | 347.6 | $ | (239.8 | ) | $ | 107.8 | $ | 342.1 | $ | (242.8 | ) | $ | 99.3 | |||||||||||
|
|
|
|
|
|
|
|
|
|
|
|
|
|||||||||||||
In October 2014 following the spin-off from ADP, the Company evaluated its branding strategy and the trademark names under which each of its businesses will operate. The Company determined that the Cobalt trademark used by the North American segments will no longer be used. Therefore, the Company revised the estimated useful life assigned to the Cobalt trademark. The Company recognized accelerated amortization on the trademark of $15.6 million in cost of revenues during fiscal 2015. The effect of this change in estimate on both basic and diluted earnings per share, net of the related tax effect, was $0.06 for fiscal 2015.
Other intangibles consist primarily of purchased rights, covenants, and patents (acquired directly or through acquisitions). All of the intangible assets have finite lives and, as such, are subject to amortization. The weighted-average remaining useful life of intangible assets is 6 years (7 years for customer lists, 4 years for software and software licenses, and 3 years for trademarks). Amortization of intangible assets was $28.9 million and $48.2 million for fiscal 2016 and 2015, respectively.
Estimated amortization expenses of the Company’s existing intangible assets as of June 30, 2016 were as follows:
| Amount |
||||
| Fiscal year ending 2017 |
$ | 29.4 | ||
| Fiscal year ending 2018 |
24.5 | |||
| Fiscal year ending 2019 |
14.7 | |||
| Fiscal year ending 2020 |
9.5 | |||
| Fiscal year ending 2021 |
9.3 | |||
| Thereafter |
20.4 | |||
|
|
|
|||
| $ | 107.8 | |||
|
|
|
|||
40
Note 13. Debt
Debt comprised of the following:
| June 30, |
||||||||
| 2016 |
2015 |
|||||||
| Revolving credit facility |
$ | — | $ | — | ||||
| 2019 term loan facility |
228.1 | 240.6 | ||||||
| 2020 term loan facility |
243.8 | — | ||||||
| 3.30% senior notes, due 2019 |
250.0 | 250.0 | ||||||
| 4.50% senior notes, due 2024 |
500.0 | 500.0 | ||||||
| Capital lease obligations |
3.6 | 1.5 | ||||||
| Unamortized debt financing costs |
(8.4 | ) | (8.0 | ) | ||||
|
|
|
|
|
|||||
| Total debt and capital lease obligations |
1,217.1 | 984.1 | ||||||
| Current maturities of long-term debt and capital lease obligations |
26.8 | 13.0 | ||||||
|
|
|
|
|
|||||
| Total long-term debt and capital lease obligations |
$ | 1,190.3 | $ | 971.1 | ||||
|
|
|
|
|
|||||
Revolving Credit Facility
The Company has a five-year senior unsecured revolving credit facility, which was undrawn as of June 30, 2016 and 2015. The revolving credit facility provides up to $300.0 million of borrowing capacity and includes a sub-limit of up to $100.0 million for loans in Euro and Pound Sterling. In addition, the revolving credit facility contains an accordion feature that allows for an increase in the available borrowing capacity of up to $100.0 million, subject to the agreement of lenders under the revolving credit facility or other financial institutions that become lenders to extend commitments as part of the increased revolving credit facility. Borrowings under the revolving credit facility are available for general corporate purposes. The revolving credit facility will mature on September 30, 2019, subject to no more than two one-year extensions if lenders holding a majority of the revolving commitments approve such extensions.
The revolving credit facility is unsecured and loans thereunder bear interest, at the Company’s option, at (a) the rate at which deposits in the applicable currency are offered in the London interbank market (or, in the case of borrowings in Euro, the European interbank market) plus margins varying from 1.125% to 2.000% per annum based on the Company’s senior, unsecured non-credit-enhanced, long-term debt ratings from Standard & Poor’s Ratings Group and Moody’s Investors Services Inc. (the “Ratings”) or (b) solely in the case of U.S. dollar loans, (i) the highest of (A) the prime rate of JPMorgan Chase Bank, N.A., (B) a rate equal to the average of the overnight federal funds rate with a maturity of one day plus a margin of 0.500% per annum, and (C) the rate at which dollar deposits are offered in the London interbank market for a one-month interest period plus 1.000% plus (ii) margins varying from 0.125% to 1.000% per annum based on the Ratings. The unused portion of the revolving credit facility is subject to commitment fees ranging from 0.125% to 0.350% per annum based on the Ratings.
Term Loan Facilities
The Company has two five-year $250.0 million senior unsecured term loan facilities that mature on September 16, 2019 (the “2019 term loan facility”) and December 14, 2020 (the “2020 term loan facility”), respectively. The Company entered into the 2020 term loan facility on December 14, 2015. Borrowings under the 2020 term loan facility were used for general corporate purposes, which included the repurchase of shares of the Company’s common stock as part of the new return of capital plan and pursuant to the accelerated share repurchase (“December 2015 ASR”) discussed further in Note 16. The 2019 term loan facility and 2020 term loan facility are together referred to as the “term loan facilities.” The term loan facilities are both subject to amortization in equal quarterly installments of 1.25% of the aggregate original principal amount of the term loans made on the closing dates, with any unpaid principal amount to be due and payable on the maturity date.
41
The term loan facilities bear interest at the same calculations as are applicable to dollar loans under the revolving credit facility. The interest rate per annum on the term loan facilities was 1.97% as of June 30, 2016, and the interest rate for the 2019 term loan facility was 1.69% as of June 30, 2015.
Restrictive Covenants and Other Matters
The revolving credit facility and the term loan facilities are together referred to as the “credit facilities.” The credit facilities contain various covenants and restrictive provisions that limit the Company’s subsidiaries’ ability to incur additional indebtedness; the Company’s ability to consolidate or merge with other entities; and the Company’s subsidiaries’ ability to incur liens, enter into sale and leaseback transactions, and enter into agreements restricting the ability of the Company’s subsidiaries to pay dividends. If the Company fails to perform the obligations under these and other covenants, the revolving credit facility could be terminated and any outstanding borrowings, together with accrued interest, under the credit facilities could be declared immediately due and payable. The credit facilities also have, in addition to customary events of default, an event of default triggered by the acceleration of the maturity of any other indebtedness the Company may have in an aggregate principal amount in excess of $75.0 million.
The credit facilities also contain financial covenants that will provide that (i) the ratio of total consolidated indebtedness to consolidated EBITDA shall not exceed 3.50 to 1.00 and (ii) the ratio of consolidated EBITDA to consolidated interest expense shall be a minimum of 3.00 to 1.00.
Senior Notes
On October 14, 2014, the Company completed an offering of 3.30% senior notes with a $250.0 million aggregate principal amount due in 2019 (the “2019 notes”) and 4.50% senior notes with a $500.0 million aggregate principal amount due in 2024 (the “2024 notes” and together with the 2019 notes, the “senior notes”). The issuance price of the senior notes was equal to the stated value. Interest is payable semi-annually on April 15 and October 15 of each year, and payment commenced on April 15, 2015. The interest rate payable on each applicable series of senior notes is subject to adjustment from time to time if the credit ratings assigned to any series of senior notes by the rating agencies is downgraded (or subsequently upgraded). The 2019 notes will mature on October 15, 2019, and the 2024 notes will mature on October 15, 2024. The senior notes are general unsecured obligations of the Company and are not guaranteed by any of the Company’s subsidiaries.
The senior notes rank equally in right of payment with the Company’s existing and future unsecured unsubordinated obligations, including the credit facilities. The senior notes contain covenants restricting the Company’s ability to incur additional indebtedness secured by liens, engage in sale/leaseback transactions, and merge, consolidate, or transfer all or substantially all of the Company’s assets.
The senior notes are redeemable at the Company’s option prior to September 15, 2019 for the 2019 notes and prior to July 15, 2024 for the 2024 notes at a redemption price equal to the greater of (i) 100% of the aggregate principal amount of the senior notes to be redeemed, and (ii) the sum of the present value of the remaining scheduled payments (as defined in the agreement), plus in each case, accrued and unpaid interest thereon. Subsequent to September 15, 2019 and July 15, 2024, the redemption price for the 2019 notes and the 2024 notes, respectively, will equal 100% of the aggregate principal amount of the notes redeemed, plus accrued and unpaid interest thereon. The senior notes are also subject to a change of control provision whereby each holder of the senior notes has the right to require the Company to purchase all or a portion of such holder’s senior notes at a purchase price equal to 101% of the principal amount thereof plus accrued and unpaid interest upon the occurrence of both a change of control and a decline in the rating of the senior notes.
Capital Lease Obligations
The Company has lease agreements for equipment, which are classified as capital lease obligations. The Company recognized the capital lease obligations and related leased equipment assets based on the present value of the minimum lease payments at lease inception.
42
Unamortized Debt Financing Costs
As of June 30, 2016 and 2015, gross debt issuance costs related to debt instruments were $11.1 million and $9.2 million, respectively, net of accumulated amortization of $2.7 million and $1.2 million, respectively. Additional debt issuance costs of $2.1 million were capitalized during fiscal 2016 for the 2020 term loan facility. Debt financing costs are amortized over the terms of the related debt instruments to interest expense on the consolidated and combined statement of operations.
The Company’s aggregate scheduled maturities of the long-term debt and capital lease obligations as of June 30, 2016 were as follows:
| Amount |
||||
| Fiscal year ending 2017 |
$ | 26.8 | ||
| Fiscal year ending 2018 |
26.6 | |||
| Fiscal year ending 2019 |
25.2 | |||
| Fiscal year ending 2020 |
453.1 | |||
| Fiscal year ending 2021 |
193.8 | |||
| Thereafter |
500.0 | |||
|
|
|
|||
| Total debt and capital lease obligations |
1,225.5 | |||
| Unamortized deferred financing costs |
(8.4 | ) | ||
|
|
|
|||
| Total debt and capital lease obligations, net of unamortized deferred financing costs |
$ | 1,217.1 | ||
|
|
|
|||
Note 14. Commitments and Contingencies
The Company has obligations under various operating lease agreements for facilities and equipment. Total expense under these agreements was approximately $49.3 million and $45.2 million in fiscal 2016 and 2015, respectively, with minimum commitments as of June 30, 2016 as follows:
| Amount |
||||
| Fiscal year ending 2017 |
$ | 41.9 | ||
| Fiscal year ending 2018 |
25.4 | |||
| Fiscal year ending 2019 |
15.4 | |||
| Fiscal year ending 2020 |
12.2 | |||
| Fiscal year ending 2021 |
7.9 | |||
| Thereafter |
20.4 | |||
|
|
|
|||
| $ | 123.2 | |||
|
|
|
|||
In addition to fixed rentals, certain leases require payment of maintenance and real estate taxes and contain escalation provisions based on future adjustments in price indices.
As of June 30, 2016, the Company has purchase commitments and obligations related to royalty, purchase, and maintenance agreements on the Company’s software, equipment, and other assets, of approximately $1.6 million which relates to fiscal year 2017.
The Company is subject to various claims and litigation in the normal course of business. When a loss is considered probable and reasonably estimable, the Company records a liability in the amount of its best estimate for the ultimate loss. There can be no assurance that these matters will be resolved in a manner that is not adverse to the Company.
In the normal course of business, the Company may enter into contracts in which it makes representations and warranties that relate to the performance of the Company’s services and products. The Company does not expect any material losses related to such representations and warranties.
43
Note 15. Accumulated Other Comprehensive Income (“AOCI”)
Comprehensive income is a measure of income that includes both net earnings and other comprehensive income (loss). Other comprehensive income (loss) results from items deferred on the consolidated balance sheets in CDK stockholders’ equity. The Company’s other comprehensive income (loss) for fiscal 2016 and 2015 and AOCI balances as of June 30, 2016 and 2015 were comprised solely of currency translation adjustments. Other comprehensive income (loss) was $(45.8) million and $(34.1) million for fiscal 2016 and 2015, respectively. The accumulated balances reported in AOCI on the consolidated and combined balance sheets for currency translation adjustments were $5.8 million and $51.6 million as of June 30, 2016 and 2015, respectively.
Note 16. Share Repurchase Transactions
In December 2015, the Board of Directors authorized the Company to repurchase up to $1.0 billion of its common stock. Under the authorization for the stock repurchase program, the Company may purchase its common stock in the open market or in privately negotiated transactions from time to time as permitted by federal securities laws and other legal requirements. The actual timing, number, and price of any shares to be repurchased will be determined at management’s discretion and will depend on a number of factors, which may include the market price of the shares, general market and economic conditions, and other potential uses for free cash flow. This authorization superseded and replaced the prior authorization by the Board of Directors which was approved on January 20, 2015 and had authorized the Company to repurchase up to 10.0 million shares of its common stock. The Company repurchased a total of approximately 1.2 million shares of its common stock under the prior authorization.
On December 14, 2015, the Company entered into an agreement for the December 2015 ASR to purchase $250.0 million of the Company’s common stock. Under the terms of the December 2015 ASR, the Company made a $250.0 million payment on December 15, 2015 and received an initial delivery of approximately 4.3 million shares of the Company’s common stock. On June 15, 2016, the Company received an additional 1.0 million shares of common stock in final settlement of the December 2015 ASR, for a total of 5.3 million shares. The value reflected in treasury stock upon completion of the December 2015 ASR represents the value of the shares received based on the closing price of the Company’s stock on the respective settlement dates, which is higher than the $250.0 million cash paid by $6.2 million.
On June 13, 2016, the Company entered into an accelerated share repurchase agreement (“June 2016 ASR” and together with the December 2015 ASR, the “ASRs”) to purchase $300.0 million of the Company’s common stock with cash on-hand. Under the terms of the June 2016 ASR, the Company made a $300.0 million payment on June 16, 2016 and received an initial delivery of approximately 4.3 million shares of the Company’s common stock. The payment was recorded as a reduction to stockholders’ equity, consisting of a $240.0 million increase to treasury stock, which reflects the value of the 4.3 million shares received upon initial settlement, and a $60.0 million decrease in additional paid-in-capital, which reflects the value of stock held back. The final settlement of the June 2016 ASR is expected to occur no later than the end of the Company’s fiscal quarter ending September 30, 2016 and may result in the receipt or delivery of additional shares of common stock.
The final number of shares purchased under the ASRs is calculated based on the average of the daily volume-weighted average price of the Company’s common stock during the term of the respective ASR transaction, less a discount and subject to adjustments pursuant to the terms and conditions of the respective ASR agreement.
Note 17. Transactions with ADP
Prior to the spin-off, the Company entered into a transition services agreement with ADP to provide for an orderly transition to being an independent company. Among the principal services to be provided by ADP to the Company were operational and administrative infrastructure-related services, such as use of the e-mail
44
domain “adp.com,” facilities sharing, procurement support, tax, human resources administrative services and services related to back office support, and software development in ADP’s Indian facilities. Among the principal services to be provided by the Company to ADP were operational and administrative infrastructure-related services, such as facilities sharing and human resources administrative services. The agreement expired and services under it ceased on September 30, 2015, the one year anniversary of the spin-off.
The Company entered into a data services agreement with ADP prior to the spin-off under which ADP will provide the Company with certain data center sharing services relating to the provision of information technology, platform support, hosting and network services. The term of the agreement will expire two years after the spin-off date.
The Company entered into an intellectual property transfer agreement with ADP prior to the spin-off under which ADP assigned to the Company certain patents, trademarks, copyrights, and other intellectual property developed or owned by ADP or certain of its subsidiaries and with respect to which the Company is the primary or exclusive user today or the anticipated primary or exclusive user in the future. The term of the agreement is perpetual after the spin-off date.
The Company also entered into an employee matters agreement with ADP prior to the spin-off pursuant to which certain employee benefit matters will be addressed, such as the treatment of ADP options held by Company employees after the spin-off and the treatment of benefits for Company management employees who participate in and have accrued benefits under the ADP SORP. The agreement also, to the extent provided therein, delineates the benefit plans and programs in which the Company’s employees participate following the spin-off. ADP remains responsible for the payment of all benefits under the ADP plans.
For fiscal 2016 and the period from the date of spin-off through the end of fiscal 2015, the Company recorded $2.2 million and $8.6 million, respectively, of expenses related to the transition services agreement and $7.5 million and $9.2 million, respectively, of expenses related to the data services agreement in the accompanying financial statements. As of June 30, 2016 and 2015, the Company had amounts payable to ADP under the transition services and data services agreements of $0.1 million and $7.8 million, respectively.
Refer to Note 8 for further information on the tax matters agreement with ADP.
Note 18. Financial Data by Segment
Effective July 1, 2016, the Company executed a comprehensive reorganization to streamline its organization that will enable it to deliver an improved customer experience, create significant efficiencies, and better align it to implement the business transformation plan. The organizational changes included integrating product management, combining the Digital Marketing and Automotive Retail North America operations into a single organization, creating a single North America sales organization, and forming a global research and development organization. In connection with this reorganization, information that the Company’s chief operating decision maker regularly reviews for purposes of allocating resources and assessing performance changed resulting in a reassessment of operating segments.
The Company reorganized into two main operating groups. In connection with this reorganization, our operating segments have changed. The Company’s first operating group is CDK North America which is comprised of two reportable segments, Retail Solutions North America and Advertising North America. The second operating group, which is also a reportable segment, is CDK International. Segment information for fiscal 2016 and 2015 has been updated to conform to the new presentation.
The primary components of the Other segment are corporate allocations and other expenses not recorded in the segment results, such as corporate costs, separation costs, stock-based compensation expense, interest expense, costs attributable to the business transformation plan, the trademark royalty fee charged by ADP prior to the spin-off, and certain unallocated expenses. Certain expenses are charged to the reportable segments at a standard rate for management reasons. Other costs are recorded based on management responsibility.
45
| Retail |
Advertising |
CDK |
Other (2)(3) |
Total |
||||||||||||||||
| Year ended June 30, 2016 |
||||||||||||||||||||
| Revenues |
$ | 1,521.3 | $ | 279.7 | $ | 313.6 | $ | — | $ | 2,114.6 | ||||||||||
| Earnings before income taxes |
481.3 | 27.5 | 61.1 | (200.8 | ) | 369.1 | ||||||||||||||
| Assets |
1,240.9 | 307.9 | 539.4 | 276.8 | 2,365.0 | |||||||||||||||
| Capital expenditures |
37.4 | — | 8.3 | 5.1 | 50.8 | |||||||||||||||
| Depreciation and amortization |
39.3 | 3.7 | 12.5 | 8.5 | 64.0 | |||||||||||||||
| Year ended June 30, 2015 |
||||||||||||||||||||
| Revenues |
$ | 1,501.2 | $ | 243.1 | $ | 319.2 | $ | — | $ | 2,063.5 | ||||||||||
| Earnings before income taxes |
411.4 | (0.8 | ) | 47.3 | (158.0 | ) | 299.9 | |||||||||||||
| Assets |
1,172.6 | 285.6 | 595.4 | 464.9 | 2,518.5 | |||||||||||||||
| Capital expenditures |
32.1 | — | 7.1 | 4.8 | 44.0 | |||||||||||||||
| Depreciation and amortization |
46.0 | 13.9 | 15.0 | 1.6 | 76.5 | |||||||||||||||
| (1) | ANA includes $10.1 million and RSNA includes $5.5 million of accelerated amortization in fiscal 2015 attributable to the Cobalt trademark. |
| (2) | Other includes $34.6 million of separation costs in fiscal 2015. The Company did not incur separation costs in fiscal 2016. |
| (3) | Other also includes $20.2 million and $2.4 million of restructuring expenses related to the business transformation plan in fiscal 2016 and 2015, respectively. |
Supplemental disclosure of revenue by type was as follows:
Retail Solutions North America:
Subscription: for software and technology solutions provided to automotive retailers and OEMs, which includes:
| • | Dealer Management Systems (“DMSs”) and layered applications, which may be installed onsite at the customer’s location, or hosted and provided on a Software-as-a-Service (“SaaS”) basis, including ongoing maintenance and support; |
| • | Interrelated services such as installation, initial training, and data updates; |
| • | Websites, search marketing, and reputation management services; and |
| • | Hardware on a service basis, meaning no specific assets are identified or a substantive right of substitution exists. |
Transaction: fees per transaction to process credit reports, vehicle registrations, and automotive equity mining.
Other: consulting and professional services, sales of hardware, and other miscellaneous revenues.
Advertising North America revenues are primarily earned for placing internet advertisements for OEMs and automotive retailers.
CDK International revenues are generated primarily from Subscription revenue as described above, aside from the absence of website offerings.
46
| Revenues |
||||||||
| Years Ended June 30, |
||||||||
| 2016 |
2015 |
|||||||
| CDK North America: |
||||||||
| Retail Solutions North America: |
||||||||
| Subscription revenue |
$ | 1,191.2 | $ | 1,124.7 | ||||
| Transaction revenue (1) |
179.1 | 204.3 | ||||||
| Other revenue |
151.0 | 172.2 | ||||||
|
|
|
|
|
|||||
| Total Retail Solutions North America |
$ | 1,521.3 | $ | 1,501.2 | ||||
| Advertising North America revenue |
279.7 | 243.1 | ||||||
| CDK International revenue |
313.6 | 319.2 | ||||||
|
|
|
|
|
|||||
| Total |
$ | 2,114.6 | $ | 2,063.5 | ||||
|
|
|
|
|
|||||
| (1) | Transaction revenue in fiscal 2015 includes $46.2 million of revenue related to the internet sales leads business, which was sold on May 21, 2015. |
Revenues and property, plant and equipment, net by geographic area were as follows:
| United |
Europe |
Canada |
Other |
Total |
||||||||||||||||
| Year ended June 30, 2016 |
||||||||||||||||||||
| Revenues |
$ | 1,706.4 | $ | 227.8 | $ | 94.5 | $ | 85.9 | $ | 2,114.6 | ||||||||||
| Property, plant and equipment, net |
91.2 | 15.3 | 2.1 | 10.0 | 118.6 | |||||||||||||||
| Year ended June 30, 2015 |
||||||||||||||||||||
| Revenues |
$ | 1,641.1 | $ | 226.2 | $ | 102.9 | $ | 93.3 | $ | 2,063.5 | ||||||||||
| Property, plant and equipment, net |
72.7 | 16.2 | 0.4 | 10.7 | 100.0 | |||||||||||||||
Note 19. Quarterly Financial Results (Unaudited)
Summarized quarterly results of operations for the fiscal 2016 and 2015 were as follows:
| First |
Second |
Third |
Fourth |
|||||||||||||
| Year ended June 30, 2016 |
||||||||||||||||
| Revenues |
$ | 514.6 | $ | 520.1 | $ | 537.7 | $ | 542.2 | ||||||||
| Gross profit (1) |
203.8 | 218.9 | 221.9 | 226.6 | ||||||||||||
| Earnings before income taxes |
95.8 | 106.8 | 78.6 | 87.9 | ||||||||||||
| Net earnings |
61.2 | 69.7 | 55.7 | 60.2 | ||||||||||||
| Net earnings attributable to noncontrolling interest |
2.2 | 1.5 | 1.9 | 1.9 | ||||||||||||
| Net earnings attributable to CDK |
59.0 | 68.2 | 53.8 | 58.3 | ||||||||||||
| Basic earnings attributable to CDK per share |
$ | 0.37 | $ | 0.43 | $ | 0.35 | $ | 0.38 | ||||||||
| Diluted earnings attributable to CDK per share |
$ | 0.37 | $ | 0.43 | $ | 0.34 | $ | 0.37 | ||||||||
| Year ended June 30, 2015 |
||||||||||||||||
| Revenues |
$ | 517.0 | $ | 517.0 | $ | 526.4 | $ | 503.1 | ||||||||
| Gross profit (1) |
205.5 | 193.7 | 204.6 | 186.5 | ||||||||||||
| Earnings before income taxes |
64.5 | 77.1 | 91.0 | 67.3 | ||||||||||||
| Net earnings |
41.0 | 44.4 | 58.2 | 42.7 | ||||||||||||
| Net earnings attributable to noncontrolling interest |
2.0 | 2.0 | 1.9 | 2.0 | ||||||||||||
| Net earnings attributable to CDK |
39.0 | 42.4 | 56.3 | 40.7 | ||||||||||||
| Basic earnings attributable to CDK per share |
$ | 0.24 | $ | 0.26 | $ | 0.35 | $ | 0.25 | ||||||||
| Diluted earnings attributable to CDK per share |
$ | 0.24 | $ | 0.26 | $ | 0.35 | $ | 0.25 | ||||||||
| (1) | Gross profit is calculated as revenues less cost of revenues. |
47