Attached files
| file | filename |
|---|---|
| EX-32.2 - EX-32.2 - ANTERO RESOURCES Corp | ar-20170331ex322a4d5fb.htm |
| EX-32.1 - EX-32.1 - ANTERO RESOURCES Corp | ar-20170331ex32186e59a.htm |
| EX-31.2 - EX-31.2 - ANTERO RESOURCES Corp | ar-20170331ex312a59d7c.htm |
| EX-31.1 - EX-31.1 - ANTERO RESOURCES Corp | ar-20170331ex3118b6739.htm |
UNITED STATES
SECURITIES AND EXCHANGE COMMISSION
Washington, D.C. 20549
FORM 10-Q
(Mark One)
|
☒ |
QUARTERLY REPORT PURSUANT TO SECTION 13 OR 15(d) OF THE SECURITIES EXCHANGE ACT OF 1934 |
For the quarterly period ended March 31, 2017
OR
|
☐ |
TRANSITION REPORT PURSUANT TO SECTION 13 OR 15(d) OF THE SECURITIES EXCHANGE ACT OF 1934 |
For the transition period from to
Commission file number: 001-36120
ANTERO RESOURCES CORPORATION
(Exact name of registrant as specified in its charter)
|
Delaware |
|
80-0162034 |
|
(State or other jurisdiction of |
|
(IRS Employer Identification No.) |
|
|
|
|
|
1615 Wynkoop Street |
|
80202 |
|
(Address of principal executive offices) |
|
(Zip Code) |
(303) 357-7310
(Registrant’s telephone number, including area code)
Indicate by check mark whether the registrant: (1) has filed all reports required to be filed by Section 13 or 15(d) of the Securities Exchange Act of 1934 during the preceding 12 months (or for such shorter period that the registrant was required to file such reports), and (2) has been subject to such filing requirements for the past 90 days. ☒ Yes ☐ No
Indicate by check mark whether the registrant has submitted electronically and posted on its corporate Web site, if any, every Interactive Data File required to be submitted and posted pursuant to Rule 405 of Regulation S-T (§232.405 of this chapter) during the preceding 12 months (or for such shorter period that the registrant was required to submit and post such files). ☒ Yes ☐ No
Indicate by check mark whether the registrant is a large accelerated filer, an accelerated filer, a non-accelerated filer, smaller reporting company, or an emerging growth company. See the definitions of “large accelerated filer,” “accelerated filer,” “smaller reporting company,” and “emerging growth company” in Rule 12b-2 of the Exchange Act.
|
Large accelerated filer ☒ |
|
Accelerated filer ☐ |
|
Non-accelerated filer ☐ |
|
Smaller reporting company ☐ |
|
(Do not check if a smaller reporting company) Emerging growth company ☐ |
|
|
If an emerging growth company, indicate by check mark if the registrant has elected not to use the extended transition period for complying with any new or revised financial accounting standards provided pursuant to Section 13(a) of the Exchange Act. ◻
Indicate by check mark whether the registrant is a shell company (as defined in Rule 12b-2 of the Exchange Act) ☐ Yes ☒ No
The registrant had 315,447,671 shares of common stock outstanding as of May 4, 2017.
|
|
|
|
|
|
|
|
2 |
|||
|
|
4 |
|||
|
|
|
4 |
||
|
|
Management’s Discussion and Analysis of Financial Condition and Results of Operations |
|
31 |
|
|
|
|
48 |
||
|
|
|
49 |
||
|
|
51 |
|||
|
|
|
51 |
||
|
|
|
51 |
||
|
|
|
52 |
||
|
|
|
52 |
||
|
|
|
53 |
||
|
|
54 |
|||
1
CAUTIONARY STATEMENT REGARDING FORWARD-LOOKING STATEMENTS
The information in this report includes “forward-looking statements” within the meaning of Section 27A of the Securities Act of 1933, as amended, and Section 21E of the Securities Exchange Act of 1934, as amended (the “Exchange Act”). All statements, other than statements of historical fact included in this Quarterly Report on Form 10-Q, regarding our strategy, future operations, financial position, estimated revenues and losses, projected costs, prospects, plans and objectives of management are forward-looking statements. When used, the words “could,” “believe,” “anticipate,” “intend,” “estimate,” “expect,” “project” and similar expressions are intended to identify forward-looking statements, although not all forward-looking statements contain such identifying words. These forward-looking statements are based on our current expectations and assumptions about future events and are based on currently available information as to the outcome and timing of future events. When considering forward-looking statements, you should keep in mind the risk factors and other cautionary statements described under the heading “Item 1A. Risk Factors” in our Annual Report on Form 10-K for the year ended December 31, 2016 (our “2016 Form 10-K”) on file with the Securities and Exchange Commission (the “SEC”) and in “Item 1A. Risk Factors” of this Quarterly Report on Form 10-Q.
Forward-looking statements may include statements about our:
|
· |
business strategy; |
|
· |
reserves; |
|
· |
financial strategy, liquidity, and capital required for our development program; |
|
· |
natural gas, natural gas liquids (“NGLs”), and oil prices; |
|
· |
timing and amount of future production of natural gas, NGLs, and oil; |
|
· |
hedging strategy and results; |
|
· |
ability to realize the anticipated benefits of Antero Midstream’s recently announced processing and fractionation joint venture with MarkWest Energy Partners, L.P.; |
|
· |
ability to meet our minimum volume commitments and to utilize or monetize our firm transportation commitments; |
|
· |
future drilling plans; |
|
· |
competition and government regulations; |
|
· |
pending legal or environmental matters; |
|
· |
marketing of natural gas, NGLs, and oil; |
|
· |
leasehold or business acquisitions; |
|
· |
costs of developing our properties; |
|
· |
operations of Antero Midstream Partners LP; |
|
· |
general economic conditions; |
|
· |
credit markets; |
|
· |
uncertainty regarding our future operating results; and |
2
|
· |
plans, objectives, expectations, and intentions. |
We caution you that these forward-looking statements are subject to all of the risks and uncertainties, most of which are difficult to predict and many of which are beyond our control, incident to the exploration for and development, production, gathering, processing, transportation, and sale of natural gas, NGLs, and oil. These risks include, but are not limited to, commodity price volatility and low commodity prices, inflation, availability of drilling and production equipment and services, environmental risks, drilling and other operating risks, marketing and transportation risks, regulatory changes, the uncertainty inherent in estimating natural gas, NGLs, and oil reserves and in projecting future rates of production, cash flow and access to capital, the timing of development expenditures, and the other risks described under the heading “Item 1A. Risk Factors” in our 2016 Form 10-K on file with the SEC and in “Item 1A. Risk Factors” of this Quarterly Report on Form 10-Q.
Reserve engineering is a process of estimating underground accumulations of natural gas, NGLs, and oil that cannot be measured in an exact manner. The accuracy of any reserve estimate depends on the quality of available data, the interpretation of such data, and price and cost assumptions made by reservoir engineers. In addition, the results of drilling, testing, and production activities, or changes in commodity prices, may justify revisions of estimates that were made previously. If significant, such revisions would change the schedule of any further production and development drilling. Accordingly, reserve estimates may differ significantly from the quantities of natural gas, NGLs, and oil that are ultimately recovered.
Should one or more of the risks or uncertainties described in this report occur, or should underlying assumptions prove incorrect, our actual results and plans could differ materially from those expressed in any forward-looking statements.
All forward-looking statements, expressed or implied, included in this report are expressly qualified in their entirety by this cautionary statement. This cautionary statement should also be considered in connection with any subsequent written or oral forward-looking statements that we or persons acting on our behalf may issue.
Except as otherwise required by applicable law, we disclaim any duty to update any forward-looking statements, all of which are expressly qualified by the statements in this section, to reflect events or circumstances after the date of this Quarterly Report on Form 10-Q.
3
Condensed Consolidated Balance Sheets
December 31, 2016 and March 31, 2017
(Unaudited)
(In thousands, except per share amounts)
|
|
|
|
|
|
|
|
|
|
|
|
December 31, 2016 |
|
March 31, 2017 |
|
||
|
Assets |
|
||||||
|
Current assets: |
|
|
|
|
|
|
|
|
Cash and cash equivalents |
|
$ |
31,610 |
|
|
— |
|
|
Accounts receivable, net of allowance for doubtful accounts of $1,195 in 2016 and 2017 |
|
|
29,682 |
|
|
36,874 |
|
|
Accrued revenue |
|
|
261,960 |
|
|
220,059 |
|
|
Derivative instruments |
|
|
73,022 |
|
|
237,086 |
|
|
Other current assets |
|
|
6,313 |
|
|
9,679 |
|
|
Total current assets |
|
|
402,587 |
|
|
503,698 |
|
|
Property and equipment: |
|
|
|
|
|
|
|
|
Natural gas properties, at cost (successful efforts method): |
|
|
|
|
|
|
|
|
Unproved properties |
|
|
2,331,173 |
|
|
2,330,010 |
|
|
Proved properties |
|
|
9,549,671 |
|
|
9,942,450 |
|
|
Water handling and treatment systems |
|
|
744,682 |
|
|
771,239 |
|
|
Gathering systems and facilities |
|
|
1,723,768 |
|
|
1,785,669 |
|
|
Other property and equipment |
|
|
41,231 |
|
|
42,290 |
|
|
|
|
|
14,390,525 |
|
|
14,871,658 |
|
|
Less accumulated depletion, depreciation, and amortization |
|
|
(2,363,778) |
|
|
(2,566,359) |
|
|
Property and equipment, net |
|
|
12,026,747 |
|
|
12,305,299 |
|
|
Derivative instruments |
|
|
1,731,063 |
|
|
1,811,435 |
|
|
Investments in unconsolidated affiliates |
|
|
68,299 |
|
|
230,418 |
|
|
Other assets |
|
|
26,854 |
|
|
37,804 |
|
|
Total assets |
|
$ |
14,255,550 |
|
|
14,888,654 |
|
|
|
|
|
|
|
|
|
|
|
Liabilities and Equity |
|
||||||
|
Current liabilities: |
|
|
|
|
|
|
|
|
Accounts payable |
|
$ |
38,627 |
|
|
37,706 |
|
|
Accrued liabilities |
|
|
393,803 |
|
|
416,588 |
|
|
Revenue distributions payable |
|
|
163,989 |
|
|
198,775 |
|
|
Derivative instruments |
|
|
203,635 |
|
|
54,277 |
|
|
Other current liabilities |
|
|
17,334 |
|
|
16,090 |
|
|
Total current liabilities |
|
|
817,388 |
|
|
723,436 |
|
|
Long-term liabilities: |
|
|
|
|
|
|
|
|
Long-term debt |
|
|
4,703,973 |
|
|
4,775,302 |
|
|
Deferred income tax liability |
|
|
950,217 |
|
|
1,081,563 |
|
|
Derivative instruments |
|
|
234 |
|
|
102 |
|
|
Other liabilities |
|
|
55,160 |
|
|
54,299 |
|
|
Total liabilities |
|
|
6,526,972 |
|
|
6,634,702 |
|
|
Commitments and contingencies (notes 10 and 13) |
|
|
|
|
|
|
|
|
Equity: |
|
|
|
|
|
|
|
|
Stockholders' equity: |
|
|
|
|
|
|
|
|
Preferred stock, $0.01 par value; authorized - 50,000 shares; none issued |
|
|
— |
|
|
— |
|
|
Common stock, $0.01 par value; authorized - 1,000,000 shares; issued and outstanding 314,877 shares and 315,006 shares, respectively |
|
|
3,149 |
|
|
3,150 |
|
|
Additional paid-in capital |
|
|
5,299,481 |
|
|
6,407,158 |
|
|
Accumulated earnings |
|
|
959,995 |
|
|
1,228,391 |
|
|
Total stockholders' equity |
|
|
6,262,625 |
|
|
7,638,699 |
|
|
Noncontrolling interest in consolidated subsidiary |
|
|
1,465,953 |
|
|
615,253 |
|
|
Total equity |
|
|
7,728,578 |
|
|
8,253,952 |
|
|
Total liabilities and equity |
|
$ |
14,255,550 |
|
|
14,888,654 |
|
See accompanying notes to condensed consolidated financial statements.
4
ANTERO RESOURCES CORPORATION
Condensed Consolidated Statements of Operations and Comprehensive Income (Loss)
Three Months Ended March 31, 2016 and 2017
(Unaudited)
(In thousands, except per share amounts)
|
|
|
Three Months Ended March 31, |
|
||||
|
|
|
2016 |
|
2017 |
|
||
|
Revenue: |
|
|
|
|
|
|
|
|
Natural gas sales |
|
$ |
254,776 |
|
|
466,664 |
|
|
Natural gas liquids sales |
|
|
73,065 |
|
|
194,652 |
|
|
Oil sales |
|
|
10,179 |
|
|
26,960 |
|
|
Gathering, compression, and water handling and treatment |
|
|
3,844 |
|
|
2,604 |
|
|
Marketing |
|
|
99,216 |
|
|
65,924 |
|
|
Commodity derivative fair value gains |
|
|
279,924 |
|
|
438,775 |
|
|
Total revenue |
|
|
721,004 |
|
|
1,195,579 |
|
|
Operating expenses: |
|
|
|
|
|
|
|
|
Lease operating |
|
|
11,293 |
|
|
15,551 |
|
|
Gathering, compression, processing, and transportation |
|
|
208,738 |
|
|
266,829 |
|
|
Production and ad valorem taxes |
|
|
19,284 |
|
|
24,793 |
|
|
Marketing |
|
|
137,933 |
|
|
89,993 |
|
|
Exploration |
|
|
1,014 |
|
|
2,107 |
|
|
Impairment of unproved properties |
|
|
15,526 |
|
|
26,899 |
|
|
Depletion, depreciation, and amortization |
|
|
191,582 |
|
|
202,729 |
|
|
Accretion of asset retirement obligations |
|
|
598 |
|
|
637 |
|
|
General and administrative (including equity-based compensation expense of $23,470 and $25,503 in 2016 and 2017, respectively) |
|
|
56,287 |
|
|
64,698 |
|
|
Total operating expenses |
|
|
642,255 |
|
|
694,236 |
|
|
Operating income |
|
|
78,749 |
|
|
501,343 |
|
|
Other income (expenses): |
|
|
|
|
|
|
|
|
Equity in earnings of unconsolidated affiliates |
|
|
— |
|
|
2,231 |
|
|
Interest |
|
|
(63,284) |
|
|
(66,670) |
|
|
Total other expenses |
|
|
(63,284) |
|
|
(64,439) |
|
|
Income before income taxes |
|
|
15,465 |
|
|
436,904 |
|
|
Provision for income tax expense |
|
|
(4,815) |
|
|
(131,346) |
|
|
Net income and comprehensive income including noncontrolling interest |
|
|
10,650 |
|
|
305,558 |
|
|
Net income and comprehensive income attributable to noncontrolling interest |
|
|
15,705 |
|
|
37,162 |
|
|
Net income (loss) and comprehensive income (loss) attributable to Antero Resources Corporation |
|
$ |
(5,055) |
|
|
268,396 |
|
|
|
|
|
|
|
|
|
|
|
|
|
|
|
|
|
|
|
|
Earnings (loss) per common share—basic |
|
$ |
(0.02) |
|
|
0.85 |
|
|
|
|
|
|
|
|
|
|
|
Earnings (loss) per common share—assuming dilution |
|
$ |
(0.02) |
|
|
0.85 |
|
|
|
|
|
|
|
|
|
|
|
Weighted average number of shares outstanding: |
|
|
|
|
|
|
|
|
Basic |
|
|
277,050 |
|
|
314,954 |
|
|
Diluted |
|
|
277,050 |
|
|
315,769 |
|
See accompanying notes to condensed consolidated financial statements.
5
ANTERO RESOURCES CORPORATION
Condensed Consolidated Statements of Equity
Three Months Ended March 31, 2017
(Unaudited)
(In thousands)
|
|
|
|
|
|
|
|
|
|
|
|
|
|
|
|
|
|
|
|
|
|
|
|
Common Stock |
|
Additional paid- |
|
Accumulated |
|
Noncontrolling |
|
Total |
|
||||||||
|
|
|
Shares |
|
Amount |
|
in capital |
|
earnings |
|
interest |
|
equity |
|
||||||
|
Balances, December 31, 2016 |
|
|
314,877 |
|
$ |
3,149 |
|
|
5,299,481 |
|
|
959,995 |
|
|
1,465,953 |
|
|
7,728,578 |
|
|
Issuance of common stock upon vesting of equity-based compensation awards, net of shares withheld for income taxes |
|
|
129 |
|
|
1 |
|
|
(1,658) |
|
|
— |
|
|
— |
|
|
(1,657) |
|
|
Issuance of common units by Antero Midstream Partners LP, net of underwriter discounts and offering costs |
|
|
— |
|
|
— |
|
|
— |
|
|
— |
|
|
223,119 |
|
|
223,119 |
|
|
Equity-based compensation |
|
|
— |
|
|
— |
|
|
23,354 |
|
|
— |
|
|
2,149 |
|
|
25,503 |
|
|
Net income and comprehensive income |
|
|
— |
|
|
— |
|
|
— |
|
|
268,396 |
|
|
37,162 |
|
|
305,558 |
|
|
Effects of changes in ownership interests in consolidated subsidiaries |
|
|
— |
|
|
— |
|
|
1,085,981 |
|
|
— |
|
|
(1,085,981) |
|
|
— |
|
|
Distributions to noncontrolling interests |
|
|
— |
|
|
— |
|
|
— |
|
|
— |
|
|
(27,149) |
|
|
(27,149) |
|
|
Balances, March 31, 2017 |
|
|
315,006 |
|
$ |
3,150 |
|
|
6,407,158 |
|
|
1,228,391 |
|
|
615,253 |
|
|
8,253,952 |
|
See accompanying notes to condensed consolidated financial statements.
6
ANTERO RESOURCES CORPORATION
Condensed Consolidated Statements of Cash Flows
Three Months Ended March 31, 2016 and 2017
(Unaudited)
(In thousands)
|
|
|
|
|
|
|
|
|
|
|
|
Three Months Ended March 31, |
|
||||
|
|
|
2016 |
|
2017 |
|
||
|
Cash flows from operating activities: |
|
|
|
|
|
|
|
|
Net income including noncontrolling interest |
|
$ |
10,650 |
|
|
305,558 |
|
|
Adjustment to reconcile net income to net cash provided by operating activities: |
|
|
|
|
|
|
|
|
Depletion, depreciation, amortization, and accretion |
|
|
192,180 |
|
|
203,366 |
|
|
Impairment of unproved properties |
|
|
15,526 |
|
|
26,899 |
|
|
Derivative fair value gains |
|
|
(279,924) |
|
|
(438,775) |
|
|
Gains on settled derivatives |
|
|
324,347 |
|
|
44,849 |
|
|
Deferred income tax expense |
|
|
4,815 |
|
|
131,346 |
|
|
Equity-based compensation expense |
|
|
23,470 |
|
|
25,503 |
|
|
Equity in earnings of unconsolidated affiliates |
|
|
— |
|
|
(2,231) |
|
|
Other |
|
|
274 |
|
|
87 |
|
|
Changes in current assets and liabilities: |
|
|
|
|
|
|
|
|
Accounts receivable |
|
|
651 |
|
|
(7,192) |
|
|
Accrued revenue |
|
|
(8,204) |
|
|
41,901 |
|
|
Other current assets |
|
|
15 |
|
|
(3,366) |
|
|
Accounts payable |
|
|
4,387 |
|
|
12,545 |
|
|
Accrued liabilities |
|
|
49,041 |
|
|
19,339 |
|
|
Revenue distributions payable |
|
|
2,969 |
|
|
34,786 |
|
|
Other current liabilities |
|
|
(29) |
|
|
(676) |
|
|
Net cash provided by operating activities |
|
|
340,168 |
|
|
393,939 |
|
|
Cash flows used in investing activities: |
|
|
|
|
|
|
|
|
Additions to proved properties |
|
|
— |
|
|
(49,664) |
|
|
Additions to unproved properties |
|
|
(28,675) |
|
|
(55,542) |
|
|
Drilling and completion costs |
|
|
(395,185) |
|
|
(306,925) |
|
|
Additions to water handling and treatment systems |
|
|
(37,036) |
|
|
(36,954) |
|
|
Additions to gathering systems and facilities |
|
|
(48,686) |
|
|
(66,559) |
|
|
Additions to other property and equipment |
|
|
(541) |
|
|
(590) |
|
|
Investment in unconsolidated affiliate |
|
|
— |
|
|
(159,889) |
|
|
Change in other assets |
|
|
(9,172) |
|
|
(12,350) |
|
|
Net cash used in investing activities |
|
|
(519,295) |
|
|
(688,473) |
|
|
Cash flows from financing activities: |
|
|
|
|
|
|
|
|
Issuance of common units by Antero Midstream Partners LP |
|
|
— |
|
|
223,119 |
|
|
Proceeds from sale of common units of Antero Midstream Partners LP held by Antero Resources Corporation |
|
|
178,000 |
|
|
— |
|
|
Borrowings on bank credit facilities, net |
|
|
33,000 |
|
|
70,000 |
|
|
Payments of deferred financing costs |
|
|
(64) |
|
|
— |
|
|
Distributions to noncontrolling interest in consolidated subsidiary |
|
|
(14,013) |
|
|
(27,149) |
|
|
Employee tax withholding for settlement of equity compensation awards |
|
|
(117) |
|
|
(1,657) |
|
|
Other |
|
|
(1,282) |
|
|
(1,389) |
|
|
Net cash provided by financing activities |
|
|
195,524 |
|
|
262,924 |
|
|
Net increase (decrease) in cash and cash equivalents |
|
|
16,397 |
|
|
(31,610) |
|
|
Cash and cash equivalents, beginning of period |
|
|
23,473 |
|
|
31,610 |
|
|
Cash and cash equivalents, end of period |
|
$ |
39,870 |
|
|
— |
|
|
|
|
|
|
|
|
|
|
|
Supplemental disclosure of cash flow information: |
|
|
|
|
|
|
|
|
Cash paid during the period for interest |
|
$ |
14,350 |
|
|
35,770 |
|
|
Supplemental disclosure of noncash investing activities: |
|
|
|
|
|
|
|
|
Decrease in accounts payable and accrued liabilities for additions to property and equipment |
|
$ |
(119,191) |
|
|
(10,020) |
|
See accompanying notes to condensed consolidated financial statements.
7
ANTERO RESOURCES CORPORATION
Notes to Condensed Consolidated Financial Statements
December 31, 2016 and March 31, 2017
(1)Organization
Antero Resources Corporation (individually referred to as “Antero”) and its consolidated subsidiaries (collectively referred to as the “Company”) are engaged in the exploration, development, and acquisition of natural gas, NGLs, and oil properties in the Appalachian Basin in West Virginia, Ohio, and Pennsylvania. The Company targets large, repeatable resource plays where horizontal drilling and advanced fracture stimulation technologies provide the means to economically develop and produce natural gas, NGLs, and oil from unconventional formations. Through its consolidated subsidiary, Antero Midstream Partners LP, a publicly-traded limited partnership (“Antero Midstream” or “the Partnership”), the Company has water handling and treatment operations and midstream operations in the Appalachian Basin. The Company’s corporate headquarters are located in Denver, Colorado.
(2)Summary of Significant Accounting Policies
(a)Basis of Presentation
These condensed consolidated financial statements have been prepared pursuant to the rules and regulations of the SEC applicable to interim financial information and should be read in the context of the December 31, 2016 consolidated financial statements and notes thereto for a more complete understanding of the Company’s operations, financial position, and accounting policies. The December 31, 2016 consolidated financial statements have been filed with the SEC in the Company’s 2016 Form 10-K.
The accompanying unaudited condensed consolidated financial statements of the Company have been prepared in accordance with accounting principles generally accepted in the United States (“GAAP”) for interim financial information, and, accordingly, do not include all of the information and footnotes required by GAAP for complete consolidated financial statements. In the opinion of management, the accompanying unaudited condensed consolidated financial statements include all adjustments (consisting of normal and recurring accruals) considered necessary to present fairly the Company’s financial position as of December 31, 2016 and March 31, 2017, the results of its operations for the three months ended March 31, 2016 and 2017, and its cash flows for the three months ended March 31, 2016 and 2017. The Company has no items of other comprehensive income or loss; therefore, its net income or loss is identical to its comprehensive income or loss. Operating results for the period ended March 31, 2017 are not necessarily indicative of the results that may be expected for the full year because of the impact of fluctuations in prices received for natural gas, NGLs, and oil, natural production declines, the uncertainty of exploration and development drilling results, fluctuations in the fair value of derivative instruments, and other factors. The Company’s statement of cash flows for the three months ended March 31, 2016 includes reclassifications within current liabilities that were made to conform to the three months ended March 31, 2017 presentation. The Company’s statement of operations and comprehensive income (loss) for the three months ended March 31, 2016 includes reclassifications within operating expenses that were made to conform to the three months ended March 31, 2017 presentation.
The Company’s exploration and production activities are accounted for under the successful efforts method.
As of the date these financial statements were filed with the SEC, the Company completed its evaluation of potential subsequent events for disclosure and no items requiring disclosure were identified.
(b)Principles of Consolidation
The accompanying condensed consolidated financial statements include the accounts of Antero, its wholly-owned subsidiaries, any entities in which the Company owns a controlling interest, and variable interest entities (“VIEs”) for which the Company is the primary beneficiary.
We have determined that Antero Midstream is a VIE for which Antero is the primary beneficiary. Therefore, Antero Midstream’s accounts are included in the Company’s condensed consolidated financial statements. Antero is the primary beneficiary of Antero Midstream based on its power to direct the activities that most significantly impact Antero Midstream’s economic performance, and its obligation to absorb losses or receive benefits of Antero Midstream that could be significant to the Partnership. Antero Midstream was formed to own, operate, and develop midstream energy assets to service Antero’s production under long-term service contracts. Antero owned 58.6% of the outstanding limited partner interests in Antero Midstream at March 31, 2017, and Antero’s officers and management group also act as management of Antero Midstream. Antero Midstream GP LP (“AMGP”) indirectly owns the general
8
ANTERO RESOURCES CORPORATION
Notes to Condensed Consolidated Financial Statements
December 31, 2016 and March 31, 2017
partnership interest in Antero Midstream as well as Antero IDR Holdings LLC, which owns the incentive distribution rights in Antero Midstream. AMGP has not provided, and is not expected to provide, financial support to Antero Midstream.
Antero and Antero Midstream have 20-year contracts with automatic renewal provisions, whereby Antero has dedicated the rights for gathering and compression, and water delivery and handling services to Antero Midstream on a fixed-fee basis on a substantial portion of Antero’s current acreage and future acquired acreage, in each case, except for acreage that was already dedicated to other parties prior to entering into the service contracts or that was acquired subject to a pre-existing dedication. The contracts call for Antero to present, in advance, its drilling and completion plans in order for Antero Midstream to develop gathering and compression, water delivery and handling, and gas processing assets to service Antero’s operations. Consequently, the drilling and completion capital investment decisions made by Antero control the development and operation of all of Antero Midstream’s assets. Because of these contractual obligations and the capital requirements related to these obligations, Antero Midstream has and will devote substantially all of its resources to servicing Antero’s operations, and revenues from Antero will provide substantially all of Antero Midstream’s financial support and, therefore, its ability to finance its operations. As a result of the long-term contractual commitment to support Antero’s substantial growth plans, Antero Midstream will be practically and physically constrained from providing any substantive amount of services to third-parties. Therefore, Antero controls the activities that most significantly impact Antero Midstream’s economic performance.
All significant intercompany accounts and transactions have been eliminated in the Company’s condensed consolidated financial statements. Noncontrolling interest in the Company’s condensed consolidated financial statements represents the interests in Antero Midstream which are owned by the public and the holder of Antero Midstream’s incentive distribution rights. Noncontrolling interest is included as a component of equity in the Company’s condensed consolidated balance sheets.
Investments in entities for which the Company exercises significant influence, but not control, are accounted for under the equity method. Such investments are included in investments in unconsolidated affiliates on the Company’s condensed consolidated balance sheets. Income from equity method investees is included in equity in earnings of unconsolidated affiliates on the Company’s condensed consolidated statements of operations and cash flows.
(c)Use of Estimates
The preparation of consolidated financial statements in conformity with GAAP requires management to make estimates and assumptions that affect the reported assets and liabilities and disclosure of contingent assets and liabilities at the date of the consolidated financial statements, as well as the reported amounts of revenues and expenses during the reporting period. Changes in facts and circumstances or discovery of new information may result in revised estimates, and actual results could differ from those estimates.
The Company’s condensed consolidated financial statements are based on a number of significant estimates including estimates of natural gas, NGLs, and oil reserve quantities, which are the basis for the calculation of depletion and impairment of oil and gas properties. Reserve estimates by their nature are inherently imprecise. Other items in the Company’s consolidated financial statements which involve the use of significant estimates include derivative assets and liabilities, accrued revenue, deferred income taxes, equity-based compensation, asset retirement obligations, depreciation, amortization, and commitments and contingencies.
(d)Risks and Uncertainties
Historically, the markets for natural gas, NGLs, and oil have experienced significant price fluctuations. Price fluctuations can result from variations in weather, levels of production, availability of transportation capacity to other regions of the country, and various other factors. Increases or decreases in the prices the Company receives for its production could have a significant impact on the Company’s future results of operations and reserve quantities.
(e)Derivative Financial Instruments
In order to manage its exposure to natural gas, NGLs, and oil price volatility, the Company enters into derivative transactions from time to time, which may include commodity swap agreements, basis swap agreements, collar agreements, and other similar agreements related to the price risk associated with the Company’s production. To the extent legal right of offset exists with a counterparty, the Company reports derivative assets and liabilities on a net basis. The Company has exposure to credit risk to the
9
ANTERO RESOURCES CORPORATION
Notes to Condensed Consolidated Financial Statements
December 31, 2016 and March 31, 2017
extent that the counterparty is unable to satisfy its settlement obligations. The Company actively monitors the creditworthiness of counterparties and assesses the impact, if any, on its derivative position.
The Company records derivative instruments on the condensed consolidated balance sheets as either assets or liabilities measured at fair value and records changes in the fair value of derivatives in current earnings as they occur. Changes in the fair value of commodity derivatives, including gains or losses on settled derivatives, are classified as revenues on the Company’s condensed consolidated statements of operations. The Company’s derivatives have not been designated as hedges for accounting purposes.
(f)Industry Segments and Geographic Information
Management has evaluated how the Company is organized and managed and has identified the following segments: (1) the exploration, development, and production of natural gas, NGLs, and oil; (2) gathering and processing; (3) water handling and treatment; and (4) marketing of excess firm transportation capacity.
All of the Company’s assets are located in the United States and substantially all of its production revenues are attributable to customers located in the United States.
(g)Earnings (Loss) per Common Share
Earnings (loss) per common share—basic for each period is computed by dividing net income (loss) attributable to Antero by the basic weighted average number of shares outstanding during the period. Earnings (loss) per common share—assuming dilution for each period is computed after giving consideration to the potential dilution from outstanding equity awards, calculated using the treasury stock method. The Company includes performance share unit awards in the calculation of diluted weighted average shares outstanding based on the number of common shares that would be issuable if the end of the period were also the end of the performance period required for the vesting of such awards. During periods in which the Company incurs a net loss, diluted weighted average shares outstanding are equal to basic weighted average shares outstanding because the effect of all equity awards is antidilutive. The following is a reconciliation of the Company’s basic weighted average shares outstanding to diluted weighted average shares outstanding during the periods presented (in thousands):
|
|
|
|
|
|
|
|
|
|
Three months ended March 31, |
|
||
|
|
|
2016 |
|
2017 |
|
|
Basic weighted average number of shares outstanding |
|
277,050 |
|
314,954 |
|
|
Add: Dilutive effect of non-vested restricted stock units |
|
— |
|
770 |
|
|
Add: Dilutive effect of outstanding stock options |
|
— |
|
— |
|
|
Add: Dilutive effect of performance stock units |
|
— |
|
45 |
|
|
Diluted weighted average number of shares outstanding |
|
277,050 |
|
315,769 |
|
|
|
|
|
|
|
|
|
Weighted average number of outstanding equity awards excluded from calculation of diluted earnings per common share(1): |
|
|
|
|
|
|
Non-vested restricted stock and restricted stock units |
|
6,741 |
|
1,509 |
|
|
Outstanding stock options |
|
720 |
|
683 |
|
|
Performance stock units |
|
214 |
|
660 |
|
(1) The potential dilutive effects of these awards were excluded from the computation of earnings per common share—assuming dilution because the inclusion of these awards would have been anti-dilutive. When the Company incurs a net loss, all outstanding equity awards are excluded from the calculation of diluted loss per common share because the inclusion of these awards would be anti-dilutive.
(h)Cash and Cash Equivalents
The Company considers all liquid investments purchased with an initial maturity of three months or less to be cash equivalents. The carrying value of cash and cash equivalents approximates fair value due to the short term nature of these instruments. From time to time, the Company may be in a position of a “book overdraft” in which outstanding checks exceed cash and cash equivalents. The Company classifies book overdrafts within accounts payable within its condensed consolidated balance sheets, and classifies the
10
ANTERO RESOURCES CORPORATION
Notes to Condensed Consolidated Financial Statements
December 31, 2016 and March 31, 2017
change in accounts payable associated with book overdrafts as an operating activity within its condensed consolidated statements of cash flows.
(3)Antero Midstream Partners LP
In 2014, the Company formed Antero Midstream to own, operate, and develop midstream energy assets that service Antero’s production. Antero Midstream’s assets consist of gathering systems and facilities, and water handling and treatment facilities, through which it provides services to Antero under long-term, fixed-fee contracts. AMGP indirectly owns the general partnership interest in Antero Midstream as well as Antero IDR Holdings LLC, which owns the incentive distribution rights in Antero Midstream. Antero Midstream is an unrestricted subsidiary as defined by Antero’s revolving bank credit facility. As an unrestricted subsidiary, Antero Midstream and its subsidiaries are not guarantors of Antero’s obligations, and Antero is not a guarantor of Antero Midstream’s obligations (see Note 12).
In connection with Antero’s contribution of its water handling and treatment assets to Antero Midstream in September 2015, Antero Midstream agreed to pay Antero (a) $125 million in cash if Antero Midstream delivers 176,295,000 barrels or more of fresh water during the period between January 1, 2017 and December 31, 2019 and (b) an additional $125 million in cash if Antero Midstream delivers 219,200,000 barrels or more of fresh water during the period between January 1, 2018 and December 31, 2020.
In 2016, the Partnership entered into an Equity Distribution Agreement (the “Distribution Agreement”). Pursuant to the terms of the agreement, the Partnership may sell, from time to time through brokers acting as its sales agents, common units representing limited partner interests having an aggregate offering price of up to $250 million. Sales of the common units are made by means of ordinary brokers’ transactions on the New York Stock Exchange, at market prices, in block transactions, or as otherwise agreed to between the Partnership and the sales agents. Proceeds are used for general partnership purposes, which may include repayment of indebtedness and funding working capital or capital expenditures. The Partnership is under no obligation to offer and sell common units under the Distribution Agreement.
The Partnership did not sell any common units under the Distribution Agreement during the three months ended March 31, 2017. As of March 31, 2017, Antero Midstream had the capacity to issue additional common units under the Distribution Agreement up to an aggregate sales price of $183.8 million.
On May 26, 2016, Antero Midstream purchased a 15% equity interest in a regional gathering pipeline. This investment is accounted for under the equity method.
On February 6, 2017, Antero Midstream formed a joint venture (the “Joint Venture”) to develop processing assets in Appalachia with MarkWest Energy Partners, L.P. (“MarkWest”), a wholly owned subsidiary of MPLX, L.P. Antero Midstream and MarkWest each own a 50% interest in the Joint Venture and MarkWest operates the Joint Venture assets. The Joint Venture assets consist of processing plants in West Virginia and a one-third interest in a recently commissioned MarkWest fractionator in Ohio. The joint venture is accounted for under the equity method.
In conjunction with the formation of the Joint Venture, on February 10, 2017 Antero Midstream issued 6,900,000 common units, including the underwriters’ purchase option, generating net proceeds of approximately $223 million. Antero Midstream used the net proceeds to fund the initial contribution to the Joint Venture, repay outstanding borrowings under its credit facility, and for general partnership purposes.
Antero owned approximately 60.9% and 58.6% of the limited partner interests of Antero Midstream at December 31, 2016 and March 31, 2017, respectively.
11
ANTERO RESOURCES CORPORATION
Notes to Condensed Consolidated Financial Statements
December 31, 2016 and March 31, 2017
(4)Accrued Liabilities
Accrued liabilities as of December 31, 2016 and March 31, 2017 consisted of the following items (in thousands):
|
|
|
December 31, 2016 |
|
March 31, 2017 |
|
||
|
Capital expenditures |
|
$ |
159,811 |
|
|
162,001 |
|
|
Gathering, compression, processing, and transportation expenses |
|
|
75,223 |
|
|
82,047 |
|
|
Marketing expenses |
|
|
52,822 |
|
|
35,811 |
|
|
Interest expense |
|
|
35,533 |
|
|
66,331 |
|
|
Other |
|
|
70,414 |
|
|
70,398 |
|
|
|
|
$ |
393,803 |
|
|
416,588 |
|
(5)Long-Term Debt
Long-term debt was as follows at December 31, 2016 and March 31, 2017 (in thousands):
|
|
|
|
|
|
|
|
|
|
|
|
December 31, 2016 |
|
March 31, 2017 |
|
||
|
Antero: |
|
|
|
|
|
|
|
|
Bank credit facility(a) |
|
$ |
440,000 |
|
|
520,000 |
|
|
5.375% senior notes due 2021(b) |
|
|
1,000,000 |
|
|
1,000,000 |
|
|
5.125% senior notes due 2022(c) |
|
|
1,100,000 |
|
|
1,100,000 |
|
|
5.625% senior notes due 2023(d) |
|
|
750,000 |
|
|
750,000 |
|
|
5.00% senior notes due 2025(e) |
|
|
600,000 |
|
|
600,000 |
|
|
Net unamortized premium |
|
|
1,749 |
|
|
1,721 |
|
|
Net unamortized debt issuance costs |
|
|
(37,690) |
|
|
(36,598) |
|
|
Antero Midstream: |
|
|
|
|
|
|
|
|
Bank credit facility(g) |
|
|
210,000 |
|
|
200,000 |
|
|
5.375% senior notes due 2024(h) |
|
|
650,000 |
|
|
650,000 |
|
|
Net unamortized debt issuance costs |
|
|
(10,086) |
|
|
(9,821) |
|
|
|
|
$ |
4,703,973 |
|
|
4,775,302 |
|
Antero Resources Corporation
(a)Senior Secured Revolving Credit Facility
Antero has a senior secured revolving bank credit facility (the “Credit Facility”) with a consortium of bank lenders. Borrowings under the Credit Facility are subject to borrowing base limitations based on the collateral value of Antero’s assets and are subject to regular semiannual redeterminations. At March 31, 2017, the borrowing base was $4.75 billion and lender commitments were $4.0 billion. In April 2017, the borrowing base was reaffirmed at $4.75 billion, and lender commitments remain at $4.0 billion. The next redetermination of the borrowing base is scheduled to occur in October 2017. The maturity date of the Credit Facility is May 5, 2019.
The Credit Facility is ratably secured by mortgages on substantially all of Antero’s properties and guarantees from Antero’s restricted subsidiaries, as applicable. The Credit Facility contains certain covenants, including restrictions on indebtedness and dividends, and requirements with respect to working capital and interest coverage ratios. Interest is payable at a variable rate based on LIBOR or the prime rate, determined by Antero’s election at the time of borrowing. Antero was in compliance with all of the financial covenants under the Credit Facility as of December 31, 2016 and March 31, 2017.
As of March 31, 2017, Antero had a total outstanding balance under the Credit Facility of $520 million, with a weighted average interest rate of 2.75%, and outstanding letters of credit of $710 million. As of December 31, 2016, Antero had an outstanding balance under the Credit Facility of $440 million, with a weighted average interest rate of 2.44%, and outstanding letters of credit of $710 million. Commitment fees on the unused portion of the Credit Facility are due quarterly at rates ranging from 0.375% to 0.50% of the unused portion based on utilization.
12
ANTERO RESOURCES CORPORATION
Notes to Condensed Consolidated Financial Statements
December 31, 2016 and March 31, 2017
(b)5.375% Senior Notes Due 2021
On November 5, 2013, Antero issued $1 billion of 5.375% senior notes due November 21, 2021 (the “2021 notes”) at par. The 2021 notes are unsecured and effectively subordinated to the Credit Facility to the extent of the value of the collateral securing the Credit Facility. The 2021 notes rank pari passu to Antero’s other outstanding senior notes. The 2021 notes are guaranteed on a full and unconditional and joint and several senior unsecured basis by Antero’s wholly-owned subsidiaries and certain of its future restricted subsidiaries. Interest on the 2021 notes is payable on May 1 and November 1 of each year. Antero may redeem all or part of the 2021 notes at any time at redemption prices ranging from 104.031% currently to 100.00% on or after November 1, 2019. If Antero undergoes a change of control, the holders of the 2021 notes will have the right to require Antero to repurchase all or a portion of the notes at a price equal to 101% of the principal amount of the 2021 notes, plus accrued and unpaid interest.
(c)5.125% Senior Notes Due 2022
On May 6, 2014, Antero issued $600 million of 5.125% senior notes due December 1, 2022 (the “2022 notes”) at par. On September 18, 2014, Antero issued an additional $500 million of the 2022 notes at 100.5% of par. The 2022 notes are unsecured and effectively subordinated to the Credit Facility to the extent of the value of the collateral securing the Credit Facility. The 2022 notes rank pari passu to Antero’s other outstanding senior notes. The 2022 notes are guaranteed on a full and unconditional and joint and several senior unsecured basis by Antero’s wholly-owned subsidiaries and certain of its future restricted subsidiaries. Interest on the 2022 notes is payable on June 1 and December 1 of each year. Antero may redeem all or part of the 2022 notes at any time on or after June 1, 2017 at redemption prices ranging from 103.844% on or after June 1, 2017 to 100.00% on or after June 1, 2020. In addition, on or before June 1, 2017, Antero may redeem up to 35% of the aggregate principal amount of the 2022 notes with the net cash proceeds of certain equity offerings, if certain conditions are met, at a redemption price of 105.125% of the principal amount of the 2022 notes, plus accrued and unpaid interest. At any time prior to June 1, 2017, Antero may also redeem the 2022 notes, in whole or in part, at a price equal to 100% of the principal amount of the 2022 notes plus a “make-whole” premium and accrued and unpaid interest. If Antero undergoes a change of control, the holders of the 2022 notes will have the right to require Antero to repurchase all or a portion of the notes at a price equal to 101% of the principal amount of the 2022 notes, plus accrued and unpaid interest.
(d)5.625% Senior Notes Due 2023
On March 17, 2015, Antero issued $750 million of 5.625% senior notes due June 1, 2023 (the “2023 notes”) at par. The 2023 notes are unsecured and effectively subordinated to the Credit Facility to the extent of the value of the collateral securing the Credit Facility. The 2023 notes rank pari passu to Antero’s other outstanding senior notes. The 2023 notes are guaranteed on a full and unconditional and joint and several senior unsecured basis by Antero’s wholly-owned subsidiaries and certain of its future restricted subsidiaries. Interest on the 2023 notes is payable on June 1 and December 1 of each year. Antero may redeem all or part of the 2023 notes at any time on or after June 1, 2018 at redemption prices ranging from 104.219% on or after June 1, 2018 to 100.00% on or after June 1, 2021. In addition, on or before June 1, 2018, Antero may redeem up to 35% of the aggregate principal amount of the 2023 notes with the net cash proceeds of certain equity offerings, if certain conditions are met, at a redemption price of 105.625% of the principal amount of the 2023 notes, plus accrued and unpaid interest. At any time prior to June 1, 2018, Antero may also redeem the 2023 notes, in whole or in part, at a price equal to 100% of the principal amount of the 2023 notes plus a “make-whole” premium and accrued and unpaid interest. If Antero undergoes a change of control, the holders of the 2023 notes will have the right to require Antero to repurchase all or a portion of the notes at a price equal to 101% of the principal amount of the 2023 notes, plus accrued and unpaid interest.
(e) 5.00% Senior Notes Due 2025
On December 21, 2016, Antero issued $600 million of 5.00% senior notes due March 1, 2025 (the “2025 notes”) at par. The 2025 notes are unsecured and effectively subordinated to the Credit Facility to the extent of the value of the collateral securing the Credit Facility. The 2025 notes rank pari passu to Antero’s other outstanding senior notes. The 2025 notes are guaranteed on a full and unconditional and joint and several senior unsecured basis by Antero’s wholly-owned subsidiaries and certain of its future restricted subsidiaries. Interest on the 2025 notes is payable on March 1 and September 1 of each year. Antero may redeem all or part of the 2025 notes at any time on or after March 1, 2020 at redemption prices ranging from 103.750% on or after March 1, 2020 to 100.00% on or after March 1, 2023. In addition, on or before March 1, 2020, Antero may redeem up to 35% of the aggregate principal amount of the 2025 notes with the net cash proceeds of certain equity offerings, if certain conditions are met, at a redemption
13
ANTERO RESOURCES CORPORATION
Notes to Condensed Consolidated Financial Statements
December 31, 2016 and March 31, 2017
price of 105.00% of the principal amount of the 2025 notes, plus accrued and unpaid interest. At any time prior to March 1, 2020, Antero may also redeem the 2025 notes, in whole or in part, at a price equal to 100% of the principal amount of the 2025 notes plus a “make-whole” premium and accrued and unpaid interest. If Antero undergoes a change of control, the holders of the 2025 notes will have the right to require Antero to repurchase all or a portion of the notes at a price equal to 101% of the principal amount of the 2025 notes, plus accrued and unpaid interest.
(f)Treasury Management Facility
Antero has a stand-alone revolving note with a lender under the Credit Facility which provides for up to $25 million of cash management obligations in order to facilitate Antero’s daily treasury management. Borrowings under the revolving note are secured by the collateral for the Credit Facility. Borrowings under the revolving note bear interest at the lender’s prime rate plus 1.0%. The note matures on May 1, 2018. At December 31, 2016 and March 31, 2017, there were no outstanding borrowings under this note.
Antero Midstream Partners LP
(g)Senior Secured Revolving Credit Facility – Antero Midstream
Antero Midstream has a secured revolving credit facility (the “Midstream Facility”) with a syndicate of bank lenders. At March 31, 2017, lender commitments were $1.5 billion. The maturity date of the Midstream Facility is November 10, 2019.
The Midstream Facility is ratably secured by mortgages on substantially all of the properties of Antero Midstream and guarantees from its restricted subsidiaries, as applicable. The Midstream Facility contains certain covenants, including restrictions on indebtedness and certain distributions to owners, and requirements with respect to leverage and interest coverage ratios. Interest is payable at a variable rate based on LIBOR or the prime rate, determined by election at the time of borrowing. Antero Midstream was in compliance with all of the financial covenants under the Midstream Facility as of December 31, 2016 and March 31, 2017.
As of March 31, 2017, Antero Midstream had an outstanding balance under the Midstream Facility of $200 million with a weighted average interest rate of 2.51%. As of December 31, 2016, Antero Midstream had a total outstanding balance under the Midstream Facility of $210 million with a weighted average interest rate of 2.23%. Commitment fees on the unused portion of the Midstream Facility are due quarterly at rates ranging from 0.25% to 0.375% of the unused portion based on utilization.
(h)5.375% Senior Notes Due 2024 – Antero Midstream
On September 13, 2016, Antero Midstream and its wholly-owned subsidiary, Antero Midstream Finance Corporation (“Midstream Finance Corp.”) as co-issuers, issued $650 million in aggregate principal amount of 5.375% senior notes due September 15, 2024 (the “2024 Midstream notes”) at par. The 2024 Midstream notes are unsecured and effectively subordinated to the Midstream Facility to the extent of the value of the collateral securing the Midstream Facility. The 2024 Midstream notes are guaranteed on a full and unconditional and joint and several senior unsecured basis by Antero Midstream’s wholly-owned subsidiaries, excluding Midstream Finance Corp., and certain of Antero Midstream’s future restricted subsidiaries. Interest on the 2024 Midstream notes is payable on March 15 and September 15 of each year. Antero Midstream may redeem all or part of the 2024 Midstream notes at any time on or after September 15, 2019 at redemption prices ranging from 104.031% on or after September 15, 2019 to 100.00% on or after September 15, 2022. In addition, prior to September 15, 2019, Antero Midstream may redeem up to 35% of the aggregate principal amount of the 2024 Midstream notes with an amount of cash not greater than the net cash proceeds of certain equity offerings, if certain conditions are met, at a redemption price of 105.375% of the principal amount of the 2024 Midstream notes, plus accrued and unpaid interest. At any time prior to September 15, 2019, Antero Midstream may also redeem the 2024 Midstream notes, in whole or in part, at a price equal to 100% of the principal amount of the 2024 Midstream notes plus a “make-whole” premium and accrued and unpaid interest. If Antero Midstream undergoes a change of control, the holders of the 2024 Midstream notes will have the right to require Antero Midstream to repurchase all or a portion of the notes at a price equal to 101% of the principal amount of the 2024 Midstream notes, plus accrued and unpaid interest.
14
ANTERO RESOURCES CORPORATION
Notes to Condensed Consolidated Financial Statements
December 31, 2016 and March 31, 2017
(6)Asset Retirement Obligations
The following is a reconciliation of the Company’s asset retirement obligations for the three months ended March 31, 2017 (in thousands):
|
Asset retirement obligations—December 31, 2016 |
|
$ |
32,736 |
|
|
Obligations incurred for wells drilled and producing properties acquired |
|
|
1,310 |
|
|
Accretion expense |
|
|
637 |
|
|
Asset retirement obligations—March 31, 2017 |
|
$ |
34,683 |
|
Asset retirement obligations are included in other liabilities on the Company’s condensed consolidated balance sheets.
(7)Equity-Based Compensation
Antero is authorized to grant up to 16,906,500 shares of common stock to employees and directors of the Company under the Antero Resources Corporation Long-Term Incentive Plan (the “Plan”). The Plan allows equity-based compensation awards to be granted in a variety of forms, including stock options, stock appreciation rights, restricted stock awards, restricted stock unit awards, dividend equivalent awards, and other types of awards. The terms and conditions of the awards granted are established by the Compensation Committee of Antero’s Board of Directors. A total of 8,555,117 shares were available for future grant under the Plan as of March 31, 2017.
Antero Midstream’s general partner is authorized to grant up to 10,000,000 common units representing limited partner interests in Antero Midstream under the Antero Midstream Partners LP Long-Term Incentive Plan (the “Midstream Plan”) to non-employee directors of Antero Midstream’s general partner and certain officers, employees, and consultants of Antero Midstream’s general partner and its affiliates (which include Antero). A total of 7,944,445 common units were available for future grant under the Midstream Plan as of March 31, 2017.
The Company’s equity-based compensation expense, by type of award, was as follows for the three months ended March 31, 2016 and 2017 (in thousands):
|
|
|
|
|
|
|
|
|
|
|
|
Three months ended March 31, |
|
||||
|
|
|
2016 |
|
2017 |
|
||
|
Restricted stock unit awards |
|
$ |
17,467 |
|
|
18,225 |
|
|
Stock options |
|
|
660 |
|
|
620 |
|
|
Performance share unit awards |
|
|
883 |
|
|
2,135 |
|
|
Antero Midstream phantom unit awards |
|
|
3,988 |
|
|
4,043 |
|
|
Equity awards issued to directors |
|
|
472 |
|
|
480 |
|
|
Total expense |
|
$ |
23,470 |
|
|
25,503 |
|
Restricted Stock and Restricted Stock Unit Awards
Restricted stock and restricted stock unit awards vest subject to the satisfaction of service requirements. Expense related to each restricted stock and restricted stock unit award is recognized on a straight-line basis over the requisite service period of the entire award. Forfeitures are accounted for as they occur by reversing expense previously recognized for awards that were forfeited during the period. The grant date fair values of these awards are determined based on the closing price of the Company’s common stock on the date of the grant.
15
ANTERO RESOURCES CORPORATION
Notes to Condensed Consolidated Financial Statements
December 31, 2016 and March 31, 2017
A summary of restricted stock and restricted stock unit awards activity for the three months ended March 31, 2017 is as follows:
|
|
|
|
|
|
|
|
|
|
|
|
|
|
|
|
Weighted |
|
Aggregate |
|
||
|
|
|
Number of |
|
grant date |
|
intrinsic value |
|
||
|
Total awarded and unvested—December 31, 2016 |
|
5,353,447 |
|
$ |
31.77 |
|
$ |
126,609 |
|
|
Granted |
|
37,178 |
|
$ |
25.62 |
|
|
|
|
|
Vested |
|
(139,635) |
|
$ |
28.71 |
|
|
|
|
|
Forfeited |
|
(84,733) |
|
$ |
25.87 |
|
|
|
|
|
Total awarded and unvested—March 31, 2017 |
|
5,166,257 |
|
$ |
31.87 |
|
$ |
117,842 |
|
Intrinsic values are based on the closing price of the Company’s stock on the referenced dates. As of March 31, 2017, there was $111.0 million of unamortized equity-based compensation expense related to unvested restricted stock units. That expense is expected to be recognized over a weighted average period of approximately 1.8 years.
Stock Options
Stock options granted under the Plan vest over periods from one to four years and have a maximum contractual life of 10 years. Expense related to stock options is recognized on a straight-line basis over the requisite service period of the entire award. Forfeitures are accounted for as they occur by reversing expense previously recognized for awards that were forfeited during the period. Stock options are granted with an exercise price equal to or greater than the market price of the Company’s common stock on the date of grant.
A summary of stock option activity for the three months ended March 31, 2017 is as follows:
|
|
|
|
|
|
|
|
|
|
|
|
|
|
|
|
|
|
|
|
Weighted |
|
|
|
||
|
|
|
|
|
Weighted |
|
average |
|
Intrinsic |
|
||
|
|
|
Stock |
|
exercise |
|
contractual |
|
value |
|
||
|
Outstanding at December 31, 2016 |
|
687,929 |
|
$ |
50.46 |
|
8.12 |
|
$ |
— |
|
|
Granted |
|
— |
|
$ |
— |
|
|
|
|
|
|
|
Exercised |
|
— |
|
|
— |
|
|
|
|
|
|
|
Forfeited |
|
(6,208) |
|
$ |
50.00 |
|
|
|
|
|
|
|
Expired |
|
— |
|
|
— |
|
|
|
|
|
|
|
Outstanding at March 31, 2017 |
|
681,721 |
|
$ |
50.47 |
|
7.87 |
|
$ |
— |
|
|
Vested or expected to vest as of March 31, 2017 |
|
681,721 |
|
$ |
50.47 |
|
7.87 |
|
$ |
— |
|
|
Exercisable at March 31, 2017 |
|
216,924 |
|
$ |
51.18 |
|
7.60 |
|
$ |
— |
|
Intrinsic value is based on the exercise price of the options and the closing price of the Company’s stock on the referenced dates.
As of March 31, 2017, there was $4.7 million of unamortized equity-based compensation expense related to unvested stock options. That expense is expected to be recognized over a weighted average period of approximately 2.0 years.
Performance Share Unit Awards
Performance Share Unit Awards Based on Price Targets
In 2016, the Company granted performance share unit awards (“PSUs”) to certain of its executive officers that are based on price targets. The vesting of these PSUs is conditioned on the closing price of the Company’s common stock achieving specific price thresholds over 10-day periods, subject to the following vesting restrictions: no PSUs may vest before the first anniversary of the grant date; no more than one-third of the PSUs may vest before the second anniversary of the grant date; and no more than two-thirds of the PSUs may vest before the third anniversary of the grant date. Any PSUs which have not vested by the fifth anniversary of the grant date will expire. Expense related to these PSUs is recognized on a graded basis over three years.
16
ANTERO RESOURCES CORPORATION
Notes to Condensed Consolidated Financial Statements
December 31, 2016 and March 31, 2017
Performance Share Unit Awards Based on Total Shareholder Return
In 2016, the Company also granted PSUs to certain of its employees and executive officers which vest based on the total shareholder return (“TSR”) of the Company’s common stock relative to the TSR of a peer group of companies over a three-year performance period. The number of performance shares which may ultimately be earned ranges from zero to 200% of the PSUs granted. Expense related to these PSUs is recognized on a straight-line basis over three years.
Summary Information for Performance Share Unit Awards
A summary of PSU activity for the three months ended March 31, 2017 is as follows:
|
|
|
|
|
|
|
|
|
|
|
Number of |
|
Weighted |
|
|
|
Total awarded and unvested—December 31, 2016 |
|
785,301 |
|
$ |
29.75 |
|
|
Granted |
|
— |
|
$ |
— |
|
|
Vested |
|
(41,666) |
|
$ |
27.38 |
|
|
Forfeited |
|
— |
|
$ |
— |
|
|
Total awarded and unvested—March 31, 2017 |
|
743,635 |
|
$ |
29.88 |
|
As of March 31, 2017, there was $12.5 million of unamortized equity-based compensation expense related to unvested PSUs. That expense is expected to be recognized over a weighted average period of approximately 1.9 years.
Antero Midstream Partners Phantom Unit Awards
Phantom units granted by Antero Midstream vest subject to the satisfaction of service requirements, upon the completion of which common units in Antero Midstream are delivered to the holder of the phantom units. These phantom units are treated, for accounting purposes, as if Antero Midstream distributed the units to Antero. Antero recognizes compensation expense as the units are granted to employees, and a portion of the expense is allocated to Antero Midstream. Expense related to each phantom unit award is recognized on a straight-line basis over the requisite service period of the entire award. Forfeitures are accounted for as they occur by reversing expense previously recognized for awards that were forfeited during the period. The grant date fair values of these awards are determined based on the closing price of Antero Midstream’s common units on the date of grant. A summary of phantom unit awards activity for the three months ended March 31, 2017 is as follows:
|
|
|
|
|
|
|
|
|
|
|
|
|
|
Number of |
|
Weighted |
|
Aggregate |
|
||
|
Total awarded and unvested—December 31, 2016 |
|
1,331,961 |
|
$ |
27.31 |
|
$ |
41,131 |
|
|
Granted |
|
5,967 |
|
$ |
33.52 |
|
|
|
|
|
Vested |
|
— |
|
$ |
— |
|
|
|
|
|
Forfeited |
|
(16,327) |
|
$ |
29.00 |
|
|
|
|
|
Total awarded and unvested—March 31, 2017 |
|
1,321,601 |
|
$ |
27.33 |
|
$ |
43,824 |
|
Intrinsic values are based on the closing price of Antero Midstream’s common units on the referenced dates. As of March 31, 2017, there was $29.0 million of unamortized equity-based compensation expense related to unvested phantom unit awards. That expense is expected to be recognized over a weighted average period of approximately 1.9 years.
(8)Financial Instruments
The carrying values of accounts receivable and accounts payable at December 31, 2016 and March 31, 2017 approximated market values because of their short-term nature. The carrying values of the amounts outstanding under the Credit Facility and Midstream Facility at December 31, 2016 and March 31, 2017 approximated fair value because the variable interest rates are reflective of current market conditions.
17
ANTERO RESOURCES CORPORATION
Notes to Condensed Consolidated Financial Statements
December 31, 2016 and March 31, 2017
Based on Level 2 market data inputs, the fair value of Antero’s senior notes was approximately $3.5 billion at December 31, 2016 and March 31, 2017. Based on Level 2 market data inputs, the fair value of Antero Midstream’s senior notes was approximately $657 million at December 31, 2016 and $661 million at March 31, 2017.
See note 9 for information regarding the fair value of derivative financial instruments.
(9)Derivative Instruments
(a)Commodity Derivatives
The Company periodically enters into natural gas, NGLs, and oil derivative contracts with counterparties to hedge the price risk associated with its production. These derivatives are not held for trading purposes. To the extent that changes occur in the market prices of natural gas, NGLs, and oil, the Company is exposed to market risk on these open contracts. This market risk exposure is generally offset by the change in market prices of natural gas, NGLs, and oil recognized upon the ultimate sale of the Company’s production.
The Company was party to various fixed price commodity swap contracts that settled during the three months ended March 31, 2016 and 2017. The Company enters into these swap contracts when management believes that favorable future sales prices for the Company’s production can be secured. Under these swap agreements, when actual commodity prices upon settlement exceed the fixed price provided by the swap contracts, the Company pays the difference to the counterparty. When actual commodity prices upon settlement are below the contractually provided fixed price, the Company receives the difference from the counterparty. In addition to fixed price swap contracts, the Company has entered into basis swap contracts in order to hedge the difference between the New York Mercantile Exchange (“NYMEX”) index price and a local index price at which the Company sells a portion of its natural gas production.
The Company’s derivative swap contracts have not been designated as hedges for accounting purposes; therefore, all gains and losses are recognized in the Company’s statements of operations.
18
ANTERO RESOURCES CORPORATION
Notes to Condensed Consolidated Financial Statements
December 31, 2016 and March 31, 2017
As of March 31, 2017, the Company’s fixed price natural gas and NGLs swap positions from April 1, 2017 through December 31, 2023 were as follows (abbreviations in the table refer to the index to which the swap position is tied, as follows: NYMEX=Henry Hub; CGTLA=Columbia Gas Louisiana Onshore; CCG=Chicago City Gate; Mont Belvieu-Ethane=Mont Belvieu Purity Ethane; Mont Belvieu-Propane=Mont Belvieu Propane; NYMEX-WTI=West Texas Intermediate):
|
|
|
|
|
|
|
|
|
|
|
|
|
|
|
Natural gas |
|
Oil |
|
Natural Gas |
|
Weighted |
|
|
|
Three months ending June 30, 2017: |
|
|
|
|
|
|
|
|
|
|
|
NYMEX ($/MMBtu) |
|
1,370,000 |
|
— |
|
— |
|
$ |
3.26 |
|
|
CGTLA ($/MMBtu) |
|
420,000 |
|
— |
|
— |
|
$ |
4.13 |
|
|
CCG ($/MMBtu) |
|
70,000 |
|
— |
|
— |
|
$ |
4.38 |
|
|
NYMEX-WTI ($/Bbl) |
|
— |
|
3,000 |
|
— |
|
$ |
54.75 |
|
|
Mont Belvieu-Ethane ($/Gallon) |
|
— |
|
— |
|
20,000 |
|
$ |
0.25 |
|
|
Mont Belvieu-Propane ($/Gallon) |
|
— |
|
— |
|
27,500 |
|
$ |
0.38 |
|
|
Total |
|
1,860,000 |
|
3,000 |
|
47,500 |
|
|
|
|
|
Three months ending September 30, 2017: |
|
|
|
|
|
|
|
|
|
|
|
NYMEX ($/MMBtu) |
|
1,370,000 |
|
— |
|
— |
|
$ |
3.33 |
|
|
CGTLA ($/MMBtu) |
|
420,000 |
|
— |
|
— |
|
$ |
4.20 |
|
|
CCG ($/MMBtu) |
|
70,000 |
|
— |
|
— |
|
$ |
4.45 |
|
|
NYMEX-WTI ($/Bbl) |
|
— |
|
3,000 |
|
— |
|
$ |
54.75 |
|
|
Mont Belvieu-Ethane ($/Gallon) |
|
— |
|
— |
|
20,000 |
|
$ |
0.25 |
|
|
Mont Belvieu-Propane ($/Gallon) |
|
— |
|
— |
|
27,500 |
|
$ |
0.39 |
|
|
Total |
|
1,860,000 |
|
3,000 |
|
47,500 |
|
|
|
|
|
Three months ending December 31, 2017: |
|
|
|
|
|
|
|
|
|
|
|
NYMEX ($/MMBtu) |
|
1,370,000 |
|
— |
|
— |
|
$ |
3.46 |
|
|
CGTLA ($/MMBtu) |
|
420,000 |
|
— |
|
— |
|
$ |
4.37 |
|
|
CCG ($/MMBtu) |
|
70,000 |
|
— |
|
— |
|
$ |
4.68 |
|
|
NYMEX-WTI ($/Bbl) |
|
— |
|
3,000 |
|
— |
|
$ |
54.75 |
|
|
Mont Belvieu-Ethane ($/Gallon) |
|
— |
|
— |
|
20,000 |
|
$ |
0.25 |
|
|
Mont Belvieu-Propane ($/Gallon) |
|
— |
|
— |
|
27,500 |
|
$ |
0.40 |
|
|
Total |
|
1,860,000 |
|
3,000 |
|
47,500 |
|
|
|
|
|
Year ending December 31, 2018: |
|
|
|
|
|
|
|
|
|
|
|
NYMEX ($/MMBtu) |
|
2,002,500 |
|
|
|
— |
|
$ |
3.91 |
|
|
Mont Belvieu-Propane ($/Gallon) |
|
— |
|
|
|
2,000 |
|
$ |
0.65 |
|
|
Total |
|
2,002,500 |
|
|
|
2,000 |
|
|
|
|
|
Year ending December 31, 2019: |
|
|
|
|
|
|
|
|
|
|
|
NYMEX ($/MMBtu) |
|
2,330,000 |
|
|
|
|
|
$ |
3.70 |
|
|
Year ending December 31, 2020: |
|
|
|
|
|
|
|
|
|
|
|
NYMEX ($/MMBtu) |
|
1,417,500 |
|
|
|
|
|
$ |
3.63 |
|
|
Year ending December 31, 2021: |
|
|
|
|
|
|
|
|
|
|
|
NYMEX ($/MMBtu) |
|
710,000 |
|
|
|
|
|
$ |
3.31 |
|
|
Year ending December 31, 2022: |
|
|
|
|
|
|
|
|
|
|
|
NYMEX ($/MMBtu) |
|
810,000 |
|
|
|
|
|
$ |
3.18 |
|
|
Year ending December 31, 2023: |
|
|
|
|
|
|
|
|
|
|
|
NYMEX ($/MMBtu) |
|
50,000 |
|
|
|
|
|
$ |
2.83 |
|
As of March 31, 2017, the Company’s natural gas basis swap positions, which settle on the pricing index to basis differential of TCO to the NYMEX Henry Hub natural gas price, were as follows:
|
|
|
|
|
|
|
|
|
|
|
Natural gas |
|
Hedged Differential ($/MMBtu) |
|
|
|
|
|
|
|
|
|
|
|
Nine months ending December 31, 2017: |
|
125,000 |
|
$ |
(0.49) |
|
19
ANTERO RESOURCES CORPORATION
Notes to Condensed Consolidated Financial Statements
December 31, 2016 and March 31, 2017
As of March 31, 2017, the Company’s natural gas basis swap positions, which settle on the pricing index to basis differential of NYMEX Henry Hub to the TCO natural gas price, were as follows:
|
|
|
|
|
|
|
|
|
|
|
Natural gas |
|
Hedged Differential ($/MMBtu) |
|
|
|
|
|
|
|
|
|
|
|
Nine months ending December 31, 2017: |
|
125,000 |
|
$ |
0.32 |
|
(b)Summary
The following table presents a summary of the fair values of the Company’s derivative instruments and where such values are recorded in the consolidated balance sheets as of December 31, 2016 and March 31, 2017. None of the Company’s derivative instruments are designated as hedges for accounting purposes.
|
|
|
|
|
|
|
|
|
|
|
|
|
|
|
|
December 31, 2016 |
|
March 31, 2017 |
|
||||||
|
|
|
Balance sheet |
|
Fair value |
|
Balance sheet |
|
Fair value |
|
||
|
|
|
|
|
(In thousands) |
|
|
|
(In thousands) |
|
||
|
Asset derivatives not designated as hedges for accounting purposes: |
|
|
|
|
|
|
|
|
|
|
|
|
Commodity contracts |
|
Current assets |
|
$ |
73,022 |
|
Current assets |
|
|
237,086 |
|
|
Commodity contracts |
|
Long-term assets |
|
|
1,731,063 |
|
Long-term assets |
|
|
1,811,435 |
|
|
|
|
|
|
|
|
|
|
|
|
|
|
|
Total asset derivatives |
|
|
|
|
1,804,085 |
|
|
|
|
2,048,521 |
|
|
|
|
|
|
|
|
|
|
|
|
|
|
|
Liability derivatives not designated as hedges for accounting purposes: |
|
|
|
|
|
|
|
|
|
|
|
|
Commodity contracts |
|
Current liabilities |
|
|
203,635 |
|
Current liabilities |
|
|
54,277 |
|
|
Commodity contracts |
|
Long-term liabilities |
|
|
234 |
|
Long-term liabilities |
|
|
102 |
|
|
|
|
|
|
|
|
|
|
|
|
|
|
|
Total liability derivatives |
|
|
|
|
203,869 |
|
|
|
|
54,379 |
|
|
|
|
|
|
|
|
|
|
|
|
|
|
|
Net derivatives |
|
|
|
$ |
1,600,216 |
|
|
|
|
1,994,142 |
|
The following table presents the gross amounts of recognized derivative assets and liabilities, the amounts offset under master netting arrangements with counterparties, and the resulting net amounts presented in the consolidated balance sheets as of the dates presented, all at fair value (in thousands):
|
|
|
|
|
|
|
|
|
|
|
|
|
|
|
|
|
|
|
|
|
|
|
|
December 31, 2016 |
|
March 31, 2017 |
|
||||||||||||||
|
|
|
Gross |
|
Gross amounts |
|
Net amounts of assets on balance sheet |
|
Gross |
|
Gross amounts |
|
Net amounts of assets (liabilities) on balance sheet |
|
||||||
|
Commodity derivative assets |
|
$ |
1,914,245 |
|
|
(110,160) |
|
|
1,804,085 |
|
$ |
2,136,955 |
|
|
(88,434) |
|
|
2,048,521 |
|
|
Commodity derivative liabilities |
|
$ |
(324,667) |
|
|
120,798 |
|
|
(203,869) |
|
$ |
(113,718) |
|
|
59,339 |
|
|
(54,379) |
|
The following is a summary of derivative fair value gains and where such values are recorded in the condensed consolidated statements of operations for the three months ended March 31, 2016 and 2017 (in thousands):
|
|
|
Statement of |
|
Three months ended March 31, |
|
||||
|
|
|
location |
|
2016 |
|
2017 |
|
||
|
Commodity derivative fair value gains |
|
Revenue |
|
$ |
279,924 |
|
|
438,775 |
|
The fair value of commodity derivative instruments was determined using Level 2 inputs.
20
ANTERO RESOURCES CORPORATION
Notes to Condensed Consolidated Financial Statements
December 31, 2016 and March 31, 2017
(10)Contingencies
The Company is the plaintiff in two nearly identical lawsuits against South Jersey Gas Company and South Jersey Resources Group, LLC (collectively, “SJGC”) pending in United States District Court in Colorado. The Company filed suit against SJGC seeking relief for breach of contract and damages in the amounts that SJGC has short paid, and continues to short pay, the Company in connection with two long term gas contracts. Under those contracts, SJGC are long term purchasers of some of the Company’s natural gas production. Deliveries under the contracts began in October 2011 and the delivery obligation continues through October 2019. SJGC unilaterally breached the contracts claiming that the index prices specified in the contracts, and the index prices at which SJGC paid for deliveries from 2011 through September 2014, are no longer appropriate under the contracts because a market disruption event (as defined by the contract) has occurred and, as a result, a new index price is to be determined by the parties. Beginning in October 2014, SJGC began short paying the Company based on indexes unilaterally selected by SJGC and not the index specified in the contract. The Company contends that no market disruption event has occurred and that SJGC have breached the contracts by failing to pay the Company based on the express price terms of the contracts. Through March 31, 2017, the Company estimates that it is owed approximately $56 million more than SJGC has paid using the indexes unilaterally selected by them.
The Company and Washington Gas Light Company and WGL Midstream, Inc. (collectively, “WGL”) are also involved in a pricing dispute involving contracts that the Company began delivering gas under in January 2016. The Company has invoiced WGL at the index price specified in the contract and WGL has paid the Company based on that invoice price; however, WGL asserted that the index price was no longer appropriate under the contracts and that an undefined alternative index was more appropriate for the delivery point of the gas. In July 2016, the matter was referred to arbitration by the Colorado district court. In January 2017, the arbitration panel ruled in the Company’s favor. As a result, the index price has remained as specified in the contracts and there will be no adjustments to the invoices that have been paid by WGL. In March of 2017, WGL filed a second lawsuit against the Company in Colorado district court seeking relief for breach of contract and damages of more than $30 million, alleging that the Company breached its contractual obligations under two long term gas contracts by failing to deliver “TCO pool” gas. The Company has filed a motion to dismiss, and will continue to vigorously defend this lawsuit.
The Company is party to various other legal proceedings and claims in the ordinary course of its business. The Company believes that certain of these matters will be covered by insurance and that the outcome of other matters will not have a material adverse effect on the Company’s consolidated financial position, results of operations, or cash flows.
(11)Segment Information
See Note 2(f) for a description of the Company’s determination of its reportable segments. Revenues from gathering and processing and water handling and treatment operations are primarily derived from intersegment transactions for services provided to the Company’s exploration and production operations. Marketing revenues are primarily derived from activities to purchase and sell third-party natural gas and NGLs and to market excess firm transportation capacity to third parties.
Operating segments are evaluated based on their contribution to consolidated results, which is primarily determined by the respective operating income of each segment. General and administrative expenses are allocated to the gathering and processing and water handling and treatment segments based on the nature of the expenses and on a combination of the segments’ proportionate share of the Company’s consolidated property and equipment, capital expenditures, and labor costs, as applicable. General and administrative expenses related to the marketing segment are not allocated because they are immaterial. Other income, income taxes, and interest expense are primarily managed and evaluated on a consolidated basis. Intersegment sales are transacted at prices which approximate market. Accounting policies for each segment are the same as the Company’s accounting policies described in Note 2 to the condensed consolidated financial statements.
21
ANTERO RESOURCES CORPORATION
Notes to Condensed Consolidated Financial Statements
December 31, 2016 and March 31, 2017
The operating results and assets of the Company’s reportable segments were as follows for the three months ended March 31, 2016 and 2017 (in thousands):
|
|
|
|
|
|
|
|
|
|
|
|
|
|
|
|
|
|
|
Exploration |
|
Gathering and |
|
Water handling and treatment |
|
Marketing |
|
Elimination of |
|
Consolidated |
|
|
|
Three months ended March 31, 2016: |
|
|
|
|
|
|
|
|
|
|
|
|
|
|
|
Sales and revenues: |
|
|
|
|
|
|
|
|
|
|
|
|
|
|
|
Third-party |
|
$ |
617,944 |
|
3,587 |
|
257 |
|
99,216 |
|
— |
|
721,004 |
|
|
Intersegment |
|
|
3,825 |
|
66,040 |
|
66,189 |
|
— |
|
(136,054) |
|
— |
|
|
Total |
|
$ |
621,769 |
|
69,627 |
|
66,446 |
|
99,216 |
|
(136,054) |
|
721,004 |
|
|
|
|
|
|
|
|
|
|
|
|
|
|
|
|
|
|
Operating expenses: |
|
|
|
|
|
|
|
|
|
|
|
|
|
|
|
Lease operating |
|
$ |
11,332 |
|
— |
|
40,714 |
|
— |
|
(40,753) |
|
11,293 |
|
|
Gathering, compression, processing, and transportation |
|
|
267,445 |
|
7,170 |
|
— |
|
— |
|
(65,877) |
|
208,738 |
|
|
Depletion, depreciation, and amortization |
|
|
167,552 |
|
17,068 |
|
6,962 |
|
— |
|
— |
|
191,582 |
|
|
General and administrative expense |
|
|
43,552 |
|
9,335 |
|
3,756 |
|
— |
|
(356) |
|
56,287 |
|
|
Other operating expenses |
|
|
35,165 |
|
449 |
|
4,204 |
|
137,933 |
|
(3,396) |
|
174,355 |
|
|
Total |
|
|
525,046 |
|
34,022 |
|
55,636 |
|
137,933 |
|
(110,382) |
|
642,255 |
|
|
Operating income (loss) |
|
$ |
96,723 |
|
35,605 |
|
10,810 |
|
(38,717) |
|
(25,672) |
|
78,749 |
|
|
Equity in earnings of unconsolidated affiliates |
|
$ |
— |
|
— |
|
— |
|
— |
|
— |
|
— |
|
|
Segment assets |
|
$ |
12,738,875 |
|
1,518,554 |
|
524,348 |
|
35,983 |
|
(529,048) |
|
14,288,712 |
|
|
Capital expenditures for segment assets |
|
$ |
449,830 |
|
48,686 |
|
37,036 |
|
— |
|
(25,429) |
|
510,123 |
|
|
|
|
|
|
|
|
|
|
|
|
|
|
|
|
|
|
|
|
Exploration |
|
Gathering and |
|
Water handling and treatment |
|
Marketing |
|
Elimination of |
|
Consolidated |
|
|
|
Three months ended March 31, 2017: |
|
|
|
|
|
|
|
|
|
|
|
|
|
|
|
Sales and revenues: |
|
|
|
|
|
|
|
|
|
|
|
|
|
|
|
Third-party |
|
$ |
1,127,051 |
|
2,539 |
|
65 |
|
65,924 |
|
— |
|
1,195,579 |
|
|
Intersegment |
|
|
4,440 |
|
89,120 |
|
83,045 |
|
— |
|
(176,605) |
|
— |
|
|
Total |
|
$ |
1,131,491 |
|
91,659 |
|
83,110 |
|
65,924 |
|
(176,605) |
|
1,195,579 |
|
|
|
|
|
|
|
|
|
|
|
|
|
|
|
|
|
|
Operating expenses: |
|
|
|
|
|
|
|
|
|
|
|
|
|
|
|
Lease operating |
|
$ |
15,742 |
|
— |
|
38,622 |
|
— |
|
(38,813) |
|
15,551 |
|
|
Gathering, compression, processing, and transportation |
|
|
347,768 |
|
8,114 |
|
— |
|
— |
|
(89,053) |
|
266,829 |
|
|
Depletion, depreciation, and amortization |
|
|
174,969 |
|
19,924 |
|
7,836 |
|
— |
|
— |
|
202,729 |
|
|
General and administrative expense |
|
|
51,056 |
|
10,138 |
|
4,319 |
|
— |
|
(815) |
|
64,698 |
|
|
Other operating expenses |
|
|
53,618 |
|
— |
|
4,344 |
|
89,993 |
|
(3,526) |
|
144,429 |
|
|
Total |
|
|
643,153 |
|
38,176 |
|
55,121 |
|
89,993 |
|
(132,207) |
|
694,236 |
|
|
Operating income (loss) |
|
$ |
488,338 |
|
53,483 |
|
27,989 |
|
(24,069) |
|
(44,398) |
|
501,343 |
|
|
Equity in earnings of unconsolidated affiliates |
|
$ |
— |
|
2,231 |
|
— |
|
— |
|
— |
|
2,231 |
|
|
Segment assets |
|
$ |
12,989,013 |
|
1,941,668 |
|
645,943 |
|
27,730 |
|
(715,700) |
|
14,888,654 |
|
|
Capital expenditures for segment assets |
|
$ |
456,950 |
|
66,559 |
|
36,954 |
|
— |
|
(44,229) |
|
516,234 |
|
(12)Subsidiary Guarantors
Antero’s wholly-owned subsidiaries each have fully and unconditionally guaranteed Antero’s senior notes. Antero Midstream and its subsidiaries have been designated as unrestricted subsidiaries under the Credit Facility and the indentures governing Antero’s senior notes, and do not guarantee any of Antero’s obligations (see Note 5). In the event a subsidiary guarantor is sold or disposed of (whether by merger, consolidation, the sale of a sufficient amount of its capital stock so that it no longer qualifies as a “Subsidiary” of the Company (as defined in the indentures governing the notes) or the sale of all or substantially all of its assets (other than by lease)) and whether or not the subsidiary guarantor is the surviving entity in such transaction to a person which is not Antero or a restricted
22
ANTERO RESOURCES CORPORATION
Notes to Condensed Consolidated Financial Statements
December 31, 2016 and March 31, 2017
subsidiary of Antero, such subsidiary guarantor will be released from its obligations under its subsidiary guarantee if the sale or other disposition does not violate the covenants set forth in the indentures governing the notes.
In addition, a subsidiary guarantor will be released from its obligations under the indentures and its guarantee, upon the release or discharge of the guarantee of other Indebtedness (as defined in the indentures governing the notes) that resulted in the creation of such guarantee, except a release or discharge by or as a result of payment under such guarantee; if Antero designates such subsidiary as an unrestricted subsidiary and such designation complies with the other applicable provisions of the indentures governing the notes or in connection with any covenant defeasance, legal defeasance or satisfaction and discharge of the notes.
The following Condensed Consolidating Balance Sheets at December 31, 2016 and March 31, 2017, and the related Condensed Consolidating Statements of Operations and Comprehensive Income (Loss) for the three months ended March 31, 2016 and 2017 and Condensed Consolidating Statements of Cash Flows for the three months ended March 31, 2016 and 2017 present financial information for Antero on a stand-alone basis (carrying its investment in subsidiaries using the equity method), financial information for the subsidiary guarantors, financial information for the non-guarantor subsidiaries, and the consolidation and elimination entries necessary to arrive at the information for the Company on a consolidated basis. Antero’s wholly-owned subsidiaries are not restricted from making distributions to the Parent.
23
ANTERO RESOURCES CORPORATION
Notes to Condensed Consolidated Financial Statements
December 31, 2016 and March 31, 2017
Condensed Consolidating Balance Sheet
December 31, 2016
(In thousands)
|
|
|
|
|
|
|
|
|
|
|
|
|
|
|
|
|
|
|
|
|
Parent |
|
Guarantor |
|
Non-Guarantor |
|
Eliminations |
|
Consolidated |
|
|||||
|
Assets |
|
|
|
|
|
|
|
|
|
|
|
|
|
|
|
|
|
Current assets: |
|
|
|
|
|
|
|
|
|
|
|
|
|
|
|
|
|
Cash and cash equivalents |
|
$ |
17,568 |
|
|
— |
|
|
14,042 |
|
|
— |
|
|
31,610 |
|
|
Accounts receivable, net |
|
|
28,442 |
|
|
— |
|
|
1,240 |
|
|
— |
|
|
29,682 |
|
|
Intercompany receivables |
|
|
3,193 |
|
|
— |
|
|
64,139 |
|
|
(67,332) |
|
|
— |
|
|
Accrued revenue |
|
|
261,960 |
|
|
— |
|
|
— |
|
|
— |
|
|
261,960 |
|
|
Derivative instruments |
|
|
73,022 |
|
|
— |
|
|
— |
|
|
— |
|
|
73,022 |
|
|
Other current assets |
|
|
5,784 |
|
|
— |
|
|
529 |
|
|
— |
|
|
6,313 |
|
|
Total current assets |
|
|
389,969 |
|
|
— |
|
|
79,950 |
|
|
(67,332) |
|
|
402,587 |
|
|
Property and equipment: |
|
|
|
|
|
|
|
|
|
|
|
|
|
|
|
|
|
Natural gas properties, at cost (successful efforts method): |
|
|
|
|
|
|
|
|
|
|
|
|
|
|
|
|
|
Unproved properties |
|
|
2,331,173 |
|
|
— |
|
|
— |
|
|
— |
|
|
2,331,173 |
|
|
Proved properties |
|
|
9,726,957 |
|
|
— |
|
|
— |
|
|
(177,286) |
|
|
9,549,671 |
|
|
Water handling and treatment systems |
|
|
— |
|
|
— |
|
|
744,682 |
|
|
— |
|
|
744,682 |
|
|
Gathering systems and facilities |
|
|
17,929 |
|
|
— |
|
|
1,705,839 |
|
|
— |
|
|
1,723,768 |
|
|
Other property and equipment |
|
|
41,231 |
|
|
— |
|
|
— |
|
|
— |
|
|
41,231 |
|
|
|
|
|
12,117,290 |
|
|
— |
|
|
2,450,521 |
|
|
(177,286) |
|
|
14,390,525 |
|
|
Less accumulated depletion, depreciation, and amortization |
|
|
(2,109,136) |
|
|
— |
|
|
(254,642) |
|
|
— |
|
|
(2,363,778) |
|
|
Property and equipment, net |
|
|
10,008,154 |
|
|
— |
|
|
2,195,879 |
|
|
(177,286) |
|
|
12,026,747 |
|
|
Derivative instruments |
|
|
1,731,063 |
|
|
— |
|
|
— |
|
|
— |
|
|
1,731,063 |
|
|
Investments in subsidiaries |
|
|
(420,429) |
|
|
— |
|
|
— |
|
|
420,429 |
|
|
— |
|
|
Contingent acquisition consideration |
|
|
194,538 |
|
|
— |
|
|
— |
|
|
(194,538) |
|
|
— |
|
|
Investments in unconsolidated affiliates |
|
|
— |
|
|
— |
|
|
68,299 |
|
|
— |
|
|
68,299 |
|
|
Other assets, net |
|
|
21,087 |
|
|
— |
|
|
5,767 |
|
|
— |
|
|
26,854 |
|
|
Total assets |
|
$ |
11,924,382 |
|
|
— |
|
|
2,349,895 |
|
|
(18,727) |
|
|
14,255,550 |
|
|
|
|
|
|
|
|
|
|
|
|
|
|
|
|
|
|
|
|
Liabilities and Equity |
|
|
|
|
|
|
|
|
|
|
|
|
|
|
|
|
|
Current liabilities: |
|
|
|
|
|
|
|
|
|
|
|
|
|
|
|
|
|
Accounts payable |
|
$ |
21,648 |
|
|
— |
|
|
16,979 |
|
|
— |
|
|
38,627 |
|
|
Intercompany payable |
|
|
64,139 |
|
|
— |
|
|
3,193 |
|
|
(67,332) |
|
|
— |
|
|
Accrued liabilities |
|
|
332,162 |
|
|
— |
|
|
61,641 |
|
|
— |
|
|
393,803 |
|
|
Revenue distributions payable |
|
|
163,989 |
|
|
— |
|
|
— |
|
|
— |
|
|
163,989 |
|
|
Derivative instruments |
|
|
203,635 |
|
|
— |
|
|
— |
|
|
— |
|
|
203,635 |
|
|
Other current liabilities |
|
|
17,134 |
|
|
— |
|
|
200 |
|
|
— |
|
|
17,334 |
|
|
Total current liabilities |
|
|
802,707 |
|
|
— |
|
|
82,013 |
|
|
(67,332) |
|
|
817,388 |
|
|
Long-term liabilities: |
|
|
|
|
|
|
|
|
|
|
|
|
|
|
|
|
|
Long-term debt |
|
|
3,854,059 |
|
|
— |
|
|
849,914 |
|
|
— |
|
|
4,703,973 |
|
|
Deferred income tax liability |
|
|
950,217 |
|
|
— |
|
|
— |
|
|
— |
|
|
950,217 |
|
|
Contingent acquisition consideration |
|
|
— |
|
|
— |
|
|
194,538 |
|
|
(194,538) |
|
|
— |
|
|
Derivative instruments |
|
|
234 |
|
|
— |
|
|
— |
|
|
— |
|
|
234 |
|
|
Other liabilities |
|
|
54,540 |
|
|
— |
|
|
620 |
|
|
— |
|
|
55,160 |
|
|
Total liabilities |
|
|
5,661,757 |
|
|
— |
|
|
1,127,085 |
|
|
(261,870) |
|
|
6,526,972 |
|
|
Equity: |
|
|
|
|
|
|
|
|
|
|
|
|
|
|
|
|
|
Stockholders' equity: |
|
|
|
|
|
|
|
|
|
|
|
|
|
|
|
|
|
Partners' capital |
|
|
— |
|
|
— |
|
|
1,222,810 |
|
|
(1,222,810) |
|
|
— |
|
|
Common stock |
|
|
3,149 |
|
|
— |
|
|
— |
|
|
— |
|
|
3,149 |
|
|
Additional paid-in capital |
|
|
5,299,481 |
|
|
— |
|
|
— |
|
|
— |
|
|
5,299,481 |
|
|
Accumulated earnings |
|
|
959,995 |
|
|
— |
|
|
— |
|
|
— |
|
|
959,995 |
|
|
Total stockholders' equity |
|
|
6,262,625 |
|
|
— |
|
|
1,222,810 |
|
|
(1,222,810) |
|
|
6,262,625 |
|
|
Noncontrolling interest in consolidated subsidiary |
|
|
— |
|
|
— |
|
|
— |
|
|
1,465,953 |
|
|
1,465,953 |
|
|
Total equity |
|
|
6,262,625 |
|
|
— |
|
|
1,222,810 |
|
|
243,143 |
|
|
7,728,578 |
|
|
Total liabilities and equity |
|
$ |
11,924,382 |
|
|
— |
|
|
2,349,895 |
|
|
(18,727) |
|
|
14,255,550 |
|
24
ANTERO RESOURCES CORPORATION
Notes to Condensed Consolidated Financial Statements
December 31, 2016 and March 31, 2017
Condensed Consolidating Balance Sheet
March 31, 2017
(In thousands)
|
|
|
|
|
|
|
|
|
|
|
|
|
|
|
|
|
|
|
|
|
Parent |
|
Guarantor |
|
Non-Guarantor |
|
Eliminations |
|
Consolidated |
|
|||||
|
Assets |
|
|
|
|
|
|
|
|
|
|
|
|
|
|
|
|
|
Current assets: |
|
|
|
|
|
|
|
|
|
|
|
|
|
|
|
|
|
Cash and cash equivalents |
|
$ |
— |
|
|
— |
|
|
— |
|
|
— |
|
|
— |
|
|
Accounts receivable, net |
|
|
35,674 |
|
|
— |
|
|
1,200 |
|
|
— |
|
|
36,874 |
|
|
Intercompany receivables |
|
|
2,428 |
|
|
— |
|
|
71,500 |
|
|
(73,928) |
|
|
— |
|
|
Accrued revenue |
|
|
220,059 |
|
|
— |
|
|
— |
|
|
— |
|
|
220,059 |
|
|
Derivative instruments |
|
|
237,086 |
|
|
— |
|
|
— |
|
|
— |
|
|
237,086 |
|
|
Other current assets |
|
|
9,181 |
|
|
— |
|
|
498 |
|
|
— |
|
|
9,679 |
|
|
Total current assets |
|
|
504,428 |
|
|
— |
|
|
73,198 |
|
|
(73,928) |
|
|
503,698 |
|
|
Property and equipment: |
|
|
|
|
|
|
|
|
|
|
|
|
|
|
|
|
|
Natural gas properties, at cost (successful efforts method): |
|
|
|
|
|
|
|
|
|
|
|
|
|
|
|
|
|
Unproved properties |
|
|
2,330,010 |
|
|
— |
|
|
— |
|
|
— |
|
|
2,330,010 |
|
|
Proved properties |
|
|
10,163,965 |
|
|
— |
|
|
— |
|
|
(221,515) |
|
|
9,942,450 |
|
|
Water handling and treatment systems |
|
|
— |
|
|
— |
|
|
771,239 |
|
|
— |
|
|
771,239 |
|
|
Gathering systems and facilities |
|
|
17,928 |
|
|
— |
|
|
1,767,741 |
|
|
— |
|
|
1,785,669 |
|
|
Other property and equipment |
|
|
42,290 |
|
|
— |
|
|
— |
|
|
— |
|
|
42,290 |
|
|
|
|
|
12,554,193 |
|
|
— |
|
|
2,538,980 |
|
|
(221,515) |
|
|
14,871,658 |
|
|
Less accumulated depletion, depreciation, and amortization |
|
|
(2,284,181) |
|
|
— |
|
|
(282,178) |
|
|
— |
|
|
(2,566,359) |
|
|
Property and equipment, net |
|
|
10,270,012 |
|
|
— |
|
|
2,256,802 |
|
|
(221,515) |
|
|
12,305,299 |
|
|
Derivative instruments |
|
|
1,811,435 |
|
|
— |
|
|
— |
|
|
— |
|
|
1,811,435 |
|
|
Investments in subsidiaries |
|
|
632,905 |
|
|
— |
|
|
— |
|
|
(632,905) |
|
|
— |
|
|
Contingent acquisition consideration |
|
|
198,064 |
|
|
— |
|
|
— |
|
|
(198,064) |
|
|
— |
|
|
Investments in unconsolidated affiliates |
|
|
— |
|
|
— |
|
|
230,418 |
|
|
— |
|
|
230,418 |
|
|
Other assets, net |
|
|
26,530 |
|
|
— |
|
|
11,274 |
|
|
— |
|
|
37,804 |
|
|
Total assets |
|
$ |
13,443,374 |
|
|
— |
|
|
2,571,692 |
|
|
(1,126,412) |
|
|
14,888,654 |
|
|
|
|
|
|
|
|
|
|
|
|
|
|
|
|
|
|
|
|
Liabilities and Equity |
|
|
|
|
|
|
|
|
|
|
|
|
|
|
|
|
|
Current liabilities: |
|
|
|
|
|
|
|
|
|
|
|
|
|
|
|
|
|
Accounts payable |
|
$ |
24,194 |
|
|
— |
|
|
13,512 |
|
|
— |
|
|
37,706 |
|
|
Intercompany payable |
|
|
71,500 |
|
|
— |
|
|
2,428 |
|
|
(73,928) |
|
|
— |
|
|
Accrued liabilities |
|
|
369,505 |
|
|
— |
|
|
47,083 |
|
|
— |
|
|
416,588 |
|
|
Revenue distributions payable |
|
|
198,775 |
|
|
— |
|
|
— |
|
|
— |
|
|
198,775 |
|
|
Derivative instruments |
|
|
54,277 |
|
|
— |
|
|
— |
|
|
— |
|
|
54,277 |
|
|
Other current liabilities |
|
|
15,904 |
|
|
— |
|
|
186 |
|
|
— |
|
|
16,090 |
|
|
Total current liabilities |
|
|
734,155 |
|
|
— |
|
|
63,209 |
|
|
(73,928) |
|
|
723,436 |
|
|
Long-term liabilities: |
|
|
|
|
|
|
|
|
|
|
|
|
|
|
|
|
|
Long-term debt |
|
|
3,935,123 |
|
|
— |
|
|
840,179 |
|
|
— |
|
|
4,775,302 |
|
|
Deferred income tax liability |
|
|
1,081,563 |
|
|
— |
|
|
— |
|
|
— |
|
|
1,081,563 |
|
|
Contingent acquisition consideration |
|
|
— |
|
|
— |
|
|
198,064 |
|
|
(198,064) |
|
|
— |
|
|
Derivative instruments |
|
|
102 |
|
|
— |
|
|
— |
|
|
— |
|
|
102 |
|
|
Other liabilities |
|
|
53,732 |
|
|
— |
|
|
567 |
|
|
— |
|
|
54,299 |
|
|
Total liabilities |
|
|
5,804,675 |
|
|
— |
|
|
1,102,019 |
|
|
(271,992) |
|
|
6,634,702 |
|
|
Equity: |
|
|
|
|
|
|
|
|
|
|
|
|
|
|
|
|
|
Stockholders' equity: |
|
|
|
|
|
|
|
|
|
|
|
|
|
|
|
|
|
Partners' capital |
|
|
— |
|
|
— |
|
|
1,469,673 |
|
|
(1,469,673) |
|
|
— |
|
|
Common stock |
|
|
3,150 |
|
|
— |
|
|
— |
|
|
— |
|
|
3,150 |
|
|
Additional paid-in capital |
|
|
6,407,158 |
|
|
— |
|
|
— |
|
|
— |
|
|
6,407,158 |
|
|
Accumulated earnings |
|
|
1,228,391 |
|
|
— |
|
|
— |
|
|
— |
|
|
1,228,391 |
|
|
Total stockholders' equity |
|
|
7,638,699 |
|
|
— |
|
|
1,469,673 |
|
|
(1,469,673) |
|
|
7,638,699 |
|
|
Noncontrolling interest in consolidated subsidiary |
|
|
— |
|
|
— |
|
|
— |
|
|
615,253 |
|
|
615,253 |
|
|
Total equity |
|
|
7,638,699 |
|
|
— |
|
|
1,469,673 |
|
|
(854,420) |
|
|
8,253,952 |
|
|
Total liabilities and equity |
|
$ |
13,443,374 |
|
|
— |
|
|
2,571,692 |
|
|
(1,126,412) |
|
|
14,888,654 |
|
25
ANTERO RESOURCES CORPORATION
Notes to Condensed Consolidated Financial Statements
December 31, 2016 and March 31, 2017
Condensed Consolidating Statement of Operations and Comprehensive Income (Loss)
Three Months Ended March 31, 2016
(In thousands)
|
|
|
|
|
|
|
|
|
|
|
|
|
|
|
|
|
|
|
|
|
Parent |
|
Guarantor |
|
Non-Guarantor |
|
Eliminations |
|
Consolidated |
|
|||||
|
Revenue and other: |
|
|
|
|
|
|
|
|
|
|
|
|
|
|
|
|
|
Natural gas sales |
|
$ |
254,776 |
|
|
— |
|
|
— |
|
|
— |
|
|
254,776 |
|
|
Natural gas liquids sales |
|
|
73,065 |
|
|
— |
|
|
— |
|
|
— |
|
|
73,065 |
|
|
Oil sales |
|
|
10,179 |
|
|
— |
|
|
— |
|
|
— |
|
|
10,179 |
|
|
Gathering, compression, and water handling and treatment |
|
|
— |
|
|
— |
|
|
136,073 |
|
|
(132,229) |
|
|
3,844 |
|
|
Marketing |
|
|
99,216 |
|
|
— |
|
|
— |
|
|
— |
|
|
99,216 |
|
|
Commodity derivative fair value gains |
|
|
279,924 |
|
|
— |
|
|
— |
|
|
— |
|
|
279,924 |
|
|
Other income |
|
|
3,825 |
|
|
— |
|
|
— |
|
|
(3,825) |
|
|
— |
|
|
Total revenue and other |
|
|
720,985 |
|
|
— |
|
|
136,073 |
|
|
(136,054) |
|
|
721,004 |
|
|
Operating expenses: |
|
|
|
|
|
|
|
|
|
|
|
|
|
|
|
|
|
Lease operating |
|
|
11,332 |
|
|
— |
|
|
40,714 |
|
|
(40,753) |
|
|
11,293 |
|
|
Gathering, compression, processing, and transportation |
|
|
267,445 |
|
|
— |
|
|
7,170 |
|
|
(65,877) |
|
|
208,738 |
|
|
Production and ad valorem taxes |
|
|
18,027 |
|
|
— |
|
|
1,257 |
|
|
— |
|
|
19,284 |
|
|
Marketing |
|
|
137,933 |
|
|
— |
|
|
— |
|
|
— |
|
|
137,933 |
|
|
Exploration |
|
|
1,014 |
|
|
— |
|
|
— |
|
|
— |
|
|
1,014 |
|
|
Impairment of unproved properties |
|
|
15,526 |
|
|
— |
|
|
— |
|
|
— |
|
|
15,526 |
|
|
Depletion, depreciation, and amortization |
|
|
167,759 |
|
|
— |
|
|
23,823 |
|
|
— |
|
|
191,582 |
|
|
Accretion of asset retirement obligations |
|
|
598 |
|
|
— |
|
|
— |
|
|
— |
|
|
598 |
|
|
General and administrative |
|
|
43,552 |
|
|
— |
|
|
13,091 |
|
|
(356) |
|
|
56,287 |
|
|
Accretion of contingent acquisition consideration |
|
|
— |
|
|
— |
|
|
3,396 |
|
|
(3,396) |
|
|
— |
|
|
Total operating expenses |
|
|
663,186 |
|
|
— |
|
|
89,451 |
|
|
(110,382) |
|
|
642,255 |
|
|
Operating income |
|
|
57,799 |
|
|
— |
|
|
46,622 |
|
|
(25,672) |
|
|
78,749 |
|
|
Other income (expenses): |
|
|
|
|
|
|
|
|
|
|
|
|
|
|
|
|
|
Interest |
|
|
(59,823) |
|
|
— |
|
|
(3,704) |
|
|
243 |
|
|
(63,284) |
|
|
Equity in net income of subsidiaries |
|
|
1,784 |
|
|
— |
|
|
— |
|
|
(1,784) |
|
|
— |
|
|
Total other expenses |
|
|
(58,039) |
|
|
— |
|
|
(3,704) |
|
|
(1,541) |
|
|
(63,284) |
|
|
Income (loss) before income taxes |
|
|
(240) |
|
|
— |
|
|
42,918 |
|
|
(27,213) |
|
|
15,465 |
|
|
Provision for income tax expense |
|
|
(4,815) |
|
|
— |
|
|
— |
|
|
— |
|
|
(4,815) |
|
|
Net income (loss) and comprehensive income (loss) including noncontrolling interest |
|
|
(5,055) |
|
|
— |
|
|
42,918 |
|
|
(27,213) |
|
|
10,650 |
|
|
Net income and comprehensive income attributable to noncontrolling interest |
|
|
— |
|
|
— |
|
|
— |
|
|
15,705 |
|
|
15,705 |
|
|
Net income (loss) and comprehensive income (loss) attributable to Antero Resources Corporation |
|
$ |
(5,055) |
|
|
— |
|
|
42,918 |
|
|
(42,918) |
|
|
(5,055) |
|
26
ANTERO RESOURCES CORPORATION
Notes to Condensed Consolidated Financial Statements
December 31, 2016 and March 31, 2017
Condensed Consolidating Statement of Operations and Comprehensive Income
Three Months Ended March 31, 2017
(In thousands)
|
|
|
|
|
|
|
|
|
|
|
|
|
|
|
|
|
|
|
|
|
Parent |
|
Guarantor |
|
Non-Guarantor |
|
Eliminations |
|
Consolidated |
|
|||||
|
Revenue and other: |
|
|
|
|
|
|
|
|
|
|
|
|
|
|
|
|
|
Natural gas sales |
|
$ |
466,664 |
|
|
— |
|
|
— |
|
|
— |
|
|
466,664 |
|
|
Natural gas liquids sales |
|
|
194,652 |
|
|
— |
|
|
— |
|
|
— |
|
|
194,652 |
|
|
Oil sales |
|
|
26,960 |
|
|
— |
|
|
— |
|
|
— |
|
|
26,960 |
|
|
Gathering, compression, and water handling and treatment |
|
|
— |
|
|
— |
|
|
174,769 |
|
|
(172,165) |
|
|
2,604 |
|
|
Marketing |
|
|
65,924 |
|
|
— |
|
|
— |
|
|
— |
|
|
65,924 |
|
|
Commodity derivative fair value losses |
|
|
438,775 |
|
|
— |
|
|
— |
|
|
— |
|
|
438,775 |
|
|
Other income |
|
|
4,440 |
|
|
— |
|
|
— |
|
|
(4,440) |
|
|
— |
|
|
Total revenue and other |
|
|
1,197,415 |
|
|
— |
|
|
174,769 |
|
|
(176,605) |
|
|
1,195,579 |
|
|
Operating expenses: |
|
|
|
|
|
|
|
|
|
|
|
|
|
|
|
|
|
Lease operating |
|
|
15,742 |
|
|
— |
|
|
38,622 |
|
|
(38,813) |
|
|
15,551 |
|
|
Gathering, compression, processing, and transportation |
|
|
347,768 |
|
|
— |
|
|
8,114 |
|
|
(89,053) |
|
|
266,829 |
|
|
Production and ad valorem taxes |
|
|
23,975 |
|
|
— |
|
|
818 |
|
|
— |
|
|
24,793 |
|
|
Marketing |
|
|
89,993 |
|
|
— |
|
|
— |
|
|
— |
|
|
89,993 |
|
|
Exploration |
|
|
2,107 |
|
|
— |
|
|
— |
|
|
— |
|
|
2,107 |
|
|
Impairment of unproved properties |
|
|
26,899 |
|
|
— |
|
|
— |
|
|
— |
|
|
26,899 |
|
|
Depletion, depreciation, and amortization |
|
|
175,193 |
|
|
— |
|
|
27,536 |
|
|
— |
|
|
202,729 |
|
|
Accretion of asset retirement obligations |
|
|
637 |
|
|
— |
|
|
— |
|
|
— |
|
|
637 |
|
|
General and administrative |
|
|
51,056 |
|
|
— |
|
|
14,457 |
|
|
(815) |
|
|
64,698 |
|
|
Accretion of contingent acquisition consideration |
|
|
— |
|
|
— |
|
|
3,526 |
|
|
(3,526) |
|
|
— |
|
|
Total operating expenses |
|
|
733,370 |
|
|
— |
|
|
93,073 |
|
|
(132,207) |
|
|
694,236 |
|
|
Operating income |
|
|
464,045 |
|
|
— |
|
|
81,696 |
|
|
(44,398) |
|
|
501,343 |
|
|
Other income (expenses): |
|
|
|
|
|
|
|
|
|
|
|
|
|
|
|
|
|
Equity in earnings of unconsolidated affiliates |
|
|
— |
|
|
— |
|
|
2,231 |
|
|
— |
|
|
2,231 |
|
|
Interest |
|
|
(58,003) |
|
|
— |
|
|
(8,836) |
|
|
169 |
|
|
(66,670) |
|
|
Equity in net income of subsidiaries |
|
|
(6,300) |
|
|
— |
|
|
— |
|
|
6,300 |
|
|
— |
|
|
Total other expenses |
|
|
(64,303) |
|
|
— |
|
|
(6,605) |
|
|
6,469 |
|
|
(64,439) |
|
|
Income before income taxes |
|
|
399,742 |
|
|
— |
|
|
75,091 |
|
|
(37,929) |
|
|
436,904 |
|
|
Provision for income tax expense |
|
|
(131,346) |
|
|
— |
|
|
— |
|
|
— |
|
|
(131,346) |
|
|
Net income and comprehensive income including noncontrolling interest |
|
|
268,396 |
|
|
— |
|
|
75,091 |
|
|
(37,929) |
|
|
305,558 |
|
|
Net income and comprehensive income attributable to noncontrolling interest |
|
|
— |
|
|
— |
|
|
— |
|
|
37,162 |
|
|
37,162 |
|
|
Net income and comprehensive income attributable to Antero Resources Corporation |
|
$ |
268,396 |
|
|
— |
|
|
75,091 |
|
|
(75,091) |
|
|
268,396 |
|
27
ANTERO RESOURCES CORPORATION
Notes to Condensed Consolidated Financial Statements
December 31, 2016 and March 31, 2017
Condensed Consolidating Statement of Cash Flows
Three Months Ended March 31, 2016
(In thousands)
|
|
|
|
|
|
|
|
|
|
|
|
|
|
|
|
|
|
|
|
|
Parent |
|
Guarantor |
|
Non-Guarantor |
|
Eliminations |
|
Consolidated |
|
|||||
|
Net cash provided by operating activities |
|
$ |
283,249 |
|
|
— |
|
|
82,348 |
|
|
(25,429) |
|
|
340,168 |
|
|
Cash flows used in investing activities: |
|
|
|
|
|
|
|
|
|
|
|
|
|
|
|
|
|
Additions to unproved properties |
|
|
(28,675) |
|
|
— |
|
|
— |
|
|
— |
|
|
(28,675) |
|
|
Drilling and completion costs |
|
|
(420,614) |
|
|
— |
|
|
— |
|
|
25,429 |
|
|
(395,185) |
|
|
Additions to water handling and treatment systems |
|
|
— |
|
|
— |
|
|
(37,036) |
|
|
— |
|
|
(37,036) |
|
|
Additions to gathering systems and facilities |
|
|
— |
|
|
— |
|
|
(48,686) |
|
|
— |
|
|
(48,686) |
|
|
Additions to other property and equipment |
|
|
(541) |
|
|
— |
|
|
— |
|
|
— |
|
|
(541) |
|
|
Change in other assets |
|
|
98 |
|
|
— |
|
|
(9,270) |
|
|
— |
|
|
(9,172) |
|
|
Distributions from non-guarantor subsidiary |
|
|
25,712 |
|
|
— |
|
|
— |
|
|
(25,712) |
|
|
— |
|
|
Net cash used in investing activities |
|
|
(424,020) |
|
|
— |
|
|
(94,992) |
|
|
(283) |
|
|
(519,295) |
|
|
Cash flows provided by financing activities: |
|
|
|
|
|
|
|
|
|
|
|
|
|
|
|
|
|
Sale of common units in Antero Midstream Partners LP by Antero Resources Corporation |
|
|
178,000 |
|
|
— |
|
|
— |
|
|
— |
|
|
178,000 |
|
|
Borrowings (repayments) on bank credit facility, net |
|
|
(27,000) |
|
|
— |
|
|
60,000 |
|
|
— |
|
|
33,000 |
|
|
Payments of deferred financing costs |
|
|
(64) |
|
|
— |
|
|
— |
|
|
— |
|
|
(64) |
|
|
Distributions |
|
|
— |
|
|
— |
|
|
(39,725) |
|
|
25,712 |
|
|
(14,013) |
|
|
Employee tax withholding for settlement of equity compensation awards |
|
|
(117) |
|
|
— |
|
|
— |
|
|
— |
|
|
(117) |
|
|
Other |
|
|
(1,246) |
|
|
— |
|
|
(36) |
|
|
— |
|
|
(1,282) |
|
|
Net cash provided by financing activities |
|
|
149,573 |
|
|
— |
|
|
20,239 |
|
|
25,712 |
|
|
195,524 |
|
|
Net increase in cash and cash equivalents |
|
|
8,802 |
|
|
— |
|
|
7,595 |
|
|
— |
|
|
16,397 |
|
|
Cash and cash equivalents, beginning of period |
|
|
16,590 |
|
|
— |
|
|
6,883 |
|
|
— |
|
|
23,473 |
|
|
Cash and cash equivalents, end of period |
|
$ |
25,392 |
|
|
— |
|
|
14,478 |
|
|
— |
|
|
39,870 |
|
28
ANTERO RESOURCES CORPORATION
Notes to Condensed Consolidated Financial Statements
December 31, 2016 and March 31, 2017
Condensed Consolidating Statement of Cash Flows
Three Months Ended March 31, 2017
(In thousands)
|
|
|
|
|
|
|
|
|
|
|
|
|
|
|
|
|
|
|
|
|
Parent |
|
Guarantor |
|
Non-Guarantor |
|
Eliminations |
|
Consolidated |
|
|||||
|
Net cash provided by operating activities |
|
$ |
338,420 |
|
|
— |
|
|
99,748 |
|
|
(44,229) |
|
|
393,939 |
|
|
Cash flows used in investing activities: |
|
|
|
|
|
|
|
|
|
|
|
|
|
|
|
|
|
Additions to proved properties |
|
|
(49,664) |
|
|
— |
|
|
— |
|
|
— |
|
|
(49,664) |
|
|
Additions to unproved properties |
|
|
(55,542) |
|
|
— |
|
|
— |
|
|
— |
|
|
(55,542) |
|
|
Drilling and completion costs |
|
|
(351,154) |
|
|
— |
|
|
— |
|
|
44,229 |
|
|
(306,925) |
|
|
Additions to water handling and treatment systems |
|
|
— |
|
|
— |
|
|
(36,954) |
|
|
— |
|
|
(36,954) |
|
|
Additions to gathering systems and facilities |
|
|
— |
|
|
— |
|
|
(66,559) |
|
|
— |
|
|
(66,559) |
|
|
Additions to other property and equipment |
|
|
(590) |
|
|
— |
|
|
— |
|
|
— |
|
|
(590) |
|
|
Investments in unconsolidated affiliates |
|
|
— |
|
|
— |
|
|
(159,889) |
|
|
— |
|
|
(159,889) |
|
|
Change in other assets |
|
|
(6,476) |
|
|
— |
|
|
(5,874) |
|
|
— |
|
|
(12,350) |
|
|
Net distributions from subsidiaries |
|
|
30,484 |
|
|
— |
|
|
— |
|
|
(30,484) |
|
|
— |
|
|
Net cash used in investing activities |
|
|
(432,942) |
|
|
— |
|
|
(269,276) |
|
|
13,745 |
|
|
(688,473) |
|
|
Cash flows provided by financing activities: |
|
|
|
|
|
|
|
|
|
|
|
|
|
|
|
|
|
Issuance of common units by Antero Midstream Partners LP |
|
|
— |
|
|
— |
|
|
223,119 |
|
|
— |
|
|
223,119 |
|
|
Borrowings (repayments) on bank credit facility, net |
|
|
80,000 |
|
|
— |
|
|
(10,000) |
|
|
— |
|
|
70,000 |
|
|
Distributions |
|
|
— |
|
|
— |
|
|
(57,633) |
|
|
30,484 |
|
|
(27,149) |
|
|
Employee tax withholding for settlement of equity compensation awards |
|
|
(1,657) |
|
|
— |
|
|
— |
|
|
— |
|
|
(1,657) |
|
|
Other |
|
|
(1,389) |
|
|
— |
|
|
— |
|
|
— |
|
|
(1,389) |
|
|
Net cash provided by financing activities |
|
|
76,954 |
|
|
— |
|
|
155,486 |
|
|
30,484 |
|
|
262,924 |
|
|
Net decrease in cash and cash equivalents |
|
|
(17,568) |
|
|
— |
|
|
(14,042) |
|
|
— |
|
|
(31,610) |
|
|
Cash and cash equivalents, beginning of period |
|
|
17,568 |
|
|
— |
|
|
14,042 |
|
|
— |
|
|
31,610 |
|
|
Cash and cash equivalents, end of period |
|
$ |
— |
|
|
— |
|
|
— |
|
|
— |
|
|
— |
|
(13)Commitments
The table below is a schedule of future minimum payments for firm transportation, drilling rig and completion services, processing, gathering and compression, and office and equipment agreements, as well as leases that have remaining lease terms in excess of one year as of March 31, 2017 (in millions).
|
|
|
|
|
|
|
|
|
|
|
|
|
|
|
|
|
|
|
|
|
Firm |
|
Processing, |
|
Drilling rigs and completion |
|
Office and equipment |
|
|
|
|||||
|
|
|
(a) |
|
(b) |
|
(c) |
|
(d) |
|
Total |
|
|||||
|
Remainder of 2017 |
|
$ |
510 |
|
|
304 |
|
|
95 |
|
|
10 |
|
|
919 |
|
|
2018 |
|
|
937 |
|
|
398 |
|
|
75 |
|
|
13 |
|
|
1,423 |
|
|
2019 |
|
|
1,088 |
|
|
322 |
|
|
40 |
|
|
10 |
|
|
1,460 |
|
|
2020 |
|
|
1,107 |
|
|
319 |
|
|
— |
|
|
9 |
|
|
1,435 |
|
|
2021 |
|
|
1,086 |
|
|
303 |
|
|
— |
|
|
8 |
|
|
1,397 |
|
|
2022 |
|
|
1,033 |
|
|
299 |
|
|
— |
|
|
8 |
|
|
1,340 |
|
|
Thereafter |
|
|
9,362 |
|
|
1,273 |
|
|
— |
|
|
17 |
|
|
10,652 |
|
|
Total |
|
$ |
15,123 |
|
|
3,218 |
|
|
210 |
|
|
75 |
|
|
18,626 |
|
(a) Firm Transportation
The Company has entered into firm transportation agreements with various pipelines in order to facilitate the delivery of its production to market. These contracts commit the Company to transport minimum daily natural gas or NGLs volumes at negotiated rates, or pay for any deficiencies at specified reservation fee rates. The amounts in this table are based on the Company’s minimum daily volumes at the reservation fee rate. The values in the table represent the gross amounts that the Company is committed to pay;
29
ANTERO RESOURCES CORPORATION
Notes to Condensed Consolidated Financial Statements
December 31, 2016 and March 31, 2017
however, the Company will record in the consolidated financial statements its proportionate share of costs based on its working interest.
(b) Processing, Gathering, and Compression Service Commitments
The Company has entered into various long‑term gas processing agreements for certain of its production that will allow it to realize the value of its NGLs. The minimum payment obligations under the agreements are presented in the table.
The Company has various gathering and compression service agreements with third parties that provide for payments based on volumes gathered or compressed. The minimum payment obligations under these agreements are presented in the table.
The values in the table represent the gross amounts that the Company is committed to pay; however, the Company will record in the consolidated financial statements its proportionate share of costs based on its working interest. The values in the table also include fees to be paid to the Joint Venture owned by Antero Midstream and MarkWest, and Antero Midstream’s commitments for the construction of its advanced wastewater treatment complex. The table does not include intracompany commitments.
(c) Drilling Rig Service Commitments
The Company has obligations under agreements with service providers to procure drilling rigs and completion services. The values in the table represent the gross amounts that the Company is committed to pay; however, the Company will record in the consolidated financial statements its proportionate share of costs based on its working interest.
(d) Office and Equipment Leases
The Company leases various office space and equipment under capital and operating lease arrangements.
30
Item 2. Management’s Discussion and Analysis of Financial Condition and Results of Operations.
The following discussion and analysis of our financial condition and results of operations should be read in conjunction with our condensed consolidated financial statements and related notes included elsewhere in this report. The following discussion contains “forward-looking statements” that reflect our future plans, estimates, beliefs and expected performance. We caution that assumptions, expectations, projections, intentions, or beliefs about future events may, and often do, vary from actual results, and the differences can be material. Some of the key factors that could cause actual results to vary from our expectations include changes in natural gas, NGLs, and oil prices, the timing of planned capital expenditures, our ability to fund our development programs, availability of acquisitions, uncertainties in estimating proved reserves and forecasting production results, operational factors affecting the commencement or maintenance of producing wells, the condition of the capital markets generally, as well as our ability to access them, and uncertainties regarding environmental regulations or litigation and other legal or regulatory developments affecting our business, as well as those factors discussed below, all of which are difficult to predict. In light of these risks, uncertainties and assumptions, the forward-looking events discussed may not occur. See “Cautionary Statement Regarding Forward-Looking Statements.” Also, see the risk factors and other cautionary statements described under the heading “Item 1A. Risk Factors.” We do not undertake any obligation to publicly update any forward-looking statements except as otherwise required by applicable law. For more information, please refer to the Annual Report on Form 10-K for the year ended December 31, 2016, filed with the SEC on February 28, 2017.
In this section, references to “Antero Resources,” “the Company,” “we,” “us,” and “our” refer to Antero Resources Corporation and its subsidiaries, unless otherwise indicated or the context otherwise requires.
Our Company
Antero Resources Corporation is an independent oil and natural gas company engaged in the exploration, development, and acquisition of natural gas, NGLs, and oil properties located in the Appalachian Basin. We focus on unconventional reservoirs, which can generally be characterized as fractured shale formations. Our management team has worked together for many years and has a successful track record of reserve and production growth as well as significant expertise in unconventional resource plays. Our strategy is to leverage our team’s experience delineating and developing natural gas resource plays to profitably grow our reserves and production, primarily on our existing multi-year inventory of drilling locations.
We have assembled a portfolio of long-lived properties that are characterized by what we believe to be low geologic risk and repeatability. Our drilling opportunities are focused in the Marcellus Shale and Utica Shale of the Appalachian Basin. As of March 31, 2017, we held approximately 621,000 net acres of rich gas and dry gas properties located in the Appalachian Basin in West Virginia, Ohio, and Pennsylvania. Our corporate headquarters are in Denver, Colorado.
We operate in the following industry segments: (i) the exploration, development, and production of natural gas, NGLs, and oil; (ii) gathering and processing; (iii) water handling and treatment; and (iv) marketing of excess firm transportation capacity. All of our operations are conducted in the United States.
Address, Internet Website and Availability of Public Filings
Our principal executive offices are located at 1615 Wynkoop Street, Denver, Colorado 80202, and our telephone number is (303) 357-7310. Our website is located at www.anteroresources.com.
We furnish or file with the SEC our Annual Reports on Form 10-K, our Quarterly Reports on Form 10-Q, and our Current Reports on Form 8-K. We make these documents available free of charge at www.anteroresources.com under the “Investors Relations” link as soon as reasonably practicable after they are filed or furnished with the SEC.
Information on our website is not incorporated into this Quarterly Report on Form 10-Q or our other filings with the SEC and is not a part of them.
2017 Developments and Highlights
Energy Industry Environment
In late 2014, global energy commodity prices declined precipitously as a result of several factors, including an increase in worldwide commodity supplies, a stronger U.S. dollar, relatively mild weather in large portions of the U.S., and strong competition
31
among oil producing countries for market share. Depressed commodity prices continued into 2015 and 2016, although a modest recovery has occurred in late 2016 and early 2017. The following chart depicts quarterly percentage changes in natural gas (Henry Hub), propane (Mont Belvieu), and oil (West Texas Intermediate) spot prices since June 30, 2014.
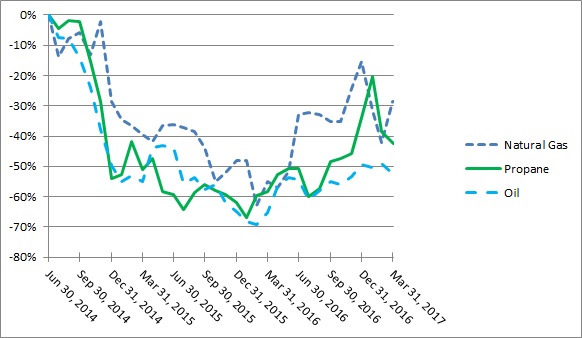
In response to these market conditions and concerns about access to capital markets, many U.S. exploration and production companies significantly reduced their capital spending plans in recent years. Our capital budget for drilling, completions, and land in 2017 is $1.5 billion. Excluding acquisitions, this is consistent with our 2016 capital expenditures. Our 2017 budget includes plans to operate an average of seven drilling rigs in 2017, which is consistent with 2016; completion of 170 horizontal wells in the Marcellus and Utica Shales in 2017 as compared to 140 in 2016; and deferring the completion of 30 wells until 2018. Although commodity prices have decreased in recent years, we have also experienced reductions in drilling and development costs as a result of decreased demand for oilfield services and increased efficiencies from improved drilling and completion technology and procedures.
We believe that our 2017 capital budget will be fully funded through operating cash flows, available borrowing capacity under our revolving credit facility, and potential capital market transactions. We continually monitor commodity prices and may revise the capital budget if conditions warrant. Additionally, given the current commodity price environment, we have evaluated the carrying value of our proved properties. See “—Critical Accounting Policies and Estimates” for a discussion of such evaluation.
Production and Financial Results
For the three months ended March 31, 2017, we generated consolidated cash flows from operations of $394 million, consolidated net income of $268 million, and Adjusted EBITDAX of $365 million. This compares to consolidated cash flows from operations of $340 million, consolidated net loss of $5 million, and Adjusted EBITDAX of $355 million for the three months ended March 31, 2016. Consolidated net income of $268 million for the three months ended March 31, 2017 included (i) commodity derivative fair value gains of $439 million, comprised of gains on settled derivatives of $45 million and a non-cash gain of $394 million on changes in the fair value of unsettled commodity derivatives, (ii) a non-cash charge of $26 million for equity-based compensation, (iii) a non-cash charge of $27 million for impairments of unproved properties, and (iv) non-cash deferred tax expense of $131 million. See “—Non-GAAP Financial Measures” for a definition of Adjusted EBITDAX (a non-GAAP measure) and a reconciliation of Adjusted EBITDAX to net income.
For the three months ended March 31, 2017, our net production totaled 193 Bcfe, or 2,144 MMcfe per day, a 22% increase compared to 160 Bcfe, or 1,758 MMcfe per day, for the three months ended March 31, 2016. Our average price received for production, before the effects of gains on settled derivatives, for the three months ended March 31, 2017 was $3.57 per Mcfe compared to $2.11 per Mcfe for the three months ended March 31, 2016. Our average realized price after the effects of gains on settled derivatives was $3.80 per Mcfe for the three months ended March 31, 2017 compared to $4.14 per Mcfe for the three months ended March 31, 2016.
32
2017 Capital Budget and Capital Spending
Our consolidated capital budget for 2017 is $2.3 billion and includes: $1.3 billion for drilling and completion, $200 million for core leasehold acreage additions and extensions, and $800 million for capital expenditures by Antero Midstream, which includes investments in unconsolidated gathering and processing affiliates. We do not budget for acquisitions. Approximately 70% of the drilling and completion budget is allocated to the Marcellus Shale, and the remaining 30% is allocated to the Ohio Utica Shale. Over the course of 2017, we plan to operate an average of four drilling rigs in the Marcellus Shale and three drilling rigs in the Ohio Utica Shale, and we plan to complete a total of 170 wells. We periodically review our capital expenditures and adjust our budget and its allocation based on liquidity, drilling results, leasehold acquisition opportunities, and commodity prices.
For the three months ended March 31, 2017, our consolidated capital expenditures were approximately $516 million, including drilling and completion costs of $307 million, leasehold additions of $55 million, acquisitions of $50 million, gathering and compression expenditures of $66 million, water handling and treatment expenditures of $37 million, and other capital expenditures of $1 million. Antero Midstream also invested $160 million in a joint venture with MarkWest Energy Partners L.P. See “—Formation of Joint Venture and Issuance of Common Units by Antero Midstream.”
Hedge Position
As of March 31, 2017, we had entered into hedging contracts for approximately 3.2 Tcf of our projected natural gas production at a weighted average index price of $3.63 per MMbtu for April 1 2017 through December 31, 2023, 348 million gallons of propane at a weighted average price of $0.41 per gallon for April 1, 2017 through December 31, 2018, 231 million gallons of ethane at a weighted average price of $0.25 per gallon for April 1, 2017 through December 31, 2017, and 825 MBbls of oil at a weighted average price of $54.75 per Bbl for April 1, 2017 through December 31, 2017. These hedging contracts include contracts for the remainder of 2017 of approximately 512 Bcf of natural gas at a weighted average index price of $3.59 per Mcf, 318 million gallons of propane at a weighted average price of $0.39 per gallon, 231 million gallons of ethane at a weighted average price of $0.25 per gallon, and 825 MBbls of oil at a weighted average price of $54.75 per Bbl.
Credit Facilities
As of March 31, 2017, the borrowing base under our revolving credit facility was $4.75 billion and lender commitments were $4.0 billion. The borrowing base under our revolving credit facility is redetermined semi-annually and is based on the estimated future cash flows from our proved oil and gas reserves and our commodity hedge positions. In April 2017, the borrowing base was reaffirmed at $4.75 billion, and lender commitments remain at $4.0 billion.. The next redetermination is scheduled to occur in October 2017. At March 31, 2017, we had $520 million of borrowings and $710 million of letters of credit outstanding under the revolving credit facility. Our revolving credit facility matures in May 2019. See “—Debt Agreements and Contractual Obligations—Senior Secured Revolving Credit Facility” for a description of our revolving credit facility.
Our consolidated subsidiary, Antero Midstream, has a revolving credit facility agreement that provides for lender commitments of $1.5 billion. At March 31, 2017, Antero Midstream had $200 million of borrowings outstanding under its revolving credit facility. The facility will mature in November 2019. See “—Debt Agreements and Contractual Obligations—Midstream Credit Facility” for a description of this revolving credit facility.
Formation of Joint Venture and Issuance of Common Units by Antero Midstream
On February 6, 2017, Antero Midstream formed a joint venture (the “Joint Venture”) to develop processing assets in Appalachia with MarkWest Energy Partners, L.P. (“MarkWest”), a wholly owned subsidiary of MPLX, L.P. Antero Midstream and MarkWest each own a 50% interest in the Joint Venture and MarkWest operates the Joint Venture assets. The Joint Venture assets consist of processing plants in West Virginia and a one-third interest in a recently commissioned MarkWest fractionator in Ohio.
In conjunction with the formation of the Joint Venture, on February 10, 2017, Antero Midstream issued 6,900,000 common units, including the underwriters’ purchase option, generating net proceeds of approximately $223 million. Antero Midstream used the net proceeds to fund the initial contribution to the Joint Venture, repay outstanding borrowings under its credit facility, and for general partnership purposes.
33
Antero Midstream Equity Distribution Agreement
In 2016, Antero Midstream entered into an Equity Distribution Agreement (the “Distribution Agreement”). Pursuant to the terms of the agreement, Antero Midstream may sell, from time to time through brokers acting as its sales agents, common units representing limited partner interests having an aggregate offering price of up to $250 million. Sales of the common units are made by means of ordinary brokers’ transactions on the New York Stock Exchange, at market prices, in block transactions, or as otherwise agreed to between Antero Midstream and the sales agents. Proceeds are used for general partnership purposes, which may include repayment of indebtedness and funding working capital or capital expenditures. Antero Midstream is under no obligation to offer and sell common units under the Distribution Agreement.
The Partnership did not sell any common units under the Distribution Agreement during the three months ended March 31, 2017. As of March 31, 2017, Antero Midstream had the capacity to issue additional common units under the Distribution Agreement up to an aggregate sales price of $183.8 million.
Initial Public Offering of Antero Midstream GP LP
On April 6, 2017, in connection with its proposed initial public offering, Antero Resources Midstream Management LLC (“ARMM”) formed Antero Midstream Partners GP LLC (“AMP GP”), a Delaware limited liability company, as a wholly owned subsidiary, and, on April 11, 2017, assigned it the general partner interest in Antero Midstream. Concurrent with the assignment, AMG GP was admitted as Antero Midstream’s sole general partner and ARMM ceased to be Antero Midstream’s general partner.
On May 3, 2017, ARMM, which indirectly controls Antero Midstream’s incentive distribution rights, announced the pricing of its initial public offering of 37,250,000 common shares held by its sole member, Antero Resources Investment LLC (“Antero Investment”), at $23.50 per common share. The underwriters were granted an option to purchase up to an additional 5,587,500 common shares. ARMM anticipates closing its initial public offering on May 9, 2017. In connection with the offering, ARMM was converted into a Delaware limited partnership, and, in connection with such conversion, changed its name to Antero Midstream GP LP (“AMGP”). Neither we nor Antero Midstream will receive any proceeds from the sale of common shares in this offering.
Following AMGP’s initial public offering and Antero Investment’s anticipated liquidation, certain of our directors and executive officers will own AMGP common shares as well as profits interests in Antero IDR Holdings LLC, which owns all of Antero Midstream’s incentive distribution rights. In addition, certain of our directors and executive officers own a portion of Antero Midstream’s common units.
Results of Operations
Three Months Ended March 31, 2016 Compared to Three Months Ended March 31, 2017
The Company has four operating segments: (1) the exploration, development and production of natural gas, NGLs, and oil; (2) gathering and processing; (3) water handling and treatment; and (4) marketing of excess firm transportation capacity. Revenues from the gathering and processing and water handling and treatment operations are primarily derived from intersegment transactions for services provided to our exploration and production operations by Antero Midstream. Intersegment transactions that are eliminated include revenues from water handling and treatment services provided by Antero Midstream which are capitalized as proved property development costs by Antero. Marketing revenues are primarily derived from activities to purchase and sell third-party natural gas and NGLs and to market excess firm transportation capacity to third parties.
34
The operating results of the Company’s reportable segments were as follows for the three months ended March 31, 2016 and 2017 (in thousands):
|
|
|
|
|
|
|
|
|
|
|
|
|
|
|
|
|
|
|
Exploration |
|
Gathering and |
|
Water handling and treatment |
|
Marketing |
|
Elimination of |
|
Consolidated |
|
|
|
Three months ended March 31, 2016: |
|
|
|
|
|
|
|
|
|
|
|
|
|
|
|
Sales and revenues: |
|
|
|
|
|
|
|
|
|
|
|
|
|
|
|
Third-party |
|
$ |
617,944 |
|
3,587 |
|
257 |
|
99,216 |
|
— |
|
721,004 |
|
|
Intersegment |
|
|
3,825 |
|
66,040 |
|
66,189 |
|
— |
|
(136,054) |
|
— |
|
|
Total |
|
$ |
621,769 |
|
69,627 |
|
66,446 |
|
99,216 |
|
(136,054) |
|
721,004 |
|
|
|
|
|
|
|
|
|
|
|
|
|
|
|
|
|
|
Operating expenses: |
|
|
|
|
|
|
|
|
|
|
|
|
|
|
|
Lease operating |
|
$ |
11,332 |
|
— |
|
40,714 |
|
— |
|
(40,753) |
|
11,293 |
|
|
Gathering, compression, processing, and transportation |
|
|
267,445 |
|
7,170 |
|
— |
|
— |
|
(65,877) |
|
208,738 |
|
|
Depletion, depreciation, and amortization |
|
|
167,552 |
|
17,068 |
|
6,962 |
|
— |
|
— |
|
191,582 |
|
|
General and administrative expense (before equity-based compensation) |
|
|
26,054 |
|
4,949 |
|
2,170 |
|
— |
|
(356) |
|
32,817 |
|
|
Equity-based compensation expense |
|
|
17,498 |
|
4,386 |
|
1,586 |
|
— |
|
— |
|
23,470 |
|
|
Other operating expenses |
|
|
35,165 |
|
449 |
|
4,204 |
|
137,933 |
|
(3,396) |
|
174,355 |
|
|
Total |
|
|
525,046 |
|
34,022 |
|
55,636 |
|
137,933 |
|
(110,382) |
|
642,255 |
|
|
Operating income (loss) |
|
$ |
96,723 |
|
35,605 |
|
10,810 |
|
(38,717) |
|
(25,672) |
|
78,749 |
|
|
|
|
|
|
|
|
|
|
|
|
|
|
|
|
|
|
Equity in earnings of unconsolidated affiliates |
|
$ |
— |
|
— |
|
— |
|
— |
|
— |
|
— |
|
|
Segment Adjusted EBITDAX (1) |
|
$ |
339,977 |
|
57,059 |
|
22,754 |
|
(38,717) |
|
(25,672) |
|
355,401 |
|
|
|
|
|
|
|
|
|
|
|
|
|
|
|
|
|
|
|
|
Exploration |
|
Gathering and |
|
Water handling and treatment |
|
Marketing |
|
Elimination of |
|
Consolidated |
|
|
|
Three months ended March 31, 2017: |
|
|
|
|
|
|
|
|
|
|
|
|
|
|
|
Sales and revenues: |
|
|
|
|
|
|
|
|
|
|
|
|
|
|
|
Third-party |
|
$ |
1,127,051 |
|
2,539 |
|
65 |
|
65,924 |
|
— |
|
1,195,579 |
|
|
Intersegment |
|
|
4,440 |
|
89,120 |
|
83,045 |
|
— |
|
(176,605) |
|
— |
|
|
Total |
|
$ |
1,131,491 |
|
91,659 |
|
83,110 |
|
65,924 |
|
(176,605) |
|
1,195,579 |
|
|
|
|
|
|
|
|
|
|
|
|
|
|
|
|
|
|
Operating expenses: |
|
|
|
|
|
|
|
|
|
|
|
|
|
|
|
Lease operating |
|
$ |
15,742 |
|
— |
|
38,622 |
|
— |
|
(38,813) |
|
15,551 |
|
|
Gathering, compression, processing, and transportation |
|
|
347,768 |
|
8,114 |
|
— |
|
— |
|
(89,053) |
|
266,829 |
|
|
Depletion, depreciation, and amortization |
|
|
174,969 |
|
19,924 |
|
7,836 |
|
— |
|
— |
|
202,729 |
|
|
General and administrative expense (before equity-based compensation) |
|
|
31,839 |
|
5,549 |
|
2,622 |
|
— |
|
(815) |
|
39,195 |
|
|
Equity-based compensation expense |
|
|
19,217 |
|
4,589 |
|
1,697 |
|
— |
|
— |
|
25,503 |
|
|
Other operating expenses |
|
|
53,618 |
|
— |
|
4,344 |
|
89,993 |
|
(3,526) |
|
144,429 |
|
|
Total |
|
|
643,153 |
|
38,176 |
|
55,121 |
|
89,993 |
|
(132,207) |
|
694,236 |
|
|
Operating income (loss) |
|
$ |
488,338 |
|
53,483 |
|
27,989 |
|
(24,069) |
|
(44,398) |
|
501,343 |
|
|
|
|
|
|
|
|
|
|
|
|
|
|
|
|
|
|
Equity in earnings of unconsolidated affiliates |
|
$ |
— |
|
2,231 |
|
— |
|
— |
|
— |
|
2,231 |
|
|
Segment Adjusted EBITDAX (1) |
|
$ |
314,715 |
|
77,996 |
|
41,048 |
|
(24,069) |
|
(44,398) |
|
365,292 |
|
|
(1) |
See “—Non-GAAP Financial Measures” for a definition of Segment Adjusted EBITDAX (a non-GAAP measure) and a reconciliation of Segment Adjusted EBITDAX to operating income. |
35
The following tables set forth selected operating data for the three months ended March 31, 2016 compared to the three months ended March 31, 2017:
|
|
|
|
|
|
|
|
|
|
|
|
|
|
|
|
|
Three Months Ended March 31, |
|
Amount of |
|
Percent |
|
|||||
|
(in thousands) |
|
2016 |
|
2017 |
|
(Decrease) |
|
Change |
|
|||
|
Operating revenues and other: |
|
|
|
|
|
|
|
|
|
|
|
|
|
Natural gas sales |
|
$ |
254,776 |
|
$ |
466,664 |
|
$ |
211,888 |
|
83 |
% |
|
NGLs sales |
|
|
73,065 |
|
|
194,652 |
|
|
121,587 |
|
166 |
% |
|
Oil sales |
|
|
10,179 |
|
|
26,960 |
|
|
16,781 |
|
165 |
% |
|
Gathering, compression, and water handling and treatment |
|
|
3,844 |
|
|
2,604 |
|
|
(1,240) |
|
(32) |
% |
|
Marketing |
|
|
99,216 |
|
|
65,924 |
|
|
(33,292) |
|
(34) |
% |
|
Commodity derivative fair value gains |
|
|
279,924 |
|
|
438,775 |
|
|
158,851 |
|
57 |
% |
|
Total operating revenues and other |
|
|
721,004 |
|
|
1,195,579 |
|
|
474,575 |
|
66 |
% |
|
Operating expenses: |
|
|
|
|
|
|
|
|
|
|
|
|
|
Lease operating |
|
|
11,293 |
|
|
15,551 |
|
|
4,258 |
|
38 |
% |
|
Gathering, compression, processing, and transportation |
|
|
208,738 |
|
|
266,829 |
|
|
58,091 |
|
28 |
% |
|
Production and ad valorem taxes |
|
|
19,284 |
|
|
24,793 |
|
|
5,509 |
|
29 |
% |
|
Marketing |
|
|
137,933 |
|
|
89,993 |
|
|
(47,940) |
|
(35) |
% |
|
Exploration |
|
|
1,014 |
|
|
2,107 |
|
|
1,093 |
|
108 |
% |
|
Impairment of unproved properties |
|
|
15,526 |
|
|
26,899 |
|
|
11,373 |
|
73 |
% |
|
Depletion, depreciation, and amortization |
|
|
191,582 |
|
|
202,729 |
|
|
11,147 |
|
6 |
% |
|
Accretion of asset retirement obligations |
|
|
598 |
|
|
637 |
|
|
39 |
|
7 |
% |
|
General and administrative (before equity-based compensation) |
|
|
32,817 |
|
|
39,195 |
|
|
6,378 |
|
19 |
% |
|
Equity-based compensation |
|
|
23,470 |
|
|
25,503 |
|
|
2,033 |
|
9 |
% |
|
Total operating expenses |
|
|
642,255 |
|
|
694,236 |
|
|
51,981 |
|
8 |
% |
|
Operating income |
|
|
78,749 |
|
|
501,343 |
|
|
422,594 |
|
537 |
% |
|
|
|
|
|
|
|
|
|
|
|
|
|
|
|
Other earnings (expenses): |
|
|
|
|
|
|
|
|
|
|
|
|
|
Equity in earnings of unconsolidated affiliates |
|
|
— |
|
|
2,231 |
|
|
2,231 |
|
* |
|
|
Interest expense |
|
|
(63,284) |
|
|
(66,670) |
|
|
(3,386) |
|
5 |
% |
|
Total other expenses |
|
|
(63,284) |
|
|
(64,439) |
|
|
(1,155) |
|
2 |
% |
|
Income before income taxes |
|
|
15,465 |
|
|
436,904 |
|
|
421,439 |
|
2,725 |
% |
|
Income tax expense |
|
|
(4,815) |
|
|
(131,346) |
|
|
(126,531) |
|
2,628 |
% |
|
Net income and comprehensive income including noncontrolling interest |
|
|
10,650 |
|
|
305,558 |
|
|
294,908 |
|
2,769 |
% |
|
Net income and comprehensive income attributable to noncontrolling interest |
|
|
15,705 |
|
|
37,162 |
|
|
21,457 |
|
137 |
% |
|
Net income (loss) and comprehensive income (loss) attributable to Antero Resources Corporation |
|
$ |
(5,055) |
|
$ |
268,396 |
|
$ |
273,451 |
|
* |
|
|
|
|
|
|
|
|
|
|
|
|
|
|
|
|
Adjusted EBITDAX (1) |
|
$ |
355,401 |
|
$ |
365,292 |
|
$ |
9,891 |
|
3 |
% |
36
|
|
|
Three Months Ended March 31, |
|
Amount of |
|
Percent |
|
|||||
|
|
|
2016 |
|
2017 |
|
(Decrease) |
|
Change |
|
|||
|
Production data: |
|
|
|
|
|
|
|
|
|
|
|
|
|
Natural gas (Bcf) |
|
|
123 |
|
|
139 |
|
|
16 |
|
14 |
% |
|
C2 Ethane (MBbl) |
|
|
1,081 |
|
|
2,310 |
|
|
1,229 |
|
114 |
% |
|
C3+ NGLs (MBbl) |
|
|
4,681 |
|
|
5,968 |
|
|
1,287 |
|
27 |
% |
|
Oil (MBbl) |
|
|
472 |
|
|
643 |
|
|
171 |
|
36 |
% |
|
Combined (Bcfe) |
|
|
160 |
|
|
193 |
|
|
33 |
|
21 |
% |
|
Daily combined production (MMcfe/d) |
|
|
1,758 |
|
|
2,144 |
|
|
386 |
|
22 |
% |
|
Average prices before effects of derivative settlements(2): |
|
|
|
|
|
|
|
|
|
|
|
|
|
Natural gas (per Mcf) |
|
$ |
2.08 |
|
$ |
3.35 |
|
$ |
1.27 |
|
61 |
% |
|
C2 Ethane (per Bbl) |
|
$ |
6.68 |
|
$ |
8.00 |
|
$ |
1.32 |
|
20 |
% |
|
C3+ NGLs (per Bbl) |
|
$ |
14.07 |
|
$ |
29.52 |
|
$ |
15.45 |
|
110 |
% |
|
Oil (per Bbl) |
|
$ |
21.56 |
|
$ |
41.96 |
|
$ |
20.40 |
|
95 |
% |
|
Combined (per Mcfe) |
|
$ |
2.11 |
|
$ |
3.57 |
|
$ |
1.46 |
|
69 |
% |
|
Average realized prices after effects of derivative settlements(2): |
|
|
|
|
|
|
|
|
|
|
|
|
|
Natural gas (per Mcf) |
|
$ |
4.54 |
|
$ |
3.89 |
|
$ |
(0.65) |
|
(14) |
% |
|
C2 Ethane (per Bbl) |
|
$ |
6.68 |
|
$ |
8.73 |
|
$ |
2.05 |
|
31 |
% |
|
C3+ NGLs (per Bbl) |
|
$ |
18.88 |
|
$ |
24.01 |
|
$ |
5.13 |
|
27 |
% |
|
Oil (per Bbl) |
|
$ |
21.56 |
|
$ |
43.17 |
|
$ |
21.61 |
|
100 |
% |
|
Combined (per Mcfe) |
|
$ |
4.14 |
|
$ |
3.80 |
|
$ |
(0.34) |
|
(8) |
% |
|
Average Costs (per Mcfe): |
|
|
|
|
|
|
|
|
|
|
|
|
|
Lease operating |
|
$ |
0.07 |
|
$ |
0.08 |
|
$ |
0.01 |
|
14 |
% |
|
Gathering, compression, processing, and transportation |
|
$ |
1.30 |
|
$ |
1.38 |
|
$ |
0.08 |
|
6 |
% |
|
Production and ad valorem taxes |
|
$ |
0.12 |
|
$ |
0.13 |
|
$ |
0.01 |
|
8 |
% |
|
Marketing, net |
|
$ |
0.24 |
|
$ |
0.12 |
|
$ |
(0.12) |
|
(50) |
% |
|
Depletion, depreciation, amortization, and accretion |
|
$ |
1.20 |
|
$ |
1.05 |
|
$ |
(0.15) |
|
(13) |
% |
|
General and administrative (before equity-based compensation) |
|
$ |
0.21 |
|
$ |
0.20 |
|
$ |
(0.01) |
|
(5) |
% |
|
(1) |
See “—Non-GAAP Financial Measures” for a definition of Adjusted EBITDAX (a non-GAAP measure) and a reconciliation of Adjusted EBITDAX to net income (loss) including noncontrolling interest and net cash provided by operating activities. |
|
(2) |
Average sales prices shown in the table reflect both the before and after effects of our settled derivatives. Our calculation of such after effects includes gains on settlements of derivatives, which do not qualify for hedge accounting because we do not designate or document them as hedges for accounting purposes. Oil and NGLs production was converted at 6 Mcf per Bbl to calculate total Bcfe production and per Mcfe amounts. This ratio is an estimate of the equivalent energy content of the products and does not necessarily reflect their relative economic value. |
*Not meaningful or applicable.
Discussion of Consolidated Exploration and Production Results for the Three Months Ended March 31, 2016 Compared to the Three Months Ended March 31, 2017
Natural gas, NGLs, and oil sales. Revenues from production of natural gas, NGLs, and oil increased from $338 million for the three months ended March 31, 2016 to $688 million for the three months ended March 31, 2017, an increase of $350 million, or 104%. Our production increased by 22% over that same period, from 160 Bcfe, or 1,758 MMcfe per day, for the three months ended March 31, 2016 to 193 Bcfe, or 2,144 MMcfe per day, for the three months ended March 31, 2017. Net equivalent prices before the effects of settled derivative gains increased from $2.11 per Mcfe for the three months ended March 31, 2016 to $3.57 for the three months ended March 31, 2017, an increase of 69%. Average prices for natural gas, ethane, C3+ NGLs, and oil all increased from 2016 levels. Net equivalent prices after the effects of gains on settled derivatives decreased from $4.14 for the three months ended March 31, 2016 to $3.80 for the three months ended March 31, 2017, primarily due to lower average hedged prices in the three months ended March 31, 2017.
Increased production volumes accounted for an approximate $70 million increase in year-over-year product revenues (calculated as the combined change in year-to-year volumes times the prior year average price), and increases in our equivalent prices, excluding the effects of derivative settlements, accounted for an approximate $280 million increase in year-over-year product revenues (calculated as the change in year-to-year average price times current year production volumes). Production increases resulted from an increase in the number of producing wells as a result of our drilling and completion program.
Commodity derivative fair value gains. To achieve more predictable cash flows, and to reduce our exposure to price fluctuations, we enter into derivative contracts using fixed for variable swap contracts when management believes that favorable future sales prices for our production can be secured. Because we do not designate these derivatives as accounting hedges, they do not receive hedge
37
accounting treatment, and all mark-to-market gains or losses, as well as cash receipts or payments on settled derivative instruments, are recognized in our statements of operations. For the three months ended March 31, 2016 and 2017, our hedges resulted in derivative fair value gains of $280 million and $439 million, respectively. The derivative fair value gains included $324 million and $45 million of gains on cash settled derivatives for the three months ended March 31, 2016 and 2017, respectively. Commodity derivative fair value gains or losses vary based on future commodity prices and have no cash flow impact until the derivative contracts are settled. Derivative asset or liability positions at the end of any accounting period may reverse to the extent commodity futures prices increase or decrease from their levels at the end of the accounting period, or as gains or losses are realized through settlement. We expect continued volatility in commodity prices and the related fair value of our derivative instruments in the future.
Gathering, compression, and water handling and treatment revenues. Gathering, compression, and water handling and treatment revenues decreased from $4 million for the three months ended March 31, 2016 to $3 million for the three months ended March 31, 2017, primarily attributable to the provision of such services to wells in which we hold a higher working interest than the wells to which such services were provided in 2016. Fees for gathering, compression, and water handling and treatment services provided to us by Antero Midstream are eliminated in consolidation. The amounts that are not eliminated represent the portion of such fees that are charged to outside working interest owners in Company-operated wells, as well as fees charged to other third parties for services provided by Antero Midstream.
Lease operating expense. Lease operating expense increased from $11 million for the three months ended March 31, 2016 to $16 million for the three months ended March 31, 2017, an increase of 38%. The increase is primarily a result of an increase in production and the number of producing wells. On a per unit basis, lease operating expenses increased from $0.07 per Mcfe for the three months ended March 31, 2016 to $0.08 for the three months ended March 31, 2017. Lease operating expenses are expected to slowly increase on a per unit basis as maturing properties make up a larger proportion of our production base and average production per existing well declines.
Gathering, compression, processing, and transportation expense. Gathering, compression, processing, and transportation expense increased from $209 million for the three months ended March 31, 2016 to $267 million for the three months ended March 31, 2017. The increase in these expenses is a result of the increase in production and the related firm transportation, gathering, compression, and processing expenses. On a per Mcfe basis, total gathering, compression, processing and transportation expenses increased from $1.30 per Mcfe for the three months ended March 31, 2016 to $1.38 per Mcfe for the three months ended March 31, 2017, primarily due to increased utilization of a pipeline which has higher per-unit transportation costs than the average of our transportation portfolio.
Production and ad valorem tax expense. Total production and ad valorem taxes increased from $19 million for the three months ended March 31, 2016 to $25 million for the three months ended March 31, 2017 as a result of an increase in production revenues. On a per Mcfe basis, production and ad valorem taxes increased from $0.12 per Mcfe for the three months ended March 31, 2016 to $0.13 per Mcfe for the three months ended March 31, 2017 as a result of increases in per-unit production revenues. Production and ad valorem taxes as a percentage of natural gas, NGLs, and oil revenues before the effects of hedging decreased from 5.7% for the three months ended March 31, 2016 to 3.6% for the three months ended March 31, 2017, primarily attributable to the July 1, 2016 termination of a West Virginia production tax surcharge for workers’ compensation funding.
Exploration expense. Exploration expense increased from $1 million for the three months ended March 31, 2016 to $2 million for the three months ended March 31, 2017. These amounts represent expenses incurred for unsuccessful lease acquisition efforts.
Impairment of unproved properties. Impairment of unproved properties increased from $16 million for the three months ended March 31, 2016 to $27 million for the three months ended March 31, 2017, primarily due to the expiration of leases in our Marcellus leasehold which we elected not to retain and develop. We charge impairment expense for expired or soon-to-be expired leases when we determine they are impaired based on factors such as remaining lease terms, reservoir performance, commodity price outlooks, or future plans to develop the acreage.
Depletion, depreciation, and amortization. Depletion, depreciation, and amortization (“DD&A”) increased from $192 million for the three months ended March 31, 2016 to $203 million for the three months ended March 31, 2017, primarily because of increased production. DD&A per Mcfe decreased by 13%, from $1.20 per Mcfe during the three months ended March 31, 2016 to $1.05 per Mcfe during the three months ended March 31, 2017 due to increases in our estimated recoverable reserves and decreases in our per-unit development costs, in part due to well cost reductions and drilling and completion efficiencies that we have achieved over the last year.
38
We evaluate the carrying amount of our proved natural gas, NGLs, and oil properties for impairment on a geological reservoir basis whenever events or changes in circumstances (such as the decline in commodity prices since late 2014) indicate that a property’s carrying amount may not be recoverable. If the carrying amount exceeded the estimated undiscounted future net cash flows (measured using futures prices at the end of a quarter), we would further evaluate our proved properties and record an impairment charge if the carrying amount of our proved properties exceeded the estimated fair value of the properties. At March 31, 2017, we compared the carrying values of our proved properties to estimated future net cash flows. As estimated future net cash flows were higher than the carrying values of our proved properties at March 31, 2017, we did not further evaluate our proved properties for impairment.
General and administrative. General and administrative expense (before equity-based compensation expense) increased from $33 million for the three months ended March 31, 2016 to $39 million for the three months ended March 31, 2017, primarily due to increases in employee compensation and benefits expenses. On a per unit basis, general and administrative expense before equity-based compensation decreased by 5%, from $0.21 per Mcfe during the three months ended March 31, 2016 to $0.20 per Mcfe during the three months ended March 31, 2017, primarily due to our 22% increase in production. We had 501 employees as of March 31, 2016 and 541 employees as of March 31, 2017.
Equity-based compensation. Noncash equity-based compensation expense increased from $23 million for the three months ended March 31, 2016 to $26 million for the three months ended March 31, 2017 as a result of performance share unit and restricted stock unit awards granted in April 2016. See Note 7 to the condensed consolidated financial statements included elsewhere in this report for more information on equity-based compensation awards.
Interest expense. Interest expense increased from $63 million for the three months ended March 31, 2016 to $67 million for the three months ended March 31, 2017, primarily due to Antero Midstream’s issuance of its 5.375% senior notes due 2024 in September 2016. Interest expense includes approximately $2.8 million of non-cash amortization of deferred financing costs for the three months ended March 31, 2016 and 2017.
Income tax expense. Income tax expense increased from $5 million for the three months ended March 31, 2016 to $131 million for the three months ended March 31, 2017 due to an increase in our pre-tax income. The effect of state tax rates, state tax apportionment, and the noncontrolling interest in Antero Midstream largely account for the difference between the federal tax rate of 35% and the rate at which income tax expense was provided for the three months ended March 31, 2017.
At December 31, 2016, we had approximately $1.5 billion of net operating losses (“NOLs”) for U.S. federal income tax purposes that expire at various dates from 2024 through 2036 and approximately $1.4 billion of state NOLs that expire at various dates from 2017 through 2036. In past years, legislation has been proposed that would, if enacted into law, make significant changes to U.S. tax laws, including to certain key U.S. federal income tax provisions currently available to oil and gas companies, such as deductions for intangible drilling costs. Moreover, other more general features of tax reform legislation, including changes to cost recovery rules and to the deductibility of interest expense, may also change the taxation of oil and gas companies. If passed, such legislation could significantly affect our future taxable position. The impact of any such change would be recorded in the period in which such legislation is enacted.
Adjusted EBITDAX. Adjusted EBITDAX increased by 3%, from $355 million for the three months ended March 31, 2016 to $365 million for the three months ended March 31, 2017. The increase in Adjusted EBITDAX was primarily due to a 22% increase in production, net of the related increases in cash operating and general and administrative expenses. See “—Non-GAAP Financial Measures” for a definition of Adjusted EBITDAX (a non-GAAP measure) and a reconciliation of Adjusted EBITDAX to net income (loss) including noncontrolling interest and net cash provided by operating activities.
Discussion of Segment Results for the Three Months Ended March 31, 2016 Compared to the Three Months Ended March 31, 2017
Gathering and Processing. Revenue for the gathering and processing segment increased from $70 million for the three months ended March 31, 2016 to $92 million for the three months ended March 31, 2017, an increase of $22 million, or 32%. Gathering revenues increased by $15 million from the prior year period and compression revenues increased by $7 million as additional wells on production increased throughput volumes. Total operating expenses related to the gathering and processing segment increased from
39
$34 million for the three months ended March 31, 2016 to $38 million for the three months ended March 31, 2017 primarily as a result of increases in depreciation expense due to a larger base of gathering assets.
In May 2016, Antero Midstream purchased a 15% equity interest in a regional gathering pipeline. In February 2017, Antero Midstream formed a joint venture with MarkWest which provides natural gas processing and fractionation services. Equity in earnings of unconsolidated affiliates of $2.2 million for the three months ended March 31, 2017 represents the portion of the net income from these investments which is allocated to Antero Midstream based on its equity interests. The Company did not hold any unconsolidated equity investments during the three months ended March 31, 2016.
Water Handling and Treatment. Revenue for the water handling and treatment segment increased from $66 million for the three months ended March 31, 2016 to $83 million for the three months ended March 31, 2017, an increase of $17 million, or 25%. The increase was due to an increase in the volume of water used per well in our advanced completions during the three months ended March 31, 2017 as compared to the three months ended March 31, 2016. The volume of water delivered through the systems increased from 8.9 MMBbls for the three months ended March 31, 2016 to 13.4 MMBbls for the three months ended March 31, 2017. Operating expenses for the water handling and treatment segment decreased from $56 million for the three months ended March 31, 2016 to $55 million for the three months ended March 31, 2017.
Marketing. Where permitted, we purchase and sell third-party natural gas and NGLs and market our excess firm transportation capacity, or engage third parties to conduct these activities on our behalf, in order to optimize the revenues from these transportation agreements. We have entered into long-term firm transportation agreements for a significant portion of our current and expected future production in order to secure guaranteed capacity to favorable markets. Marketing revenues of $99 million and $66 million and expenses of $138 million and $90 million for the three months ended March 31, 2016 and 2017, respectively, relate to these activities. Net losses on our marketing activities were $39 million and $24 million for the three months ended March 31, 2016 and 2017, respectively. Marketing costs include firm transportation costs related to current excess capacity as well as the cost of third-party purchased gas and NGLs. This includes firm transportation costs of $36 million and $21 million for the three months ended March 31, 2016 and 2017, respectively, related to unutilized excess capacity which decreased due to the assumption of certain unutilized firm transportation capacity by a third party beginning July 1, 2016.
Based on current projections for our 2017 annual production levels, we estimate that we could incur total annual net marketing expense of $60 million to $105 million in 2017 depending on the amount of unutilized transportation capacity that can be marketed to third parties or utilized to transport third party gas and capture positive basis differentials between various indices. In years subsequent to 2017, our commitments and obligations under firm transportation agreements continue to increase. As a result, our net marketing expense could increase depending on our utilization of our transportation capacity based on future production and how much, if any, future excess transportation can be marketed to third parties.
Capital Resources and Liquidity
Historically, our primary sources of liquidity have been through issuances of debt and equity securities, borrowings under our revolving credit facility, asset sales, and net cash provided by operating activities. Our primary use of cash has been for the exploration, development, and acquisition of natural gas, NGLs, and oil properties, as well as for development of gathering systems and facilities, and fresh water handling and wastewater treatment infrastructure. As we pursue the development of our reserves, we continually monitor what capital resources, including equity and debt financings, are available to meet our future financial obligations, planned capital expenditure activities, and liquidity requirements. Our future success in growing our proved reserves and production will be highly dependent on the capital resources available to us.
We believe that funds from operating cash flows and available borrowings under our revolving credit facility, or capital market transactions, will be sufficient to meet our cash requirements, including normal operating needs, debt service obligations, capital expenditures, and commitments and contingencies for at least the next 12 months. For more information on our outstanding indebtedness, see Note 5 to the condensed consolidated financial statements included in this Quarterly Report on Form 10-Q.
40
The following table summarizes our cash flows for the three months ended March 31, 2016 and 2017 (in thousands):
|
|
|
|
|
|
|
|
|
|
|
|
|
|
||||
|
(in thousands) |
|
2016 |
|
2017 |
|
||
|
Net cash provided by operating activities |
|
|
340,168 |
|
|
393,939 |
|
|
Net cash used in investing activities |
|
|
(519,295) |
|
|
(688,473) |
|
|
Net cash provided by financing activities |
|
|
195,524 |
|
|
262,924 |
|
|
Net increase (decrease) in cash and cash equivalents |
|
|
16,397 |
|
|
(31,610) |
|
Cash Flow Provided by Operating Activities
Net cash provided by operating activities was $340 million and $394 million for the three months ended March 31, 2016 and 2017, respectively. The increase in cash flows from operations from the three months ended March 31, 2016 to the three months ended March 31, 2017 was primarily due to increases in our production revenues partially offset by decreases in commodity derivative settlements, increases in interest expense payments, and changes in working capital levels.
Our operating cash flow is sensitive to many variables, the most significant of which is the volatility of natural gas, NGLs, and oil prices, as well as volatility in the cash flows attributable to settlement of our commodity derivatives. Prices for natural gas, NGLs, and oil are primarily determined by prevailing market conditions. Regional and worldwide economic activity, weather, infrastructure capacity to reach markets, and other variables influence the market conditions for these products. These factors are beyond our control and are difficult to predict. For additional information on the impact of changing prices on our financial position, see “Item 3. Quantitative and Qualitative Disclosures About Market Risk.”
Cash Flow Used in Investing Activities
Cash flows used in investing activities increased from $519 million for the three months ended March 31, 2016 to $688 million for the three months ended March 31, 2017, primarily due to Antero Midstream’s investments in the Joint Venture in February 2017. During the three months ended March 31, 2017, our cash flows used in investing activities included $307 million for drilling and completion costs, $56 million for undeveloped leasehold additions, $50 million for acquisitions, $37 million for water handling and treatment systems, $67 million for gathering and compression systems, $160 million for investments in the Joint Venture, and $1 million for other property and equipment. During the three months ended March 31, 2016, our cash flows used in investing activities included $395 million for drilling and completion costs, $29 million for undeveloped leasehold additions, $37 million for water handling and treatment systems, $49 million for gathering and compression systems, and $1 million for other property and equipment.
Our board of directors has approved a capital budget of $1.5 billion for 2017, which does not include the capital budget of $800 million for Antero Midstream, our consolidated subsidiary. Our capital budget may be adjusted as business conditions warrant as the amount, timing, and allocation of capital expenditures is largely discretionary and within our control. If natural gas, NGLs, and oil prices decline to levels below our acceptable levels, or costs increase to levels above our acceptable levels, we could choose to defer a significant portion of our budgeted capital expenditures until later periods to achieve the desired balance between sources and uses of liquidity, and to prioritize capital projects that we believe have the highest expected returns and potential to generate near-term cash flows. We routinely monitor and adjust our capital expenditures in response to changes in commodity prices, availability of financing, drilling and acquisition costs, industry conditions, the availability of rigs, success or lack of success in drilling activities, contractual obligations, internally generated cash flows, and other factors both within and outside our control.
Cash Flow Provided by Financing Activities
Net cash flows provided by financing activities increased from $196 million for the three months ended March 31, 2016 to $263 million for the three months ended March 31, 2017, primarily due to Antero Midstream’s issuance of common units in February 2017 to fund its initial investment in the Joint Venture. During the three months ended March 31, 2017, our cash flows provided by financing activities included net proceeds from the issuance of common units in Antero Midstream of $223 million and increased net borrowings on our revolving credit facilities of $70 million, partially offset by distributions of $27 million to noncontrolling interest owners in Antero Midstream and other items totaling $3 million. During the three months ended March 31, 2016, our cash flows provided by financing activities included proceeds of $178 million from the sale of Antero Midstream common units owned by Antero and net borrowings on our revolving credit facilities of $33 million, partially offset by distributions of $14 million to noncontrolling interest owners in Antero Midstream and other items totaling $1 million.
41
Debt Agreements and Contractual Obligations
Senior Secured Revolving Credit Facility. We have a senior secured revolving bank credit facility (the “Credit Facility”) with a consortium of bank lenders. Borrowings under the Credit Facility are subject to borrowing base limitations based on the collateral value of our assets and are subject to regular semiannual redeterminations. At March 31, 2017, the borrowing base was $4.75 billion and lender commitments were $4.0 billion. In April 2017, the borrowing base was reaffirmed at $4.75 billion, and lender commitments remain at $4.0 billion. The next redetermination of the borrowing base is scheduled to occur in October 2017. At March 31, 2017, we had $520 million of borrowings and $710 million of letters of credit outstanding under the Credit Facility, with a weighted average interest rate of 2.75%. At December 31, 2016, we had $440 million of borrowings and $710 million of letters of credit outstanding under the Credit Facility, with a weighted average interest rate of 2.44%. The Credit Facility matures on May 5, 2019.
The Credit Facility requires Antero and its restricted subsidiaries to maintain the following two financial ratios:
|
· |
a current ratio, which is the ratio of our current assets (including any unused borrowing base under the facilities and excluding derivative assets) to our current liabilities (excluding derivative liabilities), of not less than 1.0 to 1.0 as of the end of each fiscal quarter; and |
|
· |
a minimum interest coverage ratio, which is the ratio of EBITDAX (as defined by the credit facility agreement) to interest expense over the most recent four quarters, of not less than 2.5 to 1.0. |
We were in compliance with such covenants and ratios as of December 31, 2016 and March 31, 2017. The actual borrowing capacity available to us may be limited by the financial ratio covenants. At March 31, 2017, our current ratio was 5.57 to 1.0 (based on the $4.75 billion borrowing base as of March 31, 2017) and our interest coverage ratio was 6.31 to 1.0.
Midstream Credit Facility. Antero Midstream has a secured revolving credit facility (the “Midstream Facility”) among Antero Midstream, certain lenders party thereto, and Wells Fargo Bank, National Association, as administrative agent, letter of credit issuer, and swing line lender. The Midstream Facility provides for lender commitments of $1.5 billion and for a letter of credit sublimit of $150 million. At March 31, 2017, Antero Midstream had a total outstanding balance under the Midstream Facility of $200 million, with a weighted average interest rate of 2.51%. At December 31, 2016, Antero Midstream had a total outstanding balance under the Midstream Facility of $210 million, with a weighted average interest rate of 2.23%. The Midstream Facility matures on November 10, 2019.
Senior Notes. Please refer to Note 5 to the condensed consolidated financial statements included in this Quarterly Report on Form 10-Q and to “Item 7. Management’s Discussion and Analysis of Financial Condition and Results of Operations” included in our Annual Report on Form 10-K for the year ended December 31, 2016 for information on our senior notes.
We may, from time to time, seek to retire or purchase our outstanding debt through cash purchases and/or exchanges for equity securities, in open market purchases, privately negotiated transactions, or otherwise. Such repurchases or exchanges, if any, will depend on prevailing market conditions, our liquidity requirements, contractual restrictions, and other factors. The amounts involved could be material.
For more information on the terms, conditions, and restrictions under the Credit Facility, the Midstream Facility, and senior unsecured notes, please refer to our Annual Report on Form 10-K for the year ended December 31, 2016 on file with the SEC.
42
Contractual Obligations. A summary of our contractual obligations as of March 31, 2017 is provided in the table below. Contractual obligations listed exclude minimum fees that we will pay to Antero Midstream, our consolidated subsidiary, under gathering and compression, and water services agreements.
|
|
|
|
|
|
|
|
|
|
|
|
|
|
|
|
|
|
|
|
|
|
|
|
|
|
|
|
|
|
Remainder |
|
Year Ended December 31, |
|
|
|
|
|
|
|
||||||||||||||
|
(in millions) |
|
of 2017 |
|
2018 |
|
2019 |
|
2020 |
|
2021 |
|
2022 |
|
Thereafter |
|
Total |
|
||||||||
|
Antero Credit Facility(1) |
|
$ |
— |
|
|
— |
|
|
520 |
|
|
— |
|
|
— |
|
|
— |
|
|
— |
|
|
520 |
|
|
Antero Midstream Facility(1) |
|
|
— |
|
|
— |
|
|
200 |
|
|
— |
|
|
— |
|
|
— |
|
|
— |
|
|
200 |
|
|
Antero senior notes—principal(2) |
|
|
— |
|
|
— |
|
|
— |
|
|
— |
|
|
1,000 |
|
|
1,100 |
|
|
1,350 |
|
|
3,450 |
|
|
Antero senior notes—interest(2) |
|
|
167 |
|
|
182 |
|
|
182 |
|
|
182 |
|
|
155 |
|
|
129 |
|
|
111 |
|
|
1,108 |
|
|
Antero Midstream senior notes—principal(2) |
|
|
— |
|
|
— |
|
|
— |
|
|
— |
|
|
— |
|
|
— |
|
|
650 |
|
|
650 |
|
|
Antero Midstream senior notes—interest(2) |
|
|
17 |
|
|
35 |
|
|
35 |
|
|
35 |
|
|
35 |
|
|
35 |
|
|
70 |
|
|
262 |
|
|
Drilling rig and completion service commitments(3) |
|
|
95 |
|
|
75 |
|
|
40 |
|
|
— |
|
|
— |
|
|
— |
|
|
— |
|
|
210 |
|
|
Firm transportation (4) |
|
|
510 |
|
|
937 |
|
|
1,088 |
|
|
1,107 |
|
|
1,086 |
|
|
1,033 |
|
|
9,362 |
|
|
15,123 |
|
|
Processing, gathering, and compression services (5) |
|
|
304 |
|
|
398 |
|
|
322 |
|
|
319 |
|
|
303 |
|
|
299 |
|
|
1,273 |
|
|
3,218 |
|
|
Office and equipment leases |
|
|
10 |
|
|
13 |
|
|
10 |
|
|
9 |
|
|
8 |
|
|
8 |
|
|
17 |
|
|
75 |
|
|
Asset retirement obligations(6) |
|
|
— |
|
|
— |
|
|
— |
|
|
— |
|
|
— |
|
|
— |
|
|
35 |
|
|
35 |
|
|
Total |
|
$ |
1,103 |
|
|
1,640 |
|
|
2,397 |
|
|
1,652 |
|
|
2,587 |
|
|
2,604 |
|
|
12,868 |
|
|
24,851 |
|
|
(1) |
Includes outstanding principal amounts at March 31, 2017. This table does not include future commitment fees, interest expense, or other fees on our Credit Facility or the Midstream Facility because they are floating rate instruments and we cannot determine with accuracy the timing of future loan advances, repayments, or future interest rates to be charged. |
|
(2) |
Antero senior notes include the 5.375% notes due 2021, the 5.125% notes due 2022, the 5.625% notes due 2023, and the 5.00% notes due 2025. Antero Midstream senior notes include the 5.375% notes due 2024. |
|
(3) |
Includes contracts for services provided by drilling rigs and completion fleets which expire at various dates from April 2017 through February 2020. The values in the table represent the gross amounts that we are committed to pay; however, we will record in our financial statements our proportionate share of costs based on our working interests. |
|
(4) |
Includes firm transportation agreements with various pipelines in order to facilitate the delivery of production to market. These contracts commit us to transport minimum daily natural gas or NGLs volumes at negotiated rates, or pay for any deficiencies at specified reservation fee rates. The amounts in this table reflect our minimum daily volumes at the reservation fee rates. The values in the table represent the gross amounts that we are committed to pay; however, we will record in our financial statements our proportionate share of costs based on our working interests. |
|
(5) |
Contractual commitments for processing, gathering, and compression services agreements represent minimum commitments under long-term agreements. Includes fees to be paid to the Joint Venture owned by Antero Midstream and MarkWest, as well as Antero Midstream’s commitments for the construction of its advanced wastewater treatment complex. The values in the table represent the gross amounts that we are committed to pay; however, we will record in our financial statements our proportionate share of costs based on our working interests. The table does not include intracompany commitments. |
|
(6) |
Represents the present value of our estimated asset retirement obligations. Neither the ultimate settlement amounts nor the timing of our asset retirement obligations can be precisely determined in advance; however, we believe it is likely that a very small amount of these obligations may be settled within the next five years. |
Non-GAAP Financial Measures
“Adjusted EBITDAX” is a non-GAAP financial measure that we define as net income or loss, including noncontrolling interests, before interest expense, interest income, derivative fair value gains or losses (excluding net cash receipts or payments on derivative instruments included in derivative fair value gains or losses), taxes, impairments, depletion, depreciation, amortization, and accretion, exploration expense, franchise taxes, equity-based compensation, gain or loss on early extinguishment of debt, and gain or loss on sale of assets, including distributions from unconsolidated affiliates and excluding equity in earnings of unconsolidated affiliates. “Adjusted EBITDAX,” as used and defined by us, may not be comparable to similarly titled measures employed by other companies and is not a measure of performance calculated in accordance with GAAP. Adjusted EBITDAX should not be considered in isolation or as a substitute for operating income, net income or loss, cash flows provided by operating, investing, and financing activities, or other income or cash flow statement data prepared in accordance with GAAP. Adjusted EBITDAX provides no information regarding
43
a company’s capital structure, borrowings, interest costs, capital expenditures, working capital movement, or tax position. Adjusted EBITDAX does not represent funds available for discretionary use because those funds may be required for debt service, capital expenditures, working capital, income taxes, exploration expenses, and other commitments and obligations. However, our management team believes Adjusted EBITDAX is useful to an investor in evaluating our financial performance because this measure:
|
· |
is widely used by investors in the oil and natural gas industry to measure a company’s operating performance without regard to items excluded from the calculation of such term, which may vary substantially from company to company depending upon accounting methods and the book value of assets, capital structure, and the method by which assets were acquired, among other factors; |
|
· |
helps investors to more meaningfully evaluate and compare the results of our operations from period to period by removing the effect of our capital structure from our operating structure; and |
|
· |
is used by our management team for various purposes, including as a measure of operating performance, in presentations to our Board of Directors, and as a basis for strategic planning and forecasting. Adjusted EBITDAX is also used by our Board of Directors as a performance measure in determining executive compensation. Adjusted EBITDAX, as defined by our Credit Facility, is used by our lenders pursuant to covenants under our revolving credit facility and the indentures governing our senior notes. |
There are significant limitations to using Adjusted EBITDAX as a measure of performance, including the inability to analyze the effects of certain recurring and non-recurring items that materially affect our net income or loss, the lack of comparability of results of operations of different companies, and the different methods of calculating Adjusted EBITDAX reported by different companies.
“Segment Adjusted EBITDAX” is also used by our management team for various purposes, including as a measure of operating performance of our segments and as a basis for strategic planning and forecasting. Segment Adjusted EBITDAX is a non-GAAP financial measure that we define as operating income or loss before derivative fair value gains or losses (excluding net cash receipts or payments on derivative instruments included in derivative fair value gains or losses), impairments, depletion, depreciation, amortization, and accretion, exploration expense, franchise taxes, equity-based compensation, gain or loss on early extinguishment of debt, gain or loss on sale of assets, and gain or loss on changes in the fair value of contingent acquisition consideration. Segment Adjusted EBITDAX also includes distributions received from unconsolidated affiliates. Operating income or loss represents net income or loss, including noncontrolling interests, before interest expense and interest income, income taxes, and equity in earnings of unconsolidated affiliates. Operating income is the most directly comparable GAAP financial measure to Segment Adjusted EBITDAX because we do not account for income tax expense or interest expense on a segment basis.
The following tables represent a reconciliation of our operating income (loss) to Segment Adjusted EBITDAX for the three months ended March 31, 2016 and 2017 (in thousands):
|
|
|
|
|
|
|
|
|
|
|
|
|
|
|
|
|
|
|
Exploration |
|
Gathering and |
|
Water handling and treatment |
|
Marketing |
|
Elimination of |
|
Consolidated |
|
|
|
Three months ended March 31, 2016: |
|
|
|
|
|
|
|
|
|
|
|
|
|
|
|
Operating income (loss) |
|
$ |
96,723 |
|
35,605 |
|
10,810 |
|
(38,717) |
|
(25,672) |
|
78,749 |
|
|
Commodity derivative fair value gains |
|
|
(279,924) |
|
— |
|
— |
|
— |
|
— |
|
(279,924) |
|
|
Gains on settled derivatives |
|
|
324,347 |
|
— |
|
— |
|
— |
|
— |
|
324,347 |
|
|
Depletion, depreciation, amortization, and accretion |
|
|
168,150 |
|
17,068 |
|
6,962 |
|
— |
|
— |
|
192,180 |
|
|
Impairment of unproved properties |
|
|
15,526 |
|
— |
|
— |
|
— |
|
— |
|
15,526 |
|
|
Exploration expense |
|
|
1,014 |
|
— |
|
— |
|
— |
|
— |
|
1,014 |
|
|
Loss (gain) on change in fair value of contingent acquisition consideration |
|
|
(3,396) |
|
— |
|
3,396 |
|
— |
|
— |
|
— |
|
|
Equity-based compensation expense |
|
|
17,498 |
|
4,386 |
|
1,586 |
|
— |
|
— |
|
23,470 |
|
|
State franchise taxes |
|
|
39 |
|
— |
|
— |
|
— |
|
— |
|
39 |
|
|
Segment and consolidated Adjusted EBITDAX |
|
$ |
339,977 |
|
57,059 |
|
22,754 |
|
(38,717) |
|
(25,672) |
|
355,401 |
|
44
|
|
|
|
|
|
|
|
|
|
|
|
|
|
|
|
|
|
|
Exploration |
|
Gathering and |
|
Water handling and treatment |
|
Marketing |
|
Elimination of |
|
Consolidated |
|
|
|
Three months ended March 31, 2017: |
|
|
|
|
|
|
|
|
|
|
|
|
|
|
|
Operating income (loss) |
|
$ |
488,338 |
|
53,483 |
|
27,989 |
|
(24,069) |
|
(44,398) |
|
501,343 |
|
|
Commodity derivative fair value gains |
|
|
(438,775) |
|
— |
|
— |
|
— |
|
— |
|
(438,775) |
|
|
Gains on settled derivatives |
|
|
44,849 |
|
— |
|
— |
|
— |
|
— |
|
44,849 |
|
|
Depletion, depreciation, amortization, and accretion |
|
|
175,606 |
|
19,924 |
|
7,836 |
|
— |
|
— |
|
203,366 |
|
|
Impairment of unproved properties |
|
|
26,899 |
|
— |
|
— |
|
— |
|
— |
|
26,899 |
|
|
Exploration expense |
|
|
2,107 |
|
— |
|
— |
|
— |
|
— |
|
2,107 |
|
|
Loss (gain) on change in fair value of contingent acquisition consideration |
|
|
(3,526) |
|
— |
|
3,526 |
|
— |
|
— |
|
— |
|
|
Equity-based compensation expense |
|
|
19,217 |
|
4,589 |
|
1,697 |
|
— |
|
— |
|
25,503 |
|
|
Segment and consolidated Adjusted EBITDAX |
|
$ |
314,715 |
|
77,996 |
|
41,048 |
|
(24,069) |
|
(44,398) |
|
365,292 |
|
The following table represents a reconciliation of our net income, including noncontrolling interest, to consolidated Adjusted EBITDAX and a reconciliation of consolidated Adjusted EBITDAX to net cash provided by operating activities per our consolidated statements of cash flows, in each case, for the periods presented:
|
|
|
Three months ended March 31, |
|
||||
|
(in thousands) |
|
2016 |
|
2017 |
|
||
|
Net income including noncontrolling interest |
|
$ |
10,650 |
|
|
305,558 |
|
|
Commodity derivative fair value gains(1) |
|
|
(279,924) |
|
|
(438,775) |
|
|
Gains on settled derivatives(1) |
|
|
324,347 |
|
|
44,849 |
|
|
Interest expense |
|
|
63,284 |
|
|
66,670 |
|
|
Income tax expense |
|
|
4,815 |
|
|
131,346 |
|
|
Depletion, depreciation, amortization, and accretion |
|
|
192,180 |
|
|
203,366 |
|
|
Impairment of unproved properties |
|
|
15,526 |
|
|
26,899 |
|
|
Exploration expense |
|
|
1,014 |
|
|
2,107 |
|
|
Equity-based compensation expense |
|
|
23,470 |
|
|
25,503 |
|
|
Equity in earnings of unconsolidated affiliates |
|
|
— |
|
|
(2,231) |
|
|
State franchise taxes |
|
|
39 |
|
|
— |
|
|
Consolidated Adjusted EBITDAX |
|
|
355,401 |
|
|
365,292 |
|
|
Interest expense |
|
|
(63,284) |
|
|
(66,670) |
|
|
Exploration expense |
|
|
(1,014) |
|
|
(2,107) |
|
|
Changes in current assets and liabilities |
|
|
48,830 |
|
|
97,337 |
|
|
State franchise taxes |
|
|
(39) |
|
|
— |
|
|
Other non-cash items |
|
|
274 |
|
|
87 |
|
|
Net cash provided by operating activities |
|
$ |
340,168 |
|
|
393,939 |
|
|
(1) |
The adjustments for the derivative fair value gains and gains on settled derivatives have the effect of adjusting net income from operations for changes in the fair value of unsettled derivatives, which are recognized at the end of each accounting period. As a result, derivative gains included in the calculation of Adjusted EBITDAX only reflect derivatives which settled during the period. |
Critical Accounting Policies and Estimates
The discussion and analysis of our financial condition and results of operations are based upon our consolidated financial statements, which have been prepared in accordance with GAAP. The preparation of our financial statements requires us to make estimates and assumptions that affect the reported amounts of assets, liabilities, revenues and expenses, and related disclosure of contingent assets and liabilities. Certain accounting policies involve judgments and uncertainties to such an extent that there is reasonable likelihood that materially different amounts could have been reported under different conditions, or if different assumptions had been used. We evaluate our estimates and assumptions on a regular basis. We base our estimates on historical experience and various other assumptions that are believed to be reasonable under the circumstances, the results of which form the
45
basis for making judgments about the carrying values of assets and liabilities that are not readily apparent from other sources. Actual results may differ from these estimates and assumptions used in preparation of our consolidated financial statements. Our more significant accounting policies and estimates include the successful efforts method of accounting for our production activities, estimates of natural gas, NGLs, and oil reserve quantities and standardized measures of future cash flows, and impairment of proved properties. We provide an expanded discussion of our more significant accounting policies, estimates and judgments in our 2016 Form 10-K. We believe these accounting policies reflect our more significant estimates and assumptions used in the preparation of our consolidated financial statements. Also, see Note 2 of the notes to our audited consolidated financial statements, included in our 2016 Form 10-K, for a discussion of additional accounting policies and estimates made by management.
We evaluate the carrying amount of our proved natural gas, NGLs, and oil properties for impairment on a geological reservoir basis whenever events or changes in circumstances indicate that a property’s carrying amount may not be recoverable. Under GAAP for successful efforts accounting, if the carrying amount exceeded the estimated undiscounted future net cash flows (measured using futures prices), we would estimate the fair value of our proved properties and record an impairment charge for any excess of the carrying amount of the properties over the estimated fair value of the properties. Due to the low commodity price environment at March 31, 2017, we compared estimated undiscounted future net cash flows using futures pricing for our Utica and Marcellus Basin properties to the carrying values of those properties. Estimated undiscounted future net cash flows exceeded the carrying values at March 31, 2017 and thus, no further evaluation of the proved properties for impairment is required under GAAP. As a result, we have not recorded any impairment expenses associated with our Utica and Marcellus Basin proved properties during the three months ended March 31, 2017. Additionally, we did not record any impairment expenses for proved properties during the years ended December 31, 2014, 2015, and 2016. Based on present futures commodity pricing, we currently do not anticipate having to record any impairment charge for our proved properties in the near future. We are unable, however, to predict commodity prices with any greater precision than the futures market.
New Accounting Pronouncements
On May 28, 2014, the Financial Accounting Standards Board (“FASB”) issued Accounting Standards Update (“ASU”) No. 2014-09, Revenue from Contracts with Customers, which requires an entity to recognize the amount of revenue to which it expects to be entitled for the transfer of promised goods or services to customers. The ASU will replace most existing revenue recognition guidance in GAAP when it becomes effective. Additionally, on May 3, 2016, the FASB issued ASU No. 2016-11, which rescinds SEC accounting guidance regarding the use of the entitlements method for recognition of natural gas revenues. The new standards become effective for the Company on January 1, 2018. Early application is not permitted. The standards permit the use of either the retrospective or cumulative effect transition method. The Company has not yet selected a transition method. While the Company is still evaluating the effect that ASU 2014-09 and ASU No. 2016-11 will have on its consolidated financial statements and related disclosures, currently, we do not believe that there will be a significant effect on our consolidated financial statements upon adoption of these standards. To the extent applicable, upon adoption, we may be required to comply with expanded disclosure requirements, including the disaggregation of revenues to depict the nature and uncertainty of types of revenues, contract assets and liabilities, current period revenues previously recorded as a liability, performance obligations, significant judgments and estimates affecting the amount and timing of revenue recognition, determination of transaction prices, and allocation of transaction prices to performance obligations. We continue to monitor relevant industry guidance regarding implementation of ASU 2014-09 and ASU 2016-11 and will adjust our implementation strategies as necessary. We believe that adoption of the standards will not impact our operational strategies, growth prospects, or cash flows.
On February 25, 2016, the FASB issued ASU No. 2016-02, Leases, which requires all leasing arrangements to be presented on the balance sheet as liabilities along with a corresponding asset. The ASU will replace most existing lease guidance in GAAP when it becomes effective. The new standard becomes effective for the Company on January 1, 2019. Although early application is permitted, the Company does not plan to early adopt the ASU. The standard requires the use of the modified retrospective transition method. The Company is evaluating the effect that ASU 2016-02 will have on its consolidated financial statements and related disclosures. Currently, the Company is evaluating the standard’s applicability to our various contractual arrangements. We believe that adoption of the standard will result in increases to our assets and liabilities on our consolidated balance sheet, as well as changes to the presentation of certain operating expenses on our consolidated statement of operations; however, we have not yet determined the extent of the adjustments that will be required upon implementation of the standard. We continue to monitor relevant industry guidance regarding implementation of ASU 2016-02 and will adjust our implementation strategies as necessary. We believe that adoption of the standard will not impact our operational strategies, growth prospects, or cash flows.
46
Off-Balance Sheet Arrangements
As of March 31, 2017, we did not have any off-balance sheet arrangements other than operating leases and contractual commitments for drilling rig and completion services, firm transportation, gas processing and fractionation, gathering, and compression services. See “—Debt Agreements and Contractual Obligations—Contractual Obligations” for commitments under operating leases, drilling rig and completion service agreements, firm transportation, gas processing, gathering, and compression service agreements.
47
Item 3.Quantitative and Qualitative Disclosures About Market Risk.
The primary objective of the following information is to provide forward-looking quantitative and qualitative information about our potential exposure to market risk. The term “market risk” refers to the risk of loss arising from adverse changes in natural gas, NGLs, and oil prices, as well as interest rates. These disclosures are not meant to be precise indicators of expected future losses, but rather indicators of reasonably possible losses. This forward-looking information provides indicators of how we view and manage our ongoing market risk exposures.
Commodity Hedging Activities
Our primary market risk exposure is in the price we receive for our natural gas, NGLs, and oil production. Pricing is primarily driven by spot regional market prices applicable to our U.S. natural gas production and the prevailing worldwide price for crude oil. Pricing for natural gas, NGLs, and oil production has, historically, been volatile and unpredictable, and we expect this volatility to continue in the future. The prices we receive for our production depend on many factors outside of our control, including volatility in the differences between product prices at sales points and the applicable index price.
To mitigate some of the potential negative impact on our cash flows caused by changes in commodity prices, we enter into derivative instruments to receive fixed prices for a portion of our natural gas, NGLs, and oil production when management believes that favorable future prices can be secured. At March 31, 2017, the majority of our natural gas hedges were fixed price swaps at NYMEX pricing.
Our financial hedging activities are intended to support natural gas, NGLs, and oil prices at targeted levels and to manage our exposure to natural gas, NGLs, and oil price fluctuations. These contracts may include commodity price swaps whereby we will receive a fixed price and pay a variable market price to the contract counterparty, cashless price collars that set a floor and ceiling price for the hedged production, or basis differential swaps. These contracts are financial instruments, and do not require or allow for physical delivery of the hedged commodity. The Company was not party to any collars as of or during the three months ended March 31, 2017.
At March 31, 2017, we had in place natural gas, NGLs, and oil swaps covering portions of our projected production from 2017 through 2023. Our commodity hedge position as of March 31, 2017 is summarized in Note 9(a) to our condensed consolidated financial statements included elsewhere in this Quarterly Report on Form 10-Q. The Credit Facility allows us to hedge up to 75% of our projected production for the next five years, and 65% of our subsequent estimated proved reserves through December 31, 2023. Based on our production and our fixed price swap contracts which settled during the three months ended March 31, 2017, our revenues would have decreased by approximately $1.6 million for each $0.10 decrease per MMBtu in natural gas prices and $1.00 decrease per Bbl in oil and NGLs prices, excluding the effects of changes in the fair value of our derivative positions which remain open at March 31, 2017.
All derivative instruments, other than those that meet the normal purchase and normal sale exception, are recorded at fair market value in accordance with GAAP and are included in our consolidated balance sheets as assets or liabilities. The fair values of our derivative instruments are adjusted for non-performance risk. Because we do not designate these derivatives as accounting hedges, they do not receive hedge accounting treatment; therefore, all mark-to-market gains or losses, as well as cash receipts or payments on settled derivative instruments, are recognized in our statements of operations. We present total gains or losses on commodity derivatives (for both settled derivatives and derivative positions which remain open) within operating revenues as “Commodity derivative fair value gains (losses).”
Mark-to-market adjustments of derivative instruments cause earnings volatility but have no cash flow impact relative to changes in market prices until the derivative contracts are settled. We expect continued volatility in the fair value of our derivative instruments. Our cash flows are only impacted when the associated derivative contracts are settled by making or receiving payments to or from the counterparty. At March 31, 2017, the estimated fair value of our commodity derivative instruments was a net asset of $2.0 billion comprised of current and noncurrent assets and current and noncurrent liabilities. At December 31, 2016, the estimated fair value of our commodity derivative instruments was a net asset of $1.6 billion comprised of current and noncurrent assets and liabilities.
By removing price volatility from a portion of our expected production through December 2023, we have mitigated, but not eliminated, the potential negative effects of changing prices on our operating cash flows for those periods. While mitigating negative effects of falling commodity prices, these derivative contracts also limit the benefits we would receive from increases in commodity prices above the fixed hedge prices.
48
Counterparty and Customer Credit Risk
Our principal exposures to credit risk are through receivables resulting from the following: commodity derivative contracts ($2.0 billion at March 31, 2017); the sale of our oil and gas production ($193 million at March 31, 2017) which we market to energy companies, end users, and refineries; marketing activities ($27 million at March 31, 2017); and joint interest receivables ($13 million at March 31, 2017).
By using derivative instruments that are not traded on an exchange to hedge our exposures to changes in commodity prices, we expose ourselves to the credit risk of our counterparties. Credit risk is the potential failure of the counterparty to perform under the terms of a derivative contract. When the fair value of a derivative contract is positive, the counterparty is expected to owe us, which creates credit risk. To minimize the credit risk in derivative instruments, it is our policy to enter into derivative contracts only with counterparties that are creditworthy financial institutions which management deems to be competent and competitive market makers. The creditworthiness of our counterparties is subject to periodic review. We have commodity hedges in place with fifteen different counterparties, all of which are lenders under our Credit Facility. The fair value of our commodity derivative contracts of approximately $2.0 billion at March 31, 2017 included the following derivative assets by bank counterparty: Morgan Stanley - $610 million; Barclays - $441 million; JP Morgan - $368 million; Wells Fargo - $173 million; Scotiabank - $160 million; Canadian Imperial Bank of Commerce - $79 million; Citigroup - $68 million; Toronto Dominion - $40 million; Bank of Montreal - $17 million; BNP Paribas - $16 million; Fifth Third - $13 million; SunTrust - $8 million; and Capital One - $4 million. The credit ratings of certain of these banks were downgraded several years ago because of their exposure to the sovereign debt crisis in Europe or various other factors. The estimated fair value of our commodity derivative assets has been risk adjusted using a discount rate based upon the counterparties’ respective published credit default swap rates (if available, or if not available, a discount rate based on the applicable Reuters bond rating) at March 31, 2017 for each of the European and American banks. We believe that all of these institutions, currently, are acceptable credit risks. Other than as provided by the Credit Facility, we are not required to provide credit support or collateral to any of our counterparties under our derivative contracts, nor are they required to provide credit support to us. As of March 31, 2017, we did not have any past-due receivables from, or payables to, any of the counterparties to our derivative contracts.
We are also subject to credit risk due to the concentration of our receivables from several significant customers for sales of natural gas, NGLs, and oil. Marketing receivables primarily result from sales of third-party gas and NGLs. We generally do not require our customers to post collateral. The inability or failure of our significant customers to meet their obligations to us, or their insolvency or liquidation, may adversely affect our financial results.
Joint interest receivables arise from our billing of entities who own partial interests in the wells we operate. These entities participate in our wells primarily based on their ownership in leased properties on which we drill. We have minimal control over deciding who participates in our wells.
Interest Rate Risks
Our primary exposure to interest rate risk results from outstanding borrowings under our Credit Facility and the Midstream Facility of our consolidated subsidiary, Antero Midstream. Each of these credit facilities has a floating interest rate. The average annualized interest rate incurred on this indebtedness during the three months ended March 31, 2017 was approximately 2.58%. We estimate that a 1.0% increase in each of the applicable average interest rates for the three months ended March 31, 2017 would have resulted in a $1.8 million increase in interest expense.
Item 4.Controls and Procedures.
Evaluation of Disclosure Controls and Procedures
As required by Rule 13a-15(b) under the Exchange Act, we have evaluated, under the supervision and with the participation of our management, including our principal executive officer and principal financial officer, the effectiveness of the design and operation of our disclosure controls and procedures (as defined in Rules 13a-15(e) and 15d-15(e) under the Exchange Act) as of the end of the period covered by this Quarterly Report on Form 10-Q. Our disclosure controls and procedures are designed to provide reasonable assurance that the information required to be disclosed by us in reports that we file or submit under the Exchange Act is accumulated and communicated to our management, including our principal executive officer and principal financial officer, as appropriate, to allow timely decisions regarding required disclosures and is recorded, processed, summarized, and reported within the time periods specified in the rules and forms of the SEC. Based upon that evaluation, our principal executive officer and principal financial officer concluded that our disclosure controls and procedures were effective as of March 31, 2017 at a level of reasonable assurance.
49
Changes in Internal Control Over Financial Reporting
There have been no changes in our internal control over financial reporting (as defined in Rules 13a-15(f) and 15d-15(f) under the Exchange Act) during the three months ended March 31, 2017 that have materially affected, or are reasonably likely to materially affect, our internal control over financial reporting.
50
In March 2011, we received orders for compliance from federal regulatory agencies, including the U.S. Environmental Protection Agency, relating to certain of our activities in West Virginia. The orders allege that certain of our operations at several well sites are in non-compliance with certain environmental regulations, such as unpermitted discharges of fill material into wetlands or waters of the United States that are potentially in violation of the Clean Water Act. We have responded to all pending orders and are actively cooperating with the relevant agencies. We believe that these actions will result in monetary sanctions exceeding $100,000. We have had ongoing settlement discussions with the relevant agencies to resolve the orders for compliance, but we are unable to estimate the total amount of monetary sanctions to resolve such orders or costs to remediate these locations in order to bring them into compliance with applicable environmental laws and regulations. We have not, however, been required to suspend our operations at these locations to date, and management does not expect these matters to have a material adverse effect on our financial condition, results of operations, or cash flows.
The Company is the plaintiff in two nearly identical lawsuits against South Jersey Gas Company and South Jersey Resources Group, LLC (collectively, “SJGC”) pending in United States District Court in Colorado. The Company filed suit against SJGC seeking relief for breach of contract and damages in the amounts that SJGC have short paid, and continue to short pay, the Company in connection with two long term gas contracts. Under those contracts, SJGC are long term purchasers of some of the Company’s natural gas production. Deliveries under the contracts began in October 2011 and the delivery obligation continues through October 2019. SJGC unilaterally breached the contracts claiming that the index prices specified in the contracts, and the index prices at which SJGC paid for deliveries from 2011 through September 2014, are no longer appropriate under the contracts because a market disruption event (as defined by the contract) has occurred and, as a result, a new index price is to be determined by the parties. Beginning in October 2014, SJGC began short paying the Company based on indexes unilaterally selected by SJGC and not the index specified in the contract. The Company contends that no market disruption event has occurred and that SJGC have breached the contracts by failing to pay the Company based on the express price terms of the contracts. Through March 31, 2017, the Company estimates that it is owed approximately $56 million more than SJGC have paid using the indexes unilaterally selected by them.
The Company and Washington Gas Light Company and WGL Midstream, Inc. (collectively, “WGL”) are also involved in a pricing dispute involving contracts that the Company began delivering gas under in January 2016. The Company has invoiced WGL at the index price specified in the contract and WGL has paid the Company based on that invoice price; however, WGL asserted that the index price was no longer appropriate under the contracts and that an undefined alternative index was more appropriate for the delivery point of the gas. In July 2016, the matter was referred to arbitration by the Colorado district court. In January 2017, the arbitration panel ruled in the Company’s favor. As a result, the index price has remained as specified in the contracts and there will be no adjustments to the invoices that have been paid by WGL. In March of 2017, WGL filed a second lawsuit against the Company in Colorado district court seeking relief for breach of contract and damages of more than $30 million, alleging that the Company breached its contractual obligations under two long term gas contracts by failing to deliver “TCO pool” gas. The Company has filed a motion to dismiss, and will continue to vigorously defend this lawsuit.
We are party to various other legal proceedings and claims in the ordinary course of our business. We believe that certain of these matters will be covered by insurance and that the outcome of other matters will not have a material adverse effect on our consolidated financial position, results of operations, or cash flows.
We are subject to certain risks and hazards due to the nature of the business activities we conduct. For a discussion of these risks, see “Item 1A. Risk Factors” in our 2016 Form 10-K. The risks described in our 2016 Form 10-K could materially and adversely affect our business, financial condition, cash flows, and results of operations. There have been no material changes to the risks described in our 2016 Form 10-K, except for the risks related to Antero Midstream’s investment in the Joint Venture, as described below. We may experience additional risks and uncertainties not currently known to us; or, as a result of developments occurring in the future, conditions that we currently deem to be immaterial may also materially and adversely affect our business, financial condition, cash flows, and results of operations.
51
Antero Midstream owns a 50% interest in the Joint Venture, which MarkWest operates. While Antero Midstream has the ability to influence certain business decisions affecting the Joint Venture, the success of its investment in the Joint Venture will depend on MarkWest’s operation of the Joint Venture.
On February 6, 2017, Antero Midstream entered into the Joint Venture with MarkWest. While Antero Midstream and MarkWest each own a 50% interest in the Joint Venture, MarkWest is the primary operator of the Joint Venture. Accordingly, Antero Midstream will depend on MarkWest for the day-to-day operations of the Joint Venture. Antero Midstream’s lack of control over the Joint Venture’s day-to-day operations and the associated costs of operations could result in Antero Midstream receiving lower cash distributions from the Joint Venture than currently anticipated, which could reduce its cash available for distribution to its unitholders, which include Antero. In addition, differences in views among the owners of the Joint Venture could result in delayed decisions or in failures to agree on significant matters, potentially adversely affecting the business and results of operations or prospects of the Joint Venture and, in turn, the amount of cash from the Joint Venture operations distributed to Antero Midstream.
If the Joint Venture is not successful or if the Joint Venture does not perform as expected, Antero Midstream’s future financial performance may be negatively impacted.
Antero Midstream may be exposed to certain risks in connection with its ownership interest in the Joint Venture, including regulatory, environmental and litigation risks. If such risks or other anticipated or unanticipated liabilities were to materialize, any desired benefits of Antero Midstream’s entry into the Joint Venture may not be fully realized, if at all, and its future financial performance may be negatively impacted.
In addition, the Joint Venture may result in other difficulties including, among other things:
|
· |
diversion of Antero’s and Antero Midstream’s management’s attention from other business concerns; |
|
· |
managing regulatory compliance and corporate governance matters; |
|
· |
an increase in Antero Midstream’s indebtedness; and |
|
· |
potential environmental or other regulatory compliance matters or liabilities and/or title issues, including certain liabilities arising from the operation of the Joint Venture assets prior to the closing of the Joint Venture. |
Item 2. Unregistered Sales of Equity Securities and Use of Proceeds.
Issuer Purchases of Equity Securities
The following table sets forth our share purchase activity for each period presented:
|
|
|
|
|
|
|
|
|
|
|
|
|
|
|
|
Period |
|
Total Number of Shares Purchased |
|
Average Price Paid Per Share |
|
Total Number of Shares Purchased as Part of Publicly Announced Plans |
|
Maximum Number of Shares that May Yet be Purchased Under the Plan |
|
||||
|
January 1, 2017 - January 31, 2017 |
|
|
5,639 |
|
$ |
25.62 |
|
|
— |
|
|
N/A |
|
|
February 1, 2017 - February 28, 2017 |
|
|
60,921 |
|
$ |
24.82 |
|
|
— |
|
|
N/A |
|
|
March 1, 2017 - March 31, 2017 |
|
|
— |
|
$ |
— |
|
|
— |
|
|
N/A |
|
Shares purchased represent shares of our common stock transferred to us in order to satisfy tax withholding obligations incurred upon the vesting of Antero equity awards held by our employees.
Disclosure pursuant to Section 13(r) of the Securities Exchange Act of 1934
Pursuant to Section 13(r) of the Securities Exchange Act of 1934, we, Antero Resources Corporation, may be required to disclose in our annual and quarterly reports to the Securities and Exchange Commission (the “SEC”), whether we or any of our “affiliates”
52
knowingly engaged in certain activities, transactions or dealings relating to Iran or with certain individuals or entities targeted by United State (“US”) economic sanctions. Disclosure is generally required even where the activities, transactions or dealings were conducted in compliance with applicable law. Because the SEC defines the term “affiliate” broadly, it includes any entity under common “control” with us (and the term “control” is also construed broadly by the SEC).
The description of the activities below has been provided to us by Warburg Pincus LLC (“WP”), affiliates of which: (i) beneficially own more than 10% of our outstanding common stock and/or are members of our board of directors, (ii) beneficially own more than 10% of the equity interests of, and have the right to designate members of the board of directors of Santander Asset Management Investment Holdings Limited (“SAMIH”). SAMIH may therefore be deemed to be under common “control” with us; however, this statement is not meant to be an admission that common control exists.
The disclosure below relates solely to activities conducted by SAMIH and its affiliates. The disclosure does not relate to any activities conducted by us or by WP and does not involve our or WP’s management. Neither we nor WP has had any involvement in or control over the disclosed activities, and neither we nor WP has independently verified or participated in the preparation of the disclosure. Neither we nor WP is representing as to the accuracy or completeness of the disclosure nor do we or WP undertake any obligation to correct or update it.
We understand that one or more SEC-reporting affiliates of SAMIH intends to disclose in its next annual or quarterly SEC report that:
(a)Santander UK plc (“Santander UK”) holds two savings accounts and one current account for two customers resident in the United Kingdom (“UK”) who are currently designated by the US under the Specially Designated Global Terrorist (“SDGT”) sanctions program. Revenues and profits generated by Santander UK on these accounts in the first quarter of calendar year (“CY”) 2017 were negligible relative to the overall revenues and profits of Banco Santander SA.
(b)Santander UK holds two frozen current accounts for two UK nationals who are designated by the US under the SDGT sanctions program. The accounts held by each customer have been frozen since their designation and have remained frozen through the first quarter of CY 2017. The accounts are in arrears (£1,844.73 in debit combined) and are currently being managed by Santander UK Collections & Recoveries department. No revenues or profits were generated by Santander UK on this account in the first quarter of CY 2017.
The exhibits required to be filed pursuant to the requirements of Item 601 of Regulation S-K are set forth in the Exhibit Index accompanying this Quarterly Report on Form 10-Q and are incorporated herein by reference.
53
Pursuant to the requirements of the Securities Exchange Act of 1934, the registrant has duly caused this report to be signed on its behalf by the undersigned thereunto duly authorized.
|
|
|
|
ANTERO RESOURCES CORPORATION |
|
|
|
|
|
By: |
/s/ GLEN C. WARREN, JR. |
|
|
Glen C. Warren, Jr. |
|
|
President, Chief Financial Officer and Secretary |
|
|
|
|
Date: |
May 8, 2017 |
54
EXHIBIT INDEX
|
Exhibit |
|
Description of Exhibit |
|
| 3.1 |
|
Amended and Restated Certificate of Incorporation of Antero Resources Corporation (incorporated by reference to Exhibit 3.1 to Current Report on Form 8-K (Commission File No. 001-36120) filed on October 17, 2013). |
|
| 3.2 |
|
Amended and Restated Bylaws of Antero Resources Corporation (incorporated by reference to Exhibit 3.2 to Current Report on Form 8-K (Commission File No. 001-36120) filed on October 17, 2013). |
|
|
31.1* |
|
Certification of the Company’s Chief Executive Officer Pursuant to Section 302 of the Sarbanes Oxley Act of 2002 (18 U.S.C. Section 7241). |
|
|
31.2* |
|
Certification of the Company’s Chief Financial Officer Pursuant to Section 302 of the Sarbanes Oxley Act of 2002 (18 U.S.C. Section 7241). |
|
|
32.1* |
|
Certification of the Company’s Chief Executive Officer Pursuant to Section 906 of the Sarbanes Oxley Act of 2002 (18 U.S.C. Section 1350). |
|
|
32.2* |
|
Certification of the Company’s Chief Financial Officer Pursuant to Section 906 of the Sarbanes Oxley Act of 2002 (18 U.S.C. Section 1350). |
|
|
101* |
|
The following financial information from this Quarterly Report on Form 10-Q of Antero Resources Corporation for the quarter ended March 31, 2017 formatted in XBRL (eXtensible Business Reporting Language): (i) Condensed Consolidated Balance Sheets, (ii) Condensed Consolidated Statements of Operations and Comprehensive Income (Loss), (iii) Condensed Consolidated Statements of Equity, (iv) Condensed Consolidated Statements of Cash Flows, and (v) Notes to the Condensed Consolidated Financial Statements, tagged as blocks of text. |
|
The exhibits marked with the asterisk symbol (*) are filed or furnished with this Quarterly Report on Form 10-Q.
55