Attached files
| file | filename |
|---|---|
| 8-K - FORM 8-K PRESENTATION AT ANNUAL SHAREHOLDER MEETING - Pathfinder Bancorp, Inc. | form8k.htm |
Item 9.01 Financial Statements and Exhibits
Exhibit 99 - Pathfinder Bancorp, Inc.'s Presentation to Shareholders

2017 Annual Meeting of Shareholders 10:00 A.M. | May 5th, 2017The American FoundryOswego, New York

Welcoming Remarks Chris R. BurrittChairman of the Board

Agenda – 2017 Annual Meeting of Shareholders Introduction of Directors, Management and GuestsConduct of the Meeting Notice and proxyReport of Inspector of ElectionsMeeting ProposalsVotingManagement Presentation and Q & A to FollowResults of Shareholder VoteMeeting Adjourned 3
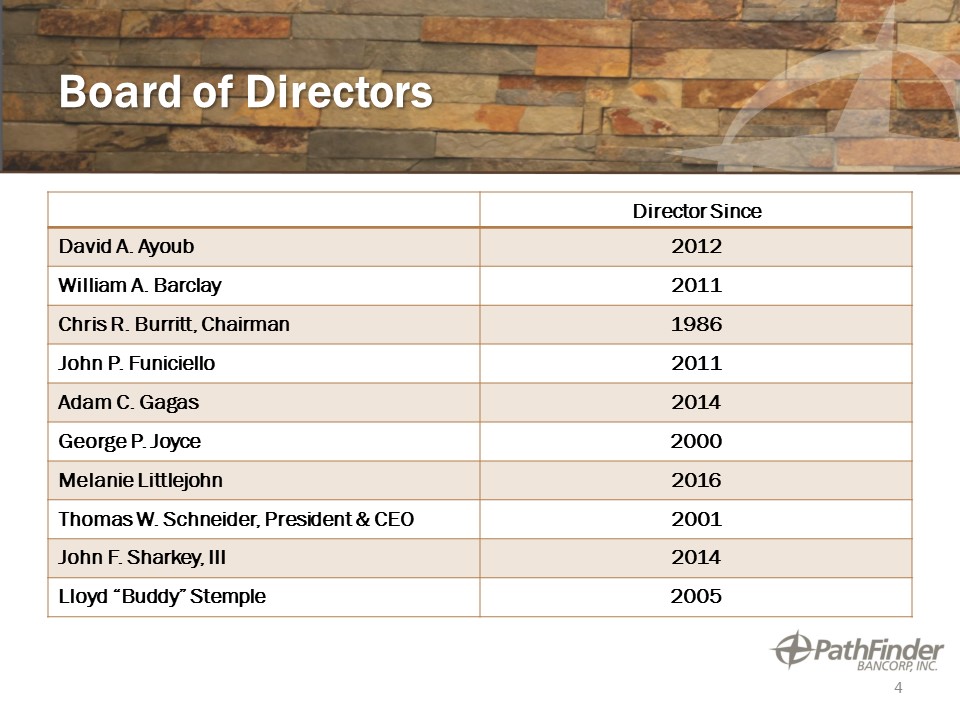
Board of Directors Director Since David A. Ayoub 2012 William A. Barclay 2011 Chris R. Burritt, Chairman 1986 John P. Funiciello 2011 Adam C. Gagas 2014 George P. Joyce 2000 Melanie Littlejohn 2016 Thomas W. Schneider, President & CEO 2001 John F. Sharkey, III 2014 Lloyd “Buddy” Stemple 2005 4
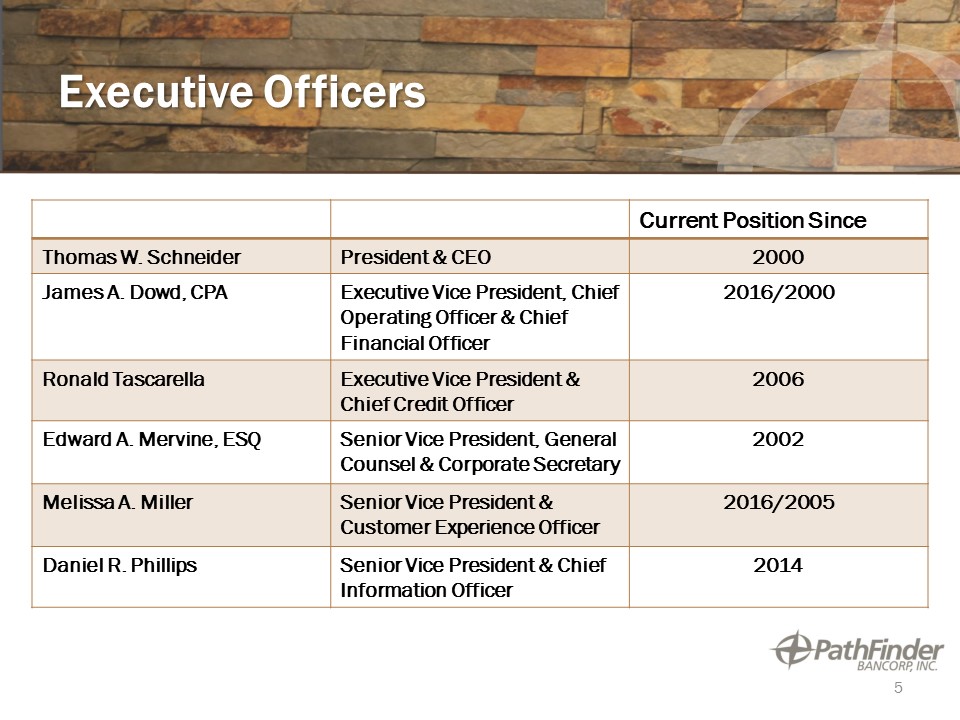
Executive Officers Current Position Since Thomas W. Schneider President & CEO 2000 James A. Dowd, CPA Executive Vice President, Chief Operating Officer & Chief Financial Officer 2016/2000 Ronald Tascarella Executive Vice President & Chief Credit Officer 2006 Edward A. Mervine, ESQ Senior Vice President, General Counsel & Corporate Secretary 2002 Melissa A. Miller Senior Vice President & Customer Experience Officer 2016/2005 Daniel R. Phillips Senior Vice President & Chief Information Officer 2014 5

Independent Registered Public Accounting Firm Jamie L. KeiserBonadio & Company, LLP

Business of 2017 Annual Meeting of Shareholders The Election of Three Directors William A. Barclay Chris R. Burritt George P. Joyce The ratification of the appointment of Bonadio & Co., LLP as independent registered public accounting firm for the year ending 12/31/17 7
Forward Looking Statement This discussion may contain the words or phrases “will likely result”, “are expected to”, “will continue”, “is anticipated”, “estimate”, ”project” or similar expression are intended to identify “forward-looking statements” within the meaning of the Private Securities Litigation Reform Act of 1995. Such statements are subject to certain risks and uncertainties. By identifying these forward-looking statements for you in this manner, the Company is alerting you to the possibility that its actual results and financial condition may differ, possibly materially, from the anticipated results and financial condition indicated in these forward-looking statements. Important factors that could cause the Company’s actual results and financial condition to differ from those indicated in the forward-looking statements include, among others: Credit quality and the effect of credit quality on the adequacy of our allowance for loan losses;Deterioration in financial markets that may result in impairment charges relating to our securities portfolio; Competition in our primary market areas; significant government regulations, legislation and potential changes thereto;A reduction in our ability to generate or originate revenue-producing assets as a result of compliance with heightened capital standards; Increased cost of operations due to greater regulatory oversight, supervision and examination of banks and bank holding companies, and higher deposit insurance premiums; The limitation on our ability to expand consumer product and service offerings due to anticipated stricter consumer protection laws and regulations; and other risks described herein and in the other reports and statements we file with the SEC.These risks and uncertainties should be considered in evaluating forward-looking statements and undue reliance should not be placed on such statements. The Company wishes to caution readers not to place undue reliance on any such forward-looking statements, which speak only as of the date made. The Company wishes to advise readers that the factors listed above could affect the Company’s financial performance and could cause the Company’s actual results for future periods to differ materially from any opinions or statements expressed with respect to future periods in any current statements. Additionally, all statements in this document, including forward-looking statements, speak only as of the date they are made, and the Company undertakes no obligation to update any statement in light of new information or future events. 8
Executive Management Presentation James A. Dowd, CPA, Executive Vice President, Chief Operating Officer & Chief Financial OfficerThomas W. Schneider, President and Chief Executive OfficerRonald Tascarella, Executive Vice President and Chief Credit Officer
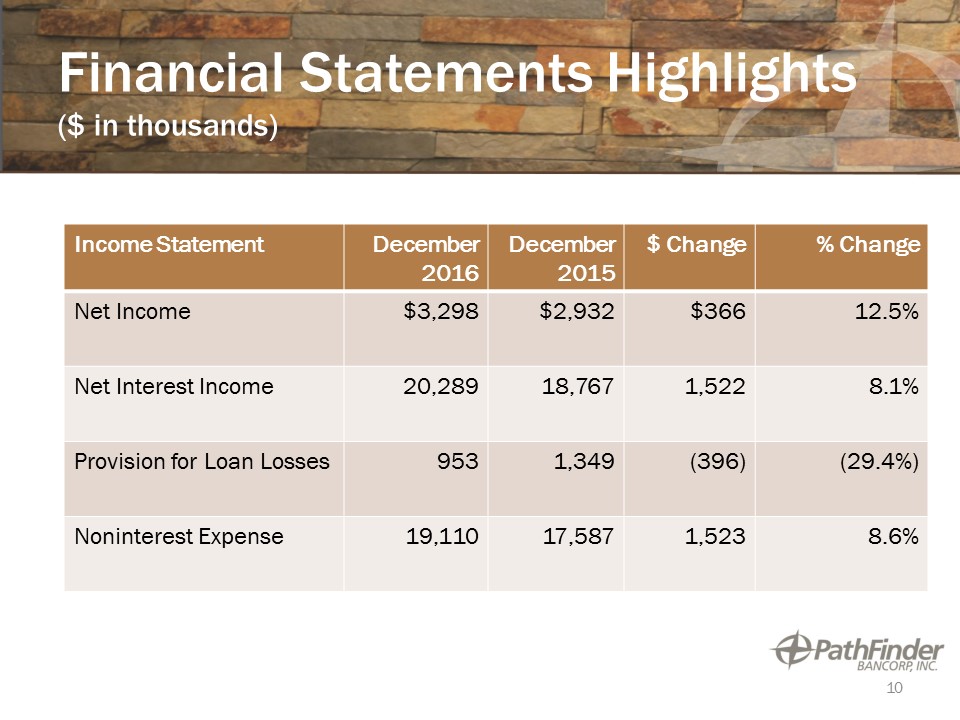
Financial Statements Highlights($ in thousands) Income Statement December 2016 December2015 $ Change % Change Net Income $3,298 $2,932 $366 12.5% Net Interest Income 20,289 18,767 1,522 8.1% Provision for Loan Losses 953 1,349 (396) (29.4%) Noninterest Expense 19,110 17,587 1,523 8.6% 10
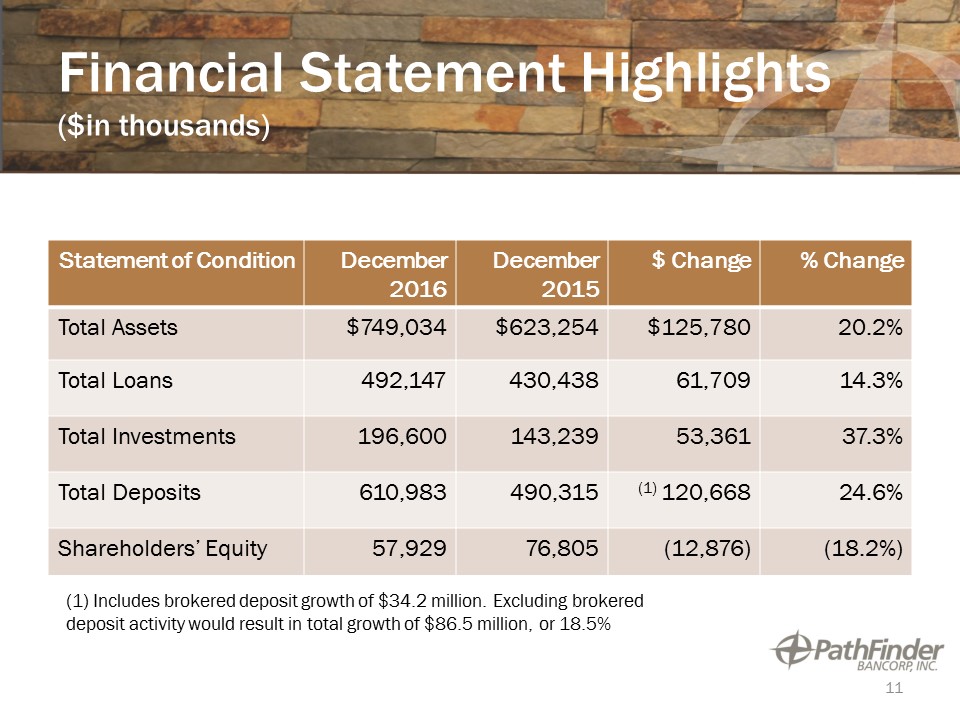
Financial Statement Highlights($in thousands) Statement of Condition December 2016 December 2015 $ Change % Change Total Assets $749,034 $623,254 $125,780 20.2% Total Loans 492,147 430,438 61,709 14.3% Total Investments 196,600 143,239 53,361 37.3% Total Deposits 610,983 490,315 (1) 120,668 24.6% Shareholders’ Equity 57,929 76,805 (12,876) (18.2%) 11 (1) Includes brokered deposit growth of $34.2 million. Excluding brokered deposit activity would result in total growth of $86.5 million, or 18.5%
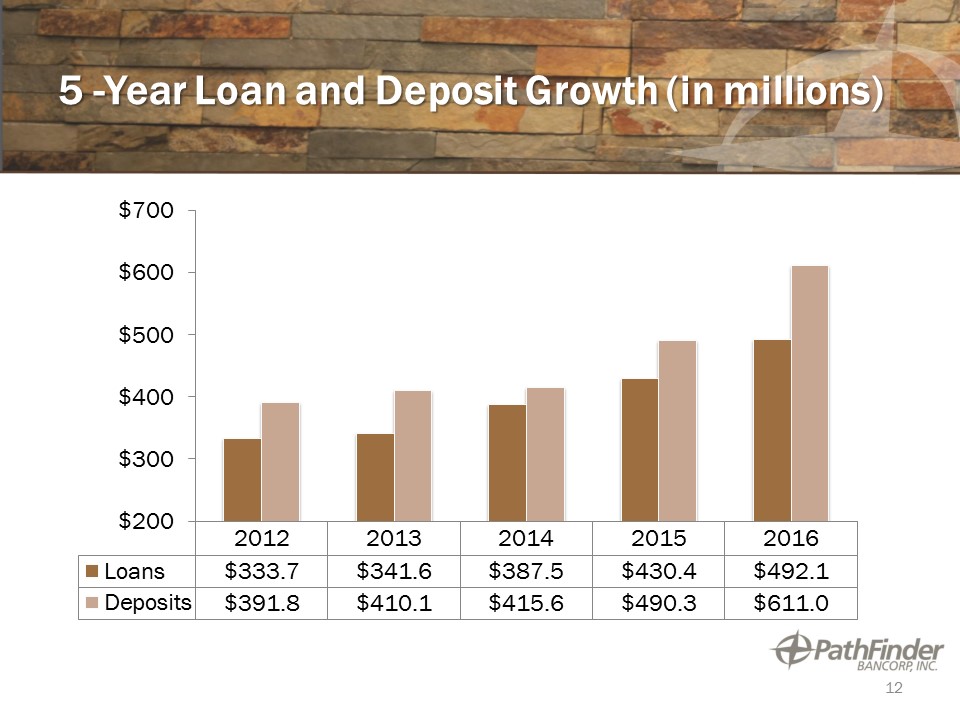
5 -Year Loan and Deposit Growth (in millions) 12
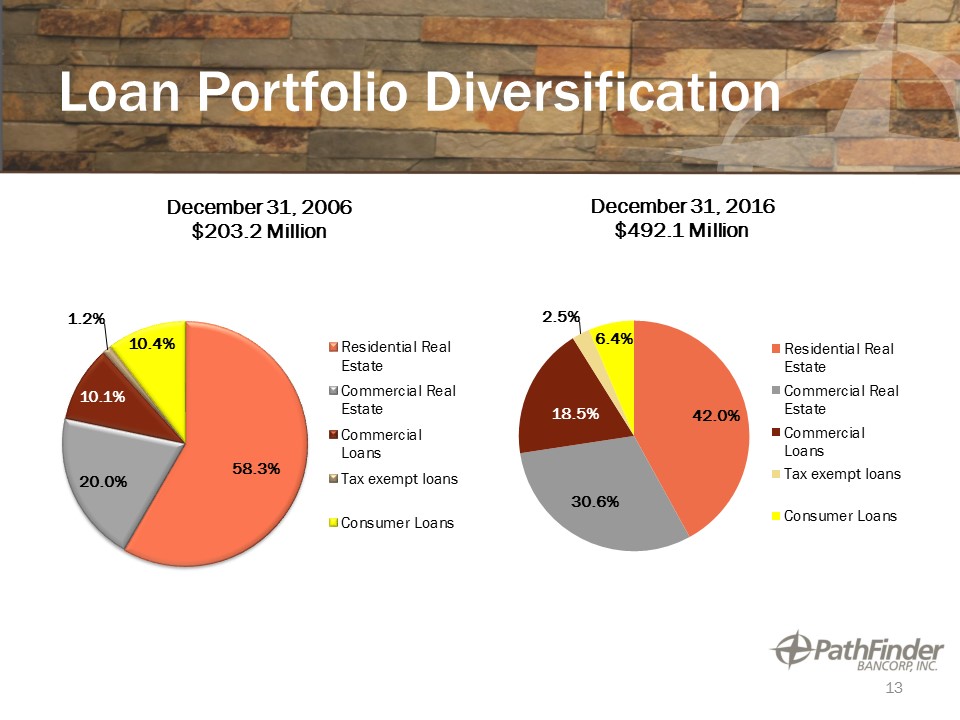
Loan Portfolio Diversification 13
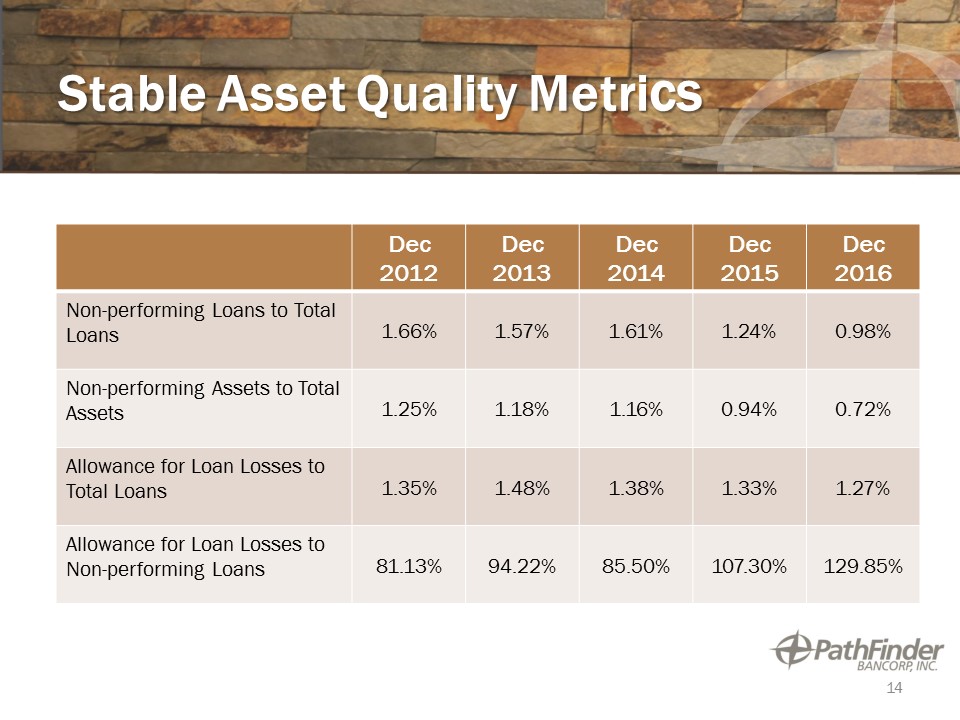
Stable Asset Quality Metrics Dec 2012 Dec 2013 Dec 2014 Dec 2015 Dec 2016 Non-performing Loans to Total Loans 1.66% 1.57% 1.61% 1.24% 0.98% Non-performing Assets to Total Assets 1.25% 1.18% 1.16% 0.94% 0.72% Allowance for Loan Losses to Total Loans 1.35% 1.48% 1.38% 1.33% 1.27% Allowance for Loan Losses to Non-performing Loans 81.13% 94.22% 85.50% 107.30% 129.85% 14
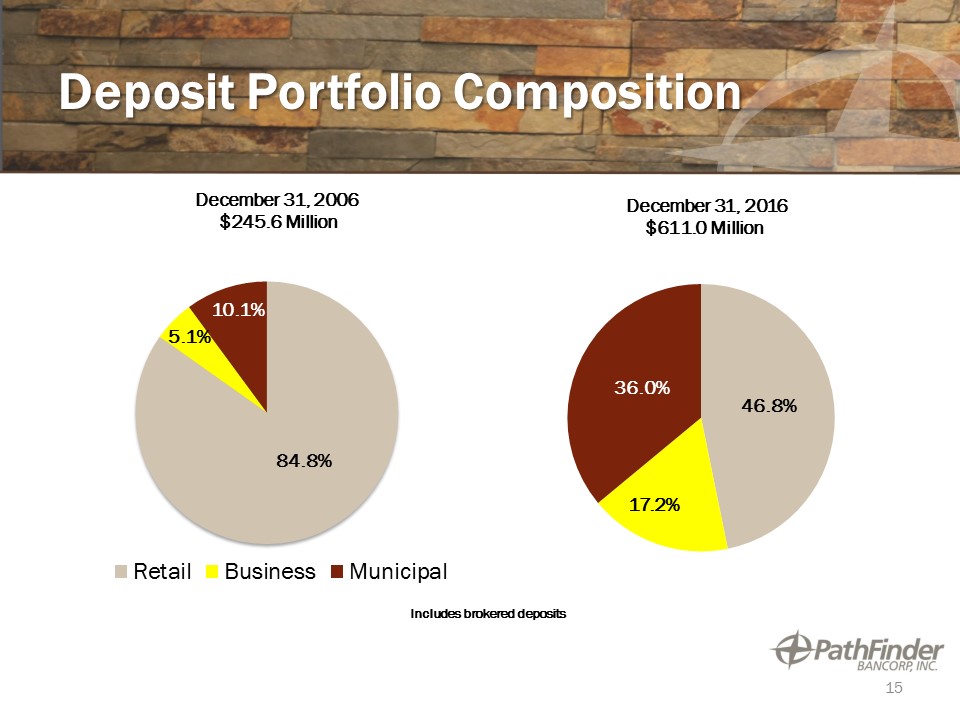
Deposit Portfolio Composition December 31, 2006 $245.6 Million December 31, 2016$611.0 Million Includes brokered deposits 15
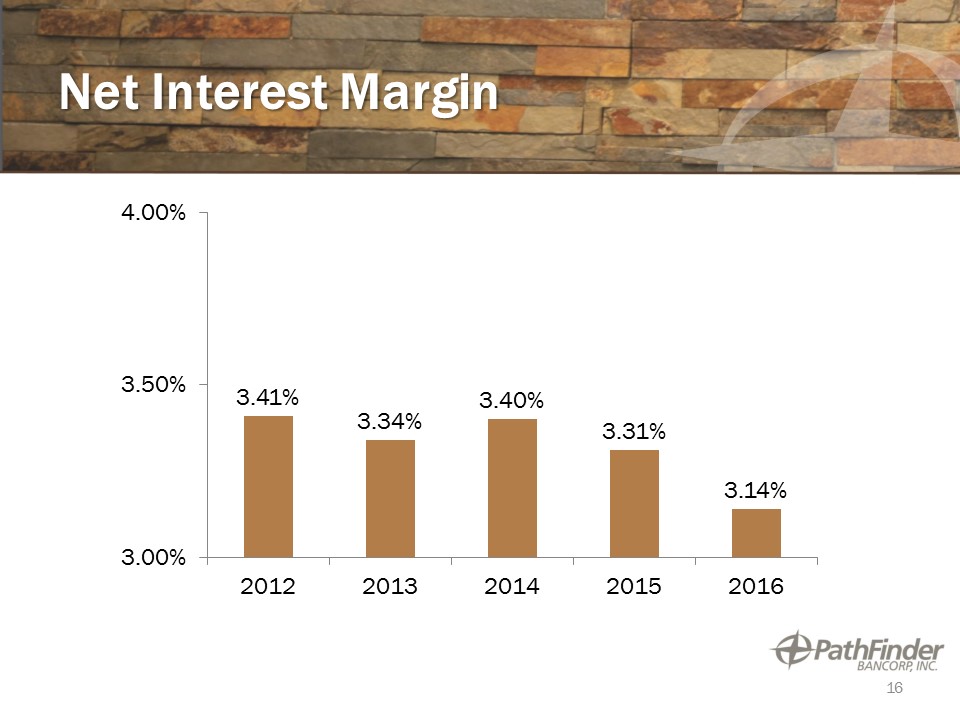
Net Interest Margin 16
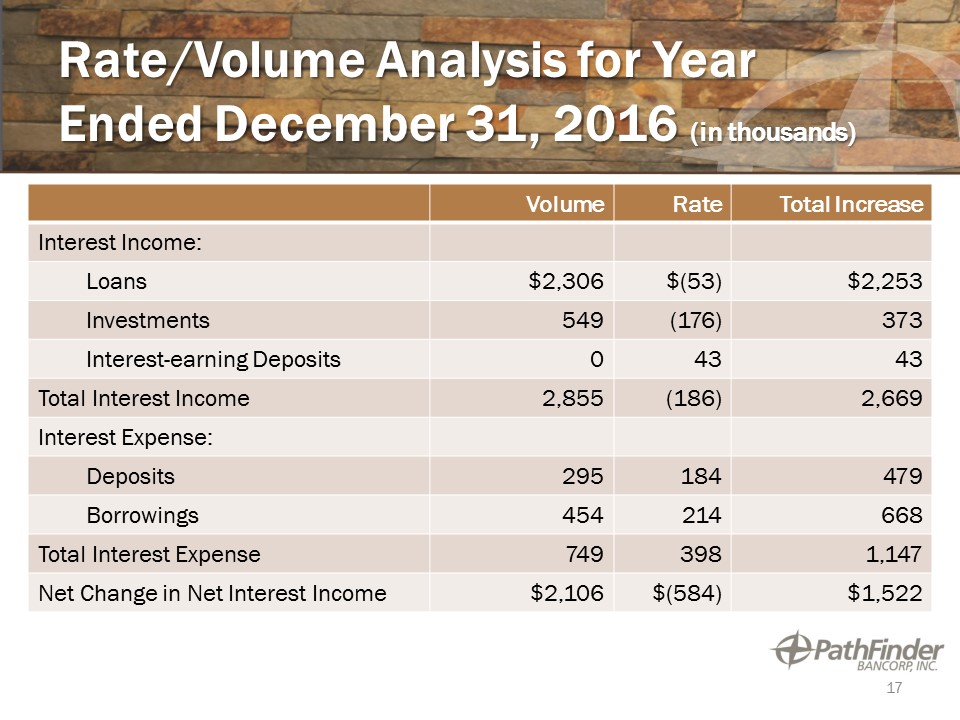
Rate/Volume Analysis for Year Ended December 31, 2016 (in thousands) Volume Rate Total Increase Interest Income: Loans $2,306 $(53) $2,253 Investments 549 (176) 373 Interest-earning Deposits 0 43 43 Total Interest Income 2,855 (186) 2,669 Interest Expense: Deposits 295 184 479 Borrowings 454 214 668 Total Interest Expense 749 398 1,147 Net Change in Net Interest Income $2,106 $(584) $1,522 17
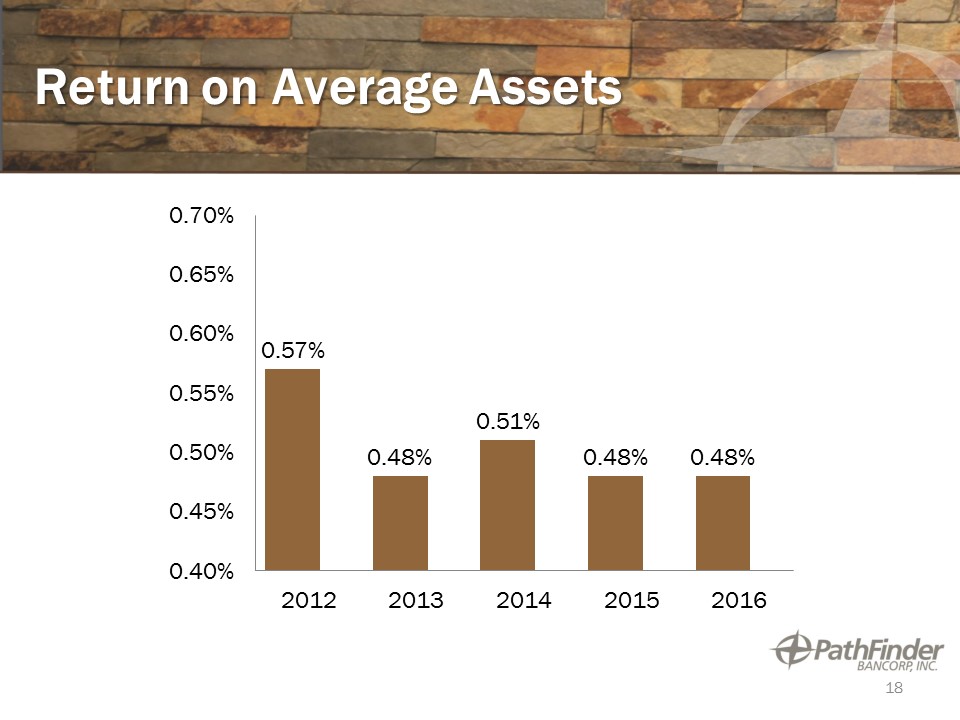
Return on Average Assets 18
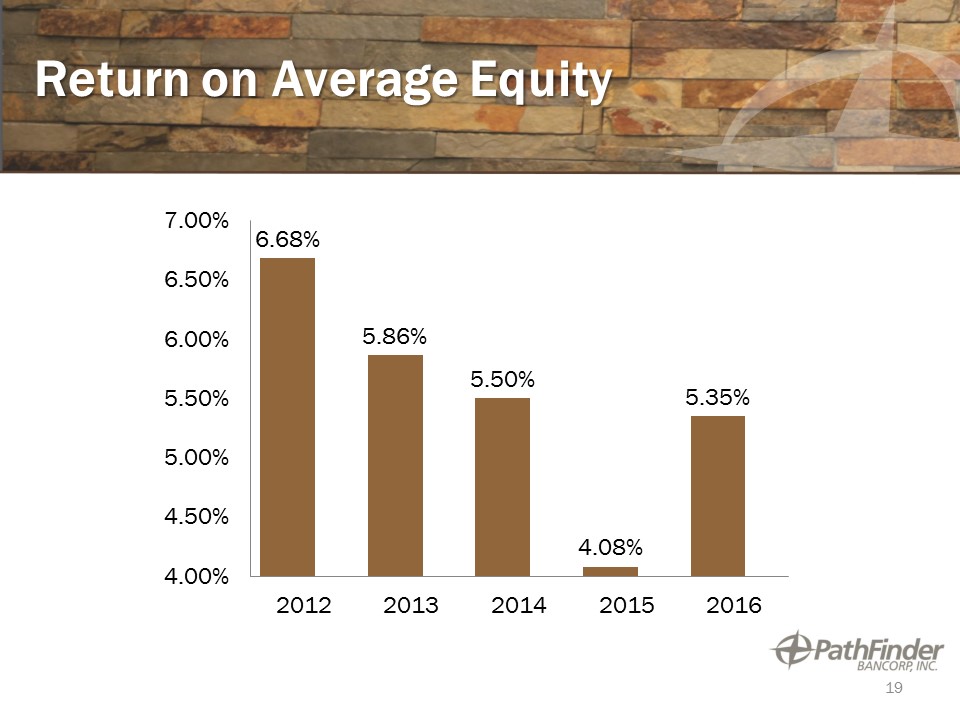
Return on Average Equity 19
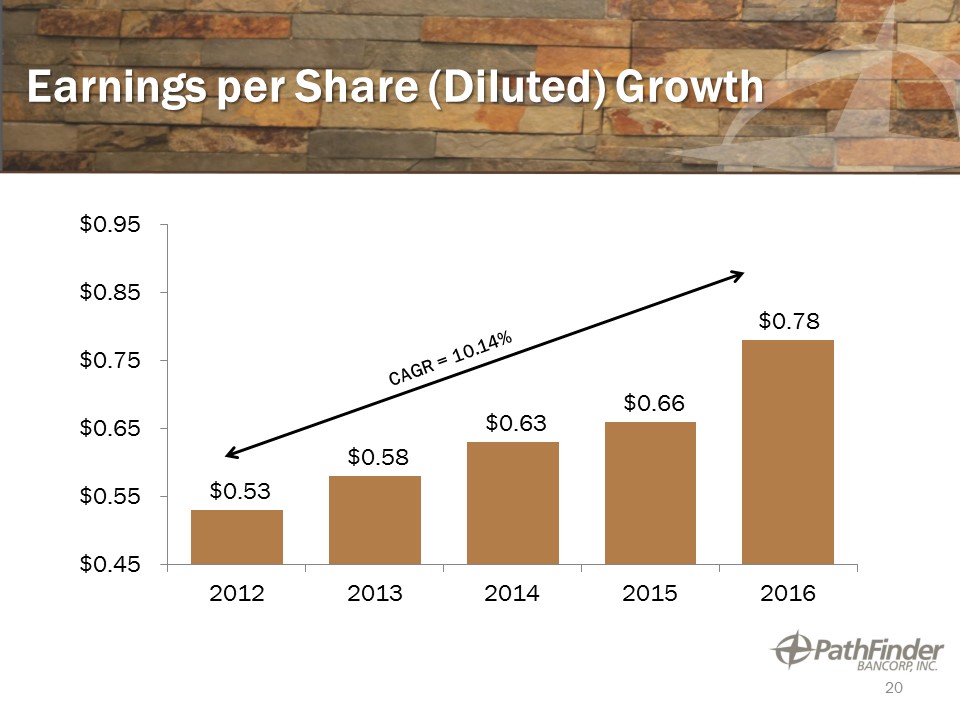
Earnings per Share (Diluted) Growth 20
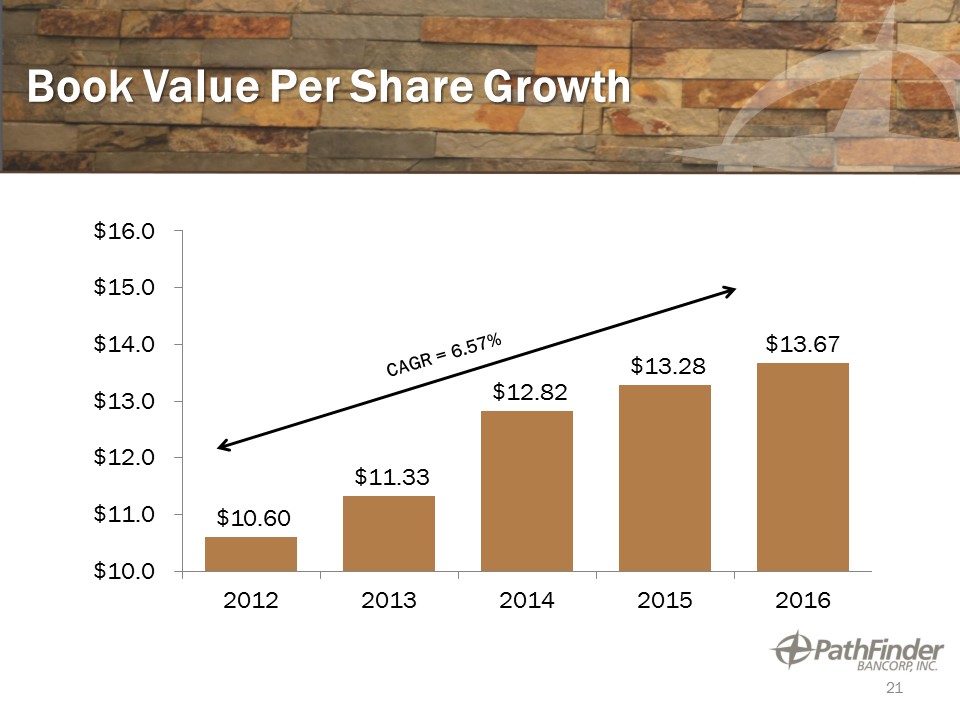
Book Value Per Share Growth 21
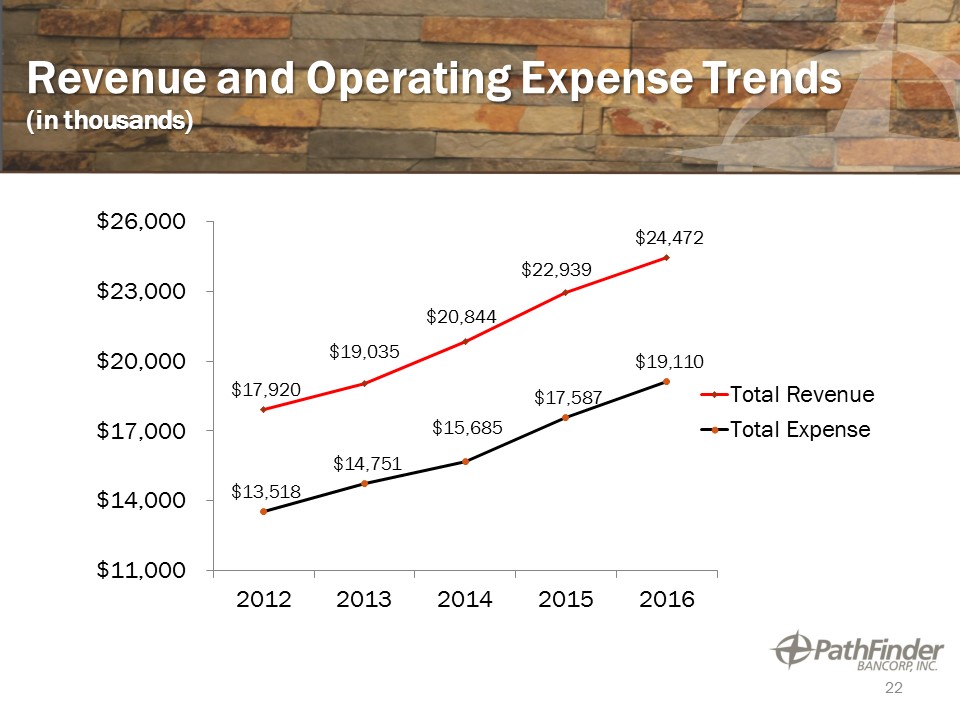
Revenue and Operating Expense Trends(in thousands) 22
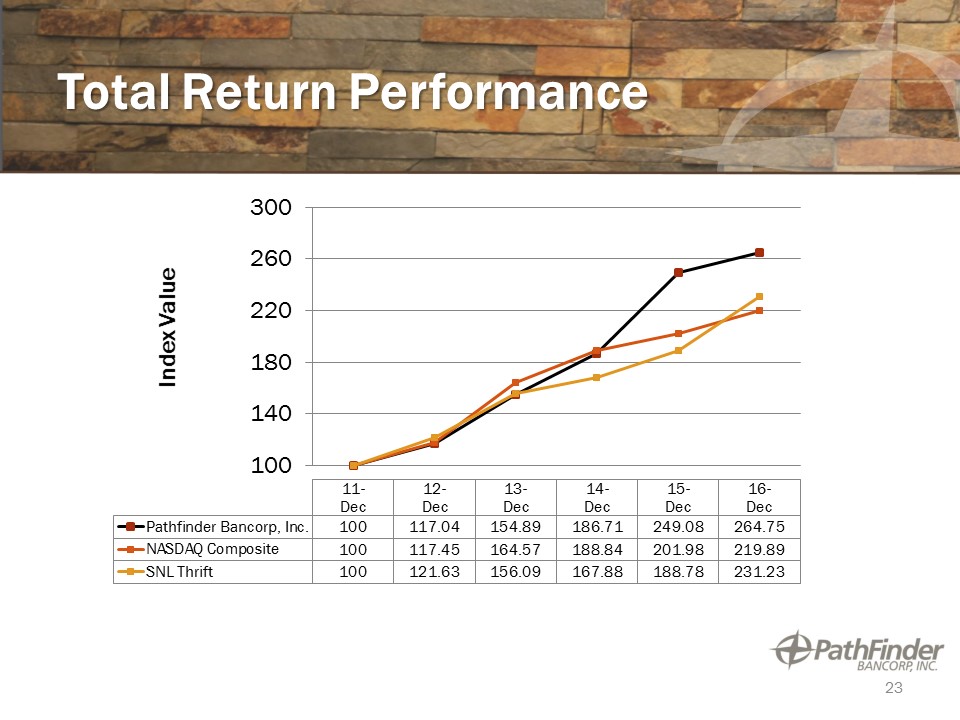
Total Return Performance 23
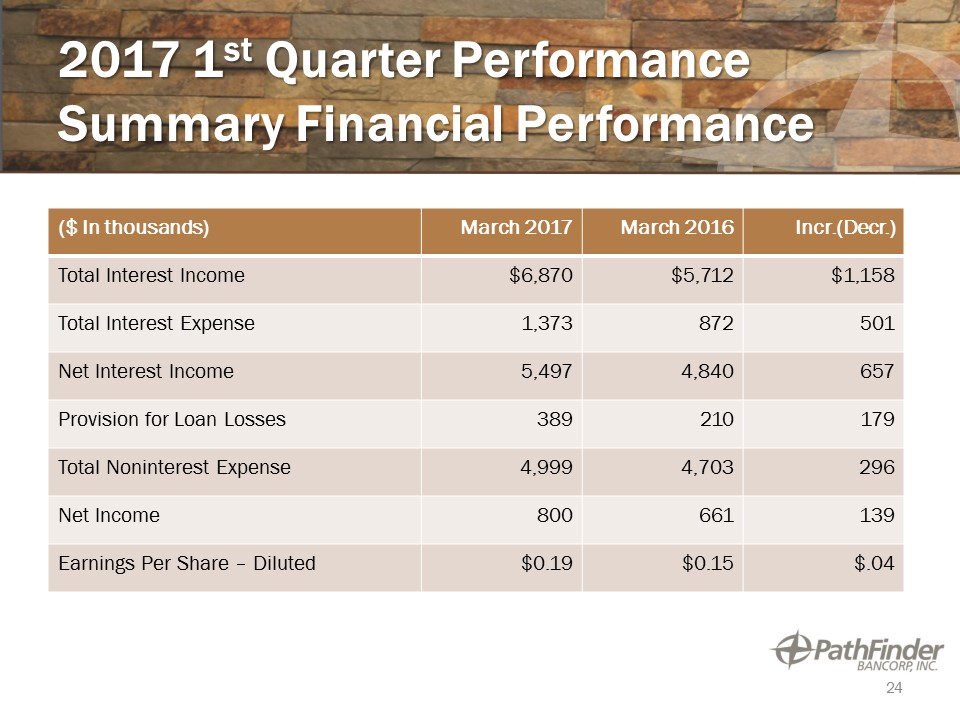
2017 1st Quarter PerformanceSummary Financial Performance ($ In thousands) March 2017 March 2016 Incr.(Decr.) Total Interest Income $6,870 $5,712 $1,158 Total Interest Expense 1,373 872 501 Net Interest Income 5,497 4,840 657 Provision for Loan Losses 389 210 179 Total Noninterest Expense 4,999 4,703 296 Net Income 800 661 139 Earnings Per Share – Diluted $0.19 $0.15 $.04 24
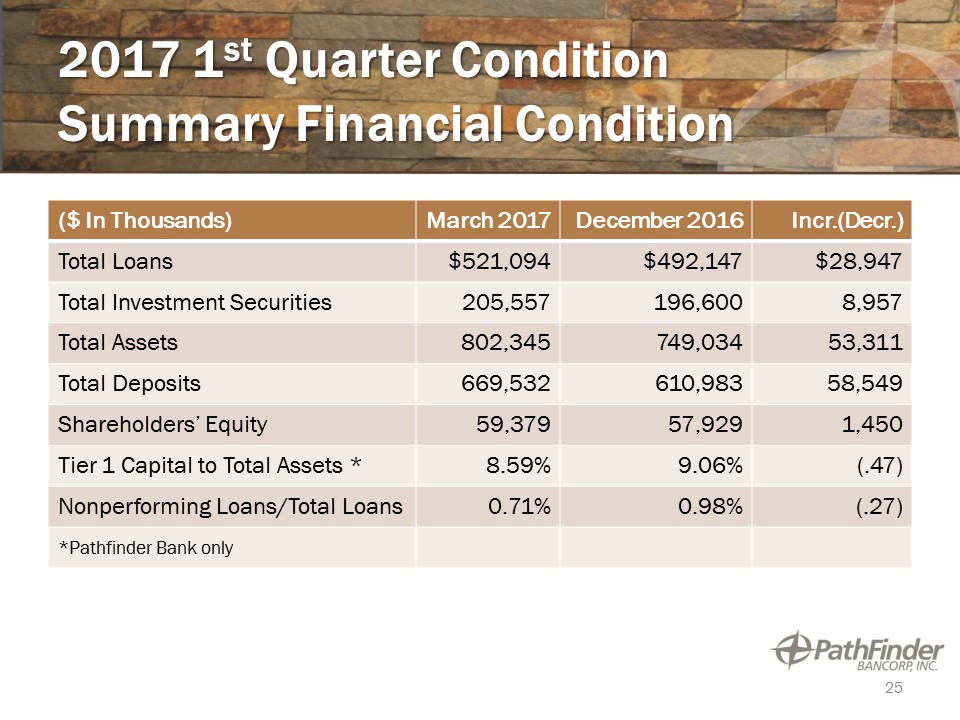
2017 1st Quarter ConditionSummary Financial Condition ($ In Thousands) March 2017 December 2016 Incr.(Decr.) Total Loans $521,094 $492,147 $28,947 Total Investment Securities 205,557 196,600 8,957 Total Assets 802,345 749,034 53,311 Total Deposits 669,532 610,983 58,549 Shareholders’ Equity 59,379 57,929 1,450 Tier 1 Capital to Total Assets * 8.59% 9.06% (.47) Nonperforming Loans/Total Loans 0.71% 0.98% (.27) *Pathfinder Bank only 25

Executive Management Presentation Thomas W. Schneider, President & Chief Executive Officer

PURPOSEVISIONSTRATEGY 27
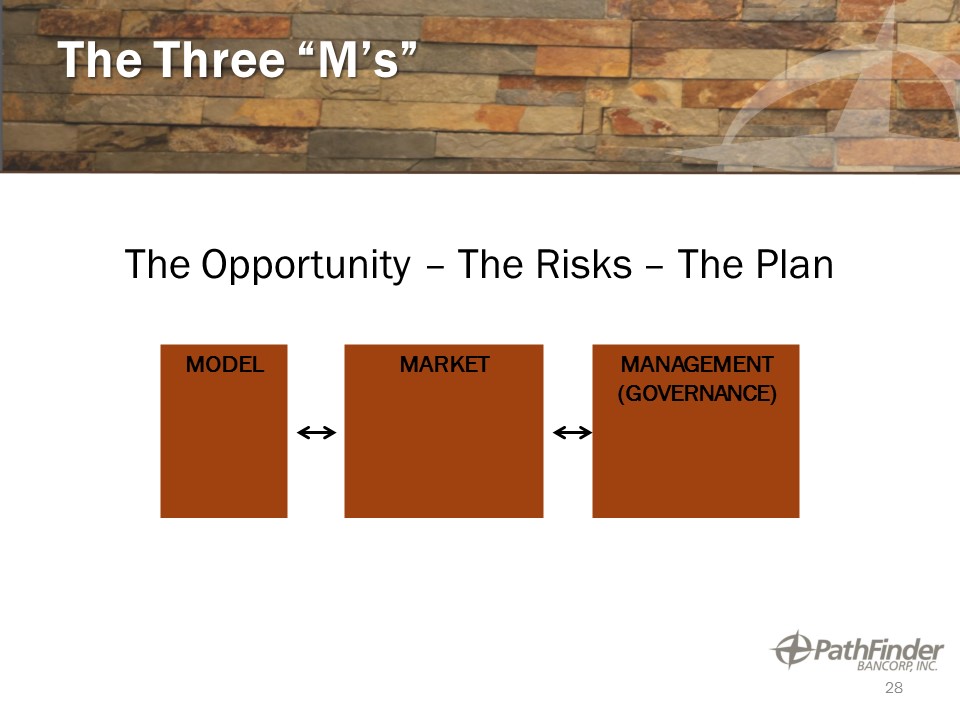
The Three “M’s” The Opportunity – The Risks – The Plan 28 MODEL MARKET MANAGEMENT(GOVERNANCE)
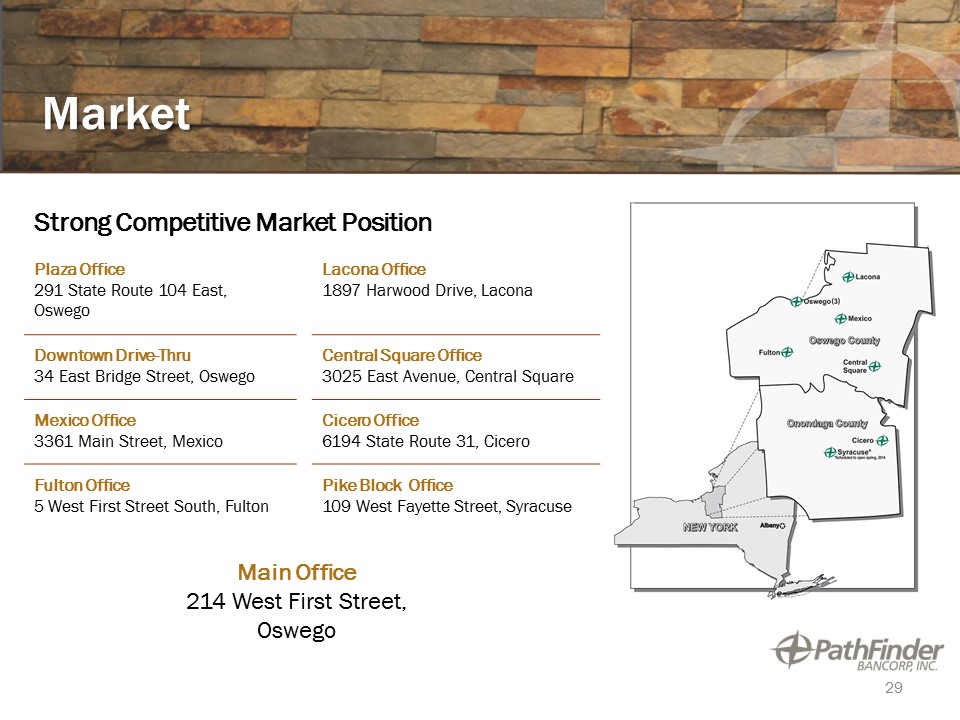
Market Strong Competitive Market Position Plaza Office291 State Route 104 East, Oswego Downtown Drive-Thru34 East Bridge Street, Oswego Mexico Office3361 Main Street, Mexico Fulton Office5 West First Street South, Fulton Lacona Office1897 Harwood Drive, Lacona Central Square Office3025 East Avenue, Central Square Cicero Office6194 State Route 31, Cicero Pike Block Office109 West Fayette Street, Syracuse Main Office214 West First Street, Oswego 29
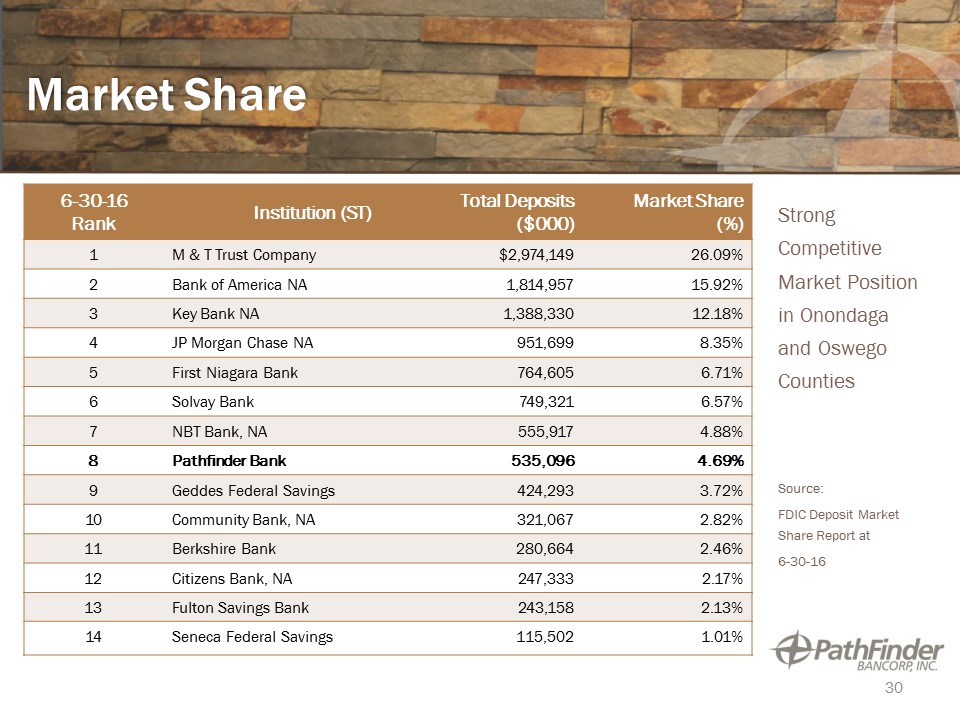
Market Share Strong Competitive Market Position in Onondaga and Oswego Counties 6-30-16 Rank Institution (ST) Total Deposits ($000) Market Share (%) 1 M & T Trust Company $2,974,149 26.09% 2 Bank of America NA 1,814,957 15.92% 3 Key Bank NA 1,388,330 12.18% 4 JP Morgan Chase NA 951,699 8.35% 5 First Niagara Bank 764,605 6.71% 6 Solvay Bank 749,321 6.57% 7 NBT Bank, NA 555,917 4.88% 8 Pathfinder Bank 535,096 4.69% 9 Geddes Federal Savings 424,293 3.72% 10 Community Bank, NA 321,067 2.82% 11 Berkshire Bank 280,664 2.46% 12 Citizens Bank, NA 247,333 2.17% 13 Fulton Savings Bank 243,158 2.13% 14 Seneca Federal Savings 115,502 1.01% 30 Source:FDIC Deposit Market Share Report at 6-30-16
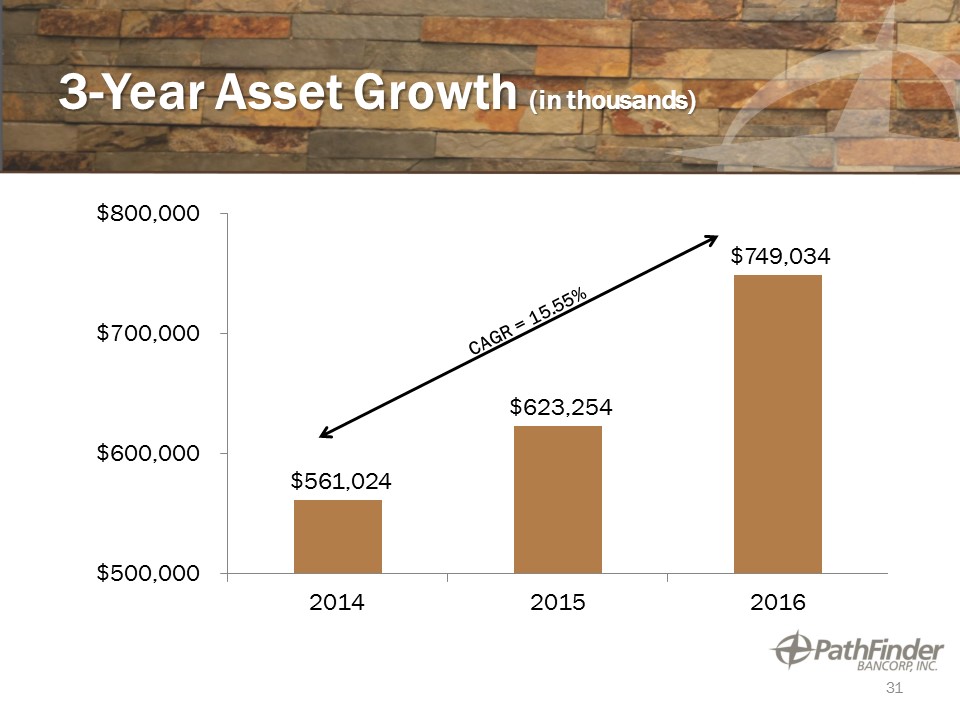
3-Year Asset Growth (in thousands) 31
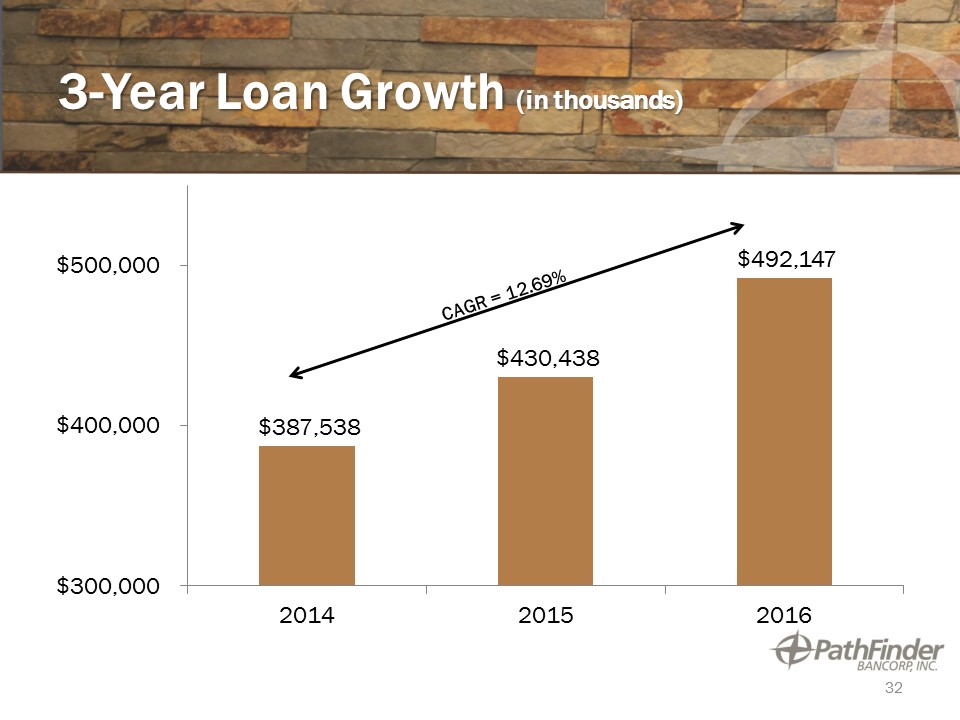
3-Year Loan Growth (in thousands) 32
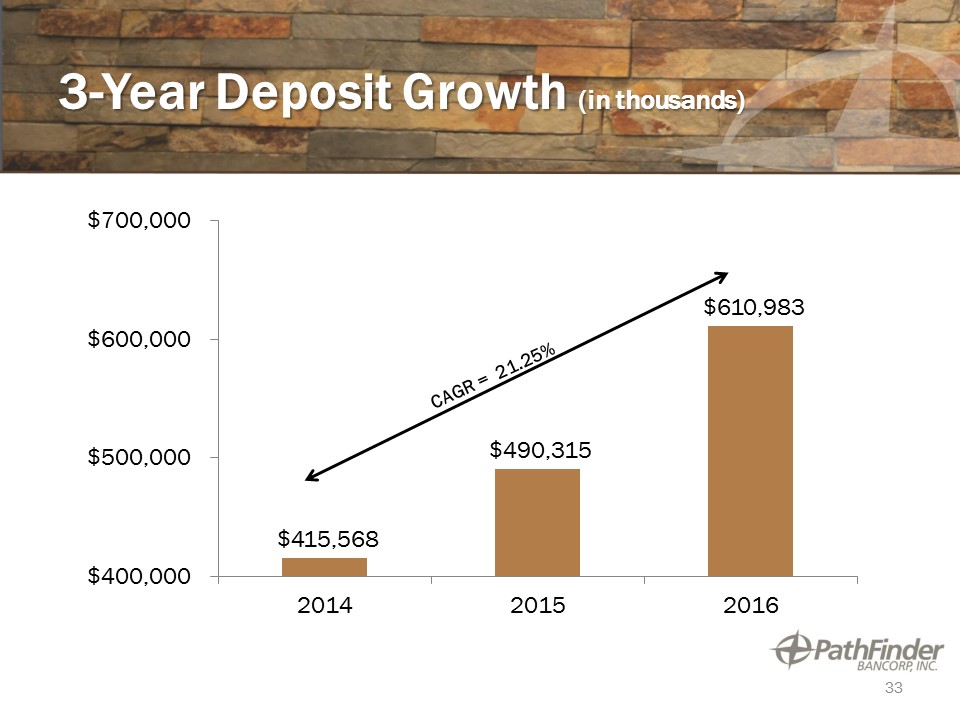
3-Year Deposit Growth (in thousands) 33
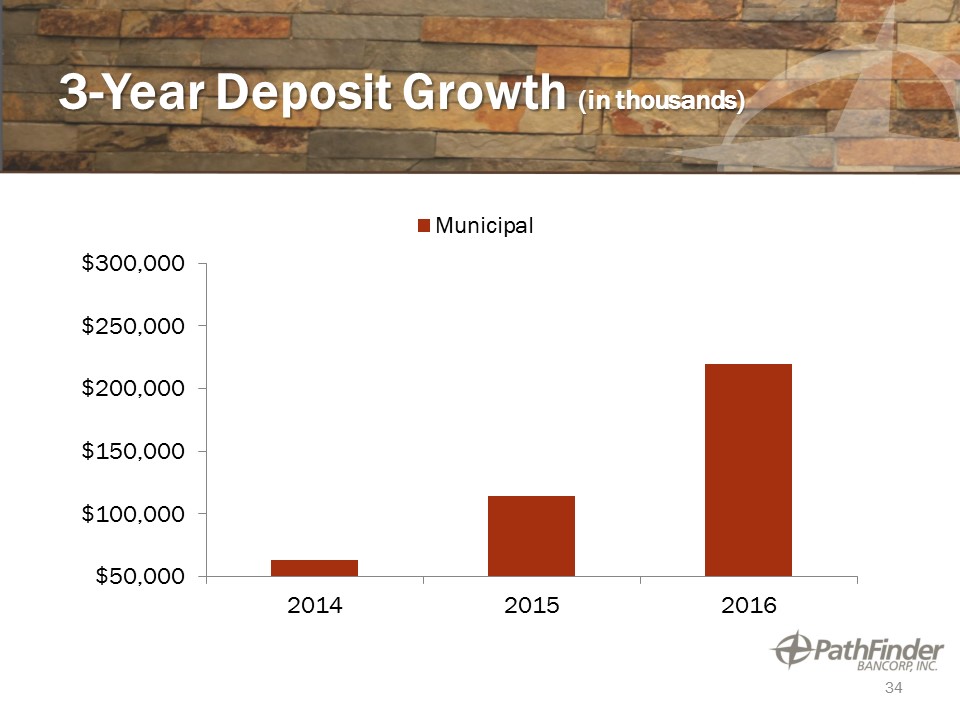
3-Year Deposit Growth (in thousands) 34
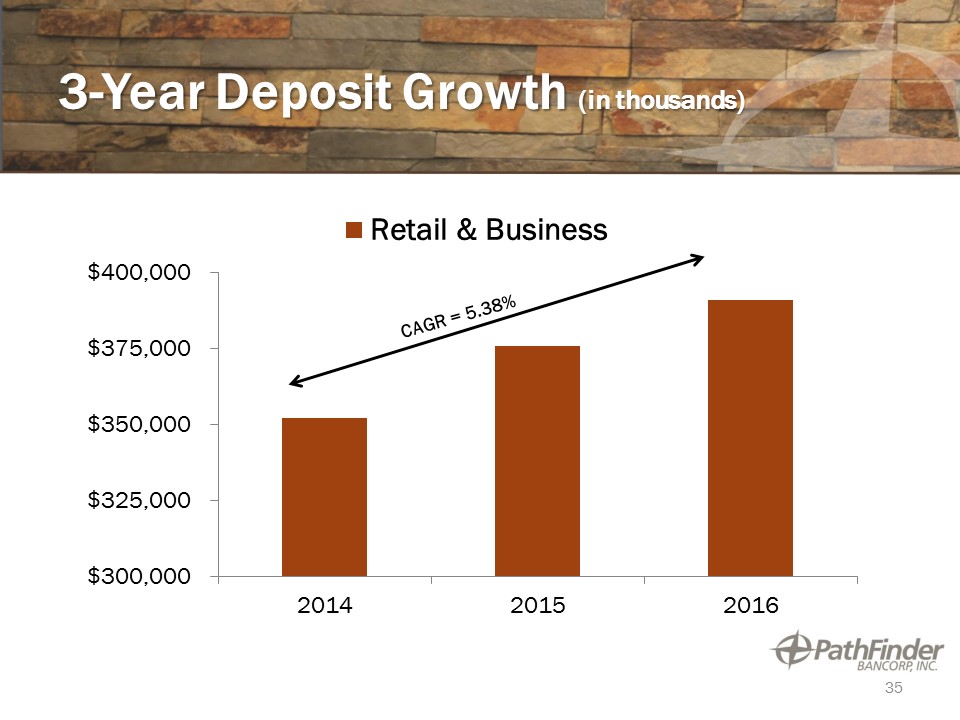
3-Year Deposit Growth (in thousands) 35
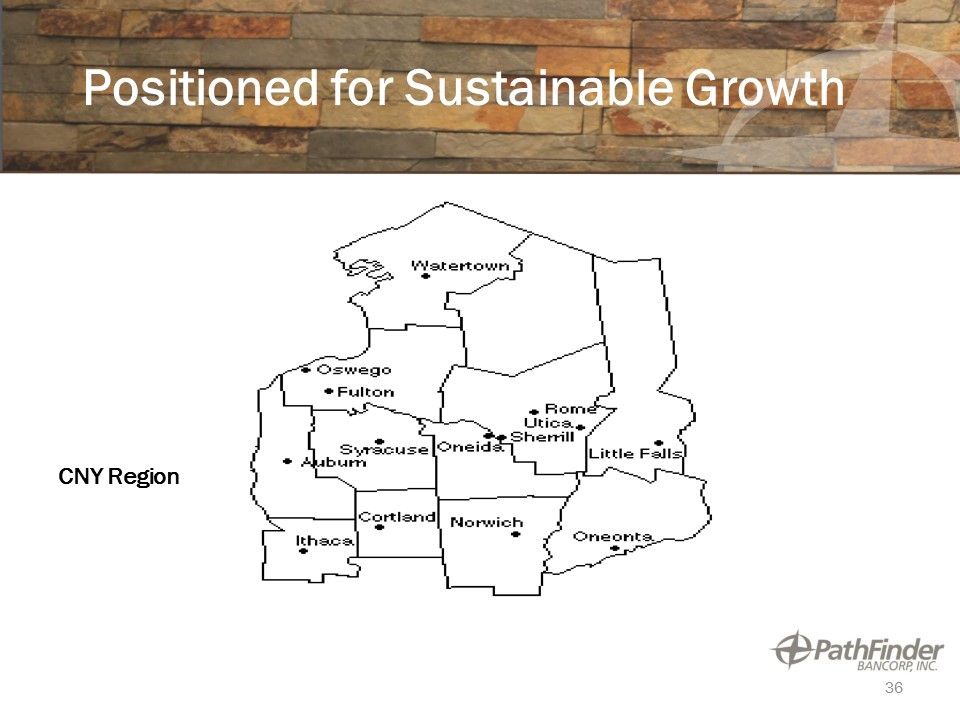
36 Positioned for Sustainable Growth CNY Region
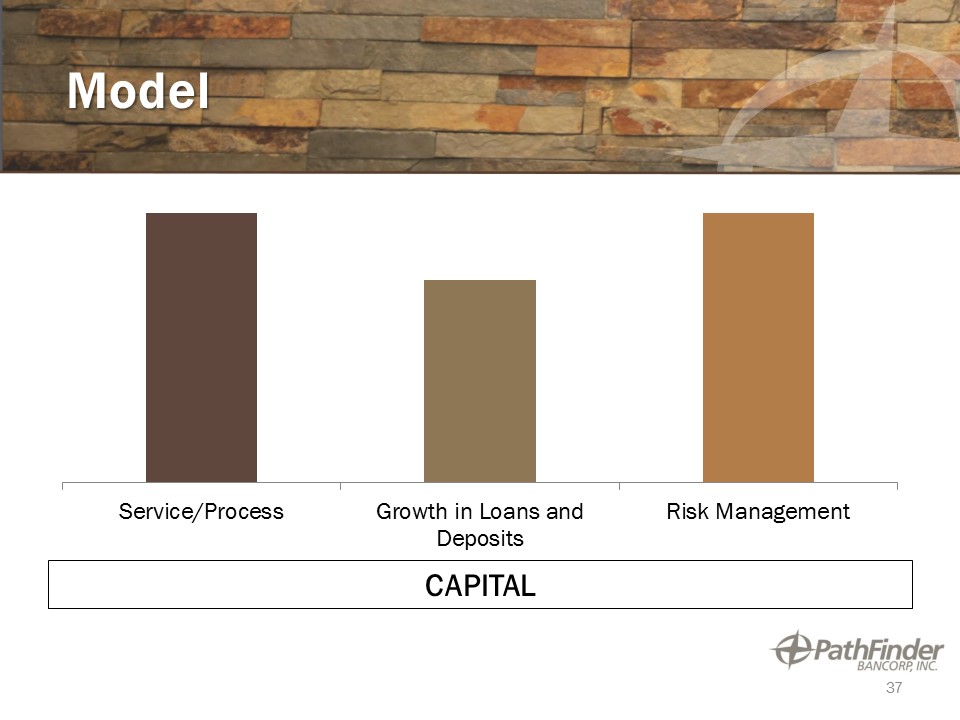
Model CAPITAL 37

Total Return Performance 38
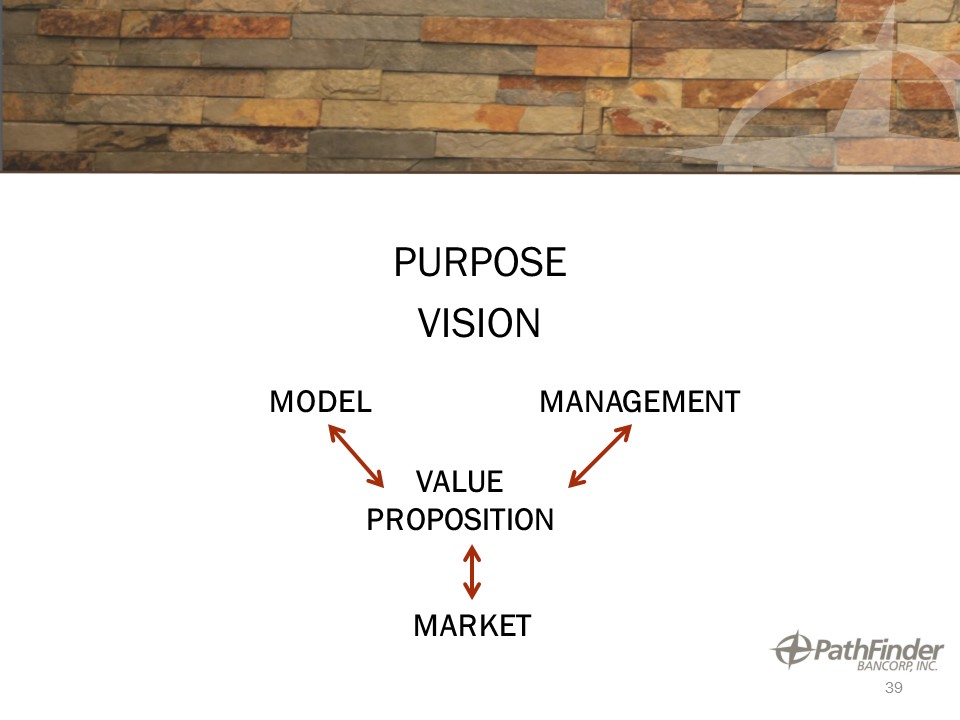
PURPOSEVISION 39 MODEL MANAGEMENT VALUE PROPOSITION MARKET
BUILDING TRUST BUILDING VALUECustomersCommunityEmployeesShareholdersLOCAL. COMMUNITY. TRUST. 40

Questions and Discussion 41
Executive Management Presentation Ronald Tascarella, Executive Vice President and Chief Credit Officer

43

Voting ResultsChris R. Burritt - ChairmanInspector of Elections Report – Edward Mervine 44

2017 Annual Meeting of Shareholders Meeting AdjournedThank You for Attending 45