Attached files
| file | filename |
|---|---|
| EX-32.1 - EXHIBIT 32.1 - LendingClub Corp | lc-3312017xex321.htm |
| EX-31.2 - EXHIBIT 31.2 - LendingClub Corp | lc-3312017xex312.htm |
| EX-31.1 - EXHIBIT 31.1 - LendingClub Corp | lc-3312017xex311.htm |
UNITED STATES
SECURITIES AND EXCHANGE COMMISSION
Washington, D.C. 20549
FORM 10-Q |
x | QUARTERLY REPORT PURSUANT TO SECTION 13 OR 15(d) OF THE SECURITIES EXCHANGE ACT OF 1934 |
For the quarterly period ended March 31, 2017
Commission File Number: 001-36771
LendingClub Corporation (Exact name of registrant as specified in its charter) |
Delaware | 51-0605731 |
(State or other jurisdiction of incorporation or organization) | (I.R.S. Employer Identification No.) |
71 Stevenson Street, Suite 300, San Francisco, CA 94105 | |
(Address of principal executive offices and zip code) | |
Registrant's telephone number, including area code: (415) 632-5600
Indicate by check mark whether the registrant (1) has filed all reports required to be filed by Section 13 or 15(d) of the Securities Exchange Act of 1934 during the preceding 12 months (or for such shorter period that the registrant was required to file such reports), and (2) has been subject to such filing requirements for the past 90 days. Yes x No ¨
Indicate by check mark whether the registrant has submitted electronically and posted on its corporate Web site, if any, every Interactive Data File required to be submitted and posted pursuant to Rule 405 of Regulation S-T (§232.405 of this chapter) during the preceding 12 months (or for such shorter period that the registrant was required to submit and post such files). Yes x No ¨
Indicate by check mark whether the registrant is a large accelerated filer, an accelerated filer, a non-accelerated filer, a smaller reporting company, or an emerging growth company. See the definitions of “large accelerated filer,” “accelerated filer”, “smaller reporting company”, and "emerging growth company" in Rule 12b-2 of the Exchange Act. (Check one):
Large accelerated filer | x | Accelerated filer | ¨ | |
Non-accelerated filer | ¨ (Do not check if a smaller reporting company) | Smaller reporting company | ¨ | |
Emerging growth company | ¨ | |||
If an emerging growth company, indicate by check mark if the registrant has elected not to use the extended transition period for complying with any new or revised financial accounting standards provided pursuant to Section 13(a) of the Exchange Act | ¨ | |||
Indicate by check mark whether the registrant is a shell company (as defined in Rule 12b-2 of the Exchange Act). Yes ¨ No x
As of April 28, 2017, there were 403,859,898 shares of the registrant’s common stock outstanding.
LENDINGCLUB CORPORATION
TABLE OF CONTENTS
LENDINGCLUB CORPORATION
Except as the context requires otherwise, as used herein, “Lending Club,” “Company,” “we,” “us,” and “our,” refer to LendingClub Corporation, a Delaware corporation, and, where appropriate, its subsidiaries:
• | LC Advisors, LLC and its wholly-owned subsidiaries (LCA), a wholly-owned registered investment advisor with the Securities and Exchange Commission (SEC) that acts as the general partner for certain private funds and as advisor to separately managed accounts. |
• | Springstone Financial, LLC (Springstone), a wholly-owned company that facilitates education and patient finance loans. |
LC Trust I (the Trust) is an independent Delaware business trust that acquires loans from the Company and holds them for the sole benefit of certain investors that have purchased a trust certificate (Certificate) issued by the Trust and that are related to specific underlying loans for the benefit of the investor.
Forward-Looking Statements
This report contains forward-looking statements within the meaning of Section 27A of the Securities Act of 1933 and Section 21E of the Securities Exchange Act of 1934. All statements, other than statements of historical facts, included in this Quarterly Report on Form 10-Q (Report) regarding borrowers, credit scoring, our strategy, future operations, expected losses, future financial position, future revenue, projected costs, prospects, plans, objectives of management and expected market growth are forward-looking statements. You can identify these forward-looking statements by words such as “anticipate,” “appear,” “believe,” “continue,” “could,” “estimate,” “expect,” “intend,” “may,” “plan,” “predict,” “project,” “target,” “will,” or similar expressions.
These forward-looking statements include, among other things, statements about:
• | the status of borrowers, the ability of borrowers to repay loans and the plans of borrowers; |
• | our ability to maintain investor confidence in the operation of our platform; |
• | the likelihood of investors to continue to, directly or indirectly, invest through our platform; |
• | our ability to secure additional sources of investor commitments for our platform and the continued deployment of those investor commitments on the platform; |
• | ability to secure additional investors without incentives to participate on the platform; |
• | expected rates of return for investors; |
• | the effectiveness of our platform’s credit scoring models; |
• | the use or potential use of our own capital to purchase loans; |
• | commitments or investments in loans to support: contractual obligations, such as to Springstone’s issuing bank for loans that Springstone facilitates and that are originated by the issuing bank partner but do not meet the credit criteria for purchase by the issuing bank partner (Pool B loans) or repurchase obligations, regulatory commitments, such as direct mail, short-term marketplace equilibrium, the testing or initial launch of alternative loan terms, programs or channels that we do not have sufficient performance data on, or customer accommodations; |
• | transaction fee or other revenue we expect to recognize after loans are issued by our issuing bank partners; |
• | our financial condition and performance, including the impact that management’s estimates have on our financial performance and the relationship between the interim period and full year results; |
• | capital expenditures; |
• | the impact of new accounting standards; |
• | investor, borrower, platform and loan performance-related factors that may affect our revenue; |
• | the potential adoption rates and returns related to new products and services; |
• | the potential impact of macro-economic developments that could impact the credit performance of our loans, notes and certificates, and influence borrower and investor behavior; |
• | our ability to develop and maintain effective internal controls, and our remediation of a material weakness in our internal controls; |
• | our ability to recruit and retain quality employees to support future growth; |
• | our compliance with applicable local, state and Federal laws; |
1
LENDINGCLUB CORPORATION
• | our compliance with applicable regulations and regulatory developments or court decisions affecting our business; and |
• | other risk factors listed from time to time in reports we file with the SEC. |
We caution you that the foregoing list may not contain all of the forward-looking statements in this Report. We may not actually achieve the plans, intentions or expectations disclosed in forward-looking statements, and you should not place undue reliance on forward-looking statements. We have included important factors in the cautionary statements included in this Report and the “Risk Factors” section of our Annual Report on Form 10-K for the year ended December 31, 2016, that could, among other things, cause actual results or events to differ materially from forward-looking statements contained in this Report. Forward-looking statements do not reflect the potential impact of any future acquisitions, mergers, dispositions, joint ventures or investments we may make.
You should read this Report carefully and completely and with the understanding that actual future results may be materially different from what we expect. We do not assume any obligation to update or revise any forward-looking statements, whether as a result of new information, future events or otherwise, other than as required by law.
2
PART I. FINANCIAL INFORMATION
Item 1. Financial Statements
LENDINGCLUB CORPORATION
Condensed Consolidated Balance Sheets
(In Thousands, Except Share and Per Share Amounts)
(Unaudited)
March 31, 2017 | December 31, 2016 | ||||||
Assets | |||||||
Cash and cash equivalents | $ | 534,451 | $ | 515,602 | |||
Restricted cash | 148,890 | 177,810 | |||||
Securities available for sale at fair value | 246,940 | 287,137 | |||||
Loans at fair value (includes $2,351,103 and $2,600,422 from consolidated trust, respectively) | 4,026,755 | 4,311,984 | |||||
Loans held for sale at fair value | 9,409 | 9,048 | |||||
Accrued interest receivable (includes $20,570 and $24,037 from consolidated trust, respectively) | 35,644 | 40,299 | |||||
Property, equipment and software, net | 92,290 | 89,263 | |||||
Intangible assets, net | 25,049 | 26,211 | |||||
Goodwill | 35,633 | 35,633 | |||||
Other assets | 77,079 | 69,644 | |||||
Total assets | $ | 5,232,140 | $ | 5,562,631 | |||
Liabilities and Stockholders’ Equity | |||||||
Accounts payable | $ | 7,470 | $ | 10,889 | |||
Accrued interest payable (includes $22,994 and $26,839 from consolidated trust, respectively) | 38,422 | 43,574 | |||||
Accrued expenses and other liabilities | 83,338 | 85,619 | |||||
Payable to investors | 96,131 | 125,884 | |||||
Notes and certificates at fair value (includes $2,364,563 and $2,616,023 from consolidated trust, respectively) | 4,034,357 | 4,320,895 | |||||
Total liabilities | 4,259,718 | 4,586,861 | |||||
Stockholders’ Equity | |||||||
Common stock, $0.01 par value; 900,000,000 shares authorized; 405,126,913 and 400,262,472 shares issued, respectively; 402,844,213 and 397,979,772 shares outstanding, respectively | 4,051 | 4,003 | |||||
Additional paid-in capital | 1,253,910 | 1,226,206 | |||||
Accumulated deficit | (265,428 | ) | (234,187 | ) | |||
Treasury stock, at cost; 2,282,700 shares | (19,485 | ) | (19,485 | ) | |||
Accumulated other comprehensive loss | (626 | ) | (767 | ) | |||
Total stockholders’ equity | 972,422 | 975,770 | |||||
Total liabilities and stockholders’ equity | $ | 5,232,140 | $ | 5,562,631 | |||
See Notes to Condensed Consolidated Financial Statements.
3
LENDINGCLUB CORPORATION
Condensed Consolidated Statements of Operations
(In Thousands, Except Share and Per Share Amounts)
(Unaudited)
Three Months Ended March 31, | |||||||
2017 | 2016 | ||||||
Net revenue: | |||||||
Transaction fees | $ | 98,692 | $ | 124,508 | |||
Investor fees (1) | 21,180 | 20,487 | |||||
Other revenue (1) | 2,221 | 6,103 | |||||
Total interest income | 160,996 | 177,879 | |||||
Total interest expense | (158,607 | ) | (176,683 | ) | |||
Net interest income | 2,389 | 1,196 | |||||
Total net revenue | 124,482 | 152,294 | |||||
Operating expenses: | |||||||
Sales and marketing | 54,583 | 66,575 | |||||
Origination and servicing | 20,449 | 19,198 | |||||
Engineering and product development | 35,760 | 24,198 | |||||
Other general and administrative | 43,574 | 38,035 | |||||
Total operating expenses | 154,366 | 148,006 | |||||
Income (loss) before income tax expense | (29,884 | ) | 4,288 | ||||
Income tax (benefit) expense | (40 | ) | 151 | ||||
Net income (loss) | $ | (29,844 | ) | $ | 4,137 | ||
Net income (loss) per share: | |||||||
Basic | $ | (0.07 | ) | $ | 0.01 | ||
Diluted | $ | (0.07 | ) | $ | 0.01 | ||
Weighted-average common shares - Basic | 400,308,521 | 380,266,636 | |||||
Weighted-average common shares - Diluted | 400,308,521 | 392,397,825 | |||||
(1) | Prior period amounts have been reclassified to conform to the current period presentation. See “Note 1 – Basis of Presentation” for additional information. |
See Notes to Condensed Consolidated Financial Statements.
4
LENDINGCLUB CORPORATION
Condensed Consolidated Statements of Comprehensive Income (Loss)
(In Thousands)
(Unaudited)
Three Months Ended March 31, | |||||||
2017 | 2016 | ||||||
Net income (loss) | $ | (29,844 | ) | $ | 4,137 | ||
Other comprehensive income (loss), before tax: | |||||||
Change in net unrealized gain (loss) on securities available for sale | 236 | 803 | |||||
Other comprehensive income (loss), before tax | 236 | 803 | |||||
Income tax effect | 95 | — | |||||
Other comprehensive income (loss), net of tax | 141 | 803 | |||||
Comprehensive income (loss) | $ | (29,703 | ) | $ | 4,940 | ||
See Notes to Condensed Consolidated Financial Statements.
5
LENDINGCLUB CORPORATION
Condensed Consolidated Statements of Cash Flows
(In Thousands)
(Unaudited)
Three Months Ended March 31, | |||||||
2017 | 2016 | ||||||
Cash Flows from Operating Activities: | |||||||
Net income (loss) | $ | (29,844 | ) | $ | 4,137 | ||
Adjustments to reconcile net income (loss) to net cash (used for) provided by operating activities: | |||||||
Net fair value adjustments of loans, loans held for sale, notes and certificates | 1,417 | 167 | |||||
Change in fair value of loan servicing liabilities | (809 | ) | (2,078 | ) | |||
Change in fair value of loan servicing assets | 4,047 | (232 | ) | ||||
Stock-based compensation, net | 19,498 | 15,021 | |||||
Excess tax benefit from share-based awards | — | (39 | ) | ||||
Depreciation and amortization | 10,254 | 6,655 | |||||
Gain on sales of loans | (5,043 | ) | (4,699 | ) | |||
Other, net | 352 | 30 | |||||
Purchase of loans held for sale | (1,176,154 | ) | (1,308,463 | ) | |||
Principal payments received on loans held for sale | 892 | — | |||||
Proceeds from sales of whole loans | 1,172,161 | 1,308,463 | |||||
Net change in operating assets and liabilities: | |||||||
Accrued interest receivable | 4,655 | (1,027 | ) | ||||
Other assets | (6,452 | ) | 657 | ||||
Due from related parties | 71 | (242 | ) | ||||
Accounts payable | (3,833 | ) | (123 | ) | |||
Accrued interest payable | (5,152 | ) | 1,393 | ||||
Accrued expenses and other liabilities | (3,178 | ) | (9,679 | ) | |||
Net cash (used for) provided by operating activities | (17,118 | ) | 9,941 | ||||
Cash Flows from Investing Activities: | |||||||
Purchases of loans | (524,412 | ) | (921,825 | ) | |||
Principal payments received on loans | 640,006 | 586,159 | |||||
Proceeds from recoveries and sales of charged-off loans | 10,889 | 10,191 | |||||
Proceeds from sales of whole loans | 2,118 | — | |||||
Purchases of securities available for sale | (26,430 | ) | (3,661 | ) | |||
Proceeds from maturities of securities available for sale | 66,817 | 17,374 | |||||
Investment in Cirrix Capital | — | (10,000 | ) | ||||
Net change in restricted cash | 28,920 | (23,752 | ) | ||||
Purchases of property, equipment and software, net | (7,908 | ) | (10,483 | ) | |||
Net cash provided by (used for) investing activities | 190,000 | (355,997 | ) | ||||
6
LENDINGCLUB CORPORATION
Condensed Consolidated Statements of Cash Flows
(In Thousands)
(Unaudited)
Three Months Ended March 31, | |||||||
2017 | 2016 | ||||||
Cash Flows from Financing Activities: | |||||||
Change in payable to investors | (29,753 | ) | (1,245 | ) | |||
Proceeds from issuances of notes and certificates | 523,305 | 901,258 | |||||
Proceeds from secured borrowings | — | 15,113 | |||||
Principal payments and retirements of notes and certificates | (641,103 | ) | (583,982 | ) | |||
Payments on notes and certificates from recoveries/sales of related charged-off loans | (10,790 | ) | (10,177 | ) | |||
Repurchase of common stock | — | (19,485 | ) | ||||
Proceeds from stock option exercises and other | 4,308 | 4,846 | |||||
Excess tax benefit from share-based awards | — | 39 | |||||
Net cash (used for) provided by financing activities | (154,033 | ) | 306,367 | ||||
Net Increase (Decrease) in Cash and Cash Equivalents | 18,849 | (39,689 | ) | ||||
Cash and Cash Equivalents, Beginning of Period | 515,602 | 623,531 | |||||
Cash and Cash Equivalents, End of Period | $ | 534,451 | $ | 583,842 | |||
Supplemental Cash Flow Information: | |||||||
Cash paid for interest | $ | 163,692 | $ | 175,224 | |||
Non-cash investing activity: | |||||||
Accruals for property, equipment and software | $ | 905 | $ | 4,286 | |||
See Notes to Condensed Consolidated Financial Statements.
7
LENDINGCLUB CORPORATION
Notes to Condensed Consolidated Financial Statements
(Tabular Amounts in Thousands, Except Share and Per Share Amounts, Ratios, or as Noted)
(Unaudited)
1. Basis of Presentation
LendingClub Corporation (Lending Club) is an online marketplace connecting borrowers and investors. LC Advisors, LLC (LCA), is a registered investment advisor with the Securities and Exchange Commission (SEC) and wholly-owned subsidiary of Lending Club that acts as the general partner for certain private funds and advisor to separately managed accounts (SMAs) and a fund of which its wholly-owned subsidiary RV MP Fund GP, LLC, is the general partner. Springstone Financial, LLC (Springstone), is a wholly-owned subsidiary of Lending Club that facilitates education and patient finance loans. LC Trust I (the Trust) is an independent Delaware business trust that acquires loans from Lending Club and holds them for the sole benefit of certain investors that have purchased a trust certificate (Certificate) issued by the Trust and that are related to specific underlying loans for the benefit of the investor.
The accompanying unaudited condensed consolidated financial statements include Lending Club, its subsidiaries (collectively referred to as the Company, we, or us) and the Trust. All intercompany balances and transactions have been eliminated.These condensed consolidated financial statements have been prepared in conformity with accounting principles generally accepted in the United States of America (GAAP) for interim financial information and contain all adjustments, consisting of only normal recurring adjustments, necessary for the fair statement of the results and financial position for the periods presented. These accounting principles require management to make certain estimates and assumptions that affect the amounts in the accompanying financial statements. Actual results may differ from those estimates, and results reported in the interim periods are not necessarily indicative of the results for the full year or any other interim period.
In the first quarter of 2017, the Company simplified the presentation of “Total net revenue” in the unaudited Condensed Consolidated Statements of Operations to present revenues from transactions with investors as a single line item “Investor fees” by aggregating the revenues previously reported as “Servicing fees” and “Management fees.” Additionally, the Company aggregated “Fair value adjustments - loans, loans held for sale, notes and certificates” into “Other revenue (expense).” These changes had no impact to “Total net revenue.” Prior period amounts have been reclassified to conform to the current period presentation.
The accompanying interim condensed consolidated financial statements and these related notes should be read in conjunction with the consolidated financial statements and related notes included in the Company’s Annual Report on Form 10-K for the year ended December 31, 2016 (Annual Report) filed on February 28, 2017.
2. Summary of Significant Accounting Policies
The Company's significant accounting policies are discussed in “Part II – Item 8 – Financial Statements and Supplementary Data – Note 2. Summary of Significant Accounting Policies” in the Annual Report. There have been no significant changes to these significant accounting policies for the period ended March 31, 2017.
Adoption of New Accounting Standards
The Company adopted the following accounting standards during the period ended March 31, 2017:
Accounting Standards Update (ASU) 2016-09 Compensation – Stock Compensation (Topic 718): Improvements to Employee Share-Based Payment Accounting (ASU 2016-09), simplifies the accounting for employee share-based payment transactions, including the associated accounting for income taxes, forfeitures, and classification in the statement of cash flows. The Company adopted ASU 2016-09 effective January 1, 2017, under the modified retrospective method with the cumulative effect of adoption recorded as a reclassification to 2017 beginning accumulated deficit. The Company also elected to present the change in presentation in the Statement of Cash Flows related to excess tax benefits prospectively and, therefore, prior period amounts have not been adjusted.
8
LENDINGCLUB CORPORATION
Notes to Condensed Consolidated Financial Statements
(Tabular Amounts in Thousands, Except Share and Per Share Amounts, Ratios, or as Noted)
(Unaudited)
Under ASU 2016-09, the Company now recognizes the excess income tax benefits or deficiencies from stock-based compensation in the income tax provision in the Consolidated Statements of Operations, and as an operating activity in the Consolidated Statements of Cash Flows. Additionally, excess tax benefits and tax deficiencies are now excluded from the calculation of assumed proceeds using the treasury stock method when computing fully diluted earnings per share. The Company recognized a $56.5 million deferred tax asset with a full valuation allowance (net zero impact upon adoption) in the Consolidated Balance Sheet for the excess income tax benefits from stock-based compensation as of January 1, 2017.
The Company also elected to recognize forfeitures as they occur for equity awards with only a service condition, rather than estimate expected forfeitures, as permitted by ASU 2016-09. The Company recorded a $1.4 million reclassification to 2017 beginning accumulated deficit to remove the estimate of forfeitures as of January 1, 2017.
ASU 2017-04, Intangibles – Goodwill and Other (Topic 350) – Simplifying the Test for Goodwill Impairment, simplifies the accounting for goodwill impairments by eliminating Step 2 of the goodwill impairment test. Under ASU 2017-04, a goodwill impairment loss is now measured as the amount by which the carrying amount of a reporting unit exceeds its fair value. The Company elected to early adopt ASU 2017-04 effective January 1, 2017. The adoption did not have an effect on the Company's condensed consolidated financial statements for the period ended March 31, 2017.
New Accounting Standards Not Yet Adopted
Updates to the new accounting standards not yet adopted as disclosed in the Company’s Annual Report for the year ended December 31, 2016 are as follows:
In May 2014, the FASB issued ASU 2014-09, Revenue from Contracts with Customers (Topic 606), which will be effective January 1, 2018. The guidance clarifies that revenue from contracts with customers should be recognized in a manner that depicts both the likelihood of payment and the timing of the related transfer of goods or performance of services. In March 2016, the FASB issued an amendment (ASU 2016-08) to the new revenue recognition guidance clarifying how to determine if an entity is a principal or agent in a transaction. In April (ASU 2016-10) and May (ASU 2016-12) of 2016, the FASB further amended the guidance to include performance obligation identification, licensing implementation, collectability assessment and other presentation and transition clarifications. The effective date and transition requirements for the amendments is the same as for ASU 2014-09. The Company plans to adopt the revenue recognition guidance beginning January 1, 2018 and currently anticipates using the modified retrospective method of adoption. However, the adoption method to be used is subject to completion of the Company’s impact assessment. We have preliminarily determined the revenue streams that are in the scope and have begun reviewing our revenue contracts to identify any changes in the timing of revenue recognition, presentation of certain revenue streams as gross versus net reporting, and the capitalization of contract costs. The assessment of applying Topic 606 is ongoing and, therefore, the Company has not yet determined whether those impacts will be material to the Company’s consolidated financial statements.
No new accounting standards that are applicable to the Company were issued after the filing of the Company's Annual Report for the year ended December 31, 2016.
9
LENDINGCLUB CORPORATION
Notes to Condensed Consolidated Financial Statements
(Tabular Amounts in Thousands, Except Share and Per Share Amounts, Ratios, or as Noted)
(Unaudited)
3. Net Income (Loss) Per Share
The following table details the computation of the Company's basic and diluted net income (loss) per share:
Three Months Ended March 31, | ||||||||
2017 | 2016 | |||||||
Net income (loss) | $ | (29,844 | ) | $ | 4,137 | |||
Weighted average common shares - Basic | 400,308,521 | 380,266,636 | ||||||
Weighted average common shares - Diluted | 400,308,521 | 392,397,825 | ||||||
Net income (loss) per share: | ||||||||
Basic | $ | (0.07 | ) | $ | 0.01 | |||
Diluted | $ | (0.07 | ) | $ | 0.01 | |||
4. Securities Available for Sale
The amortized cost, gross unrealized gains and losses, and fair value of securities available for sale as of March 31, 2017 and December 31, 2016, were as follows:
March 31, 2017 | Amortized Cost | Gross Unrealized Gains | Gross Unrealized Losses | Fair Value | |||||||||||
Corporate debt securities | $ | 167,115 | $ | 173 | $ | (101 | ) | $ | 167,187 | ||||||
Asset-backed securities | 20,097 | 1 | (4 | ) | 20,094 | ||||||||||
U.S. agency securities | 19,601 | 20 | — | 19,621 | |||||||||||
Certificates of deposit | 17,000 | — | — | 17,000 | |||||||||||
Commercial paper | 15,551 | — | — | 15,551 | |||||||||||
U.S. Treasury securities | 2,494 | 1 | — | 2,495 | |||||||||||
Other securities | 5,002 | — | (10 | ) | 4,992 | ||||||||||
Total securities available for sale | $ | 246,860 | $ | 195 | $ | (115 | ) | $ | 246,940 | ||||||
December 31, 2016 | Amortized Cost | Gross Unrealized Gains | Gross Unrealized Losses | Fair Value | |||||||||||
Corporate debt securities | $ | 181,359 | $ | 63 | $ | (199 | ) | $ | 181,223 | ||||||
Certificates of deposit | 27,501 | — | — | 27,501 | |||||||||||
Asset-backed securities | 25,369 | 4 | (9 | ) | 25,364 | ||||||||||
Commercial paper | 20,164 | — | — | 20,164 | |||||||||||
U.S. agency securities | 19,602 | 21 | — | 19,623 | |||||||||||
U.S. Treasury securities | 2,493 | 3 | — | 2,496 | |||||||||||
Other securities | 10,805 | — | (39 | ) | 10,766 | ||||||||||
Total securities available for sale | $ | 287,293 | $ | 91 | $ | (247 | ) | $ | 287,137 | ||||||
10
LENDINGCLUB CORPORATION
Notes to Condensed Consolidated Financial Statements
(Tabular Amounts in Thousands, Except Share and Per Share Amounts, Ratios, or as Noted)
(Unaudited)
A summary of securities available for sale with unrealized losses as of March 31, 2017 and December 31, 2016, aggregated by period of continuous unrealized loss, is as follows:
Less than 12 months | 12 months or longer | Total | |||||||||||||||||||||
March 31, 2017 | Fair Value | Unrealized Losses | Fair Value | Unrealized Losses | Fair Value | Unrealized Losses | |||||||||||||||||
Corporate debt securities | $ | 85,233 | $ | (99 | ) | $ | 3,173 | $ | (2 | ) | $ | 88,406 | $ | (101 | ) | ||||||||
Asset-backed securities | 8,678 | (4 | ) | — | — | 8,678 | (4 | ) | |||||||||||||||
Other securities | — | — | 3,991 | (10 | ) | 3,991 | (10 | ) | |||||||||||||||
Total securities with unrealized losses(1) | $ | 93,911 | $ | (103 | ) | $ | 7,164 | $ | (12 | ) | $ | 101,075 | $ | (115 | ) | ||||||||
Less than 12 months | 12 months or longer | Total | |||||||||||||||||||||
December 31, 2016 | Fair Value | Unrealized Losses | Fair Value | Unrealized Losses | Fair Value | Unrealized Losses | |||||||||||||||||
Corporate debt securities | $ | 107,862 | $ | (185 | ) | $ | 11,682 | $ | (14 | ) | $ | 119,544 | $ | (199 | ) | ||||||||
Asset-backed securities | 6,628 | (8 | ) | 1,870 | (1 | ) | 8,498 | (9 | ) | ||||||||||||||
Other securities | 6,800 | (3 | ) | 3,966 | (36 | ) | 10,766 | (39 | ) | ||||||||||||||
Total securities with unrealized losses(1) | $ | 121,290 | $ | (196 | ) | $ | 17,518 | $ | (51 | ) | $ | 138,808 | $ | (247 | ) | ||||||||
(1) | The number of investment positions with unrealized losses at March 31, 2017 and December 31, 2016 totaled 55 and 72, respectively. |
There were no impairment charges recognized during the first quarter of 2017 or 2016.
The contractual maturities of securities available for sale at March 31, 2017, were as follows:
Within 1 year | After 1 year through 5 years | After 5 years through 10 years | After 10 years | Total | |||||||||||
Corporate debt securities | $ | 98,086 | $ | 69,101 | $ | — | $ | — | $ | 167,187 | |||||
Asset-backed securities | 8,178 | 11,916 | — | — | 20,094 | ||||||||||
U.S. agency securities | 19,621 | — | — | — | 19,621 | ||||||||||
Certificates of deposit | 17,000 | — | — | — | 17,000 | ||||||||||
Commercial paper | 15,551 | — | — | — | 15,551 | ||||||||||
U.S. Treasury securities | — | 2,495 | — | — | 2,495 | ||||||||||
Other securities | 1,001 | 3,991 | — | — | 4,992 | ||||||||||
Total fair value | $ | 159,437 | $ | 87,503 | $ | — | $ | — | $ | 246,940 | |||||
Total amortized cost | $ | 159,456 | $ | 87,404 | $ | — | $ | — | $ | 246,860 | |||||
There were no sales of securities available for sale during the first quarter of 2017 or 2016.
11
LENDINGCLUB CORPORATION
Notes to Condensed Consolidated Financial Statements
(Tabular Amounts in Thousands, Except Share and Per Share Amounts, Ratios, or as Noted)
(Unaudited)
5. Loans, Loans Held For Sale, Notes and Certificates and Loan Servicing Rights
Loans, Loans Held For Sale, Notes and Certificates
The Company sells loans and issues notes and the Trust issues certificates as a means to allow investors to invest in the corresponding loans. At March 31, 2017 and December 31, 2016, loans, loans held for sale, notes and certificates measured at fair value on a recurring basis were as follows:
Loans | Loans Held For Sale | Notes and Certificates | |||||||||||||||||||||
March 31, 2017 | December 31, 2016 | March 31, 2017 | December 31, 2016 | March 31, 2017 | December 31, 2016 | ||||||||||||||||||
Aggregate principal balance outstanding | $ | 4,312,252 | $ | 4,565,653 | $ | 9,724 | $ | 9,345 | $ | 4,318,302 | $ | 4,572,912 | |||||||||||
Net fair value adjustments | (285,497 | ) | (253,669 | ) | (315 | ) | (297 | ) | (283,945 | ) | (252,017 | ) | |||||||||||
Fair value | $ | 4,026,755 | $ | 4,311,984 | $ | 9,409 | $ | 9,048 | $ | 4,034,357 | $ | 4,320,895 | |||||||||||
Loans invested in by the Company for which there was no associated note or certificate had an aggregate principal balance outstanding of $26.6 million and a fair value of $24.8 million at March 31, 2017. Loans invested in by
the Company for which there was no associated note or certificate had an aggregate principal balance outstanding of $27.9 million and a fair value of $25.9 million at December 31, 2016.
The Company places all loans that are contractually past due by 120 days or more on non-accrual status. At March 31, 2017 and December 31, 2016, loans that were 90 days or more past due (including non-accrual loans) were as follows:
March 31, 2017 | December 31, 2016 | ||||||||||||||
> 90 days past due | Non-accrual loans | > 90 days past due | Non-accrual loans | ||||||||||||
Outstanding principal balance | $ | 39,492 | $ | 1,807 | $ | 45,718 | $ | 5,055 | |||||||
Net fair value adjustments | (33,860 | ) | (1,516 | ) | (40,183 | ) | (4,392 | ) | |||||||
Fair value | $ | 5,632 | $ | 291 | $ | 5,535 | $ | 663 | |||||||
# of loans (not in thousands) | 3,557 | 165 | 4,041 | 483 | |||||||||||
Loan Servicing Rights
Loans underlying loan servicing rights had a total outstanding principal balance of $6.73 billion and $6.54 billion as of March 31, 2017 and December 31, 2016, respectively.
6. Fair Value of Assets and Liabilities
For a description of the fair value hierarchy and the Company’s fair value methodologies, see “Note 2. Summary of
Significant Accounting Policies” in the Annual Report. The Company records certain assets and liabilities at fair value as listed in the following tables.
12
LENDINGCLUB CORPORATION
Notes to Condensed Consolidated Financial Statements
(Tabular Amounts in Thousands, Except Share and Per Share Amounts, Ratios, or as Noted)
(Unaudited)
Financial Instruments Recorded at Fair Value
The following tables present the fair value hierarchy for assets and liabilities measured at fair value:
March 31, 2017 | Level 1 Inputs | Level 2 Inputs | Level 3 Inputs | Balance at Fair Value | |||||||||||
Assets: | |||||||||||||||
Loans | $ | — | $ | — | $ | 4,026,755 | $ | 4,026,755 | |||||||
Loans held for sale | — | — | 9,409 | 9,409 | |||||||||||
Securities available for sale: | |||||||||||||||
Corporate debt securities | — | 167,187 | — | 167,187 | |||||||||||
Asset-backed securities | — | 20,094 | — | 20,094 | |||||||||||
U.S. agency securities | — | 19,621 | — | 19,621 | |||||||||||
Certificates of deposit | — | 17,000 | — | 17,000 | |||||||||||
Commercial paper | — | 15,551 | — | 15,551 | |||||||||||
U.S. Treasury securities | — | 2,495 | — | 2,495 | |||||||||||
Other securities | — | 4,992 | — | 4,992 | |||||||||||
Total securities available for sale | — | 246,940 | — | 246,940 | |||||||||||
Servicing assets | — | — | 22,360 | 22,360 | |||||||||||
Total assets | $ | — | $ | 246,940 | $ | 4,058,524 | $ | 4,305,464 | |||||||
Liabilities: | |||||||||||||||
Notes and certificates | $ | — | $ | — | $ | 4,034,357 | $ | 4,034,357 | |||||||
Servicing liabilities | — | — | 2,311 | 2,311 | |||||||||||
Loan trailing fee liability | — | — | 5,814 | 5,814 | |||||||||||
Total liabilities | $ | — | $ | — | $ | 4,042,482 | $ | 4,042,482 | |||||||
13
LENDINGCLUB CORPORATION
Notes to Condensed Consolidated Financial Statements
(Tabular Amounts in Thousands, Except Share and Per Share Amounts, Ratios, or as Noted)
(Unaudited)
December 31, 2016 | Level 1 Inputs | Level 2 Inputs | Level 3 Inputs | Balance at Fair Value | |||||||||||
Assets: | |||||||||||||||
Loans | $ | — | $ | — | $ | 4,311,984 | $ | 4,311,984 | |||||||
Loans held for sale | — | — | 9,048 | 9,048 | |||||||||||
Securities available for sale: | |||||||||||||||
Corporate debt securities | — | 181,223 | — | 181,223 | |||||||||||
Certificates of deposit | — | 27,501 | — | 27,501 | |||||||||||
Asset-backed securities | — | 25,364 | — | 25,364 | |||||||||||
Commercial paper | — | 20,164 | — | 20,164 | |||||||||||
U.S. agency securities | — | 19,623 | — | 19,623 | |||||||||||
U.S. Treasury securities | — | 2,496 | — | 2,496 | |||||||||||
Other securities | — | 10,766 | — | 10,766 | |||||||||||
Total securities available for sale | — | 287,137 | — | 287,137 | |||||||||||
Servicing assets | — | — | 21,398 | 21,398 | |||||||||||
Total assets | $ | — | $ | 287,137 | $ | 4,342,430 | $ | 4,629,567 | |||||||
Liabilities: | |||||||||||||||
Notes and certificates | $ | — | $ | — | $ | 4,320,895 | $ | 4,320,895 | |||||||
Loan trailing fee liability | $ | — | $ | — | $ | 4,913 | $ | 4,913 | |||||||
Servicing liabilities | — | — | 2,846 | 2,846 | |||||||||||
Total liabilities | $ | — | $ | — | $ | 4,328,654 | $ | 4,328,654 | |||||||
Financial instruments are categorized in the valuation hierarchy based on the significance of unobservable factors in the overall fair value measurement. Since the Company's loans and related notes and certificates, loans held for sale, loan servicing rights, and loan trailing fee liability do not trade in an active market with readily observable prices, the Company uses significant unobservable inputs to measure the fair value of these assets and liabilities. These fair value estimates may also include observable, actively quoted components derived from external sources. As a result, changes in fair value for assets and liabilities within the Level 2 or Level 3 categories may include changes in fair value that were attributable to both observable and unobservable inputs. The Company did not transfer any assets or liabilities in or out of Level 3 during the first quarter of 2017 or the year ended December 31, 2016.
14
LENDINGCLUB CORPORATION
Notes to Condensed Consolidated Financial Statements
(Tabular Amounts in Thousands, Except Share and Per Share Amounts, Ratios, or as Noted)
(Unaudited)
Significant Unobservable Inputs
The following tables present quantitative information about the significant unobservable inputs used for the Company's Level 3 fair value measurements at March 31, 2017 and December 31, 2016:
March 31, 2017 | |||||||||||||||||||||||||||
Loans, Notes and Certificates | Servicing Asset/Liability | Loan Trailing Fee Liability | |||||||||||||||||||||||||
Minimum | Maximum | Weighted Average | Minimum | Maximum | Weighted Average | Minimum | Maximum | Weighted Average | |||||||||||||||||||
Discount rates | 2.4 | % | 17.2 | % | 8.6 | % | 3.1 | % | 15.7 | % | 8.9 | % | 3.1 | % | 15.7 | % | 8.9 | % | |||||||||
Net cumulative expected loss rates (1) | 0.7 | % | 40.7 | % | 14.2 | % | 0.3 | % | 40.7 | % | 12.5 | % | 0.3 | % | 40.7 | % | 12.9 | % | |||||||||
Cumulative expected prepayment rates (1) | 8.1 | % | 41.6 | % | 30.8 | % | 8.0 | % | 41.6 | % | 31.1 | % | 8.0 | % | 41.6 | % | 30.5 | % | |||||||||
Total market servicing rates (% per annum on outstanding principal balance) (2) | N/A | N/A | N/A | 0.63 | % | 0.90 | % | 0.63 | % | N/A | N/A | N/A | |||||||||||||||
December 31, 2016 | |||||||||||||||||||||||||||
Loans, Notes and Certificates | Servicing Asset/Liability | Loan Trailing Fee Liability | |||||||||||||||||||||||||
Minimum | Maximum | Weighted Average | Minimum | Maximum | Weighted Average | Minimum | Maximum | Weighted Average | |||||||||||||||||||
Discount rates | 1.2 | % | 16.6 | % | 7.2 | % | 3.4 | % | 15.1 | % | 7.8 | % | 3.4 | % | 15.0 | % | 7.7 | % | |||||||||
Net cumulative expected loss rates (1) | 0.3 | % | 33.9 | % | 14.6 | % | 0.3 | % | 33.9 | % | 12.8 | % | 0.3 | % | 33.9 | % | 13.5 | % | |||||||||
Cumulative expected prepayment rates (1) | 8.0 | % | 42.7 | % | 30.7 | % | 8.0 | % | 42.7 | % | 29.3 | % | 8.0 | % | 42.7 | % | 28.3 | % | |||||||||
Total market servicing rates (% per annum on outstanding principal balance) (2) | N/A | N/A | N/A | 0.63 | % | 0.90 | % | 0.63 | % | N/A | N/A | N/A | |||||||||||||||
N/A Not applicable
(1) | Expressed as a percentage of the original principal balance of the loan, note or certificate. |
(2) | Includes collection fees estimated to be paid to a hypothetical third-party servicer. |
At March 31, 2017 and December 31, 2016, the discounted cash flow methodology used to estimate the note and certificates' fair values used the same projected net cash flows as their related loans. As demonstrated by the following tables, the fair value adjustments for loans were largely offset by the fair value adjustments of the notes and certificates due to the payment dependent design of the notes and certificates and because the principal balances of the loans were close to the combined principal balances of the notes and certificates.
15
LENDINGCLUB CORPORATION
Notes to Condensed Consolidated Financial Statements
(Tabular Amounts in Thousands, Except Share and Per Share Amounts, Ratios, or as Noted)
(Unaudited)
The following tables present additional information about Level 3 loans, loans held for sale, notes and certificates measured at fair value on a recurring basis for the first quarters of 2017 and 2016:
Loans | Loans Held For Sale | Notes and Certificates | ||||||||||||||||||||||||||||||||||
Outstanding Principal Balance | Valuation Adjustment | Fair Value | Outstanding Principal Balance | Valuation Adjustment | Fair Value | Outstanding Principal Balance | Valuation Adjustment | Fair Value | ||||||||||||||||||||||||||||
Beginning balance at December 31, 2016 | $ | 4,565,653 | $ | (253,669 | ) | $ | 4,311,984 | $ | 9,345 | $ | (297 | ) | $ | 9,048 | $ | 4,572,912 | $ | (252,017 | ) | $ | 4,320,895 | |||||||||||||||
Purchases of loans | 524,416 | (4 | ) | 524,412 | 1,176,155 | (1 | ) | 1,176,154 | — | — | — | |||||||||||||||||||||||||
Issuances of notes and certificates | — | — | — | — | — | — | 523,305 | — | 523,305 | |||||||||||||||||||||||||||
Whole loan sales | — | — | — | (1,174,436 | ) | 157 | (1,174,279 | ) | — | — | — | |||||||||||||||||||||||||
Principal payments and retirements | (639,719 | ) | — | (639,719 | ) | (1,180 | ) | — | (1,180 | ) | (641,105 | ) | 2 | (641,103 | ) | |||||||||||||||||||||
Charge-offs | (138,098 | ) | 138,098 | — | (160 | ) | 160 | — | (136,810 | ) | 136,810 | — | ||||||||||||||||||||||||
Recoveries | — | (10,889 | ) | (10,889 | ) | — | — | — | — | (10,790 | ) | (10,790 | ) | |||||||||||||||||||||||
Change in fair value recorded in earnings | — | (159,033 | ) | (159,033 | ) | — | (334 | ) | (334 | ) | — | (157,950 | ) | (157,950 | ) | |||||||||||||||||||||
Ending balance at March 31, 2017 | $ | 4,312,252 | $ | (285,497 | ) | $ | 4,026,755 | $ | 9,724 | $ | (315 | ) | $ | 9,409 | $ | 4,318,302 | $ | (283,945 | ) | $ | 4,034,357 | |||||||||||||||
Loans | Loans Held For Sale | Notes and Certificates | ||||||||||||||||||||||||||||||||||
Outstanding Principal Balance | Valuation Adjustment | Fair Value | Outstanding Principal Balance | Valuation Adjustment | Fair Value | Outstanding Principal Balance | Valuation Adjustment | Fair Value | ||||||||||||||||||||||||||||
Beginning balance at December 31, 2015 | $ | 4,681,671 | $ | (125,590 | ) | $ | 4,556,081 | $ | — | $ | — | $ | — | $ | 4,697,169 | $ | (125,586 | ) | $ | 4,571,583 | ||||||||||||||||
Purchases of loans | 921,825 | — | 921,825 | 1,308,463 | — | 1,308,463 | — | — | — | |||||||||||||||||||||||||||
Issuances of notes and certificates | — | — | — | — | — | — | 901,258 | — | 901,258 | |||||||||||||||||||||||||||
Whole loan sales | — | — | — | (1,308,463 | ) | — | (1,308,463 | ) | — | — | — | |||||||||||||||||||||||||
Principal payments | (586,159 | ) | — | (586,159 | ) | — | — | — | (583,982 | ) | — | (583,982 | ) | |||||||||||||||||||||||
Charge-offs | (84,991 | ) | 84,991 | — | — | — | — | (84,977 | ) | 84,977 | — | |||||||||||||||||||||||||
Recoveries | — | (10,191 | ) | (10,191 | ) | — | — | — | — | (10,177 | ) | (10,177 | ) | |||||||||||||||||||||||
Change in fair value recorded in earnings | — | (165,400 | ) | (165,400 | ) | — | — | — | — | (165,233 | ) | (165,233 | ) | |||||||||||||||||||||||
Ending balance at March 31, 2016 | $ | 4,932,346 | $ | (216,190 | ) | $ | 4,716,156 | $ | — | $ | — | $ | — | $ | 4,929,468 | $ | (216,019 | ) | $ | 4,713,449 | ||||||||||||||||
16
LENDINGCLUB CORPORATION
Notes to Condensed Consolidated Financial Statements
(Tabular Amounts in Thousands, Except Share and Per Share Amounts, Ratios, or as Noted)
(Unaudited)
The following tables present additional information about Level 3 servicing assets and liabilities measured at fair value on a recurring basis for the first quarters of 2017 and 2016:
Three Months Ended March 31, 2017 | Three Months Ended March 31, 2016 | |||||||||||||||
Servicing Assets | Servicing Liabilities | Servicing Assets | Servicing Liabilities | |||||||||||||
Fair value at beginning of period | $ | 21,398 | $ | 2,846 | $ | 10,250 | $ | 3,973 | ||||||||
Issuances (1) | 5,317 | 274 | 5,631 | 932 | ||||||||||||
Change in fair value, included in servicing fees | (4,047 | ) | (809 | ) | 232 | (2,078 | ) | |||||||||
Other net changes included in deferred revenue | (308 | ) | — | 851 | — | |||||||||||
Fair value at end of period | $ | 22,360 | $ | 2,311 | $ | 16,964 | $ | 2,827 | ||||||||
(1) | Represents the offsets to the gains or losses on sales of the related loans, recorded in other revenue. |
The following table presents additional information about Level 3 loan trailing fee liability measured at fair value on a recurring basis for the first quarters of 2017 and 2016:
Three Months Ended March 31, | |||||||
2017 | 2016 | ||||||
Fair value at beginning of period | $ | 4,913 | $ | — | |||
Issuances | 1,663 | 1,002 | |||||
Cash payment of loan trailing fee | (826 | ) | (4 | ) | |||
Change in fair value, included in origination and servicing | 64 | 4 | |||||
Fair value at end of period | $ | 5,814 | $ | 1,002 | |||
Significant Recurring Level 3 Fair Value Asset and Liability Input Sensitivity
Fair valuation adjustments recorded through earnings related to Level 3 instruments for the first quarters of 2017 and 2016. Generally, changes in the net cumulative expected loss rates, cumulative prepayment rates, and discount rates will have an immaterial net impact on the fair value of loans, notes and certificates, servicing assets and liabilities, and loan trailing fee liability.
Certain of these unobservable inputs may (in isolation) have either a directionally consistent or opposite impact on the fair value of the financial instrument for a given change in that input. When multiple inputs are used within the valuation techniques for loans, notes and certificates, servicing assets and liabilities, and loan trailing fee liability, a change in one input in a certain direction may be offset by an opposite change from another input.
A specific loan that is projected to have larger future default losses than previously estimated has lower expected future cash flows over its remaining life, which reduces its estimated fair value. Conversely, a specific loan that is projected to have smaller future default losses than previously estimated has increased expected future cash flows over its remaining life, which increases its estimated fair value.
17
LENDINGCLUB CORPORATION
Notes to Condensed Consolidated Financial Statements
(Tabular Amounts in Thousands, Except Share and Per Share Amounts, Ratios, or as Noted)
(Unaudited)
The Company's selection of the most representative market servicing rates for servicing assets and servicing liabilities is inherently judgmental. The Company reviews third-party servicing rates for its loans, loans in similar credit sectors, and market servicing benchmarking analyses provided by third-party valuation firms, when available. The table below shows the impact on the estimated fair value of servicing assets and liabilities, calculated using different market servicing rate assumptions as of March 31, 2017 and December 31, 2016:
March 31, 2017 | December 31, 2016 | ||||||||||||||
Servicing Assets | Servicing Liabilities | Servicing Assets | Servicing Liabilities | ||||||||||||
Weighted-average market servicing rate assumptions | 0.63 | % | 0.63 | % | 0.63 | % | 0.63 | % | |||||||
Change in fair value from: | |||||||||||||||
Servicing rate increase by 0.10% | $ | (5,889 | ) | $ | 741 | $ | (5,673 | ) | $ | 964 | |||||
Servicing rate decrease by 0.10% | $ | 5,987 | $ | (643 | ) | $ | 5,812 | $ | (825 | ) | |||||
Financial Instruments, Assets, and Liabilities Not Recorded at Fair Value
The following tables present the fair value hierarchy for financial instruments, assets, and liabilities not recorded at fair value:
March 31, 2017 | Carrying Amount | Level 1 Inputs | Level 2 Inputs | Level 3 Inputs | Balance at Fair Value | ||||||||||||||
Assets: | |||||||||||||||||||
Cash and cash equivalents (1) | $ | 534,451 | $ | — | $ | 534,451 | $ | — | $ | 534,451 | |||||||||
Restricted cash | 148,890 | — | 148,890 | — | 148,890 | ||||||||||||||
Servicer reserve receivable | 4,362 | — | 4,362 | — | 4,362 | ||||||||||||||
Deposits | 855 | — | 855 | — | 855 | ||||||||||||||
Total assets | $ | 688,558 | $ | — | $ | 688,558 | $ | — | $ | 688,558 | |||||||||
Liabilities: | |||||||||||||||||||
Accrued expenses and other liabilities | $ | 11,748 | $ | — | $ | — | $ | 11,748 | $ | 11,748 | |||||||||
Accounts payable | 7,470 | — | 7,470 | — | 7,470 | ||||||||||||||
Payables to investors | 96,131 | — | 96,131 | — | 96,131 | ||||||||||||||
Total liabilities | $ | 115,349 | $ | — | $ | 103,601 | $ | 11,748 | $ | 115,349 | |||||||||
18
LENDINGCLUB CORPORATION
Notes to Condensed Consolidated Financial Statements
(Tabular Amounts in Thousands, Except Share and Per Share Amounts, Ratios, or as Noted)
(Unaudited)
December 31, 2016 | Carrying Amount | Level 1 Inputs | Level 2 Inputs | Level 3 Inputs | Balance at Fair Value | ||||||||||||||
Assets: | |||||||||||||||||||
Cash and cash equivalents (1) | $ | 515,602 | $ | — | $ | 515,602 | $ | — | $ | 515,602 | |||||||||
Restricted cash | 177,810 | — | 177,810 | — | 177,810 | ||||||||||||||
Servicer reserve receivable | 4,938 | — | 4,938 | — | 4,938 | ||||||||||||||
Deposits | 855 | — | 855 | — | 855 | ||||||||||||||
Total assets | $ | 699,205 | $ | — | $ | 699,205 | $ | — | $ | 699,205 | |||||||||
Liabilities: | |||||||||||||||||||
Accrued expenses and other liabilities | $ | 10,981 | $ | — | $ | — | $ | 10,981 | $ | 10,981 | |||||||||
Accounts payable | 10,889 | — | 10,889 | — | 10,889 | ||||||||||||||
Payables to investors | 125,884 | — | 125,884 | — | 125,884 | ||||||||||||||
Total liabilities | $ | 147,754 | $ | — | $ | 136,773 | $ | 10,981 | $ | 147,754 | |||||||||
(1) | Carrying amount approximates fair value due to the short maturity of these financial instruments. |
7. Property, Equipment and Software, Net
Property, equipment and software, net, consist of the following:
March 31, 2017 | December 31, 2016 | ||||||
Internally developed software (1) | $ | 86,238 | $ | 75,202 | |||
Leasehold improvements | 22,802 | 22,637 | |||||
Computer equipment | 18,794 | 18,080 | |||||
Purchased software | 7,284 | 7,598 | |||||
Furniture and fixtures | 6,832 | 6,827 | |||||
Construction in progress | 777 | 707 | |||||
Total property, equipment and software | 142,727 | 131,051 | |||||
Accumulated depreciation and amortization | (50,437 | ) | (41,788 | ) | |||
Total property, equipment and software, net | $ | 92,290 | $ | 89,263 | |||
(1) | Includes $12.6 million and $7.4 million in development in progress as of March 31, 2017 and December 31, 2016, respectively. |
Depreciation and amortization expense on property, equipment and software was $9.1 million and $5.4 million for the first quarters of 2017 and 2016, respectively.
19
LENDINGCLUB CORPORATION
Notes to Condensed Consolidated Financial Statements
(Tabular Amounts in Thousands, Except Share and Per Share Amounts, Ratios, or as Noted)
(Unaudited)
8. Other Assets
Other assets consist of the following:
March 31, 2017 | December 31, 2016 | ||||||
Loan servicing assets, at fair value | $ | 22,360 | $ | 21,398 | |||
Prepaid expenses | 16,555 | 16,960 | |||||
Other investments | 10,463 | 10,372 | |||||
Insurance reimbursement receivable (1) | 9,625 | — | |||||
Accounts receivable | 7,096 | 7,572 | |||||
Servicer reserve receivable | 4,362 | 4,938 | |||||
Receivable from investors | 2,454 | 1,566 | |||||
Tenant improvement receivable | 1,678 | 3,290 | |||||
Due from related parties (2) | 405 | 476 | |||||
Other | 2,081 | 3,072 | |||||
Total other assets | $ | 77,079 | $ | 69,644 | |||
(1) | Represents insurance recoveries for certain legal expenses incurred as a result of the Company's board review and related governmental and regulatory inquiries. |
(2) | Represents management fees due to LCA from certain private funds for which LCA acts as the general partner. |
9. Intangible Assets and Goodwill
Intangible Assets
The Company's intangible asset balance was $25.0 million and $26.2 million at March 31, 2017 and December 31, 2016, respectively. Amortization expense associated with intangible assets for the first quarters of 2017 and 2016 was $1.2 million and $1.3 million, respectively.
Goodwill
The Company's goodwill balance was $35.6 million at March 31, 2017 and December 31, 2016. The Company did not record any goodwill impairment expense for the first quarters of 2017 and 2016. The Company's annual goodwill impairment testing date is April 1.
20
LENDINGCLUB CORPORATION
Notes to Condensed Consolidated Financial Statements
(Tabular Amounts in Thousands, Except Share and Per Share Amounts, Ratios, or as Noted)
(Unaudited)
10. Accrued Expenses and Other Liabilities
Accrued expenses and other liabilities consist of the following:
March 31, 2017 | December 31, 2016 | ||||||
Accrued expenses | $ | 21,853 | $ | 19,734 | |||
Accrued compensation (1) | 19,774 | 27,009 | |||||
Deferred rent | 13,767 | 11,638 | |||||
Transaction fee refund reserve | 10,778 | 9,098 | |||||
Loan trailing fee liability, at fair value | 5,814 | 4,913 | |||||
Loan servicing liabilities, at fair value | 2,311 | 2,846 | |||||
Deferred revenue | 2,249 | 2,556 | |||||
Credit loss coverage reserve | 1,680 | 2,529 | |||||
Reimbursement payable to limited partners of LCA private funds | 1,520 | 2,313 | |||||
Payable to issuing banks | 896 | 1,658 | |||||
Contingent liabilities | 500 | — | |||||
Other | 2,196 | 1,325 | |||||
Total accrued expenses and other liabilities | $ | 83,338 | $ | 85,619 | |||
(1) | Includes accrued cash retention awards of $5.4 million and $3.0 million as of March 31, 2017 and December 31, 2016, respectively. |
11. Secured Borrowings
During the second quarter of 2016, the Company repurchased $22.3 million of near-prime loans from a single institutional investor that did not meet a non-credit, non-pricing requirement of the investor, of which $15.1 million were originally sold to the investor prior to March 31, 2016. As a result, these loans were accounted for as secured borrowings at March 31, 2016. During the second quarter of 2016, the Company resold the loans to a different investor at par. This subsequent transfer qualified for sale accounting treatment, and the loans were removed from the Company's condensed consolidated balance sheet and the secured borrowings liability was reduced to zero in the second quarter of 2016. There were no secured borrowing liabilities as of March 31, 2017.
12. Employee Incentive Plans
The Company’s equity incentive plans provide for granting stock options and restricted stock units (RSUs) to employees, consultants, officers and directors.
21
LENDINGCLUB CORPORATION
Notes to Condensed Consolidated Financial Statements
(Tabular Amounts in Thousands, Except Share and Per Share Amounts, Ratios, or as Noted)
(Unaudited)
Stock-based compensation expense was as follows for the periods presented:
Three Months Ended March 31, | |||||||
2017 | 2016 | ||||||
Stock options | $ | 4,345 | $ | 7,657 | |||
RSUs | 14,634 | 5,126 | |||||
ESPP | 385 | 388 | |||||
Stock issued related to acquisition | 134 | 1,850 | |||||
Total stock-based compensation expense | $ | 19,498 | $ | 15,021 | |||
The following table presents the Company's stock-based compensation expense recorded in the condensed consolidated statements of operations:
Three Months Ended March 31, | |||||||
2017 | 2016 | ||||||
Sales and marketing | $ | 2,299 | $ | 1,904 | |||
Origination and servicing | 1,416 | 746 | |||||
Engineering and product development | 6,588 | 3,723 | |||||
Other general and administrative | 9,195 | 8,648 | |||||
Total stock-based compensation expense | $ | 19,498 | $ | 15,021 | |||
The Company capitalized $2.5 million and $1.9 million of stock-based compensation expense associated with developing software for internal use during the first quarters of 2017 and 2016, respectively.
The Company adopted ASU 2016-09 on January 1, 2017. See Note 2, “Summary of Significant Accounting Policies,” for information on the adoption of ASU 2016-09.
Performance-based Restricted Stock Units
During the first quarter of 2017, the Company's chief executive officer received performance-based restricted stock units (PBRSUs). PBRSUs are equity awards that may be earned based on achieving pre-established performance metrics over a specific performance period. Depending on the probability of achieving the pre-established performance targets, the PBRSUs issued could range from 0% to 200% of the target amount. PBRSUs granted under the Company’s equity incentive plans generally have a one-year performance period with one-half of the grant vesting in one-year following the completion of the performance period and the remaining one-half vesting in two-years following the completion of the performance period. Over the performance period, the number of PBRSUs that may be earned and the related stock-based compensation expense that is recognized is adjusted upward or downward based upon the probability of achieving the pre-established performance targets against the performance metrics.
13. Income Taxes
The Company continues to recognize a full valuation allowance against net deferred tax assets. This determination was based on the assessment of the available positive and negative evidence to estimate if sufficient future taxable income will be generated to utilize the existing deferred tax assets. As of March 31, 2017 and December 31, 2016, the valuation allowance was $131.8 million and $75.3 million, respectively. The increase in the valuation allowance
22
LENDINGCLUB CORPORATION
Notes to Condensed Consolidated Financial Statements
(Tabular Amounts in Thousands, Except Share and Per Share Amounts, Ratios, or as Noted)
(Unaudited)
is due to the adoption of ASU 2016-09, which increased the Company's deferred tax assets for previously unrecognized excess tax benefits associated with the exercise of stock options and the vesting of RSUs.
14. Commitments and Contingencies
Operating Lease Commitments
Total facilities rental expense for the first quarters of 2017 and 2016 was $3.8 million and $3.2 million, respectively. Minimum lease payments for the first quarters of 2017 and 2016 were $3.6 million and $2.2 million, respectively. As of March 31, 2017, the Company pledged $0.8 million of cash and $4.7 million in letters of credit as security deposits in connection with its lease agreements.
The Company's future minimum payments under non-cancelable operating leases in excess of one year and anticipated sublease income as of March 31, 2017, were as follows:
Operating Leases | Subleases | Net | |||||||
2017 | $ | 11,500 | $ | 258 | $ | 11,242 | |||
2018 | 16,065 | 310 | 15,755 | ||||||
2019 | 15,633 | 39 | 15,594 | ||||||
2020 | 16,534 | — | 16,534 | ||||||
2021 | 16,790 | — | 16,790 | ||||||
Thereafter | 41,223 | — | 41,223 | ||||||
Total | $ | 117,745 | $ | 607 | $ | 117,138 | |||
Loan Purchase Obligation
Under the Company's loan account program with WebBank, member FDIC, that serves as the Company's primary issuing bank, WebBank retains ownership of the loans facilitated through Lending Club's marketplace for two business days after origination. As part of this arrangement, the Company has committed to purchase the loans at par plus accrued interest, at the conclusion of the two business days. As of March 31, 2017 and December 31, 2016, the Company was committed to purchase loans with an outstanding principal balance of $52.3 million and $32.2 million at par, respectively.
Loan Repurchase Obligations
The Company has historically limited its loan or note repurchase obligations to events of verified identity theft or in connection with certain customer accommodations. As institutional investors seek to securitize loans purchased through the marketplace, the Company has increased the circumstances and the required burden of proof of economic harm under which the Company is obligated to repurchase loans from these investors. The Company believes these repurchase obligations are customary and consistent with institutional loan and securitization market standards.
In addition to and distinct from the repurchase obligations described in the preceding paragraph, the Company performs certain administrative functions for a variety of retail and institutional investors, including executing, without discretion, loan investments as directed by the investor. To the extent loans do not meet the investor's investment criteria at the time of issuance, or are transferred to the investor as a result of a system error by the
23
LENDINGCLUB CORPORATION
Notes to Condensed Consolidated Financial Statements
(Tabular Amounts in Thousands, Except Share and Per Share Amounts, Ratios, or as Noted)
(Unaudited)
Company, the Company is obligated to repurchase such loans at par. As a result of the loan repurchase obligations described above, the Company repurchased $0.9 million in loans during the first quarter of 2017.
Loan Funding and Purchase Commitments
During the first quarter of 2017, the Company purchased a total of $6.2 million in loans to fulfill contractual purchase obligations and support upcoming securitization initiatives.
As required by applicable regulations, the Company is required to purchase loans resulting from direct marketing efforts if such loans are not otherwise invested in by investors on the platform. The Company did not purchase any such loans during the first quarter of 2017. Additionally, loans in the process of being facilitated and originated by the Company's issuing bank partner at March 31, 2017, were substantially funded in April 2017. As of the date of this report, no loans remained without investor commitments and the Company was not required to purchase any of these loans.
In addition, if neither Springstone nor the Company can arrange for other investors to invest in or purchase loans that Springstone facilitates and that are originated by an issuing bank partner but do not meet the credit criteria for
purchase by the issuing bank partner (Pool B loans), Springstone and the Company are contractually committed to purchase these loans. As of March 31, 2017, the Company had a $9.0 million deposit in a bank account to secure potential, future purchases of these loans, if necessary. The funds are recorded as restricted cash on the Company's consolidated balance sheets. During the first quarter of 2017, the Company was required to purchase $1.7 million of Pool B loans. Pool B loans are held on the Company's balance sheet and have an outstanding principal balance of $2.4 million as of March 31, 2017.
Credit Support Agreements
In connection with a significant platform purchase agreement, the Company is subject to a credit support agreement with a third-party whole loan investor that requires the Company to reimburse the investor for credit losses in excess of a specified percentage of the original principal balance of whole loans acquired by the investor during a 12-month period. During the first quarter of 2017, the Company reimbursed the investor $4.0 million as a result of this credit support agreement. As of March 31, 2017, the Company has accrued approximately $1.7 million for future expected reimbursement to the investor.
The Company is also subject to a credit support agreement with Cirrix Capital (Investment Fund). The credit support agreement requires the Company to pledge and restrict cash in support of its contingent obligation to reimburse the Investment Fund for net credit losses on loans underlying the Investment Fund's certificates that are in excess of a specified, aggregate net loss threshold. On April 14, 2017, the credit support agreement was terminated effective December 31, 2016, however, the Company remains subject to the credit support agreement for credit losses on loans underlying the Investment Fund's certificates that were issued on or prior to December 31, 2016. As of March 31, 2017, $3.4 million was pledged and restricted to support this contingent obligation. The Company's maximum exposure to loss under this credit support agreement was limited to $6.0 million at March 31, 2017.
Legal
Securities Class Actions. During the year ended December 31, 2016, several putative class action lawsuits alleging violations of federal securities laws were filed in California Superior Court, naming as defendants the Company, current and former directors, certain officers, and the underwriters in the December 2014 initial public offering (the IPO). All of these actions were consolidated into a single action (Consolidated State Court Action), entitled In re LendingClub Corporation Shareholder Litigation, No. CIV537300. In August 2016, plaintiffs filed an amended
24
LENDINGCLUB CORPORATION
Notes to Condensed Consolidated Financial Statements
(Tabular Amounts in Thousands, Except Share and Per Share Amounts, Ratios, or as Noted)
(Unaudited)
complaint alleging violations of Sections 11, 12(a)(2) and 15 of the Securities Act of 1933 (Securities Act) based on allegedly false and misleading statements in the IPO registration statement and prospectus. The Company filed a demurrer requesting the Court dismiss certain of the claims alleged in the amended complaint, which was granted in part in the fourth quarter of 2016. The plaintiffs then filed a Second Amended Consolidated Complaint which the Company responded to with a new demurrer seeking to dismiss certain claims. The Court granted in part and denied in part this new demurrer thus setting the operative complaint. In early April 2017 the plaintiffs filed their motion for class certification which the Company will oppose; a hearing on this issue is currently set for June 2017. Discovery is continuing. The Company believes that the plaintiffs’ allegations are without merit, and intends to vigorously defend against the claims.
In May 2016, two related putative securities class actions (entitled Evellard v. LendingClub Corporation, et al., No. 16-CV-2627-WHA, and Wertz v. LendingClub Corporation, et al., No. 16-CV-2670-WHA) were filed in the United States District Court for the Northern District of California, naming as defendants the Company and certain of its officers and directors. In mid-August 2016, the two actions were consolidated into a single action. The Company moved to dismiss the amended complaint filed in the fourth quarter of 2016. The Court held a hearing on this motion in the first quarter of 2017 and a ruling is expected imminently. Discovery will commence if the Company does not succeed in dismissing every claim in the complaint. The Company believes that the plaintiffs’ allegations are without merit, and intends to vigorously defend against the claims.
Derivative Lawsuits. In May 2016 and August 2016, respectively, two putative shareholder derivative actions were filed (Avila v. Laplanche, et al., No. CIV538758 and Dua v. Laplanche, et al., CGC-16-553731) against certain of the Company’s current and former officers and directors and naming the Company as a nominal defendant. Both actions were voluntarily dismissed without prejudice. On December 14, 2016, a new putative shareholder derivative action was filed in the Delaware Court of Chancery (Steinberg, et al. v. Morris, et al., C.A. No. 12984-CB), against certain of the Company's current and former officers and directors and naming the Company as a nominal defendant. The action is based on allegations similar to those in the securities class action litigation described above.
Federal Consumer Class Action. In April 2016, a putative class action lawsuit was filed in federal court in New York, alleging that persons received loans, through the Company's platform, that exceeded states' usury limits in violation of state usury and consumer protection laws, and the federal RICO statute. The Company filed a motion to compel arbitration on an individual basis, which was granted in February 2017. The Company believes that the plaintiff's allegations are without merit, and intends to defend this matter vigorously.
On February 23, 2016, Phoenix Licensing, L.L.C. and LPL Licensing, L.L.C. filed a complaint for patent infringement against the Company in the U.S. District Court for the Eastern District of Texas. The complaint alleges infringement of U.S. Patent Nos. 8,234,184, 6,999,938, 5,987,434, 8,352,317, and 7,860,744 by generating customized marketing materials, replies, and offers to client responses. The parties settled in the first quarter of 2017.
On May 9, 2016, following the announcement of the board review described elsewhere in this filing, the Company received a grand jury subpoena from the U.S. Department of Justice (DOJ). The Company also received formal requests for information from the SEC and Federal Trade Commission (FTC). The Company continues cooperating with the DOJ, SEC, FTC and any other governmental or regulatory authorities or agencies. No assurance can be given as to the timing or outcome of these matters.
In addition to the foregoing, the Company is subject to, and may continue to be subject to legal proceedings and regulatory actions in the ordinary course of business, including inquiries by state regulatory bodies related to the Company's marketplace lending model. These include inquiries from the California Department of Business Oversight, Colorado Department of Law, New York Department of Financial Services, and West Virginia Attorney General's office. No assurance can be given as to the timing or outcome.
25
LENDINGCLUB CORPORATION
Notes to Condensed Consolidated Financial Statements
(Tabular Amounts in Thousands, Except Share and Per Share Amounts, Ratios, or as Noted)
(Unaudited)
15. Segment Reporting
The Company defines operating segments to be components of the Company for which discrete financial information is evaluated regularly by the Company’s executive management committee as chief operating decision maker (CODM). For purposes of allocating resources and evaluating financial performance, the Company’s CODM reviews financial information by the product types of personal loans, and education and patient finance loans. These product types are aggregated and viewed as one operating segment, and therefore, one reportable segment due to their similar economic characteristics, product economics, production process, and regulatory environment.
Substantially all of the Company’s revenue is generated in the United States. No individual borrower or investor accounted for 10% or more of consolidated net revenue for any of the periods presented.
16. Related Party Transactions
Related party transactions must be reviewed and approved by the Audit Committee of the Company’s board of directors when not conducted in the ordinary course of business subject to the standard terms of the Company’s online marketplace or certificate investment program. Related party transactions may include any transaction between entities under common control or with a related person occurring since the beginning of the Company’s latest fiscal year, or any currently proposed transaction. This review also includes any material amendment or modification to an existing related party transaction. The Company has defined related persons as members of the board of directors, executive officers, principal owners of the Company’s outstanding stock and any immediate family members of each such related persons, as well as any other person or entity with significant influence over the Company’s management or operations.
Several of the Company's executive officers and directors (including immediate family members) have made deposits and withdrawals to their investor accounts and purchased loans, notes and certificates or have investments in private funds managed by LCA. The Company believes all such transactions by related persons were made in the ordinary course of business and were transacted on terms and conditions that were not more favorable than those obtained by similarly situated third-party investors.
On April 1, 2016, the Company closed its $10.0 million investment, for an approximate ownership interest of 15% in the Investment Fund, a holding company that participates in a family of funds with other unrelated third parties and purchases whole loans and interests in loans from the Company. At the time the Company made its investment, the Company's Related Party Investors also had limited partnership interests in the Investment Fund that resulted in an aggregate ownership of approximately 29% in the Investment Fund. As of March 31, 2017, the Company and a board member had an aggregate ownership interest of approximately 27% in the Investment Fund.
During the first quarter of 2017, this family of funds purchased $22.5 million of whole loans and interests in whole loans. During the first quarter of 2017, the Company earned $354 thousand in investor fees from this family of funds, and paid interest of $2.3 million to the family of funds. The Company believes that the sales of whole loans and interests in whole loans, and the investor fees charged were on terms and conditions that were not more favorable than those obtained by other third-party investors.
17. Subsequent Events
The Company has evaluated the impact of events that have occurred subsequent to March 31, 2017, through the date the condensed consolidated financial statements were filed with the SEC. Based on this evaluation, other than as recorded or disclosed within these condensed consolidated financial statements and related notes, the Company has determined none of these events were required to be recognized or disclosed.
26
LENDINGCLUB CORPORATION
Management's Discussion and Analysis of Financial Condition and Results of Operations
(Tabular Amounts in Thousands, Except Share and Per Share Data and Ratios, or as Noted)
Item 2. Management’s Discussion and Analysis of Financial Condition and Results of Operations
The following discussion and analysis of our financial condition and results of operations should be read in conjunction with the condensed consolidated financial statements and related notes that appear in this Quarterly Report on Form 10-Q (Report). In addition to historical condensed consolidated financial information, the following discussion contains forward-looking statements that reflect our plans, estimates and beliefs. Our actual results could differ materially from those discussed in the forward-looking statements. Factors that could cause or contribute to these differences include those discussed below and elsewhere in this Report, particularly in “Part II – Other Information – Item 1A – Risk Factors” in this Report and “Part I – Item 1A – Risk Factors” in the Company's Annual Report on Form 10-K for the year ended December 31, 2016 (Annual Report).
Overview
Lending Club is America's largest online marketplace connecting borrowers and investors. We believe a technology-powered marketplace is a more efficient mechanism to allocate capital between borrowers and investors than the traditional banking system. Qualified consumers and small business owners borrow through Lending Club to lower the cost of their credit and enjoy a better experience than that provided by traditional banks.
Investors use Lending Club to earn solid risk-adjusted returns from an asset class that has generally been closed to many investors and only available on a limited basis to institutional investors. The capital to invest in the loans enabled through our marketplace comes directly from a wide range of investors, including retail investors, high-net-worth individuals and family offices, banks and finance companies, insurance companies, hedge funds, foundations, pension plans and university endowments, and through a variety of investment channels.
While our business model is not dependent on using our balance sheet and assuming credit risk for loans facilitated by our marketplace, we may use our own capital to fulfill regulatory or contractual purchase obligations, support short-term marketplace equilibrium, customer accommodations, or other needs. Additionally, we plan to use our capital for strategic business purposes such as investing in and holding loans on balance sheet for future sponsored securitization transactions, and investing in loans associated with the testing or initial launch of new or alternative loan terms, programs, or channels, or to establish a track record of performance prior to facilitating third-party investments in such loans, programs, or channels.
We generate revenue from transaction fees from our marketplace’s role in accepting and decisioning applications for our bank partners to enable loan originations, servicing fees from investors for matching available loan assets with capital, and management fees from investment funds and other managed accounts.
The transaction fees we receive from issuing banks in connection with our marketplace’s role in facilitating loan originations range from 1% to 7% of the initial principal amount of the loan as of March 31, 2017. In addition, for education and patient finance loans, we also collect fees earned from issuing banks and service providers. Investor fees paid to us vary based on investment channel. Note investors generally pay us a fee equal to 1% of payment amounts received from the borrower. Whole loan purchasers pay a monthly fee of up to 1.3% per annum, which is generally based on the month-end principal balance of loans serviced. Certificate holders pay a monthly fee of up to 1.5% per annum of the month-end balance of assets under management or the month-end balance of unpaid principal of the underlying Certificate.
Since beginning operations in 2007, our marketplace has facilitated approximately $26.6 billion in loan originations. These loans were facilitated through the following investment channels: (i) the issuance of member payment dependent notes, (ii) the sale of trust certificates, or (iii) the sale of whole loans to qualified investors. Approximately $4.9 billion of our loan originations since inception were invested in through member payment dependent notes, $7.1 billion were invested in through trust certificates and $14.6 billion were invested in through
27
LENDINGCLUB CORPORATION
Management's Discussion and Analysis of Financial Condition and Results of Operations
(Tabular Amounts in Thousands, Except Share and Per Share Data and Ratios, or as Noted)
whole loan sales. In the first quarter of 2017, our marketplace facilitated approximately $2.0 billion of loan originations, of which approximately $300 million were invested in through member payment dependent notes, $230 million were invested in through trust certificates and $1.44 billion were invested in through whole loan sales. See “Item 1A – Risk Factors – A decline in economic conditions may adversely affect our customers, which may negatively impact our business and results of operations” in our Annual Report on Form 10-K for the year ended December 31, 2016.
Current Economic and Business Environment
Lending Club monitors a variety of economic, credit and competitive indicators so that borrowers can benefit from meaningful savings compared to alternatives, and investors can continue to find solid risk-adjusted returns compared to other fixed income investments or investment alternatives.
Our approach to risk-management is a data-driven, continuous and proactive process that runs against a constantly shifting set of conditions. Our marketplace has a number of levers at its disposal to adjust to changing market conditions, including the ability to quickly adapt underwriting models and dynamically increase or decrease pricing to provide an appropriate level of loss coverage to investors.
During the first half of 2016, we began to observe pockets of underperformance in higher risk segments. This trend was subsequently observed across all loan grades in the third quarter of 2016, although it was less notable in lower risk grades and more notable in higher risk grades, particularly grades E, F and G. We responded to these observations by implementing changes to optimize the credit model several times in 2016, and again in January and May of 2017. While we have observed stable credit performance more recently, we will continue to monitor credit performance on new vintages as data becomes available and any impact from the broader macroeconomic environment. This information will assist us in assessing if and when to implement further changes to the credit model or interest rates. We have also invested in our multifaceted collections capabilities to further mitigate risk to our existing loan portfolio, including adding new recovery strategies, and augmenting collections team capacity.
In addition, we continue to actively explore ways to diversify our investor base and obtain additional investment capital for the platform loans. This could include the strategic use of our balance sheet to access new investors, monetize excess demand for loans, or support capital market transactions to provide liquidity to our existing investors.
Factors That Can Affect Revenue
As a marketplace, we work toward matching supply and demand while also growing originations and correspondingly revenue at a pace commensurate with proper planning, compliance, risk management, user experience, and operational controls that work to optimize the quality of the customer experience, customer satisfaction and long term growth.
The interplay of the volume, timing and quality of loan applications, investment appetite, investor confidence in our data, controls and processes and available investment capital from investors, platform loan processing and originations, and the subsequent performance of loans, which directly impacts our servicing fees, can affect our revenue in any particular period. These drivers collectively result in transaction or investor fees earned by us related to these transactions and their future performance. As these drivers can be affected by a variety of factors, both in and out of our control, revenues may fluctuate from period to period. Factors that can affect these drivers and ultimately revenue and its timing include:
• | market confidence in our data, controls, and processes, |
• | announcements of governmental inquiries or private litigation, |
28
LENDINGCLUB CORPORATION
Management's Discussion and Analysis of Financial Condition and Results of Operations
(Tabular Amounts in Thousands, Except Share and Per Share Data and Ratios, or as Noted)
• | the mix of borrower products and corresponding transaction fees, |
• | availability or the timing of the deployment of investment capital by investors, |
• | the availability and amount of new capital from pooled investment vehicles and managed accounts that typically deploy their capital at the start of a period, |
• | the amount of purchase limitations we can impose on larger investors as a way to maintain investor balance and fairness, |
• | the attractiveness of alternative opportunities for borrowers or investors, |
• | the responsiveness of applicants to our marketing efforts, |
• | expenditures on marketing initiatives in a period, |
• | the sufficiency of operational staff to process any manual portion of the loan applications in a timely manner, |
• | the responsiveness of borrowers to satisfy additional income or employment verification requirements related to their application, |
• | borrower withdrawal rates, |
• | the percentage distribution of loans between the whole and fractional loan platforms, |
• | platform system performance, |
• | seasonality in demand for our platform and services, which is generally lower in the first and fourth quarters, |
• | and other factors. |
Given these factors, at any point in time we have loan applications in various stages from initial application through issuance. Depending upon the timing and impact of these factors, loans may not be issued by our issuing bank in the same period in which the corresponding application was originally made resulting in a portion of that subsequent period’s revenue being earned from loan applications that were initiated in the immediately prior period. Consistent with our revenue recognition accounting policy under GAAP, we do not recognize the associated transaction fee revenue with a loan until the loan is issued by our issuing banks and the proceeds are delivered to the borrower. Our receipt of a transaction fee is not impacted by who or how a loan is invested in.
29
LENDINGCLUB CORPORATION
Management's Discussion and Analysis of Financial Condition and Results of Operations
(Tabular Amounts in Thousands, Except Share and Per Share Data and Ratios, or as Noted)
Key Operating and Financial Metrics
We regularly review a number of metrics to evaluate our business, measure our performance, identify trends, formulate financial projections and make strategic decisions. The following presents our key operating and financial metrics:
Three Months Ended | |||||||||||
March 31, 2017 | December 31, 2016 | March 31, 2016 | |||||||||
Loan originations | $ | 1,958,749 | $ | 1,987,278 | $ | 2,750,033 | |||||
Net revenue(1) | $ | 124,482 | $ | 130,522 | $ | 152,294 | |||||
Net income (loss)(2) | $ | (29,844 | ) | $ | (32,269 | ) | $ | 4,137 | |||
Contribution(3)(4) | $ | 53,165 | $ | 60,736 | $ | 69,171 | |||||
Contribution margin(3)(4) | 42.7 | % | 46.5 | % | 45.4 | % | |||||
Adjusted EBITDA(3)(4) | $ | 161 | $ | (880 | ) | $ | 26,257 | ||||
Adjusted EBITDA margin(3)(4) | 0.1 | % | (0.7 | )% | 17.2 | % | |||||
(1) | See “Factors That Can Affect Revenue” for more information regarding net revenue. |
(2) | See “Results of Operations” for more information regarding net revenue and net income (loss). |
(3) | Contribution, Contribution Margin, Adjusted EBITDA and Adjusted EBITDA Margin are non-GAAP financial measures. For more information regarding these measures and a reconciliation of these measures to the most comparable GAAP measure, see “Non-GAAP Financial Measures.” |
(4) | Prior period amounts have been reclassified to conform to the current period presentation. See “Non-GAAP Financial Measures” for additional information. |
Loan Originations
We believe originations are a key indicator of the adoption rate of our marketplace, growth of our brand, scale of our business, strength of our network effect, economic competitiveness of our products and future growth. Factors that could affect loan originations include investor confidence in our platform and internal processes, the amount of our capital available to invest in loans, interest rate and economic environment; the competitiveness of our products, primarily based on our platform's rates and fees; the success of our operational efforts to balance investor and borrower demand; any limitations on the ability of our issuing banks to originate loans; our ability to develop new products or enhance existing products for borrowers and investors; the success of our sales and marketing initiatives and the success of borrower and investor acquisition and retention.
30
LENDINGCLUB CORPORATION
Management's Discussion and Analysis of Financial Condition and Results of Operations
(Tabular Amounts in Thousands, Except Share and Per Share Data and Ratios, or as Noted)
The Company's originations and weighted average transactions fees (as a percent of origination balance) by its major loan products are as follows:
Three Months Ended | |||||||||||||||||
March 31, 2017 | December 31, 2016 | March 31, 2016 | |||||||||||||||
(in millions, except percentages) | Origination Volume | Weighted- Average Transaction Fees | Origination Volume | Weighted- Average Transaction Fees | Origination Volume | Weighted- Average Transaction Fees | |||||||||||
Personal loans - standard program | $ | 1,438.0 | 5.0 | % | $ | 1,465.3 | 5.1 | % | $ | 2,087.2 | 4.5 | % | |||||
Personal loans - custom program | 300.9 | 5.6 | 329.4 | 5.5 | 459.2 | 4.9 | |||||||||||
Other loans | 219.8 | 4.5 | 192.6 | 4.6 | 203.6 | 4.4 | |||||||||||
Total | $ | 1,958.7 | 5.0 | % | $ | 1,987.3 | 5.1 | % | $ | 2,750.0 | 4.5 | % | |||||
Loans Serviced On Our Platform
The following table provides the outstanding principal balance of loans serviced at the end of the periods indicated, by the method that the loans were financed (in millions):
March 31, 2017 | December 31, 2016 | |||||||
Notes | $ | 1,779 | $ | 1,795 | ||||
Certificates | 2,516 | 2,752 | ||||||
Whole loans sold | 6,731 | 6,542 | ||||||
Other(1) | 27 | 28 | ||||||
Total | $ | 11,053 | $ | 11,117 | ||||
(1) | Includes loans invested in by the Company for which there were no associated notes or certificates. |
31
LENDINGCLUB CORPORATION
Management's Discussion and Analysis of Financial Condition and Results of Operations
(Tabular Amounts in Thousands, Except Share and Per Share Data and Ratios, or as Noted)
Results of Operations
The following table sets forth the condensed consolidated statements of operations data for each of the periods presented:
Three Months Ended | Change (%) | ||||||||||||||||
March 31, 2017 | December 31, 2016 | March 31, 2016 | Q1 2017 vs Q1 2016 | Q1 2017 vs Q4 2016 | |||||||||||||
Net revenue: | |||||||||||||||||
Transaction fees | $ | 98,692 | $ | 101,568 | $ | 124,508 | (21 | )% | (3 | )% | |||||||
Investor fees (1) | 21,180 | 26,027 | 20,487 | 3 | % | (19 | )% | ||||||||||
Other revenue (expense) (1) | 2,221 | 342 | 6,103 | (64 | )% | N/M | |||||||||||
Total interest income | 160,996 | 167,230 | 177,879 | (9 | )% | (4 | )% | ||||||||||
Total interest expense | (158,607 | ) | (164,645 | ) | (176,683 | ) | (10 | )% | (4 | )% | |||||||
Net interest income (expense) | 2,389 | 2,585 | 1,196 | 100 | % | (8 | )% | ||||||||||
Total net revenue | 124,482 | 130,522 | 152,294 | (18 | )% | (5 | )% | ||||||||||
Operating expenses: (2) | |||||||||||||||||
Sales and marketing | 54,583 | 55,457 | 66,575 | (18 | )% | (2 | )% | ||||||||||
Origination and servicing | 20,449 | 18,296 | 19,198 | 7 | % | 12 | % | ||||||||||
Engineering and product development | 35,760 | 32,522 | 24,198 | 48 | % | 10 | % | ||||||||||
Other general and administrative | 43,574 | 56,740 | 38,035 | 15 | % | (23 | )% | ||||||||||
Total operating expenses | 154,366 | 163,015 | 148,006 | 4 | % | (5 | )% | ||||||||||
Income (loss) before income tax expense | (29,884 | ) | (32,493 | ) | 4,288 | N/M | (8 | )% | |||||||||
Income tax (benefit) expense | (40 | ) | (224 | ) | 151 | 126 | % | (82 | )% | ||||||||
Net income (loss) | $ | (29,844 | ) | $ | (32,269 | ) | $ | 4,137 | N/M | (8 | )% | ||||||
(1) Prior period amounts have been reclassified to conform to the current period presentation. See “Part I – Financial Information – Item 1 – Financial Statements – Note 1. Basis of Presentation” for additional information. (2) Includes stock-based compensation expense as follows: | |||||||||||||||||
Three Months Ended | Change (%) | ||||||||||||||||
March 31, 2017 | December 31, 2016 | March 31, 2016 | Q1 2017 vs Q1 2016 | Q1 2017 vs Q4 2016 | |||||||||||||
Sales and marketing | $ | 2,299 | $ | 2,530 | $ | 1,904 | 21 | % | (9 | )% | |||||||
Origination and servicing | 1,416 | 1,437 | 746 | 90 | % | (1 | )% | ||||||||||
Engineering and product development | 6,588 | 6,724 | 3,723 | 77 | % | (2 | )% | ||||||||||
Other general and administrative | 9,195 | 12,120 | 8,648 | 6 | % | (24 | )% | ||||||||||
Total stock-based compensation expense | $ | 19,498 | $ | 22,811 | $ | 15,021 | 30 | % | (15 | )% | |||||||
N/M | Not meaningful. |
32
LENDINGCLUB CORPORATION
Management's Discussion and Analysis of Financial Condition and Results of Operations
(Tabular Amounts in Thousands, Except Share and Per Share Data and Ratios, or as Noted)
Total Net Revenue
Three Months Ended | Change (%) | ||||||||||||||||
March 31, 2017 | December 31, 2016 | March 31, 2016 | Q1 2017 vs Q1 2016 | Q1 2017 vs Q4 2016 | |||||||||||||
Net Revenue | |||||||||||||||||
Transaction fees | $ | 98,692 | $ | 101,568 | $ | 124,508 | (21 | )% | (3 | )% | |||||||
Investor fees (1) | 21,180 | 26,027 | 20,487 | 3 | % | (19 | )% | ||||||||||
Other revenue (expense) (1) | 2,221 | 342 | 6,103 | (64 | )% | N/M | |||||||||||
Total interest income | 160,996 | 167,230 | 177,879 | (9 | )% | (4 | )% | ||||||||||
Total interest expense | (158,607 | ) | (164,645 | ) | (176,683 | ) | (10 | )% | (4 | )% | |||||||
Net interest income (expense) | 2,389 | 2,585 | 1,196 | 100 | % | (8 | )% | ||||||||||
Total net revenue | $ | 124,482 | $ | 130,522 | $ | 152,294 | (18 | )% | (5 | )% | |||||||
N/M | Not material. |
(1) | Prior period amounts have been reclassified to conform to the current period presentation. See “Part I – Financial Information – Item 1 – Financial Statements – Note 1. Basis of Presentation” for additional information. |
Our primary sources of revenue consist of fees received for transactions through or related to our marketplace and include transaction and investor fees. The analysis below is presented for the following periods: First quarter of 2017 compared to the first quarter of 2016 (Quarter Over Quarter) and first quarter of 2017 compared to the fourth quarter of 2016 (Sequential).
Transaction Fees
Transaction fees are fees paid by issuing banks or education and patient service providers to us for the work we perform through our marketplace's role in facilitating loans for our issuing bank partners. The amount of these fees is based upon the terms of the loan, including grade, rate, term and other factors. As of March 31, 2017, these fees ranged from 1% to 7% of the initial principal amount of a loan. In addition, for education and patient finance loans, we also collect fees earned from issuing banks and service providers. We record transaction fee revenue net of program fees paid to WebBank, our issuing bank partner.
In March 2016, we increased the transaction fee that we earn from our primary issuing bank partner for certain prime and near-prime C through G graded loans from 5% to 6%, B graded loans from 4% to 5%, and A graded personal loans by approximately 1% at each subgrade level for grades A2 to A5. Depending upon the borrower impact of these fee changes, these fees may be modified in order to maintain overall platform balance between borrowers and investors. Additional transaction fee increases were made for A graded personal loans by
approximately 1% at each subgrade level for grades A2 to A5 in June 2016.
In April 2017, we recognized approximately $5.7 million in transaction fee revenue associated with the issuance of loans in which the loan application process had commenced prior to the end of the first quarter of 2017. In April 2016, we recognized approximately $5.4 million in transaction fee revenue associated with the issuance of loans in which the loan application process had commenced prior to the end of the first quarter of 2016.
Quarter Over Quarter: Transaction fees were $98.7 million and $124.5 million for the first quarters of 2017 and 2016, respectively, a decrease of 21%. Higher average transactions fees in the first quarter of 2017 resulting from the fee increases discussed above were offset by lower origination volume when compared to the first quarter of
33
LENDINGCLUB CORPORATION
Management's Discussion and Analysis of Financial Condition and Results of Operations
(Tabular Amounts in Thousands, Except Share and Per Share Data and Ratios, or as Noted)
2016. The average transaction fee as a percentage of the initial principal balance of the loan was 5.0% and 4.5% for the first quarters of 2017 and 2016, respectively, driven by a change in the mix of loans issued and the fee increases noted above.
Sequential: Transaction fees were $98.7 million and $101.6 million for the first quarter of 2017 and fourth quarter of 2016, respectively, a decrease of 3%. The decrease was primarily due to lower origination volume and lower average transaction fees in the first quarter of 2017 compared to the fourth quarter of 2016.
Investor Fees
The table below illustrates the composition of investor fees by investment channel for each period presented:
Three Months Ended | Change (%) | ||||||||||||||||
March 31, 2017 | December 31, 2016 | March 31, 2016 | Q1 2017 vs Q1 2016 | Q1 2017 vs Q4 2016 | |||||||||||||
Investor fees – whole loans sold | $ | 12,210 | $ | 17,347 | $ | 11,809 | 3 | % | (30 | )% | |||||||
Investor fees – notes, certificates, and self-directed accounts | 7,812 | 7,120 | 6,517 | 20 | % | 10 | % | ||||||||||
Investor fees – Funds and separately managed accounts (1) | 1,158 | 1,560 | 2,161 | (46 | )% | (26 | )% | ||||||||||
Total investor fees | $ | 21,180 | $ | 26,027 | $ | 20,487 | 3 | % | (19 | )% | |||||||
(1) | Funds are the private funds for which LCA acts as general partner. |
For each investment channel, the Company receives fees to compensate us for the costs we incur in servicing the related loan, including managing payments from borrowers, collections, payments to investors, maintaining investors’ account portfolios, and providing information and issuing monthly statements. Additionally, the investor fees earned from the Funds and separately managed accounts compensate us for the management and advisory services we provide related to the investment portfolios of these investors. The amount of investor fee revenue earned is predominantly affected by the various servicing rates paid by whole loan, note, and self-directed investors, the outstanding principal balance of whole loans and loans underlying notes and certificates serviced, and the amount of principal and interest collected from borrowers and remitted to note, self-directed, and certain certificate investors.
Investor fee revenue related to whole loans sold also includes the change in fair value of our servicing assets and liabilities associated with the loans. Servicing rights are recorded as either an asset or liability depending on the degree to which the contractual loan servicing fee is above or below, respectively, an estimated market rate loan servicing fee. The change in fair value of servicing rights does not affect the contractual fees that we collect monthly from the whole loan investors.
Investor fee revenue related to the servicing of whole loans sold was $12.2 million and $11.8 million for the first quarters of 2017 and 2016, respectively, an increase of 3%. The increase in revenue was due to a higher balance of whole loans serviced and increase in collection fees in the first quarter of 2017 compared to the first quarter of 2016. Additionally, investor fees for whole loans sold in the first quarter of 2016 include a positive valuation adjustment of the Company's servicing assets of $4.0 million. Investor fee revenue related to the servicing of whole loans sold was $12.2 million and $17.3 million for the first quarter of 2017 and fourth quarter of 2016, respectively, a decrease of 30%. This decrease was due to a positive valuation adjustment on the Company's servicing assets of $4.3 million that occurred in the fourth quarter of 2016.
34
LENDINGCLUB CORPORATION
Management's Discussion and Analysis of Financial Condition and Results of Operations
(Tabular Amounts in Thousands, Except Share and Per Share Data and Ratios, or as Noted)
Investor fee revenue related to the servicing of underlying notes, certificates, and self-directed accounts was $7.8 million and $6.5 million for the first quarters of 2017 and 2016, respectively, an increase of 20%. Investor fee revenue related to the servicing of loans underlying notes, certificates, and self-directed accounts was $7.8 million and $7.1 million for the first quarter of 2017 and fourth quarter of 2016, respectively, an increase of 10%. The increase in revenue in both periods was due to an increase in the principal and interest payments processed on notes, increase in collection fees and an increase in self-directed fees in the first quarter of 2017 compared to the first quarter of 2016 and fourth quarter of 2016.
Investor fees related to the Funds and separately managed accounts in the first quarter of 2017 decreased $1.0 million from the first quarter of 2016, a decrease of 46%. This decrease was primarily due to a 35% decrease in the average assets underlying these investment channels. Investor fees related to the Funds and separately managed accounts in the first quarter of 2017 decreased $0.4 million from the fourth quarter of 2016, a decrease of 26%. This decrease was primarily due to a 13% decrease in the average assets underlying these investment channels. We currently anticipate that the assets under management associated with the Funds will continue to decrease as a result of a significant amount of redemption requests received during 2016 and into the first quarter of 2017. This potential reduction will negatively affect management fee revenue. In July 2016, certain of the Funds ceased receiving contributions and limited redemption requests pursuant to the terms of the respective limited partnership agreements.
Other Revenue (Expense)
Other revenue (expense) primarily consists of gains and losses on sales of whole loans, fair value adjustments on loans, notes and certificates, and referral revenue. In connection with whole loan sales, in addition to the transaction and investor fees earned with respect to the corresponding loan, we recognize a gain or loss on the sale of that loan based on the degree to which the contractual loan servicing fee is above or below an estimated market rate loan servicing fee. Referral revenue consists of fees earned from third-party companies when customers referred by us complete specified actions with such third-party companies.
The table below illustrates the composition of other revenue for each period presented:
Three Months Ended | Change (%) | |||||||||||||||||
March 31, 2017 | December 31, 2016 | March 31, 2016 | Q1 2017 vs Q1 2016 | Q1 2017 vs Q4 2016 | ||||||||||||||
Gain (loss) on sales of loans (1) | $ | 1,892 | $ | 115 | $ | 4,699 | (60 | )% | N/M | |||||||||
Referral revenue | 1,406 | 1,344 | 1,532 | (8 | )% | 5 | % | |||||||||||
Net fair value adjustments on Loans, Notes and Certificates | (1,417 | ) | (1,265 | ) | (167 | ) | N/M | 12 | % | |||||||||
Other | 340 | 148 | 39 | N/M | 130 | % | ||||||||||||
Other revenue (expense) (2) | $ | 2,221 | $ | 342 | $ | 6,103 | (64 | )% | N/M | |||||||||
N/M | Not meaningful. |
(1) | Presented net of credit support agreement expense in the first quarter of 2017 and fourth quarter of 2016. |
(2) | Prior period amounts have been reclassified to conform to the current period presentation. See “Part I – Financial Information – Item 1 – Financial Statements – Note 1. Basis of Presentation” for additional information. |
Quarter Over Quarter: Other revenue (expense) was $2.2 million and $6.1 million for the first quarters of 2017 and 2016, respectively. The decrease was primarily due to a decrease in the gain on sale of loans resulting from providing a credit support agreement to a whole loan investor and losses from fair value adjustments on loans purchased for which there were no offsetting gains from fair value adjustments.
35
LENDINGCLUB CORPORATION
Management's Discussion and Analysis of Financial Condition and Results of Operations
(Tabular Amounts in Thousands, Except Share and Per Share Data and Ratios, or as Noted)
Sequential: Other revenue (expense) was $2.2 million and $0.3 million for the first quarter of 2017 and fourth quarter of 2016, respectively. The increase was primarily due to an increase on the gain on sales of loans as a result of a higher volume of loans sold and change in investor mix, partially offset by a reimbursement to an investor pursuant to a credit support agreement in the first quarter of 2017, as described above.
Net Interest Income (Expense)
We generally do not assume principal or interest rate risk on loans facilitated through our marketplace because loan balances, interest rates and maturities are matched and offset by an equal balance of notes or certificates with the exact same interest rates and maturities. As a result, on our statement of operations for any period and balance sheet as of any date, (i) interest income on loans corresponds to the interest expense on notes and certificates and (ii) loan balances correspond to note and certificate balances with variations resulting from timing differences between the crediting of principal and interest payments on loans and the disbursement of those payments to note and certificate holders. Interest income on loans not funded by a note or certificate is recorded in the condensed consolidated statement of operations without corresponding interest expense. We expect interest income to increase as we use our capital for strategic business purposes such as investing in and holding loans on balance sheet for future sponsored securitization transactions.
Additionally, interest income includes interest income earned on cash and cash equivalents and the securities available for sale portfolio. Our investment policy and strategy is focused first on the preservation of capital and supporting our liquidity requirements, and then maximizing returns. The following tables provide additional detail related to net interest income (expense):
Three Months Ended | Change (%) | |||||||||||||||||
March 31, 2017 | December 31, 2016 | March 31, 2016 | Q1 2017 vs Q1 2016 | Q1 2017 vs Q4 2016 | ||||||||||||||
Interest income: | ||||||||||||||||||
Loans and loans held for sale | $ | 159,488 | $ | 165,867 | $ | 176,644 | (10 | )% | (4 | )% | ||||||||
Securities available for sale | 940 | 942 | 742 | 27 | % | — | % | |||||||||||
Cash and cash equivalents | 568 | 421 | 493 | 15 | % | 35 | % | |||||||||||
Total interest income | 160,996 | 167,230 | 177,879 | (9 | )% | (4 | )% | |||||||||||
Interest expense: | ||||||||||||||||||
Notes and certificates | (158,607 | ) | (164,645 | ) | (176,683 | ) | (10 | %) | (4 | )% | ||||||||
Total interest expense | (158,607 | ) | (164,645 | ) | (176,683 | ) | (10 | %) | (4 | )% | ||||||||
Net interest income (expense) | $ | 2,389 | $ | 2,585 | $ | 1,196 | 100 | % | (8 | )% | ||||||||
Average outstanding balances: | ||||||||||||||||||
Loans | $ | 4,393,061 | $ | 4,605,933 | $ | 4,858,954 | (10 | )% | (5 | )% | ||||||||
Loans held for sale | $ | 8,122 | $ | 9,909 | $ | — | N/M | (18 | )% | |||||||||
Notes and certificates | $ | 4,410,812 | $ | 4,616,722 | $ | 4,876,021 | (10 | )% | (4 | )% | ||||||||
N/M - Not meaningful.
Quarter Over Quarter: Interest income from loans and loans held for sale was $159.5 million and $176.6 million for the first quarters of 2017 and 2016, respectively. The decrease in interest income on loans was primarily due to the decrease in the average outstanding balances of loans.
36
LENDINGCLUB CORPORATION
Management's Discussion and Analysis of Financial Condition and Results of Operations
(Tabular Amounts in Thousands, Except Share and Per Share Data and Ratios, or as Noted)
Sequential: Interest income from loans and loans held for sale was $159.5 million and $165.9 million for the first quarter of 2017 and fourth quarter of 2016, respectively. The decrease in interest income on loans was primarily due to the decrease in the average outstanding balance of loans.
Quarter Over Quarter: Interest expense for notes and certificates was $158.6 million and $176.7 million for the first quarters of 2017 and 2016, respectively. The decrease in interest expense was primarily due to the decrease in the average outstanding balances of notes and certificates.
Sequential: Interest expense for notes and certificates was $158.6 million and $164.6 million for the first quarter of 2017 and fourth quarter of 2016, respectively. The decrease in interest expense was primarily due to the decrease in the average outstanding balances of notes and certificates.
Operating Expenses
Our operating expenses consist of sales and marketing, origination and servicing, engineering and product development and other general and administrative expenses as described below.
Sales and Marketing: Sales and marketing expense consists primarily of borrower and investor acquisition efforts including costs attributable to marketing and selling our products. This includes costs of building general brand awareness, and salaries, benefits and stock-based compensation expense related to our sales and marketing team.
Origination and Servicing: Origination and servicing expense consists of salaries, benefits and stock-based compensation expense and vendor costs attributable to activities that most directly relate to originating and servicing loans for borrowers and investors. These costs relate to the credit, collections, customer support and payment processing teams and related vendors.
Engineering and Product Development: Engineering and product development expense consists primarily of salaries, benefits and stock-based compensation expense for engineering and product management teams, and the cost of contractors who work on the development and maintenance of our platform. Engineering and product development expense also includes non-capitalized hardware and software costs and depreciation and amortization of technology assets.
Other General and Administrative: Other general and administrative expense consists primarily of salaries, benefits and stock-based compensation expense for our accounting, finance, legal, risk, compliance, human resources and facilities teams, professional services fees and facilities expense.
After announcing the findings of our board review, and the significant decrease in the trading price of our common stock in May 2016, we offered incentive retention awards to certain members of the executive management team and other key personnel that totaled $34.9 million that will be recognized as compensation expense ratably through May 2017. In addition, we have incurred and expect to continue to incur significant legal and other expenses in connection with the inquiries and private litigation that have arisen and may continue to arise from the internal board review, and our response to ongoing governmental requests for information.
37
LENDINGCLUB CORPORATION
Management's Discussion and Analysis of Financial Condition and Results of Operations
(Tabular Amounts in Thousands, Except Share and Per Share Data and Ratios, or as Noted)
Three Months Ended | Change (%) | |||||||||||||||||
March 31, 2017 | December 31, 2016 | March 31, 2016 | Q1 2017 vs Q1 2016 | Q1 2017 vs Q4 2016 | ||||||||||||||
Sales and marketing | $ | 54,583 | $ | 55,457 | $ | 66,575 | (18 | )% | (2 | )% | ||||||||
Origination and servicing | 20,449 | 18,296 | 19,198 | 7 | % | 12 | % | |||||||||||
Engineering and product development | 35,760 | 32,522 | 24,198 | 48 | % | 10 | % | |||||||||||
Other general and administrative | 43,574 | 56,740 | 38,035 | 15 | % | (23 | )% | |||||||||||
Total operating expenses | $ | 154,366 | $ | 163,015 | $ | 148,006 | 4 | % | (5 | )% | ||||||||
Sales and marketing expense was $54.6 million and $66.6 million for the first quarters of 2017 and 2016, respectively, a decrease of 18%. The decrease was primarily due to a $12.6 million decrease in variable marketing expenses, offset by an increase of $1.2 million in personnel-related expenses associated with retention costs and higher headcount levels. Sales and marketing expense as a percent of loan originations was 2.8% in the first quarter of 2017 compared to 2.4% in the first quarter of 2016. A portion of this increase is attributable to the fact that credit policies were tightened resulting in an increase of applications that were declined, thus increasing the cost per acquisition of a new borrower. We expect sales and marketing expense as a percent of loan originations in 2017 to remain at levels generally in line with the prior quarter in the intermediate term and flatten toward the end of 2017.
On a sequential basis, sales and marketing expense was $54.6 million and $55.5 million for the first quarter of 2017 and fourth quarter of 2016, respectively, a decrease of 2%. As a percent of originations, sales and marketing expense remained constant at 2.8% in both the first quarter of 2017 and fourth quarter of 2016.
Origination and servicing expense was $20.4 million and $19.2 million for the first quarters of 2017 and 2016, respectively, an increase of 7%. The increase was primarily due to a $2.5 million increase in personnel-related expenses associated with higher headcount levels, partially offset by a $1.3 million decrease in loan processing costs driven by lower loan originations.
On a sequential basis, origination and servicing expense was $20.4 million and $18.3 million for the first quarter of 2017 and fourth quarter of 2016, respectively, an increase of 12%. The increase was primarily due to a $1.4 million increase in personnel-related expenses associated with higher headcount levels.
Engineering and product development expense was $35.8 million and $24.2 million for the first quarters of 2017 and 2016, respectively, an increase of 48%. The increase was primarily driven by continued investment in technology and platform improvements that are focused on enhancing our credit decisioning capabilities, internal testing environment and cloud infrastructure, which included a $7.4 million increase in personnel-related expenses resulting from increased headcount, salaries and retention costs, and a $4.3 million increase in equipment, software and depreciation expense primarily related to increased capitalization of internally developed software.
We capitalized $11.4 million and $9.7 million in software development costs in the first quarters of 2017 and 2016, respectively.
On a sequential basis, engineering and product development expense was $35.8 million and $32.5 million for the first quarter of 2017 and fourth quarter of 2016, respectively, and increase of 10%. The increase was primarily driven by continued investment in technology and platform improvements that are focused on enhancing our credit decisioning capabilities, internal testing environment and cloud infrastructure, which included a $1.9 million increase in personnel-related expenses resulting from increased headcount and increased salaries, and a $0.9 million increase in equipment, software and depreciation expense.
38
LENDINGCLUB CORPORATION
Management's Discussion and Analysis of Financial Condition and Results of Operations
(Tabular Amounts in Thousands, Except Share and Per Share Data and Ratios, or as Noted)
Other general and administrative expense was $43.6 million and $38.0 million for the first quarters of 2017 and 2016, respectively, an increase of 15%. The increase was primarily driven by a $7.6 million increase in professional services related to legal, audit, communications, and advisory fees, a $4.2 million increase in salaries and stock-based compensation expense related to increased headcount, salaries of newly hired executives as we invested in infrastructure and support teams, and retention costs, and a $1.5 million increase in facilities expense. These increases were partially offset by a $9.6 million insurance reimbursement for certain legal expenses incurred as a result of the Company's board review and related governmental and regulatory inquiries.
On a sequential basis, other general and administrative expense was $43.6 million and $56.7 million for the first quarter of 2017 and fourth quarter of 2016, respectively, a decrease of 23%. The decrease was primarily driven by a $2.8 million decrease in professional services related to legal, audit, communications, and advisory fees and a $9.9 million insurance reimbursement for certain legal expenses incurred as a result of the Company's board review and related governmental and regulatory inquiries.
Income Taxes
We continued to recognize a full valuation allowance against net deferred tax assets. This determination was based on the assessment of the available positive and negative evidence to estimate if sufficient future taxable income will be generated to utilize the existing deferred tax assets. As of March 31, 2017 and December 31, 2016, the valuation allowance was $131.8 million and $75.3 million, respectively. The increase in the valuation allowance is due to the adoption of ASU 2016-09, which increased our deferred tax assets for previously unrecognized excess tax benefits associated with the exercise of stock options and the vesting of RSUs.
Non-GAAP Financial Measures
We use certain non-GAAP financial measures in evaluating our operating results. We believe that contribution, contribution margin, adjusted EBITDA, adjusted EBITDA margin, and servicing fees before changes in fair value of assets and liabilities help identify trends in our core business results and allow for greater transparency with respect to key metrics used by our management in its decision making.
Our non-GAAP measures of contribution, contribution margin, adjusted EBITDA, adjusted EBITDA margin, and investor fees before changes in fair value of assets and liabilities have limitations as analytical tools and you should not consider them in isolation. These non-GAAP measures should not be viewed as substitutes for, or superior to, net income (loss) as prepared in accordance with GAAP. In evaluating these non-GAAP measures, you should be aware that in the future we will incur expenses similar to the adjustments in this presentation. There are a number of limitations related to the use of these non-GAAP financial measures versus their most directly comparable GAAP measures, which include the following:
• | Other companies, including companies in our industry, may calculate these measures differently, which may reduce their usefulness as a comparative measure. |
• | These measures do not consider the potentially dilutive impact of stock-based compensation. |
• | Although depreciation and amortization are non-cash charges, the assets being depreciated and amortized may have to be replaced in the future and adjusted EBITDA and adjusted EBITDA margin do not reflect cash capital expenditure requirements for such replacements or for new capital expenditure requirements. |
• | Adjusted EBITDA and adjusted EBITDA margin do not reflect tax payments that may represent a reduction in cash available to us. |
39
LENDINGCLUB CORPORATION
Management's Discussion and Analysis of Financial Condition and Results of Operations
(Tabular Amounts in Thousands, Except Share and Per Share Data and Ratios, or as Noted)
Contribution and Contribution Margin
Contribution is a non-GAAP financial measure that is calculated as net revenue less “sales and marketing” and “origination and servicing” expenses on the Company’s Statement of Operations, adjusted to exclude non-cash stock-based compensation expense within these captions. These costs represent the costs that are most directly related to generating such revenue. Contribution Margin is a non-GAAP financial measure calculated by dividing Contribution by total net revenue.
Contribution and Contribution Margin are measures of overall direct product profitability that our management and board of directors find useful, and believe investors may find useful, in understanding the relationship between costs most directly associated with revenue generating activities and the related revenue, and remaining amount available to support our costs of engineering and product development and other general and administrative expense to evaluate our operating performance and trends. While we believe Contribution and Contribution Margin are useful for the reasons above, they should not be used as an overall measure of our profitability, as they exclude engineering and product development and other general and administrative expenses that are required to run our business. Factors that affect our Contribution and Contribution Margin include revenue mix, variable marketing expenses and origination and servicing expenses.
The following table shows the calculation of contribution and contribution margin:
Three Months Ended | |||||||||||
March 31, 2017 | December 31, 2016 | March 31, 2016 | |||||||||
Total net revenue | $ | 124,482 | $ | 130,522 | $ | 152,294 | |||||
Less: Sales and marketing expense | 54,583 | 55,457 | 66,575 | ||||||||
Less: Origination and servicing expense | 20,449 | 18,296 | 19,198 | ||||||||
Total direct expenses | $ | 75,032 | $ | 73,753 | $ | 85,773 | |||||
Add: Stock-based compensation (1) | $ | 3,715 | $ | 3,967 | $ | 2,650 | |||||
Contribution (2) | $ | 53,165 | $ | 60,736 | $ | 69,171 | |||||
Contribution margin (2) | 42.7 | % | 46.5 | % | 45.4 | % | |||||
(1) | Contribution excludes stock-based compensation expense included in the sales and marketing and origination and servicing expense categories. |
(2) | Beginning in the first quarter of 2017, contribution includes interest revenue to capture the full spectrum of revenue we expect to generate. Prior period amounts have been reclassified to conform to the current period presentation. |
40
LENDINGCLUB CORPORATION
Management's Discussion and Analysis of Financial Condition and Results of Operations
(Tabular Amounts in Thousands, Except Share and Per Share Data and Ratios, or as Noted)
The following table presents a reconciliation of net income (loss) to contribution for each of the periods indicated:
Three Months Ended | |||||||||||
March 31, 2017 | December 31, 2016 | March 31, 2016 | |||||||||
Net income (loss) | $ | (29,844 | ) | $ | (32,269 | ) | $ | 4,137 | |||
Engineering and product development expense | 35,760 | 32,522 | 24,198 | ||||||||
Other general and administrative expense | 43,574 | 56,740 | 38,035 | ||||||||
Stock-based compensation expense(1) | 3,715 | 3,967 | 2,650 | ||||||||
Income tax (benefit) expense | (40 | ) | (224 | ) | 151 | ||||||
Contribution (2) | $ | 53,165 | $ | 60,736 | $ | 69,171 | |||||
Total net revenue | $ | 124,482 | $ | 130,522 | $ | 152,294 | |||||
Contribution margin (2) | 42.7 | % | 46.5 | % | 45.4 | % | |||||
(1) | Contribution excludes stock-based compensation expense included in the sales and marketing and origination and servicing expense categories. |
(2) | Beginning in the first quarter of 2017, contribution includes interest revenue to capture the full spectrum of revenue we expect to generate. Prior period amounts have been adjusted to conform to the current period presentation. |
Adjusted EBITDA and Adjusted EBITDA Margin
Adjusted EBITDA is a non-GAAP financial measure defined as net income (loss) before (1) depreciation and amortization expense, (2) stock-based compensation expense, (3) income tax (benefit) expense, (4) acquisition related expenses, and (5) other non-recurring expenses, if any, including goodwill impairments. Adjusted EBITDA margin is a non-GAAP financial measure calculated by dividing adjusted EBITDA by total net revenue.
We believe that adjusted EBITDA is an important measure of operating performance because it allows management, investors and our board to evaluate and compare our core operating results, including our return on capital and operating efficiencies, from period to period by removing the impact of asset base (depreciation and amortization), other non-operating, and share-based compensation, tax consequences, and our capital structure (interest expense from any outstanding debt). Additionally, we utilize Adjusted EBITDA as an operating performance measure as an input into the Company’s calculation of the annual bonus plan. In addition to its use by management, Adjusted EBITDA is a measure widely used by securities analysts, investors and others to evaluate the financial performance of our company and other companies in our industry as well as in the broader financial services and technology industries.
41
LENDINGCLUB CORPORATION
Management's Discussion and Analysis of Financial Condition and Results of Operations
(Tabular Amounts in Thousands, Except Share and Per Share Data and Ratios, or as Noted)
The following table presents a reconciliation of net income (loss) to Adjusted EBITDA for each of the periods indicated:
Three Months Ended | |||||||||||
March 31, 2017 | December 31, 2016 | March 31, 2016 | |||||||||
Net income (loss) | $ | (29,844 | ) | $ | (32,269 | ) | $ | 4,137 | |||
Acquisition and related expense | 293 | 294 | 293 | ||||||||
Depreciation expense: | |||||||||||
Engineering and product development | 7,794 | 6,134 | 4,493 | ||||||||
Other general and administrative | 1,298 | 1,213 | 906 | ||||||||
Amortization of intangible assets | 1,162 | 1,161 | 1,256 | ||||||||
Stock-based compensation expense | 19,498 | 22,811 | 15,021 | ||||||||
Income tax (benefit) expense | (40 | ) | (224 | ) | 151 | ||||||
Adjusted EBITDA (1) | $ | 161 | $ | (880 | ) | $ | 26,257 | ||||
Total net revenue | $ | 124,482 | $ | 130,522 | $ | 152,294 | |||||
Adjusted EBITDA margin (1) | 0.1 | % | (0.7 | )% | 17.2 | % | |||||
(1) | Beginning in the first quarter of 2017, adjusted EBITDA includes interest revenue to capture the full spectrum of revenue we expect to generate. Prior period amounts have been adjusted to conform to the current period presentation. |
Operating expenses include the following amounts of stock based compensation for the periods presented:
Three Months Ended | |||||||||||
March 31, 2017 | December 31, 2016 | March 31, 2016 | |||||||||
Sales and marketing | $ | 2,299 | $ | 2,530 | $ | 1,904 | |||||
Origination and servicing | 1,416 | 1,437 | 746 | ||||||||
Engineering and product development | 6,588 | 6,724 | 3,723 | ||||||||
Other general and administrative | 9,195 | 12,120 | 8,648 | ||||||||
Total stock-based compensation expense | $ | 19,498 | $ | 22,811 | $ | 15,021 | |||||
Investor Fees Before Changes in Fair Value of Servicing Assets and Liabilities
Investor fee revenue associated with the servicing portfolio, excluding fair market value accounting adjustments, is a non-GAAP financial measure that is calculated as investor fees less the fair market value accounting adjustment. We account for servicing assets and liabilities at fair value with changes in fair value recorded through earnings in the period of change. We believe this is a useful non-GAAP financial measure because it reflects the amount of fees actually collected. We believe that the fair value adjustments to the servicing assets and liabilities is less useful in particular because the Company does not trade or transfer such servicing assets or liabilities.
42
LENDINGCLUB CORPORATION
Management's Discussion and Analysis of Financial Condition and Results of Operations
(Tabular Amounts in Thousands, Except Share and Per Share Data and Ratios, or as Noted)
The following table presents a reconciliation of investor fees to investor fees before change in fair value of servicing assets and liabilities:
Three Months Ended | |||||||||||
March 31, 2017 | December 31, 2016 | March 31, 2016 | |||||||||
Investor fees | $ | 21,180 | $ | 26,027 | $ | 20,487 | |||||
Change in fair value of servicing assets and liabilities | 3,238 | (3,160 | ) | (2,310 | ) | ||||||
Investor fees before change in fair value of servicing assets and liabilities | $ | 24,418 | $ | 22,867 | $ | 18,177 | |||||
Investments by Investment Channel and Investor Concentration
The following table shows the percentage of loan originations funded by investment channel for the periods presented:
March 31, 2017 | December 31, 2016 | September 30, 2016 | June 30, 2016 | March 31, 2016 | |||||||||||
Originations by Investor Type: | |||||||||||||||
Managed accounts | 33 | % | 43 | % | 55 | % | 35 | % | 30 | % | |||||
Self-directed | 15 | % | 13 | % | 14 | % | 17 | % | 15 | % | |||||
Banks | 40 | % | 31 | % | 13 | % | 28 | % | 34 | % | |||||
Other institutional investors | 12 | % | 13 | % | 18 | % | 20 | % | 21 | % | |||||
Total | 100 | % | 100 | % | 100 | % | 100 | % | 100 | % | |||||
Managed accounts include the private funds managed by LCA, dedicated third-party funds and separately management accounts. Self-directed investors include our self-directed retail investor base. Banks are deposit taking institutions, while other institutional investors include asset managers, insurance companies, hedge funds and other large non-bank investors.
The following table provides the percentage of loans invested in by the ten largest investors during each of the previous five quarters (by dollars invested):
March 31, 2017 | December 31, 2016 | September 30, 2016 | June 30, 2016 | March 31, 2016 | |||||||||||
Percentage of Loans Invested In by Ten Largest Investors (by $ invested) | 61 | % | 68 | % | 72 | % | 62 | % | 51 | % | |||||
For the quarter ended March 31, 2017, no single investor accounted for more than 18% of the loans invested in through our marketplace. The composition of the top ten investors may vary from period to period. In addition to these investors, private funds associated with LCA and publicly issued member payment dependent notes accounted for approximately 1% and 17%, respectively, of investment capital provided through our marketplace during the period.
43
LENDINGCLUB CORPORATION
Management's Discussion and Analysis of Financial Condition and Results of Operations
(Tabular Amounts in Thousands, Except Share and Per Share Data and Ratios, or as Noted)
For the quarter ended March 31, 2016, no single investor accounted for more than 11% of the loans invested in through our marketplace. In addition to these investors, private funds associated with LCA and publicly issued member payment dependent notes accounted for approximately 5% and 16%, respectively, of investment capital provided through our marketplace during the period.
Effectiveness of Scoring Models
Our ability to attract borrowers and investors to our marketplace is significantly dependent on our platform’s ability to effectively evaluate a borrower’s credit profile and likelihood of default.
Our marketplace’s credit decisioning and scoring models are evaluated on a regular basis and the additional data on loan history experience, borrower behavior, economic factors and prepayment trends that we accumulate are leveraged to continually improve the models. We believe we have a history of effectively evaluating borrower’s credit worthiness and likelihood of defaults, as evidenced by the performance of various loan vintages facilitated through our marketplace. If our marketplace's credit decisioning and scoring models ultimately prove to be ineffective, or fail to appropriately account for a decline in the macroeconomic environment, investors may experience higher than expected losses and lose confidence in our business. The following charts display the historical lifetime cumulative net charge-off rates (expressed as a percent of original loan balances) through March 31, 2017, by booking year, for all grades and 36 or 60 month terms of standard program loans for each of the years shown:
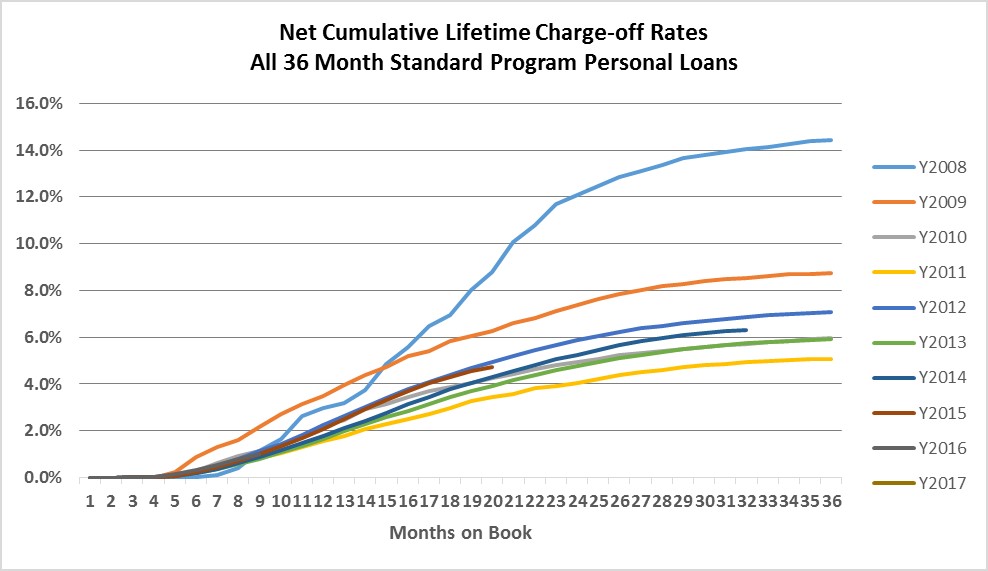
44
LENDINGCLUB CORPORATION
Management's Discussion and Analysis of Financial Condition and Results of Operations
(Tabular Amounts in Thousands, Except Share and Per Share Data and Ratios, or as Noted)
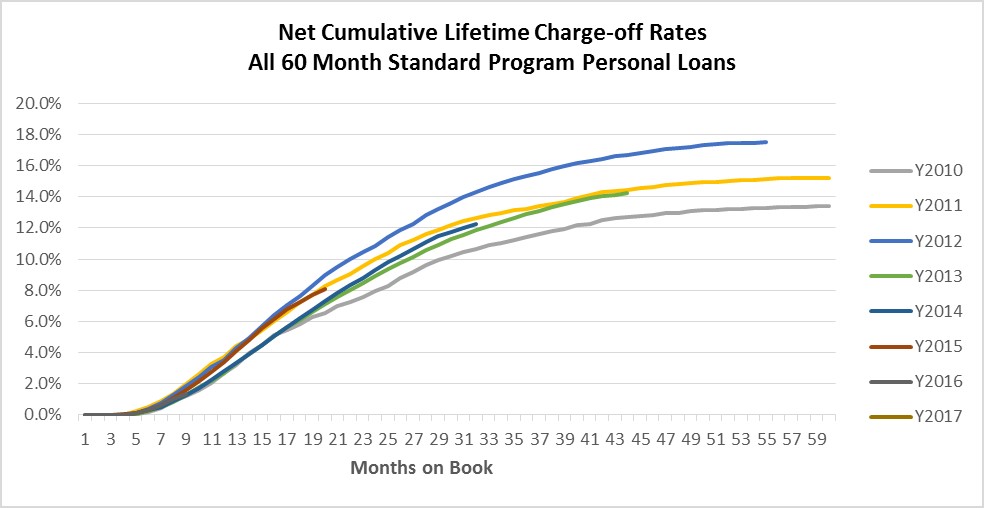
Loan Portfolio Information and Credit Metrics
We classify the loans held on our balance sheet into three major loan products: standard program personal loans, custom program personal loans and other loans. The majority of the loans facilitated on our platform and retained on the balance sheet are standard program personal loans which represent loans made to prime borrowers that are publicly available to note investors and through certificates to private investors. Custom program personal loans include all other personal loans that are not eligible for our standard program and are available only to private investors. Other loans is comprised of education and patient finance loans, small business loans, small business lines of credit, and auto refinance loans. The loans held on our balance sheet are financed by notes issued by us, certificates issued by the Trust, or certificates invested in directly by us.
Fair Value and Delinquencies
The outstanding principal balance, fair value and percentage of these loans that are delinquent, by loan product are as follows:
March 31, 2017 | December 31, 2016 | ||||||||||||||
(in millions, except percentages) | Outstanding Principal Balance | Fair Value (2) | Delinquent Loans (2) | Outstanding Principal Balance | Fair Value (2) | Delinquent Loans (2) | |||||||||
Personal loans - standard program | $ | 4,078.5 | 93.5 | % | 3.0 | % | $ | 4,290.4 | 94.6 | % | 3.2 | % | |||
Personal loans - custom program | 228.4 | 91.3 | 5.1 | 267.4 | 91.4 | 5.6 | |||||||||
Other loans (1) | 15.1 | 96.4 | 5.1 | 17.2 | 96.8 | 2.8 | |||||||||
Total | $ | 4,322.0 | 93.4 | % | 3.1 | % | $ | 4,575.0 | 94.5 | % | 3.3 | % | |||
(1) Components of other loans are less than 10% of the outstanding principal balance presented individually.
(2) Expressed as a percent of outstanding principal balance.
45
LENDINGCLUB CORPORATION
Management's Discussion and Analysis of Financial Condition and Results of Operations
(Tabular Amounts in Thousands, Except Share and Per Share Data and Ratios, or as Noted)
Declines in the fair value of loans from December 31, 2016 to March 31, 2017 were primarily due to increases in the yields required by investors to purchase our loans, notes and certificates, and an increase in expected credit losses.
Net Annualized Charge-Off Rates
The following tables show annualized net charge-off rates, which is an alternative measure of the performance of the loans held in our portfolio from the graphs above. Net cumulative lifetime charge-off rates used above show total charge-offs as a function of original principal balance, while these tables show the annualized net charge-off rates that reflect the charged-off balance of loans in a specific period as a percentage of the average outstanding balance of the loans during the periods presented.
Net annualized charge-off rates are affected by the average age of the loans in the portfolio for a given quarter and the credit performance of the loans. We generally expect charge-off rates to increase with loan age, as new loans generally have fewer credit losses than seasoned loans. Annualized charge-off rates can also be affected by changes in the credit performance of loans that are outstanding for a given quarter. Additionally, in any particular quarter the portfolios include loans from past vintages that were originated under prior credit underwriting parameters, and thus do not reflect the current credit underwriting models used to originate new loans.
The annualized net charge-off rates for personal loans for both standard and custom programs in total for the last five quarters are as follows:
Total Platform (1) | March 31, 2017 | December 31, 2016 | September 30, 2016 | June 30, 2016 | March 31, 2016 | |||||
Personal Loans - Standard Program: | ||||||||||
Annualized net charge-off rate | 8.5 | % | 8.0 | % | 6.1 | % | 4.9 | % | 5.0 | % |
Weighted average age in months | 12.5 | 12.0 | 11.3 | 10.3 | 9.5 | |||||
Personal Loans - Custom Program: | ||||||||||
Annualized net charge-off rate | 15.7 | % | 14.6 | % | 11.0 | % | 8.6 | % | 8.2 | % |
Weighted average age in months | 10.5 | 9.8 | 9.1 | 8.4 | 7.3 | |||||
Loans retained on balance sheet | March 31, 2017 | December 31, 2016 | September 30, 2016 | June 30, 2016 | March 31, 2016 | |||||
Personal Loans - Standard Program: | ||||||||||
Annualized net charge-off rate | 10.9 | % | 10.4 | % | 8.2 | % | 6.5 | % | 6.2 | % |
Weighted average age in months | 14.2 | 13.5 | 12.9 | 12.1 | 10.9 | |||||
Personal Loans - Custom Program: | ||||||||||
Annualized net charge-off rate | 19.6 | % | 19.1 | % | 14.0 | % | 8.2 | % | 5.6 | % |
Weighted average age in months | 14.3 | 12.4 | 10.9 | 8.4 | 5.8 | |||||
(1) | Total platform comprises all loans facilitated through the marketplace including whole loans sold and loans financed by notes and certificates. |
The increase in the annualized net charge-off rates reflects the current average age of the loans in conjunction with higher observed actual charge-offs. In 2016 and into the first quarter of 2017, we observed higher delinquencies and
46
LENDINGCLUB CORPORATION
Management's Discussion and Analysis of Financial Condition and Results of Operations
(Tabular Amounts in Thousands, Except Share and Per Share Data and Ratios, or as Noted)
charge-offs in populations characterized by high indebtedness, an increased propensity to accumulate debt, and lower credit scores.
An increase in the average age of the loans has also contributed to the increase in charge-off rates. Prior to 2016, our loan portfolios grew significantly as the volume of loans facilitated increased. As a result, the average age of the portfolio, and with it the average charge-off rate, stayed low during this prior period. In 2016, loan originations grew at a slower rate, causing the average loan age to increase resulting in an increase in the aggregate annualized charge-off rate. See “Current Economic and Business Environment” for further discussion regarding how we responded to these observations and credit performance by implementing changes to the credit model, increasing interest rates and supplementing collections efforts.
The annualized net charge-off rates for standard program loans are higher for loans retained on our balance sheet compared to loans reflected at the total platform level for each quarter because of a difference in grade distribution for the two portfolios. The proportion of grade A and B loans is approximately 30% of the retained loan portfolio compared to approximately 41% for the total platform level as of March 31, 2017. This difference in loan grade distribution results in higher net charge-off rates for the loans on the balance sheet, as grade A and B loans have lower expected and actual credits losses.
Regulatory Environment
As a result of our internal board review and resignation of our former CEO, we have received inquiries from governmental entities, and we continue to cooperate fully. Responding to inquiries of this nature are costly and time consuming, can generate negative publicity, and could have a material and adverse effect on our business. See “Part I – Financial Information – Item 1 – Financial Statements – Note 14. Commitments and Contingencies” for further discussion regarding these inquiries.
In addition, there has been (and may continue to be) other litigation challenging lending arrangements where a bank or other third party has made a loan and then sells and assigns it to an entity that is engaged in assisting with the origination and servicing of a loan. In January 2017, the Colorado Administrator of the Uniform Consumer Credit Code filed suit against Avant, Inc., an online consumer loan platform. The Administrator asserts that loans to Colorado residents facilitated on the Avant platform were required to comply with Colorado laws regarding interest rates and fees, and that those laws were not preempted by federal laws that apply to loans originated by our banking partner, WebBank, a federally regulated bank. In March 2017, WebBank filed its own lawsuit in federal district court for the District of Colorado seeking declaratory relief that loans originated by WebBank are “valid when made” and are subject to federal requirements that pre-empt Colorado state requirements. No assurance can be given as to the timing or outcome of these matters, however, these matters could potentially impact the Company’s business, including the maximum interest rates and fees that can be charged and application of certain consumer protection statutes.
47
LENDINGCLUB CORPORATION
Management's Discussion and Analysis of Financial Condition and Results of Operations
(Tabular Amounts in Thousands, Except Share and Per Share Data and Ratios, or as Noted)
Liquidity and Capital Resources
Liquidity
The following table sets forth certain cash flow information for the periods presented:
Three Months Ended March 31, | |||||||
Condensed Cash Flow Information: | 2017 | 2016 | |||||
Net cash (used for) provided by operating activities | $ | (17,118 | ) | $ | 9,941 | ||
Cash flow related to loan investing activities (1) | 128,601 | (325,475 | ) | ||||
Cash flow related to all other investing activities | 61,399 | (30,522 | ) | ||||
Net cash provided by (used for) investing activities | 190,000 | (355,997 | ) | ||||
Cash flow related to note/certificate and secured borrowings financing (1) | (128,588 | ) | 322,212 | ||||
Cash flow used for all other financing activities | (25,445 | ) | (15,845 | ) | |||
Net cash (used for) provided by financing activities | (154,033 | ) | 306,367 | ||||
Net increase (decrease) in cash and cash equivalents | $ | 18,849 | $ | (39,689 | ) | ||
(1) | Cash flow related to loan investing activities includes the purchase of loans and repayment of loans facilitated through our marketplace. Cash flow related to note/certificate and secured borrowings financing activities includes the issuance of notes and certificates to investors and the repayment of those notes and certificates. These amounts generally correspond and offset each other. |
Our short-term liquidity needs generally relate to our working capital requirements. These liquidity needs are generally met through cash generated from the operations of facilitating loan originations. If we experience a pause in investor capital on our platform, cash generated from facilitating loan originations could decline, in which case we may need to use our cash and cash equivalents on hand, which was $534.5 million at March 31, 2017, to meet our working capital needs. Additionally, we had $246.9 million of available for sale securities at March 31, 2017. The net loss during the first quarter of 2017, and the payment of the 2016 corporate cash bonus in February 2017, resulted in negative operating cash flows for the quarter ended March 31, 2017. Generally, there has been no material impact on our liquidity position as of March 31, 2017 related to the purchase of loans during the first three months of 2017; as such, loans generally were invested in by proceeds from the issuance of corresponding notes and certificates, or such loans have been sold on the same day to whole loan investors.
Additionally, given the payment dependent structure of the notes and certificates, principal and interest payments on notes and certificates are paid only when received from borrowers on the corresponding retained loans, resulting in no material impact to our liquidity. During the first quarter of 2017, we purchased a total of $6.2 million of loans through the platform to fulfill contractual purchase obligations and support upcoming securitization initiatives. The outstanding principal balance of loans for which we remained invested in as of March 31, 2017 amounted to $26.6 million.
Cash and cash equivalents are primarily held in institutional money market funds, interest-bearing deposit accounts at investment grade financial institutions, certificates of deposit, and commercial paper. Cash and cash equivalents were $534.5 million and $515.6 million as of March 31, 2017 and December 31, 2016, respectively. Changes in the balance of cash and cash equivalents are generally a result of timing related to working capital requirements or investments in or out of our securities available for sale portfolio and changes in restricted cash and other investments.
48
LENDINGCLUB CORPORATION
Management's Discussion and Analysis of Financial Condition and Results of Operations
(Tabular Amounts in Thousands, Except Share and Per Share Data and Ratios, or as Noted)
Restricted cash consists primarily of bank deposit accounts and money market funds that are: (i) pledged to, or held in escrow at correspondent banks as security for transactions processed on or related to our platform or activities by certain investors; (ii) pledged through a credit support agreement with a certificate holder; (iii) held in a Rabbi Trust through a grantor trust agreement to satisfy obligations to partnerships under the 2016 Cash Retention Bonus Plan, or (iv) received from investors but not yet been applied to their accounts on the platform and transferred to segregated bank accounts that hold investors’ funds. Restricted cash was $148.9 million and $177.8 million at March 31, 2017 and December 31, 2016, respectively. The decrease in restricted cash is primarily attributable to a decrease in cash received from investors that has not yet been applied to their accounts.
We invest in securities classified as available for sale. The fair value of securities available for sale as of March 31, 2017 and December 31, 2016 was $246.9 million and $287.1 million, respectively. At March 31, 2017, these securities include corporate debt securities, certificates of deposit, asset-backed securities, commercial paper, U.S. agency securities, U.S. Treasury securities and other securities. All securities were rated investment grade (defined as a rating equivalent to a Moody’s rating of “Baa3” or higher, or a Standard & Poor’s rating of “BBB-” or higher) and there were no significant unrealized losses. These securities provided $0.9 million of interest income for both the first quarter of 2017 and the first quarter of 2016. These securities continue to be available to meet liquidity needs.
Our available liquidity resources may also be provided by external sources. On December 17, 2015, we entered into a credit and guaranty agreement with several lenders for an aggregate $120.0 million secured revolving credit facility (Credit Facility). In connection with the credit agreement, we entered into a pledge and security agreement with Morgan Stanley Senior Funding, Inc., as collateral agent. Proceeds of loans made under the Credit Facility may be borrowed, repaid and reborrowed until December 17, 2020. Repayment of any outstanding proceeds are payable on December 17, 2020, but may be prepaid without penalty. We did not have any loans outstanding under the Credit Facility during the first quarter of 2017.
Borrowings under the Credit Facility bear interest, at our option, at an annual rate based on LIBOR rate plus a spread of 1.75% to 2.00%, which is fixed for a Company-selected interest period of one, two, three, six or 12 months, or at an alternative base rate (which is tied to either the prime rate, federal funds effective rate, or the adjusted eurocurrency rate, as defined in the credit agreement). Base rate borrowings may be prepaid at any time without penalty, however pre-payment of LIBOR-based borrowings before the end of the selected interest period may result in us incurring expense to compensate the lenders for their funding costs through the end of the interest period. Interest is payable quarterly. Additionally, we are required to pay a quarterly commitment fee to the lenders of between 0.25% and 0.375% per annum, depending on our total net leverage ratio, on the average undrawn portion available under the revolving loan facility.
The Credit Facility and pledge and security agreement contain certain covenants applicable to us, including restrictions on the Company’s ability to pay dividends, incur indebtedness, pledge our assets, merge or consolidate, make investments, and enter into certain affiliate transactions. The Credit Facility required us to maintain a maximum total net leverage ratio (defined as the ratio of net debt to Adjusted EBITDA, on a consolidated basis for the four most recent Fiscal Quarter periods) of 4.00:1.00 initially, which decreases over the term of the Credit Facility to 3.00:1.00 on and after June 30, 2018 (on a consolidated basis). As of March 31, 2017, the total net leverage ratio, calculated as defined in the Credit Facility, was 0%.
On February 9, 2016, our board of directors approved a share repurchase program under which we may repurchase up to $150.0 million of our common shares in the open market or privately negotiated transactions in compliance with Securities and Exchange Act Rule 10b-18. This repurchase program expired on February 9, 2017 and did not obligate us to acquire any particular amount of common stock. During the first quarter of 2017, we did not repurchase any shares of our common stock. As of March 31, 2017, the Company does not have a share repurchase program.
49
LENDINGCLUB CORPORATION
Management's Discussion and Analysis of Financial Condition and Results of Operations
(Tabular Amounts in Thousands, Except Share and Per Share Data and Ratios, or as Noted)
While our business model is not dependent on using our balance sheet and assuming credit risk for loans facilitated by our marketplace, we may use a greater amount of our own capital, compared to past experience, to fulfill contractual obligations (Pool B loans and repurchase obligations), regulatory commitments (direct mail), short-term marketplace equilibrium, customer accommodations, or other needs. Additionally, we may also use our capital for strategic business purposes such as investing in and holding loans on balance sheet for future sponsored securitization transactions, and investing in loans associated with the testing or initial launch of new or alternative loan terms, programs, or channels, or to establish a track record of performance prior to facilitating third-party investments in such loans, programs, or channels. For a description of recent developments and their potential impact to our liquidity and capital resources, see “Current Economic and Business Environment” for further details.
We believe based on our projections and ability to reduce loan volume if needed, that our cash on hand, funds available from our line of credit, and our cash flow from operations is expected to be sufficient to meet our liquidity needs for the next twelve months.
Capital Resources
Capital expenditures were $7.9 million, or 6.4% of total net revenue, and $10.5 million, or 6.9% of total net revenue, for the first quarters of 2017 and 2016, respectively. Capital expenditures primarily consist of internally developed software and computer equipment. Capital expenditures in 2017 are expected to be approximately $55.0 million, primarily related to costs associated with the continued development and support of our lending platform. In the future, we expect our capital expenditures to increase as we continue to enhance our platform to support the growth in our business.
Off-Balance Sheet Arrangements
As of both March 31, 2017 and December 31, 2016, a total of $4.7 million in standby letters of credit were outstanding related to certain financial covenants required for our leased facilities. To date, no amounts have been drawn against the letters of credit, which renew annually and expire at various dates through July 2026.
Contingencies
For a comprehensive discussion of contingencies as of March 31, 2017, see “Part I – Financial Information – Item 1 – Financial Statements – Note 14. Commitments and Contingencies.”
Critical Accounting Policies and Estimates
Certain of the Company's accounting policies that involve a higher degree of judgment and complexity are discussed in “Part II – Item 7 – Management's Discussion and Analysis of Financial Condition and Results of Operation – Critical Accounting Estimates” in the Annual Report. There have been no significant changes to these critical accounting estimates during the first quarter of 2017.
50
LENDINGCLUB CORPORATION
Item 3. Quantitative and Qualitative Disclosures about Market Risk
Market risk represents the risk of loss that may impact our financial position due to adverse changes in financial market prices and interest rates.
Except for the loans we have invested in, we generally do not assume principal or interest rate risk on loans funded through our marketplace because loan balances, interest rates and maturities of loans are matched and offset by an equal balance of notes and certificates with the exact same interest rates and maturities. Accordingly, we believe that we do not have any material exposure to changes in the net fair value of these loans as a result of changes in interest rates.
During the first quarter of 2017, we purchased a total of $6.2 million of loans through the platform to fulfill contractual purchase obligations and support upcoming securitization initiatives. In the first quarter of 2017, we resold $4.2 million of loans we previously purchased. The outstanding principal balance of loans for which we remained invested in as of March 31, 2017 was $26.6 million. We do not believe the interest rate risk associated with the remaining loans we held as of March 31, 2017 is material. We will experience increased exposure to interest rate risk if we increase the amount of our capital used to invest in loans. See “Current Economic and Business Environment” and “Liquidity and Capital Resources – Liquidity” for additional discussion. We do not hold or issue financial instruments for trading purposes.
The fair values of loans and the related notes and certificates are determined using a discounted cash flow methodology. The fair value adjustments for loans are largely offset by the fair value adjustments of the notes and certificates due to the borrower payment dependent design of the notes and certificates and due to the total principal balances of the loans being very close to the combined principal balances of the notes and certificates. We recorded a negative net fair value adjustment related to the loans we invested in as of March 31, 2017, of $1.4 million during the first quarter of 2017.
We had cash and cash equivalents of $534.5 million as of March 31, 2017. These amounts were held primarily in interest-bearing deposits at investment grade financial institutions, institutional money market funds, certificates of deposit, and commercial paper, which are short-term. Cash and cash equivalents are held for working capital purposes. Due to their short-term nature, we do not believe we have material exposure to changes in the fair value of these liquid investments as a result of changes in interest rates. Decreases in short-term interest rates will not materially reduce interest income on these cash and cash equivalents because of the current low rate environment. Increases in short-term interest rates will modestly increase the interest income earned on these cash balances.
Interest Rate Sensitivity
We invest in securities classified as available for sale. The fair value of securities available for sale as of March 31, 2017 and December 31, 2016 was $246.9 million and $287.1 million, respectively, consisting of corporate debt securities, asset-backed securities, U.S. agency securities, certificates of deposit, commercial paper, U.S. Treasury securities and other securities. To mitigate the risk of loss, our investment policy and strategy is focused first on the preservation of capital and supporting our liquidity requirements, and then maximizing returns. To manage this risk, the Company limits and monitors maturities, credit ratings, and concentrations within the investment portfolio. Changes in U.S. interest rates affect the interest earned on our securities available for sale and the market value of those securities. A hypothetical 100 basis point increase in interest rates would result in a decrease of approximately $0.9 million in the fair value of our securities available for sale as of March 31, 2017. A hypothetical 100 basis point decrease in interest rates would result in an increase of approximately $0.9 million in the fair value of our securities available for sale as of March 31, 2017. Any realized gains or losses resulting from such interest rate changes would only be recorded if we sold the securities prior to maturity and the securities were not considered other-than-temporarily impaired.
51
LENDINGCLUB CORPORATION
Item 4. Controls and Procedures
Evaluation of Disclosure Controls and Procedures
The Company's management evaluated, with the participation of the Company’s Chief Executive Officer (CEO) and Chief Financial Officer (CFO), the effectiveness of the Company’s disclosure controls and procedures (as defined in Rule 13a-15(e) under the Securities Exchange Act of 1934) as of March 31, 2017. In designing and evaluating its disclosure controls and procedures, the Company's management recognizes that any controls and procedures, no matter how well designed and operated, can provide only reasonable assurance, not absolute assurance, of achieving the desired control objectives, and is required to apply its judgment in evaluating the cost-benefit relationship of possible controls and procedures.
Based on the evaluation, the Company's CEO and CFO concluded that the Company's disclosure controls and procedures as of March 31, 2017 were designed and functioned effectively to provide reasonable assurance that the information required to be disclosed by the Company in reports filed under the Securities and Exchange Act of 1934, as amended, is (i) recorded, processed, summarized, and reported within the time periods specified in the SEC's rules and forms, and (ii) accumulated and communicated to management, including the principal executive and principal financial officers, as appropriate, to allow timely decisions regarding required disclosure.
Changes in Internal Control Over Financial Reporting
No change in the Company's internal control over financial reporting (as defined in Rule 13a-15(f) under the Securities Exchange Act of 1934) was identified during the first quarter of 2017 that has materially affected, or is reasonably likely to materially affect, the Company's internal control over financial reporting.
PART II. OTHER INFORMATION
Item 1. Legal Proceedings
For a discussion of legal proceedings, see “Part 1 – Financial Information – Item 1 – Financial Statements – Note 14. Commitments and Contingencies – Legal,” which is incorporated herein by reference.
Item 1A. Risk Factors
During the first quarter of 2017, there have been no material changes to the risk factors in “Part I – Item 1A – Risk Factors” in the Company's Annual Report.
Item 2. Unregistered Sales of Equity Securities and Use of Proceeds
None.
Item 3. Defaults Upon Senior Securities
None.
Item 4. Mine Safety Disclosures
None.
Item 5. Other Information
None.
52
LENDINGCLUB CORPORATION
Item 6. Exhibits
Exhibit Index
The exhibits noted in the accompanying Exhibit Index are filed or incorporated by reference as a part of this Report and such Exhibit Index is incorporated herein by reference.
Incorporated by Reference | ||||||
Exhibit Number | Exhibit Description | Form | File No. | Exhibit | Filing Date | Filed Herewith |
31.1 | Certification of Chief Executive Officer Pursuant to Section 302 of the Sarbanes-Oxley Act of 2002 | X | ||||
31.2 | Certification of Chief Financial Officer Pursuant to Section 302 of the Sarbanes-Oxley Act of 2002 | X | ||||
32.1 | Certification of Chief Executive Officer and Chief Financial Officer Pursuant to Section 906 of the Sarbanes-Oxley Act of 2002 | X | ||||
101.INS | XBRL Instance Document | X | ||||
101.SCH | XBRL Taxonomy Extension Schema Document | X | ||||
101.CAL | XBRL Taxonomy Extension Calculation Linkbase | X | ||||
101.DEF | XBRL Taxonomy Extension Definition Linkbase | X | ||||
101.LAB | XBRL Taxonomy Extension Label Linkbase | X | ||||
101.PRE | XBRL Taxonomy Extension Presentation Linkbase | X | ||||
53
LENDINGCLUB CORPORATION
SIGNATURES
Pursuant to the requirements of Section 13 or 15(d) of the Securities Exchange Act of 1934, the registrant has duly caused this report to be signed on its behalf by the undersigned, thereunto duly authorized.
LENDINGCLUB CORPORATION | ||||
(Registrant) | ||||
Date: | May 5, 2017 | /s/ SCOTT SANBORN | ||
Scott Sanborn | ||||
Chief Executive Officer and President | ||||
Date: | May 5, 2017 | /s/ THOMAS W. CASEY | ||
Thomas W. Casey | ||||
Chief Financial Officer | ||||
54