Attached files
| file | filename |
|---|---|
| 8-K - 8-K - HERITAGE COMMERCE CORP | a17-12299_18k.htm |
Exhibit 99.1
Raymond James Investor Meeting May 2, 2017

Forward Looking Statement Disclaimer Forward-looking statements are based on management’s knowledge and belief as of today and include information concerning the Heritage Commerce Corp’s, the holding company (“HCC”) for Heritage Bank of Commerce, possible or assumed future financial condition, and its results of operations, business and earnings outlook. These forward-looking statements are subject to risks and uncertainties. For a discussion of factors which could cause results to differ, please see HCC’s reports on Forms 10-K and 10-Q as filed with the Securities and Exchange Commission and HCC’s press releases. Readers should not place undue reliance on the forward-looking statements, which reflect management's view only as of the date hereof. HCC undertakes no obligation to publicly revise these forward-looking statements to reflect subsequent events or circumstances. 2
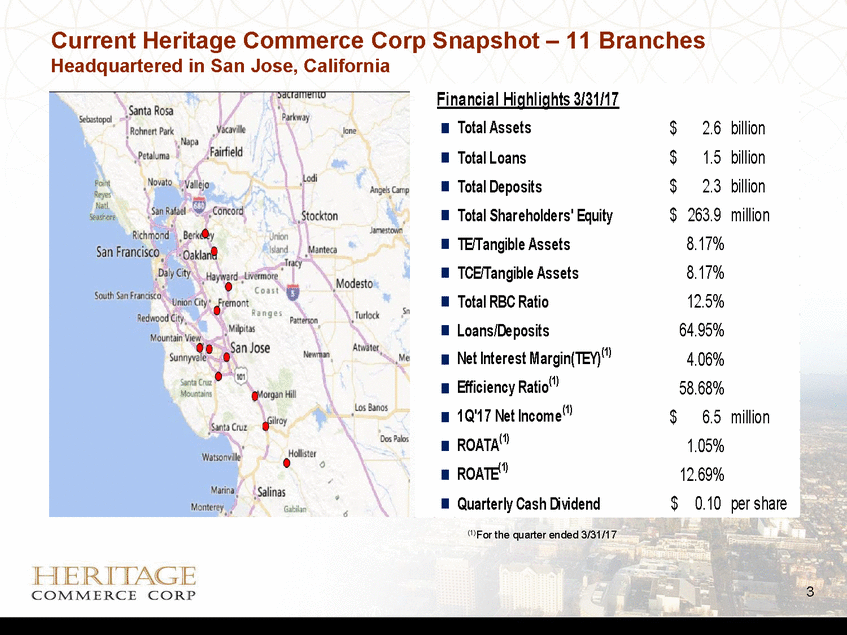
Current Heritage Commerce Corp Headquartered in San Jose, California Snapshot – 11 Branches Fina ncia l Highlights 3/31/17 Total Assets Total Loans Total Deposits Total Shareholders' Equity TE/Tangible Assets TCE/Tangible Assets Total RBC Ratio Loans/Deposits Net Interest Margin(TEY)(1) Efficiency Ratio(1) 1Q'17 Net Income(1) ROATA(1) ROATE(1) Quarterly Cash Dividend $ $ $ $ 2.6 1.5 2.3 263.9 8.17% 8.17% 12.5% 64.95% 4.06% 58.68% billion billion billion million $6.5 million 1.05% 12.69% $ 0.10 per share (1)For the quarter ended 3/31/17 3
Heritage Commerce Corp Strategy Build a significant well diversified community business bank in Northern California (primarily the San Francisco Bay Area) • Providing a diversified mix of lending and deposit products oriented to the business community (and their owners) • Delivering our products and services through full-service offices located in key communities in Northern California (primarily the San Francisco Bay Area) • Building the franchise through: Organic growth New loan team de novo office locations Acquisitions 4
Heritage Bank of Commerce Profile Relationship Banking • A community business bank founded in 1994 headquartered in San Jose, California that offers a full range of banking services to small and medium sized businesses (and their owners), and to professionals using a relationship banking approach Core Clientele • • • Small to medium sized closely held businesses (and their owners and key employees) Professionals High net worth individuals Specialty Expertise • • • • • • • SBA lending and loan sales Corporate finance/asset-based lending Factoring Construction lending Cash management Non-profit organizations, education, and churches Homeowner Association Services Well-positioned in three affluent counties of San Francisco Bay Area • • Heritage Bank of Commerce ranks third in deposit market share amongst Independent Community Banks headquartered in the San Francisco Bay Area(1) Only independent community bank over $1 billion in assets headquartered in Santa Clara County (1) Market refers to Alameda, Contra Costa, Marin, San Francisco, San Mateo, and Santa Clara counties. Source: FDIC, Summary of Deposits as of June 30, 2016. 5
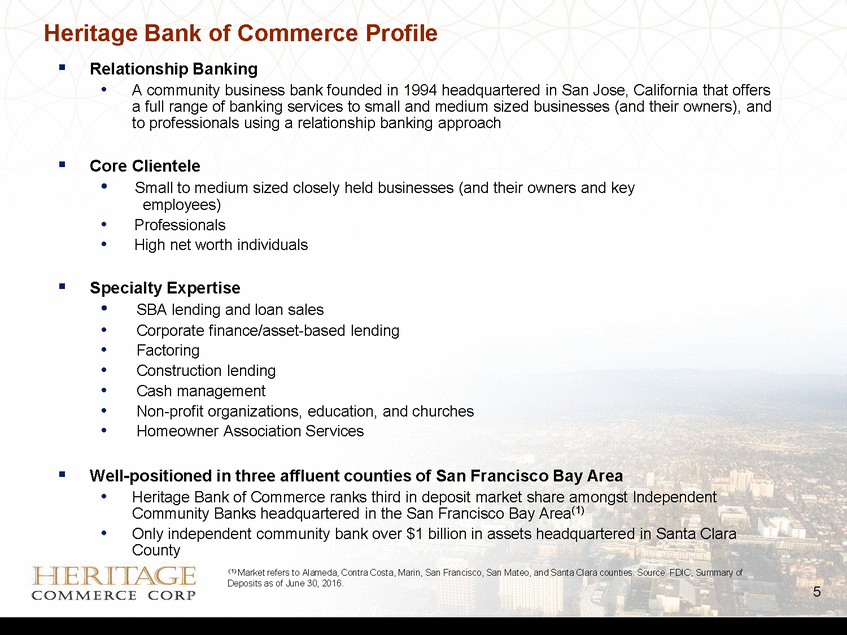
Experienced Management Team Walter T. Kaczmarek Keith A. Wilton President & CEO EVP / Chief Operating Officer President of Heritage Bank of Commerce EVP / Business Banking Division EVP / Chief Financial Officer EVP / Chief Credit Officer EVP / Director of HOA & Deposit Services EVP / Chief Risk Officer EVP / Controller 12 3 36 35 Michael E. Benito Lawrence D. McGovern David E. Porter Teresa L. Powell Debbie K. Reuter May K. Y. Wong 14 18 5 1 22 18 32 33 42 36 41 32 6 Years of Banking Experience Years at HTBK Position Name
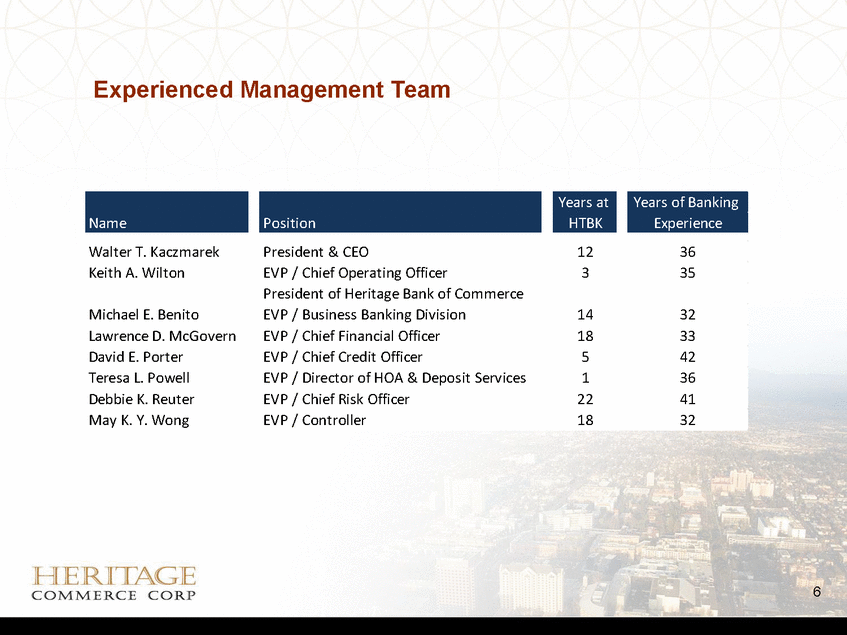
Located in the Economically Vibrant San Francisco Bay Area Projected 5-Yr Household Income Growth 10.20% 11.92% 9.11% 12.31% 11.22% 10.04% 10.35% Projected 5-Yr Population Growth 6.06% 6.34% 5.85% 5.97% 5.43% 3.88% 5.08% 2017 Median Household Income 2017 Population 1,955,349 1,669,264 1,145,635 881,893 776,995 263,942 59,275 County Santa Clara Alameda Contra Costa San Francisco San Mateo Marin San Benito $ 102,724 82,231 85,674 88,829 103,207 101,402 73,801 California National 39,691,194 325,139,271 4.74% 3.77% 66,091 57,462 7.73% 7.27% Source: SNL as of 3/31/17 7
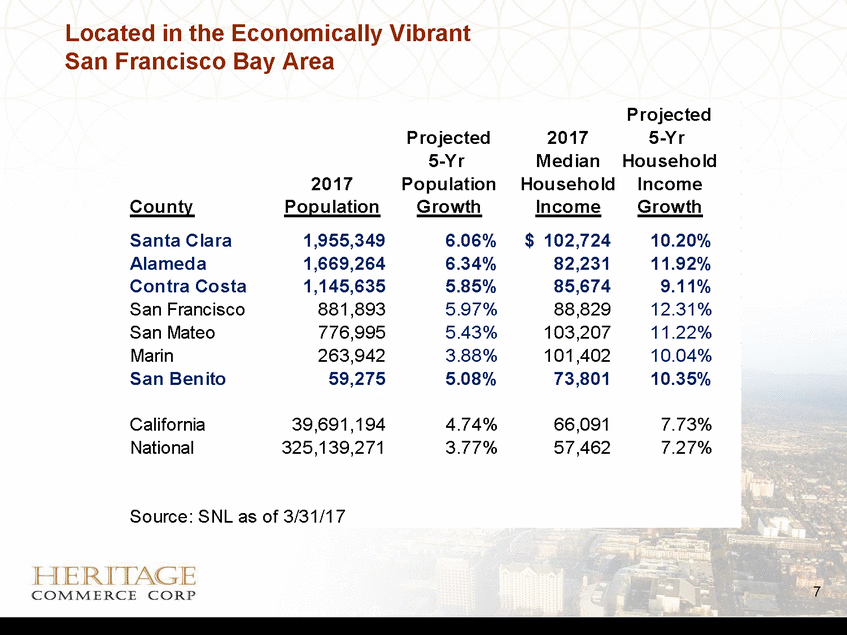
Market Share Ranks third amongst Independent Community Banks headquartered in the San Francisco Bay Area(1) 1 Fremont Bank 2 Mechanics Bank 19 25 3,065,711 2,652,615 4 Bank of Marin 5 Sterling Bank and Trust, FSB 6 First National Bank of Northern California 7 California Bank of Commerce 8 Pacific Coast Bankers ' Bank 9 Avid bank 10 Presidio Bank 15 18 13 3 1 1 5 1,474,510 1,198,028 1,009,273 613,686 610,832 575,002 540,224 1 Bank of America, NA 2 Well s Fargo Bank, NA 3 Silicon Valley Bank 4 JPMorgan Chas e Bank, NA 5 First Republic Association 6 Citi bank, NA 197 226 4 201 35 99 132,398,540 99,411,674 35,444,852 29,282,391 26,382,687 22,912,000 1,397 459,651,498 (1) San Francisco Bay Area refers to Alameda, Contra Costa, Marin, San Francisco, San Mateo, and Santa Clara counties. Source: FDIC, Summary of Deposits as of June 30, 2016. 8 Total s for Market(1) Deposits Branchin Bay Area (1) Count($000) Top National Franchises Deposits 2016 Branchin Bay Area (1) Rank Bank Count ($000) 3 Heritage Bank of Commerce 102,055,187 Top Regional Banks Deposits 2016 Branchi n Bay Area (1) Rank Bank Count($000)
Key Events 2014 Acquisition of Bay View Funding on November 1, 2014 • • 30 year old factoring company with strong managerial experience As of March 31, 2017, we have $42.8 million of factored receivables 2015 Merger of Focus Business Bank on August 20, 2015. All stock merger: • • 8 year old financial institution Single branch located 2 blocks from the Heritage Commerce Corp San Jose headquarters Focus added $439 million of assets, at fair value, as of 8/20/15 Focus added approximately $405 million of deposits, at fair value, as of 8/20/15 Focus added approximately $175 million of loans, at fair value, (including loans held-for-sale) as of 8/20/15 • • • 9
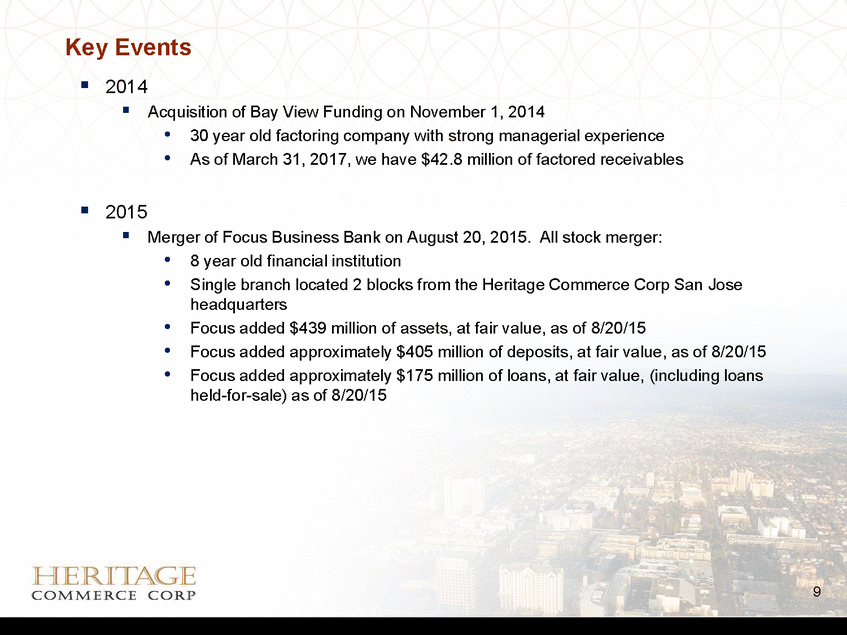
Balance Sheet Highlights (in $OOO's) $3,000,000 $2,500,000 $2,000,000 $1,500,000 $1,000,000 $500,000 $0 •Total Loans •Total Deposits •Total Assets HERITAGE COMMERCJE CORP
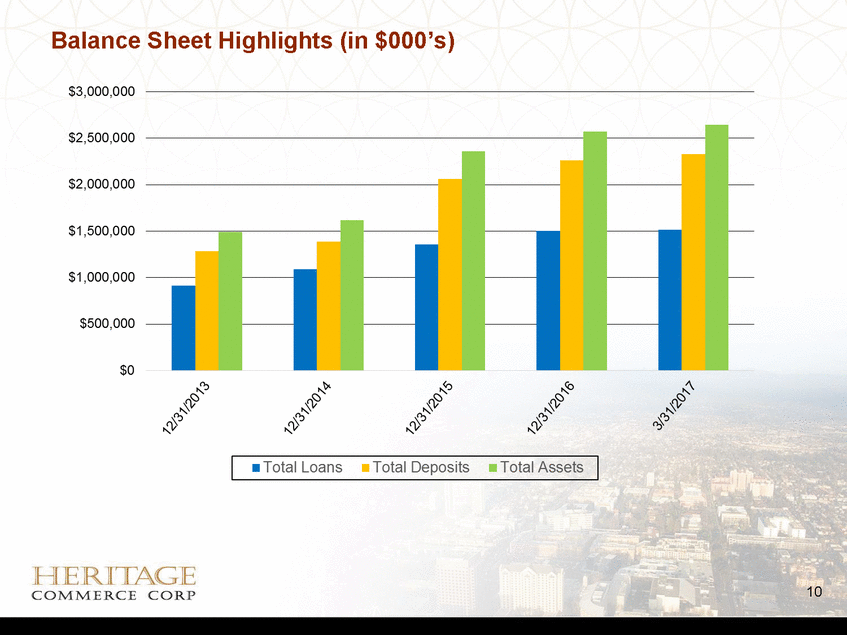
Current Balance Sheet Highlights (in $000’s) For the Periods Ended: 3/31/17 3/31/16 % Change Total Assets $ 2,641,791 $ 2,327,333 14% Total Loans $ 1,513,287 $ 1,395,264 8% Core Deposits $ 2,155,778 $ 1,829,667 18% Total Deposits $ 2,330,087 $ 2,028,736 15% TE / Tangible Assets 8.17% 8.70% -6% TCE / Tangible Assets 8.17% 7.84% 4% Total RBC Ratio 12.5% 12.4% 1% 11
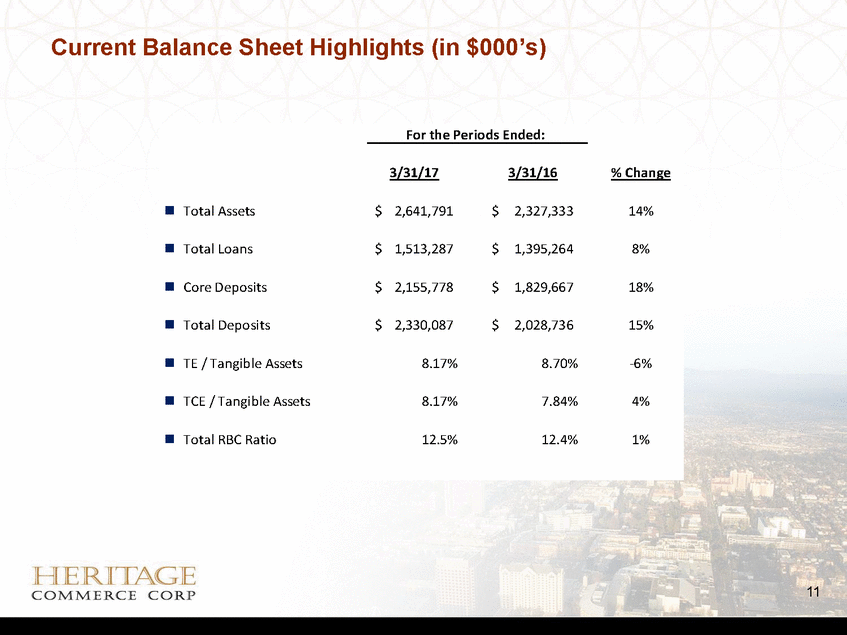
Strong Deposit Base (in $000’s) Balance % of Total Demand, noninterest-bearing Demand, interest-bearing Savings and money market Time deposits - under $250 Core Deposits Time deposits - $250 and over CDARS - interest-bearing demand, money market and time deposits Total $ 917,037 575,637 606,116 56,988 39.4% 24.7% 26.0% 2.4% 2,155,778 164,824 92.5% 7.1% 9,485 0.4% $ 2,330,087 100.0% 1Q 2017 Cost of Deposits = 0.16% 12
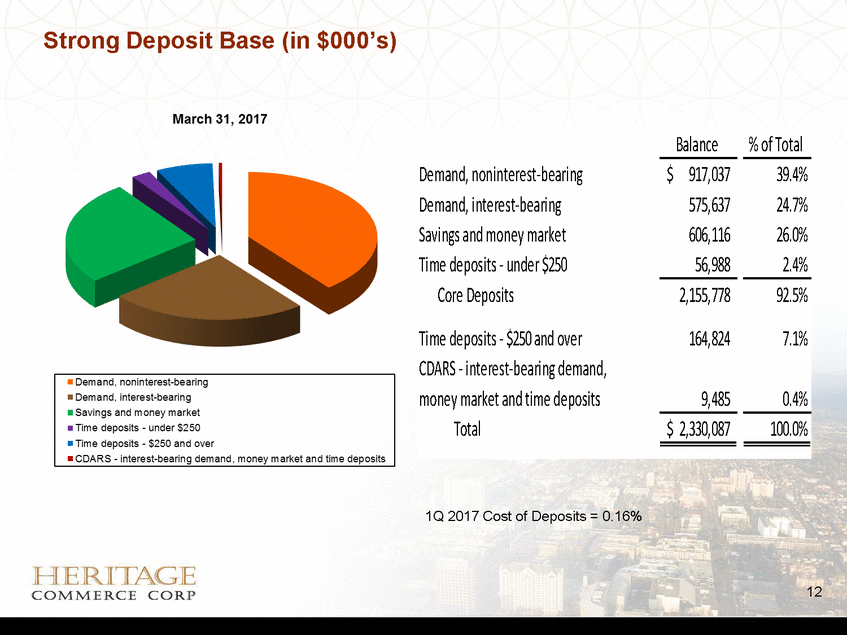
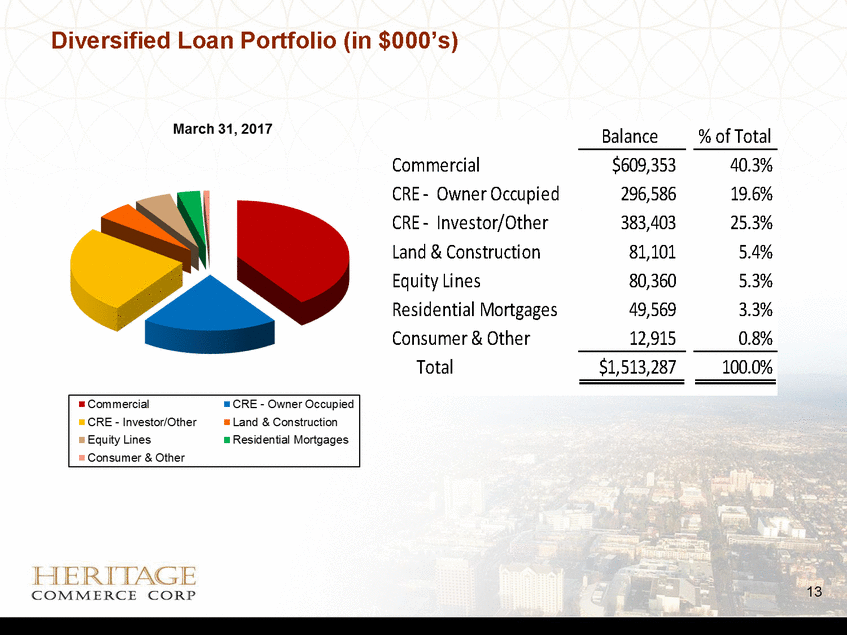
Diversified Loan Portfolio (in $000’s) Balance % of Total Commercial CRE - Owner Occupied $609,353 296,586 40.3% 19.6% CRE - Investor/Other 383,403 25.3% Land & Construction Equity Lines Residential Mortgages Consumer & Other Total 81,101 80,360 49,569 12,915 5.4% 5.3% 3.3% 0.8% $1,513,287 100.0% 13
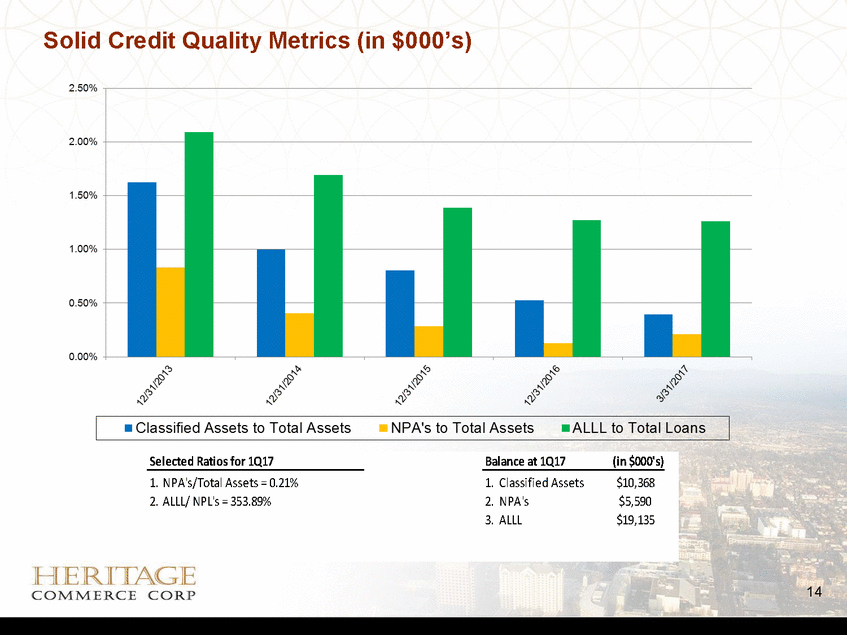
Solid Credit Quality Metrics (in $000’s) Selected Ratios for 1Q17 Balance at 1Q17 (in $000's) 1. NPA's/Total Assets = 0.21% 2. ALLL/ NPL's = 353.89% 1. Classified Assets 2. NPA's 3. ALLL $10,368 $5,590 $19,135 14
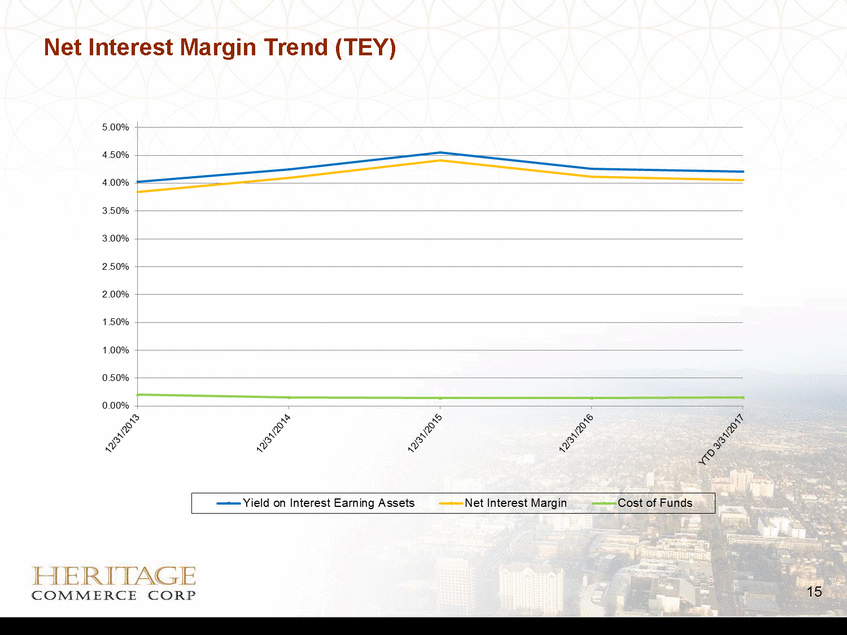
Net Interest Margin Trend (TEY) 5.00% 4.50% 4.00% 3.50% 3.00% 2.50% 2.00% 1.50% 1.00% 0.50% 0.00% ":> " ":> " - Yield on Interest Earning Assets - Net Interest Margin HERITAGE COMMERCJE CORP
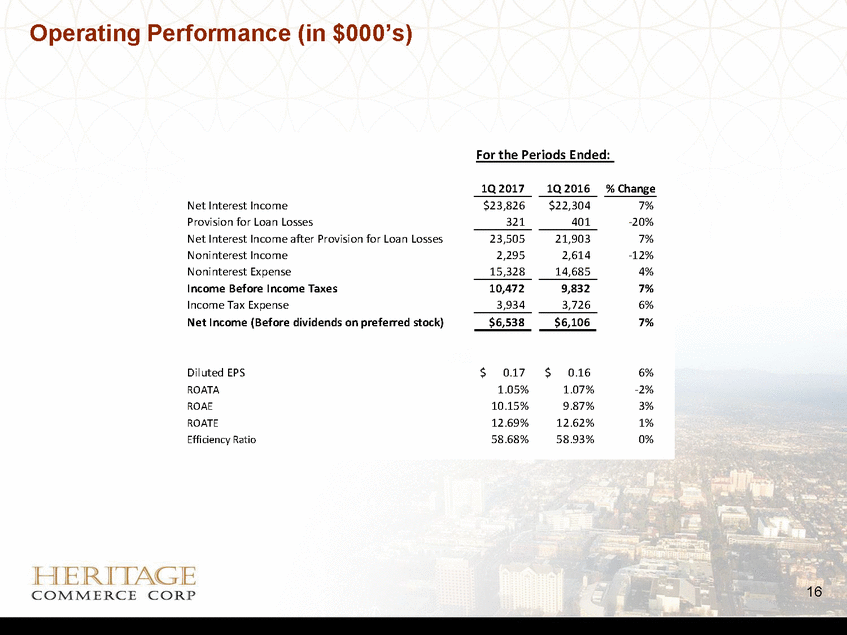
Operating Performance (in $000’s) For the Periods Ended: 1Q 2017 1Q 2016 % Change Net Interest Income Provision for Loan Losses Net Interest Income after Provision for Loan Losses Noninterest Income Noninterest Expense Income Before Income Taxes Income Tax Expense Net Income (Before dividends on preferred stock) $23,826 321 $22,304 401 7% -20% 7% -12% 4% 7% 6% 7% 23,505 2,295 15,328 21,903 2,614 14,685 10,472 3,934 9,832 3,726 $6,538 $6,106 Diluted EPS ROATA ROAE ROATE Efficiency Ratio $ 0.17 1.05% 10.15% 12.69% 58.68% $ 0.16 1.07% 9.87% 12.62% 58.93% 6% -2% 3% 1% 0% 16
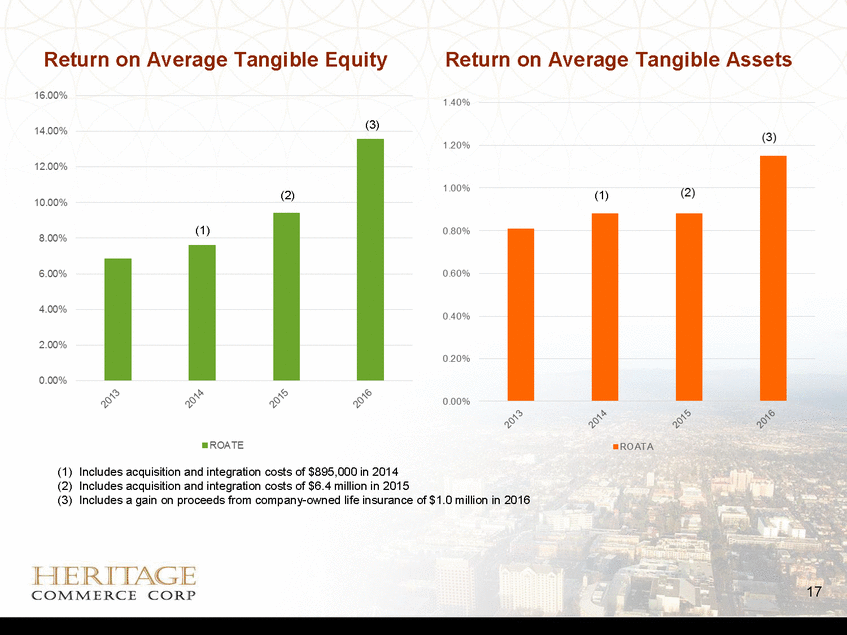
Return on Average Tangible Equity Return on Average Tangible Assets (3) (2) (1) (1) (1) (2) (3) Includes acquisition and integration costs of $895,000 in 2014 Includes acquisition and integration costs of $6.4 million in 2015 Includes a gain on proceeds from company-owned life insurance of $1.0 million in 2016 17
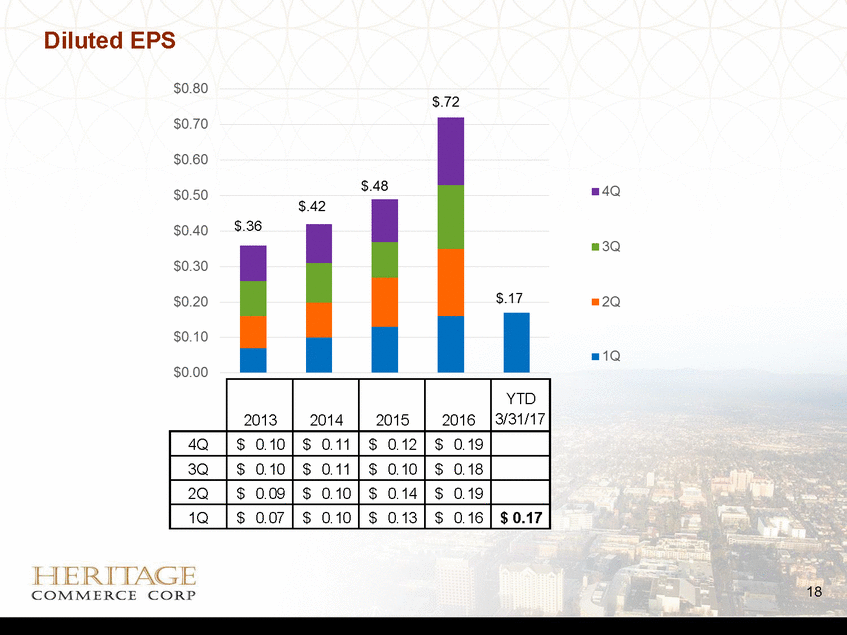
Diluted EPS $.36 18 2013 2014 2015 2016 YTD 3/31/17 4Q $ 0.10 $ 0.11 $ 0.12 $ 0.19 3Q $ 0.10 $ 0.11 $ 0.10 $ 0.18 2Q $ 0.09 $ 0.10 $ 0.14 $ 0.19 1Q $ 0.07 $ 0.10 $ 0.13 $ 0.16 $ 0.17
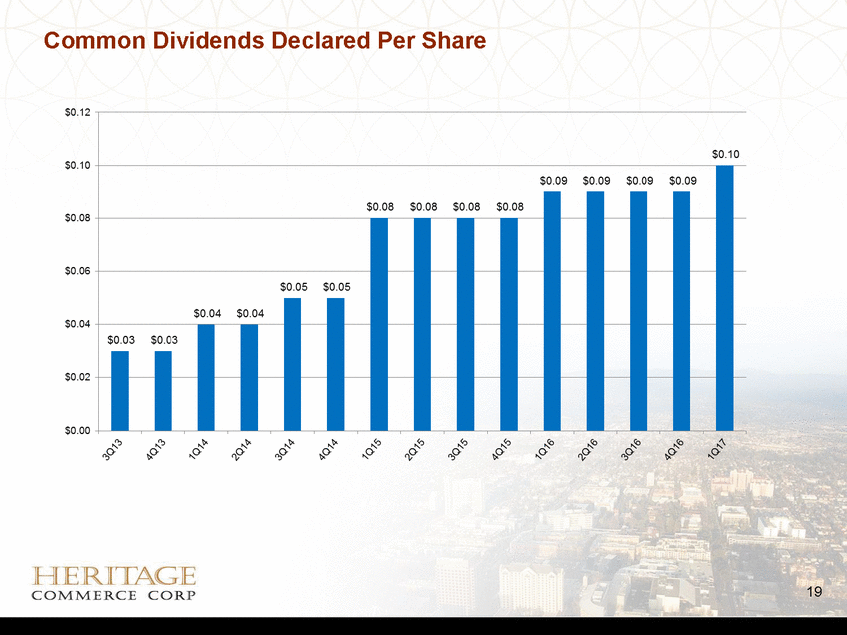
Common Dividends Declared Per Share $0.12 ,.----- - - --- - - - - - --- - ----$0.10 --$0.10 4----- - ----- - ---- --- - - - - --- $0.08 4----- - ----------$0.06 - - - - - --------$0.04 4-------$0.02 $0.00 HERITAGE COMM ERCE CORP
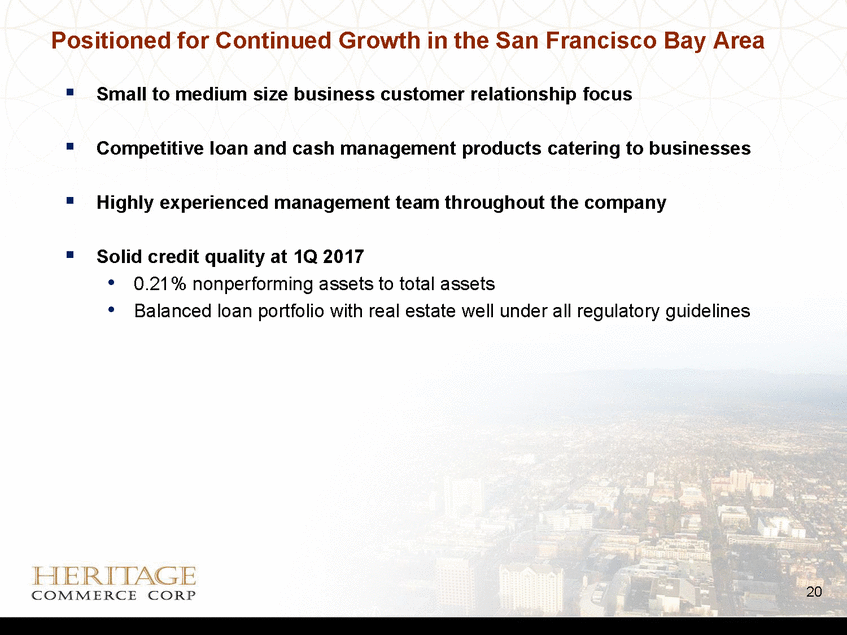
Positioned for Continued Growth in the San Francisco Bay Area Small to medium size business customer relationship focus Competitive loan and cash management products catering to businesses Highly experienced management team throughout the company Solid credit quality at 1Q 2017 • • 0.21% nonperforming assets to total assets Balanced loan portfolio with real estate well under all regulatory guidelines 20
Positioned for Continued Growth in the San Francisco Bay Area (continued) Solid capital and liquidity management • 12.5% total risk-based capital ratio under the Basel III regulatory requirements at 3/31/17 64.95% loan to deposit ratio at 3/31/17 Quarterly common dividend at $0.10 per share in the first quarter of 2017 • • Profitable operations • • • Excellent earnings of $6.5 million for 1Q 2017 ROATA = 1.05% for 1Q 2017 ROATE = 12.69% for 1Q 2017 Good locations and markets with solid market share among community banks • • • 11 branch locations Ranks third in deposit market share amongst independent community banks(1) San Francisco and San Jose combined MSA’s are second in the state of California in households with income greater than $200,000 (1) Market refers to Alameda, Contra Costa, Marin, San Francisco, San Mateo, and Santa Clara counties. Source: FDIC, Summary of Deposits as of June 30, 2016. 21
Contact Information Walter T. Kaczmarek President and Chief Executive Officer 408.494.4500 David E. Porter Executive Vice President Chief Credit Officer 408.792.4029 Keith A. Wilton Executive Vice President and Chief Operating Officer President of Heritage Bank of Commerce 408.494.4534 Teresa L. Powell Executive Vice President Director of HOA & Deposit Services 408.200.8712 Michael E. Benito Executive Vice President Business Banking Division 408.792.4085 Debbie K. Reuter Executive Vice President Chief Risk Officer & Corporate Secretary 408.494.4542 Lawrence D. McGovern Executive Vice President Chief Financial Officer 408.494.4562 May K.Y. Wong Executive Vice President Controller 408.494.4596 Corporate Headquarters 150 Almaden Boulevard San Jose, CA 95113 NASDAQ: HTBK 22
