Attached files
| file | filename |
|---|---|
| EX-99.2 - EXHIBIT 99.2 - SHENANDOAH TELECOMMUNICATIONS CO/VA/ | ex99_2.htm |
| 8-K - 8-K - SHENANDOAH TELECOMMUNICATIONS CO/VA/ | form8k.htm |

May 2, 2017 2017 Shareholder Meeting Exhibit 99.1
Management Reports Chris French President and CEO
Safe Harbor Statement This presentation includes “forward-looking statements” within the meaning of Section 27A of the Securities Act and Section 21E of the Securities Exchange Act of 1934, as amended, regarding, among other things, our business strategy, our prospects and our financial position. These statements can be identified by the use of forward-looking terminology such as “believes,” “estimates,” “expects,” “intends,” “may,” “will,” “should,” “could,” or “anticipates” or the negative or other variation of these similar words, or by discussions of strategy or risks and uncertainties. These statements are based on current expectations of future events. If underlying assumptions prove inaccurate or unknown risks or uncertainties materialize, actual results could vary materially from the Company’s expectations and projections. Important factors that could cause actual results to differ materially from such forward-looking statements include, without limitation, risks related to the following: Increasing competition in the communications industry; andA complex and uncertain regulatory environment.A further list and description of these risks, uncertainties and other factors can be found in the Company’s SEC filings which are available online at www.sec.gov, www.shentel.com or on request from the Company. The Company does not undertake to update any forward-looking statements as a result of new information or future events or developments.
Use of Non-GAAP Financial Measures Included in this presentation are certain non-GAAP financial measures that are not determined in accordance with US generally accepted accounting principles. These financial performance measures are not indicative of cash provided or used by operating activities and exclude the effects of certain operating, capital and financing costs and may differ from comparable information provided by other companies, and they should not be considered in isolation, as an alternative to, or more meaningful than measures of financial performance determined in accordance with US generally accepted accounting principles. These financial performance measures are commonly used in the industry and are presented because Shentel believes they provide relevant and useful information to investors. Shentel utilizes these financial performance measures to assess its ability to meet future capital expenditure and working capital requirements, to incur indebtedness if necessary, return investment to shareholders and to fund continued growth. Shentel also uses these financial performance measures to evaluate the performance of its businesses and for budget planning purposes.
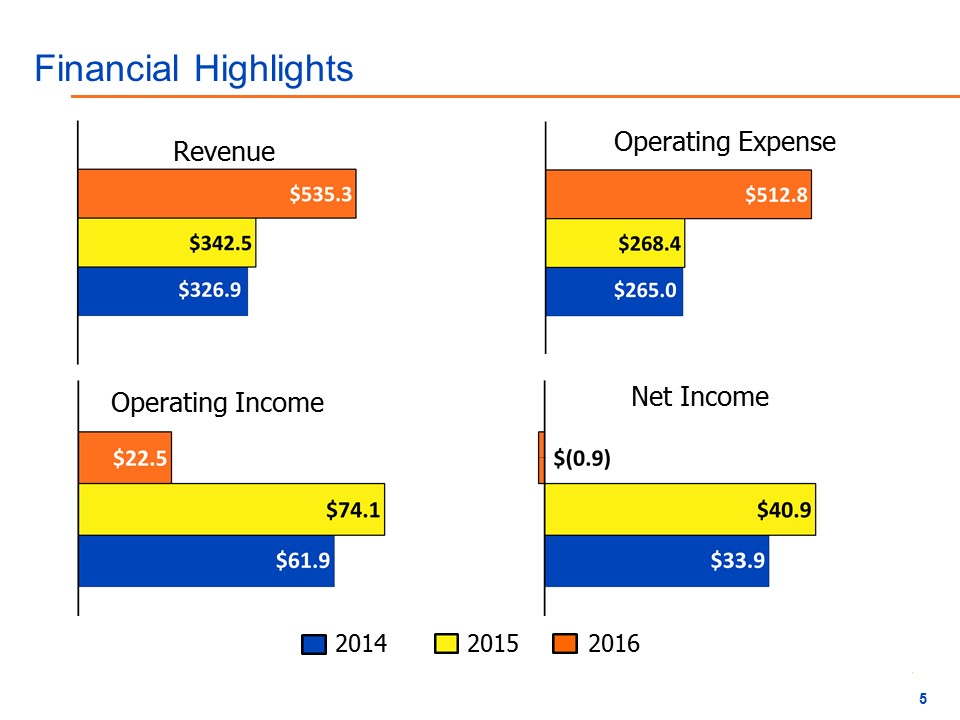
Financial Highlights x Revenue Net Income Operating Income x x 2014 2016 2015 Operating Expense
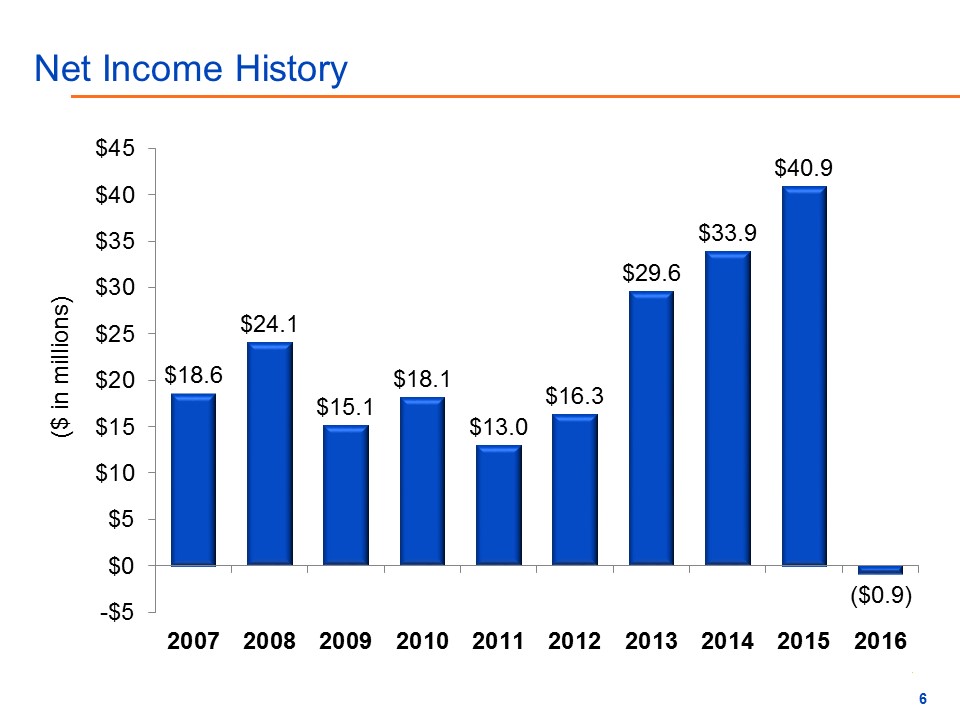
Net Income History x x x ($ in millions)
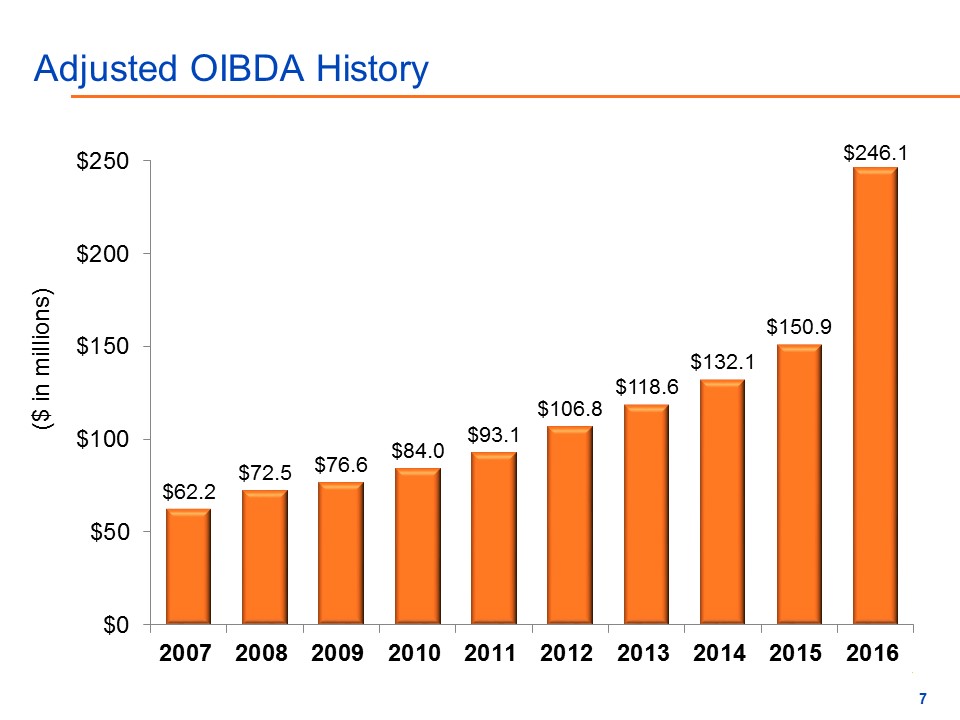
Adjusted OIBDA History x x x ($ in millions)
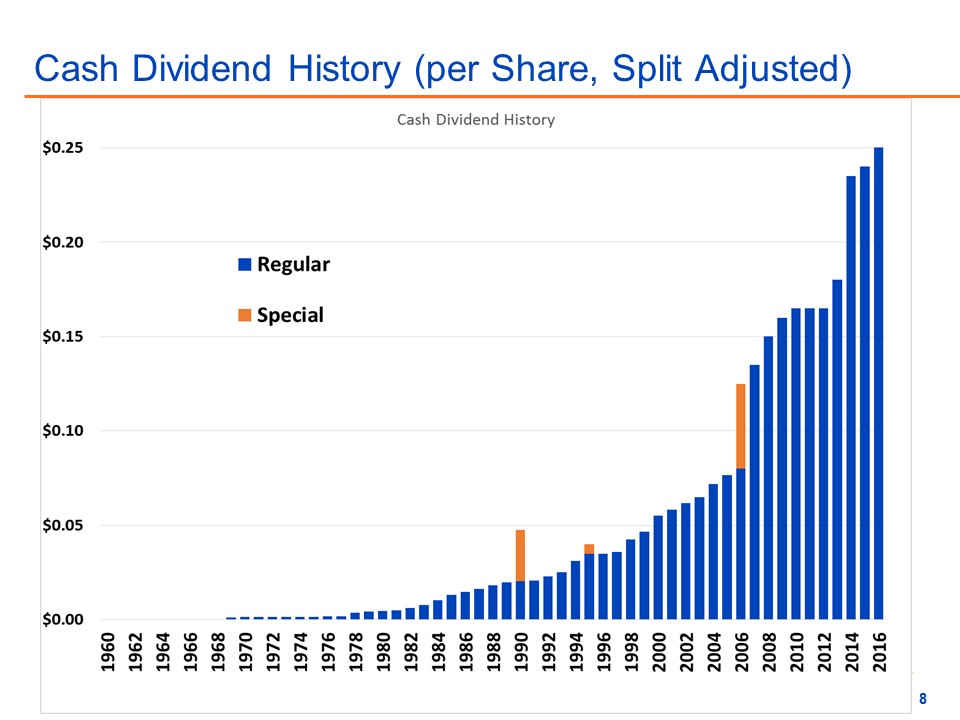
Cash Dividend History (per Share, Split Adjusted) x x
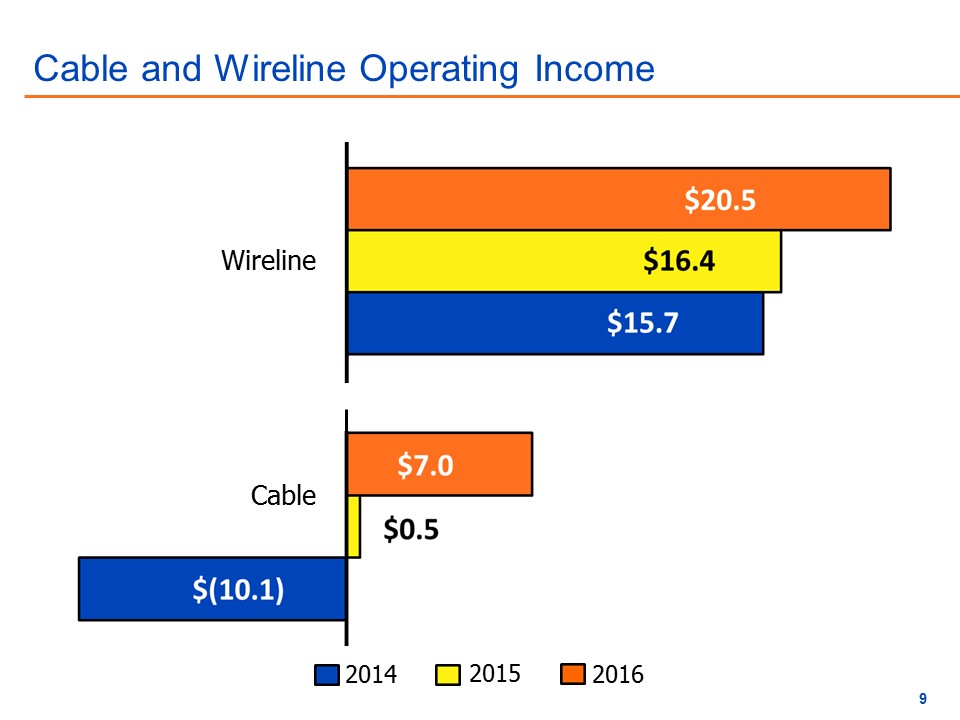
Cable and Wireline Operating Income Wireline Cable x x x 2014 2016 2015
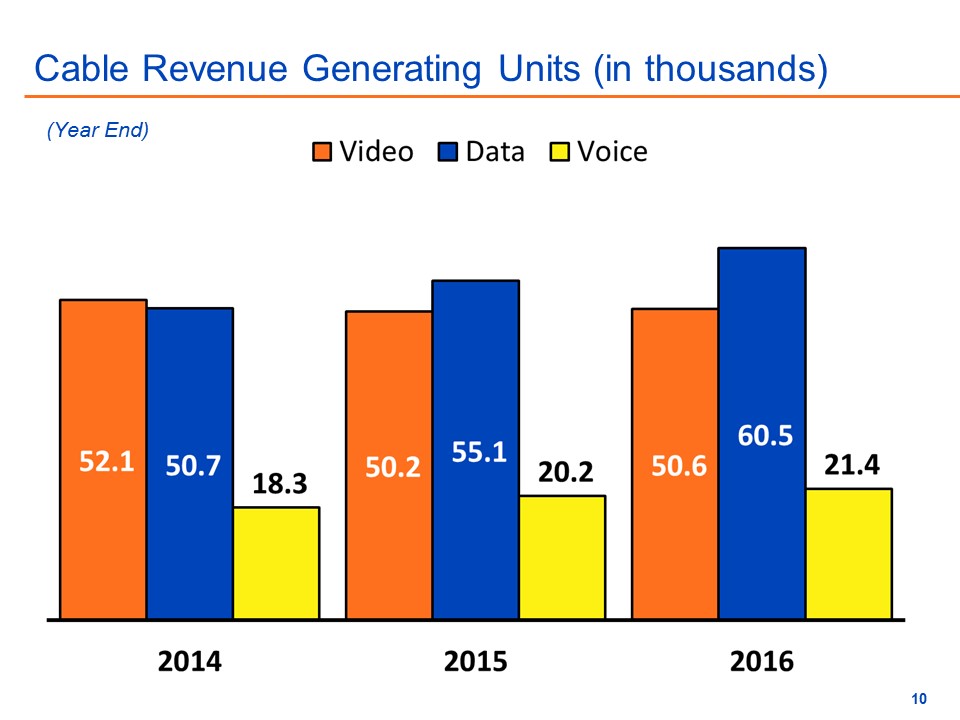
Cable Revenue Generating Units (in thousands) (Year End)
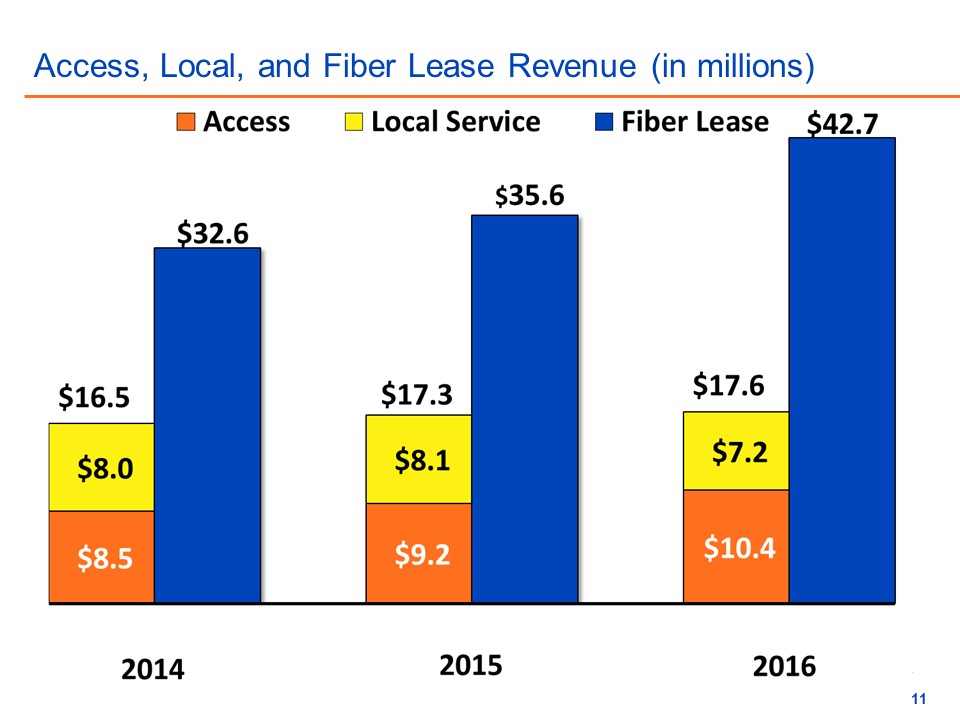
Access, Local, and Fiber Lease Revenue (in millions)
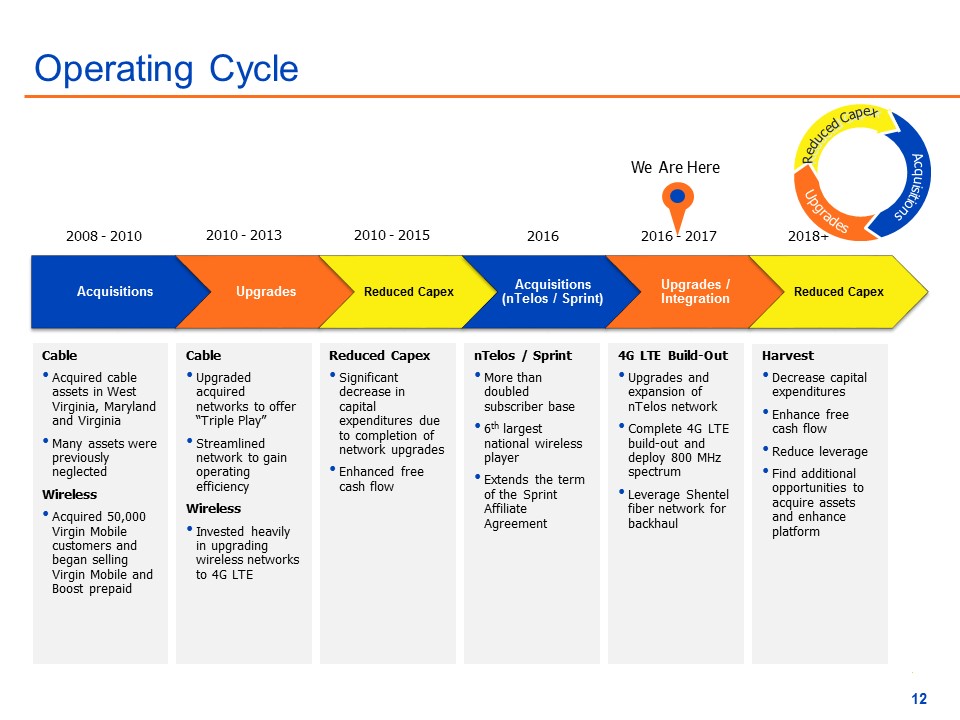
Operating Cycle 2008 - 2010 2010 - 2013 2010 - 2015 2016 2016 - 2017 2018+ Reduced Capex Acquisitions Upgrades We Are Here CableAcquired cable assets in West Virginia, Maryland and VirginiaMany assets were previously neglectedWirelessAcquired 50,000 Virgin Mobile customers and began selling Virgin Mobile and Boost prepaid CableUpgraded acquired networks to offer “Triple Play”Streamlined network to gain operating efficiencyWirelessInvested heavily in upgrading wireless networks to 4G LTE Reduced CapexSignificant decrease in capital expenditures due to completion of network upgradesEnhanced free cash flow nTelos / SprintMore than doubled subscriber base6th largest national wireless playerExtends the term of the Sprint Affiliate Agreement 4G LTE Build-OutUpgrades and expansion of nTelos networkComplete 4G LTE build-out and deploy 800 MHz spectrumLeverage Shentel fiber network for backhaul HarvestDecrease capital expendituresEnhance free cash flowReduce leverageFind additional opportunities to acquire assets and enhance platform
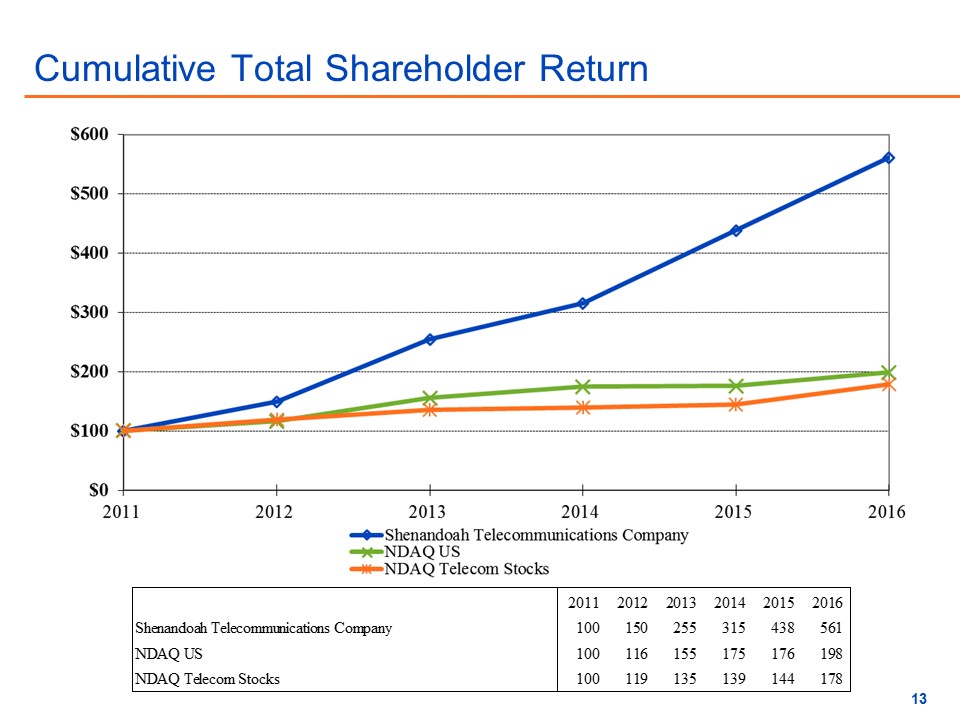
Cumulative Total Shareholder Return x
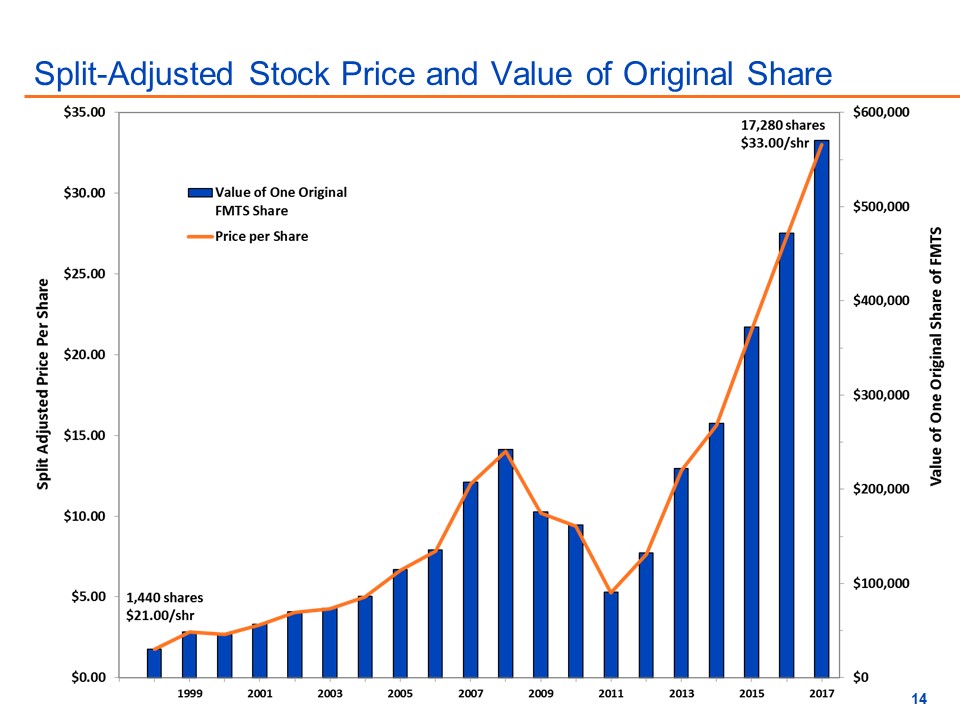
Split-Adjusted Stock Price and Value of Original Share x
Management Reports Adele Skolits VP of Finance and CFO
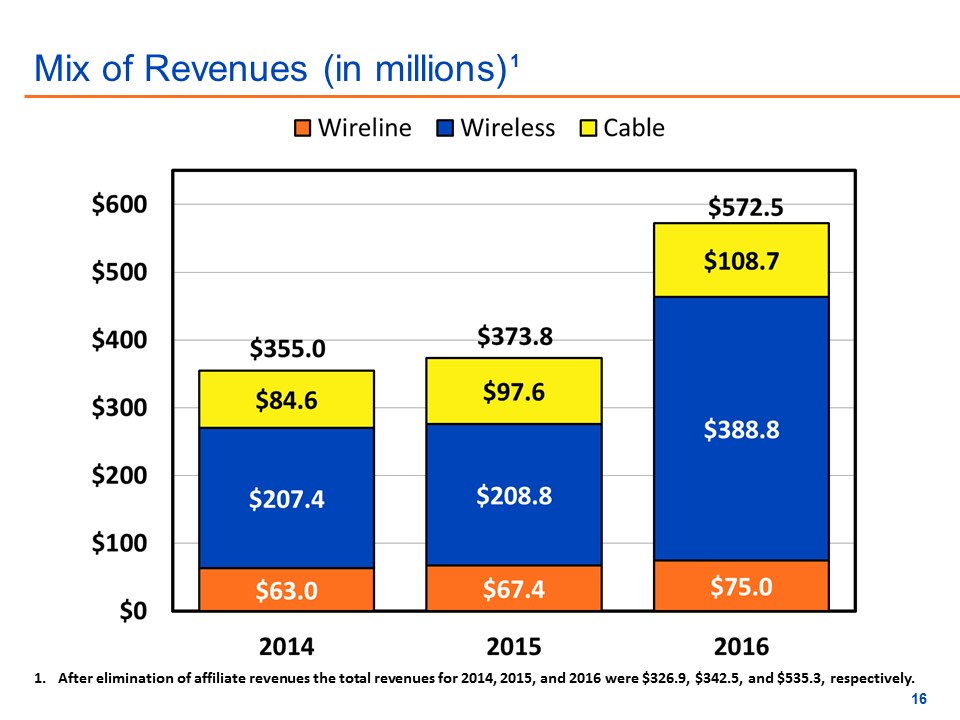
Mix of Revenues (in millions) After elimination of affiliate revenues the total revenues for 2014, 2015, and 2016 were $326.9, $342.5, and $535.3, respectively. 1
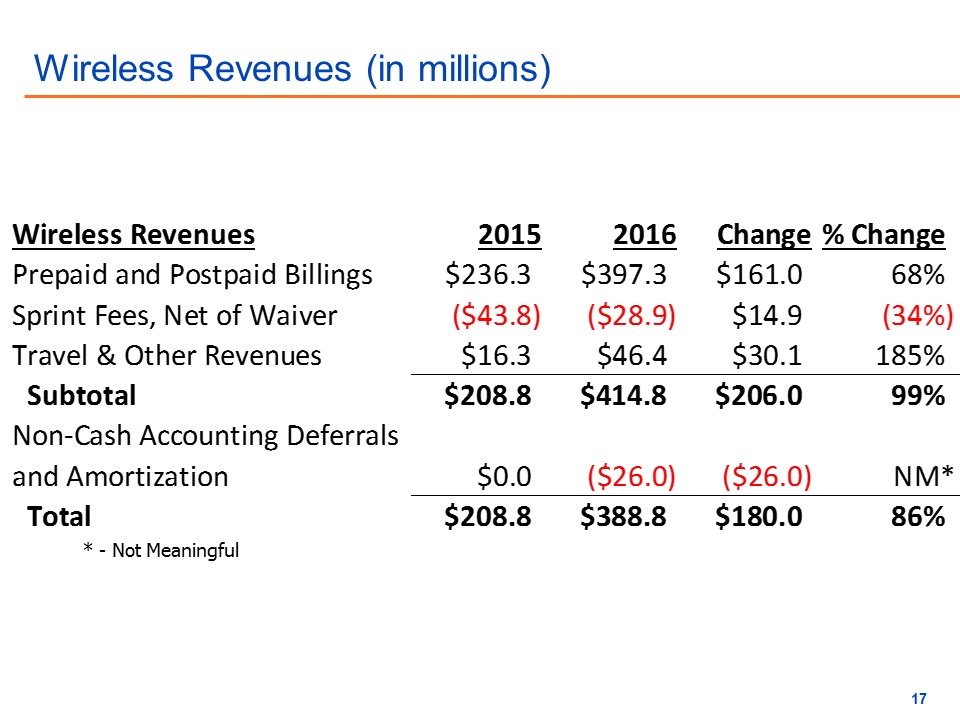
Wireless Revenues (in millions) * - Not Meaningful
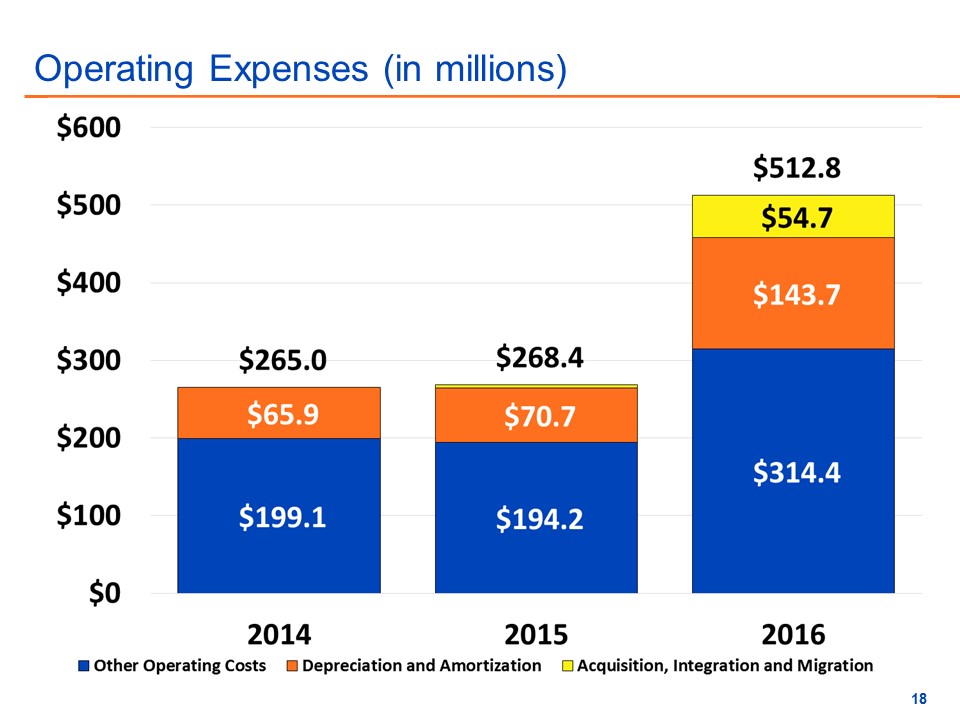
Operating Expenses (in millions)
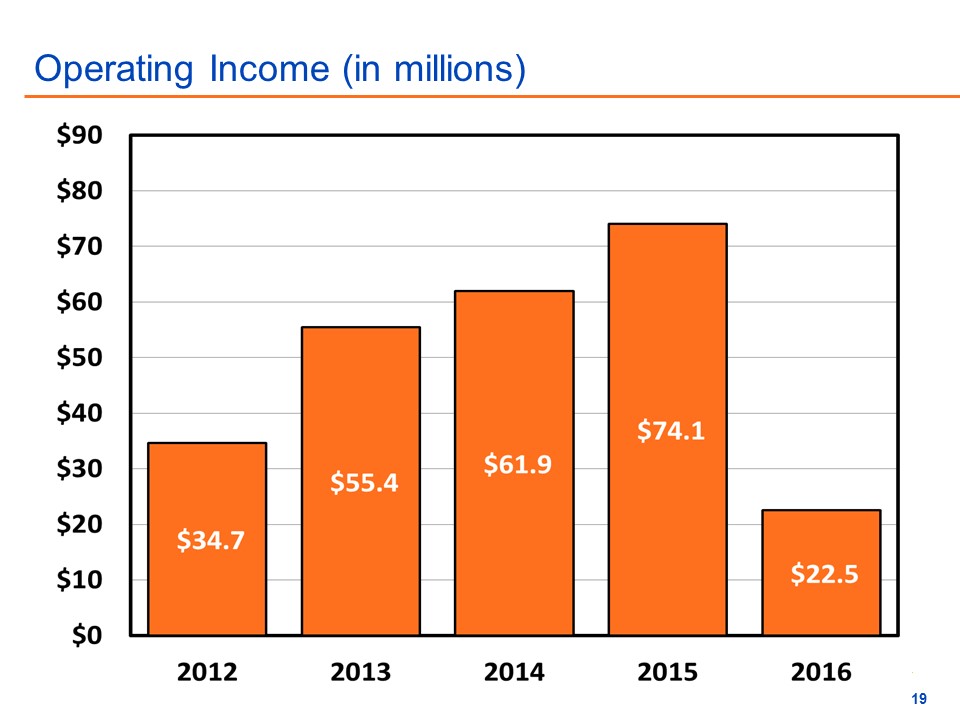
Operating Income (in millions)
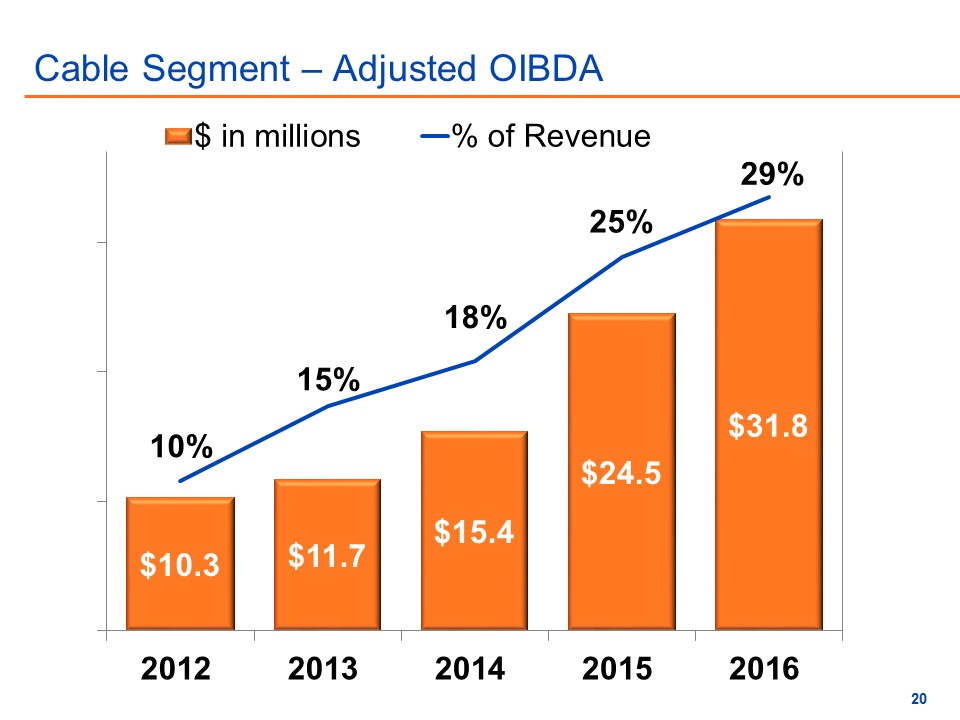
Cable Segment – Adjusted OIBDA
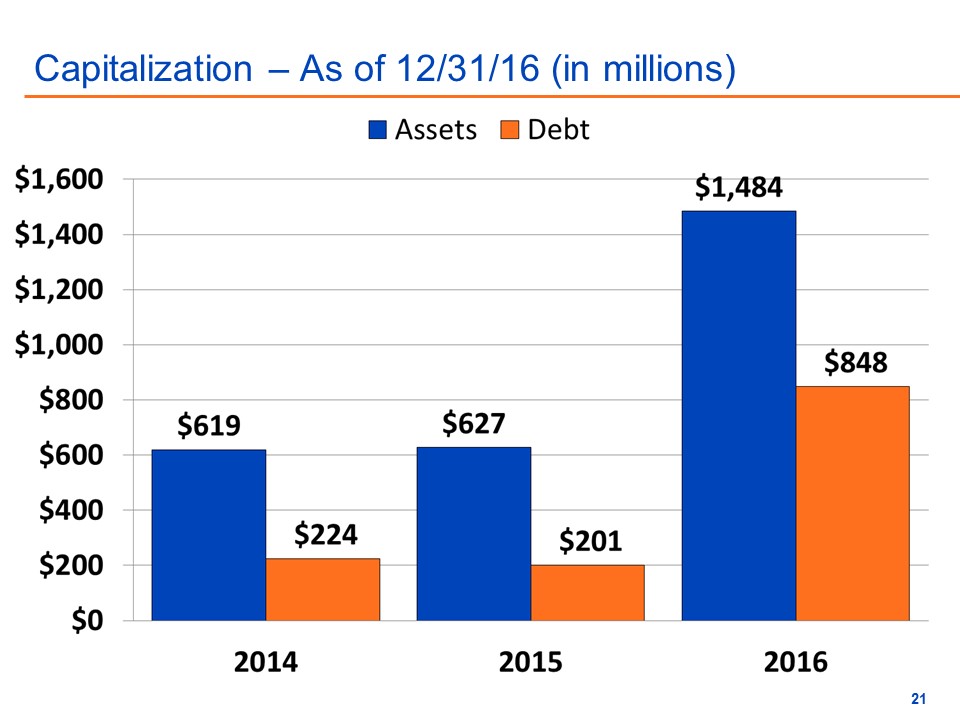
Capitalization – As of 12/31/16 (in millions)
Management Reports Earle MacKenzie EVP and COO
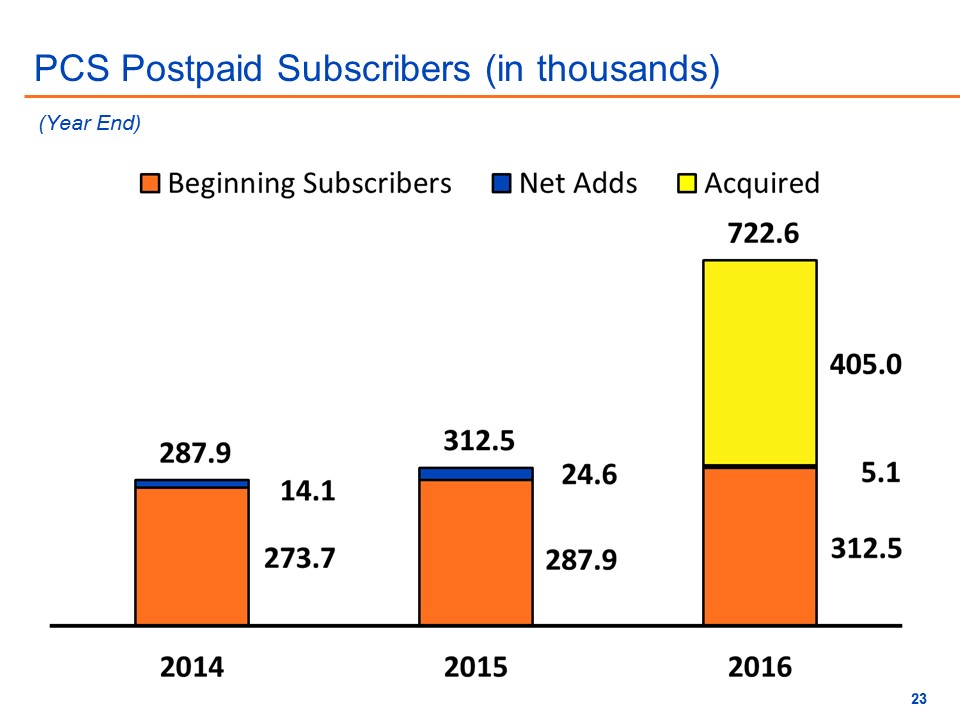
PCS Postpaid Subscribers (in thousands) (Year End)
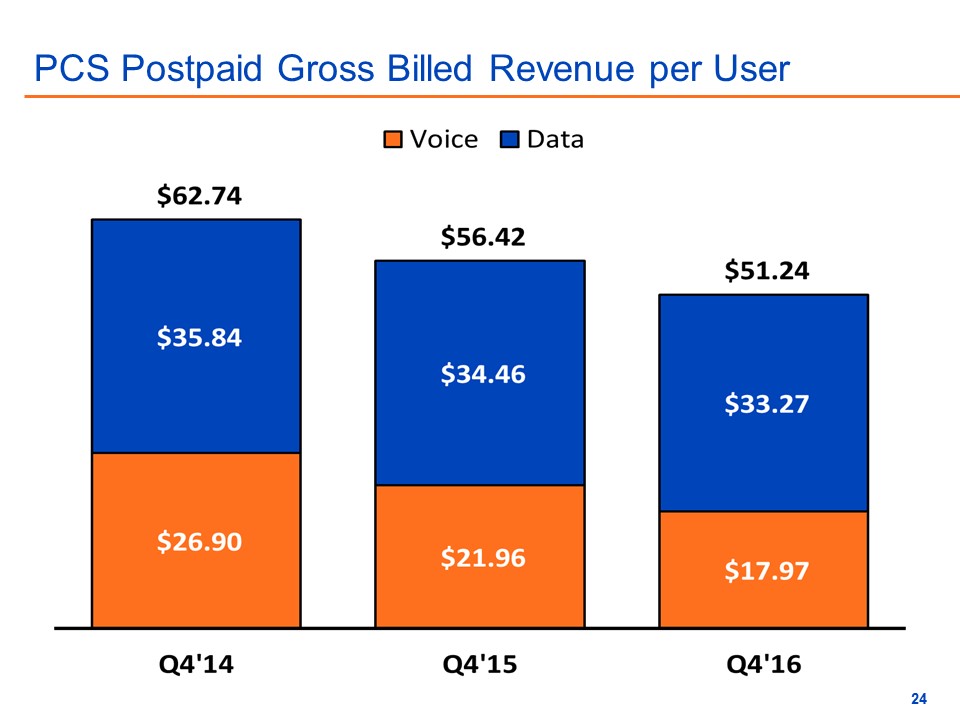
PCS Postpaid Gross Billed Revenue per User
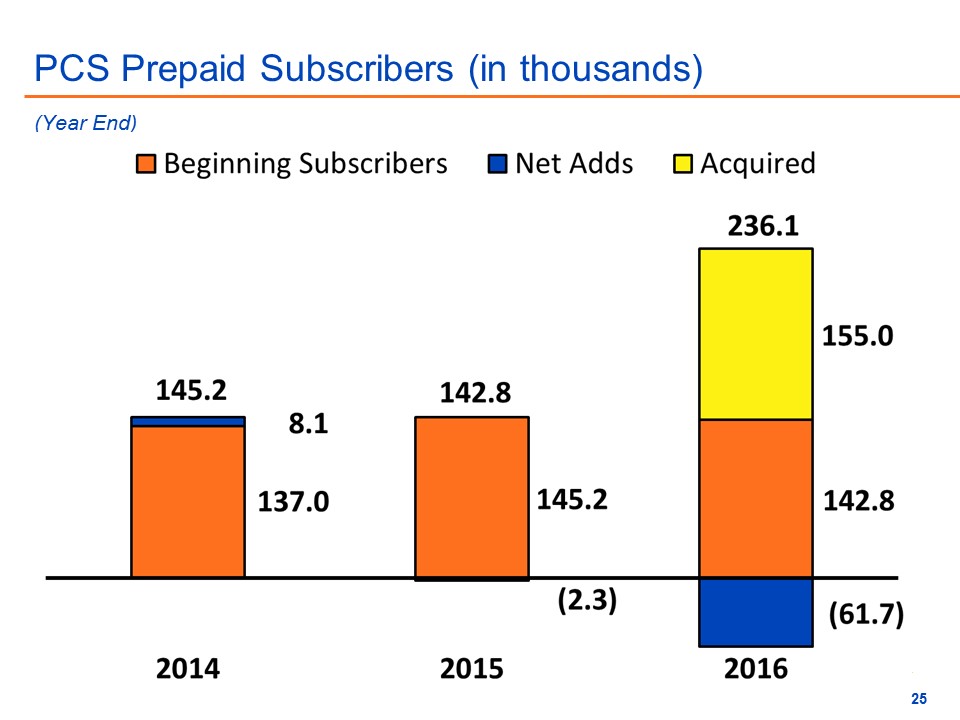
PCS Prepaid Subscribers (in thousands) (Year End)
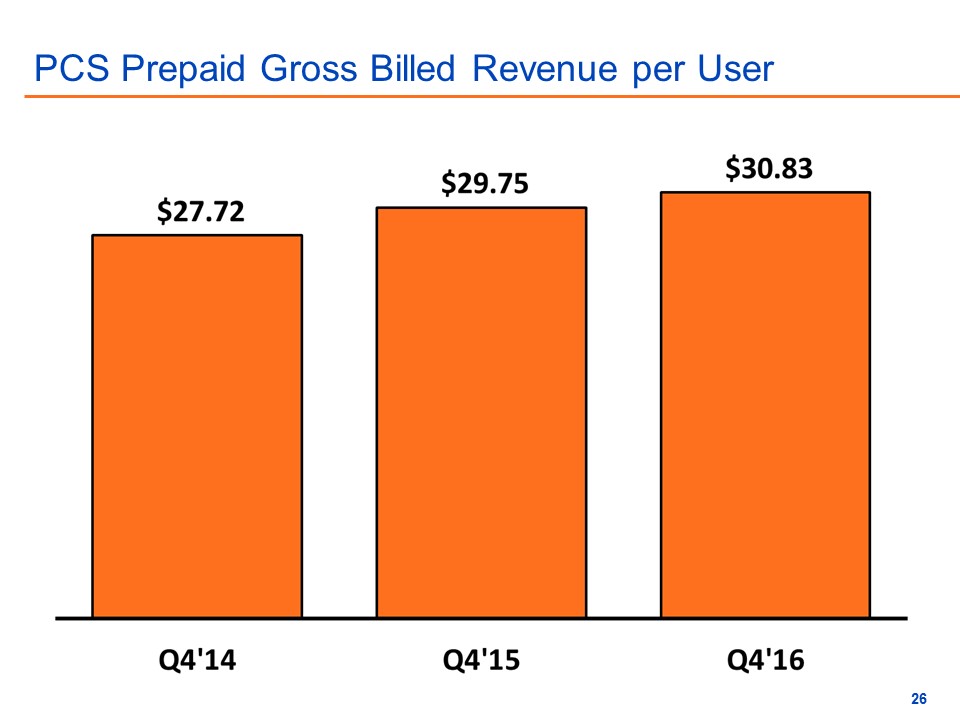
PCS Prepaid Gross Billed Revenue per User
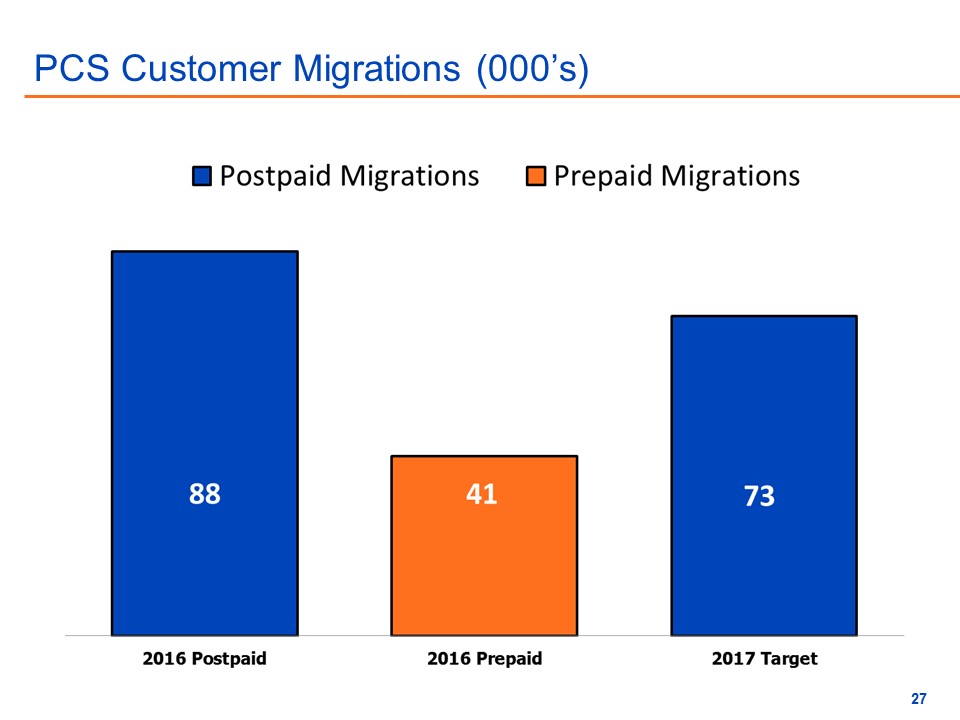
PCS Customer Migrations (000’s)
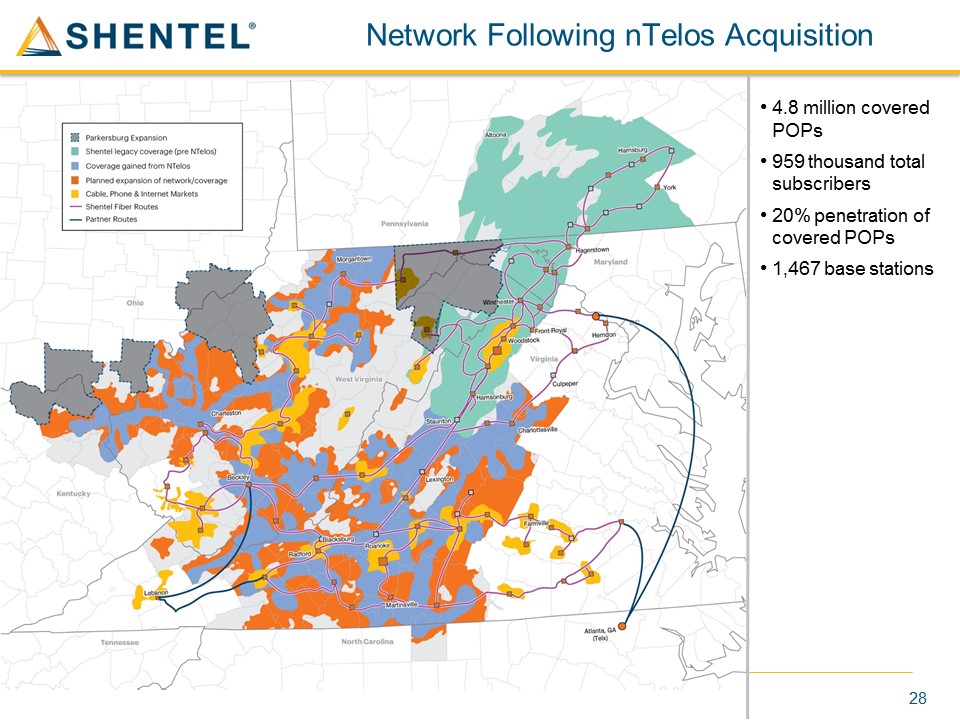
4.8 million covered POPs959 thousand total subscribers20% penetration of covered POPs1,467 base stations Network Following nTelos Acquisition 28
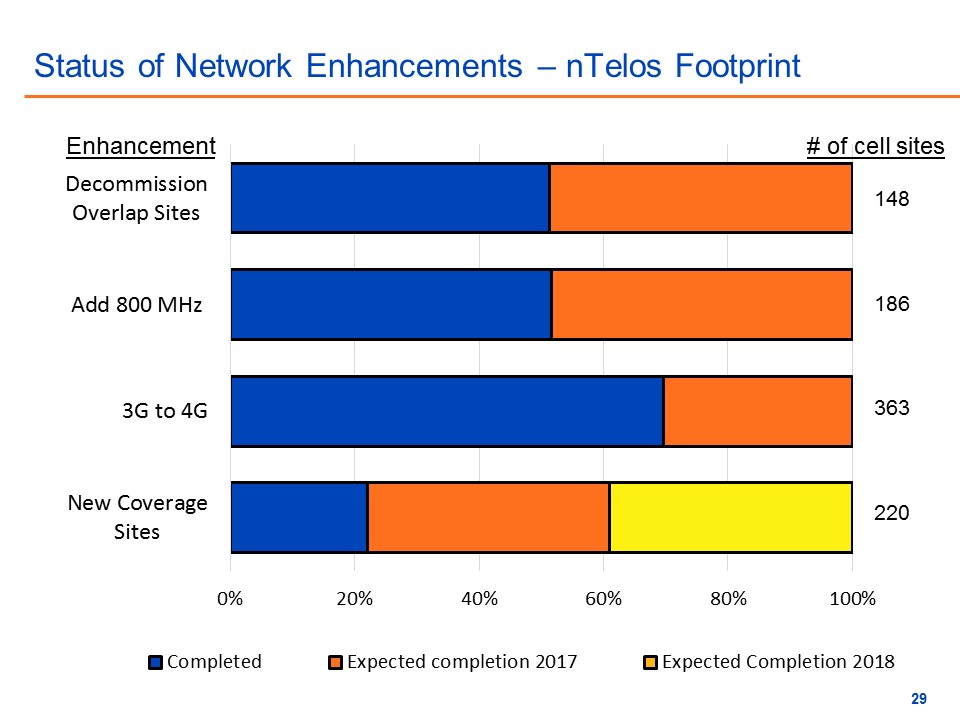
Status of Network Enhancements – nTelos Footprint Enhancement # of cell sites 148 186 363 220
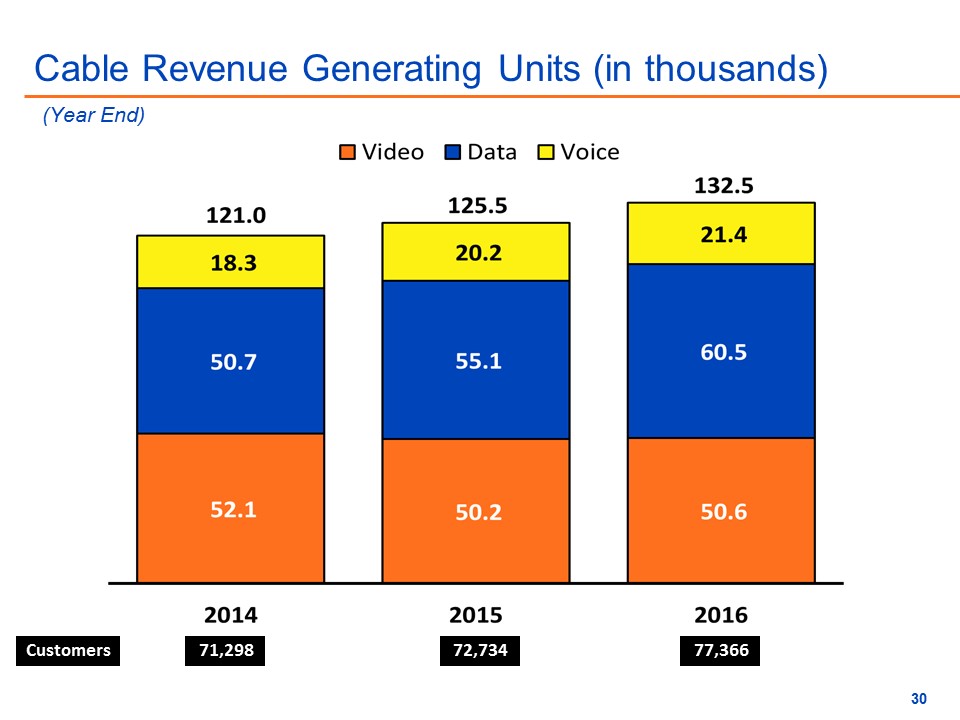
Cable Revenue Generating Units (in thousands) x Customers 77,366 71,298 72,734 (Year End)
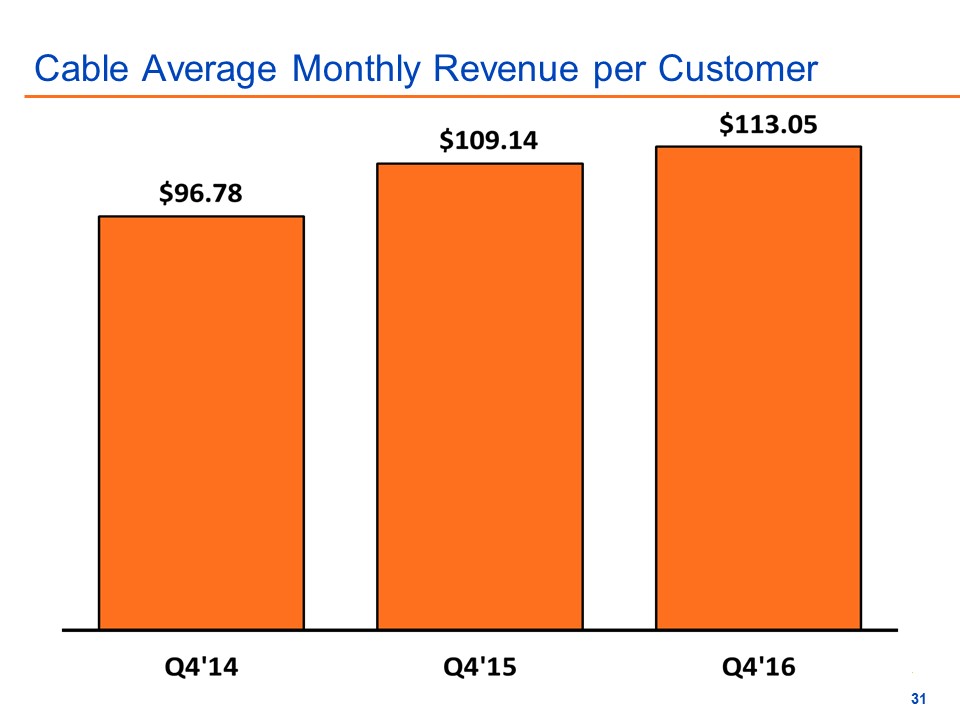
Cable Average Monthly Revenue per Customer
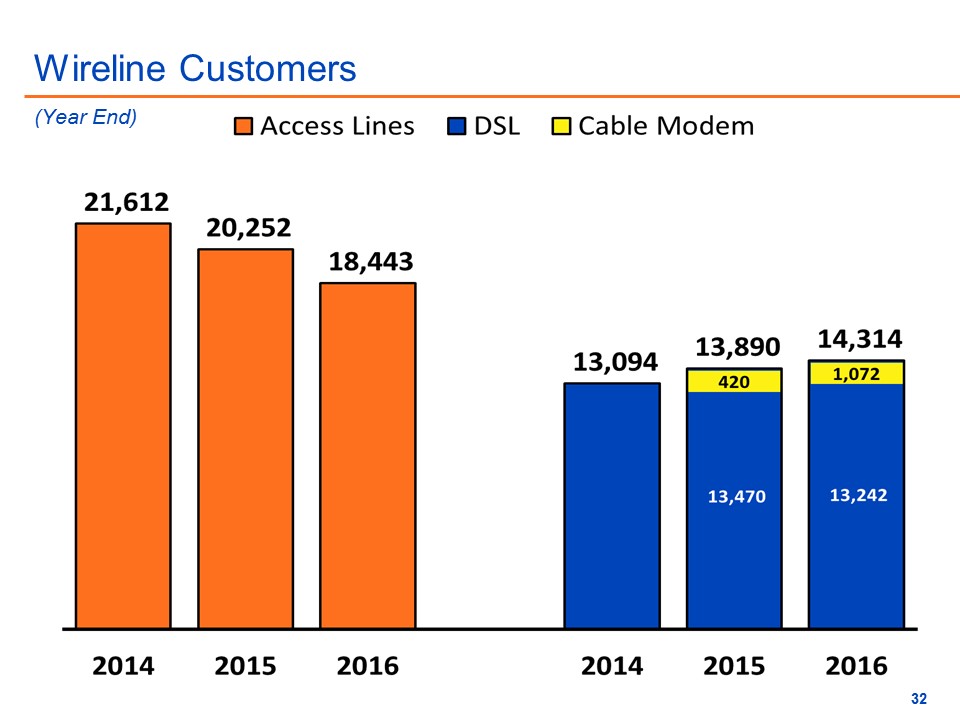
Wireline Customers (Year End)
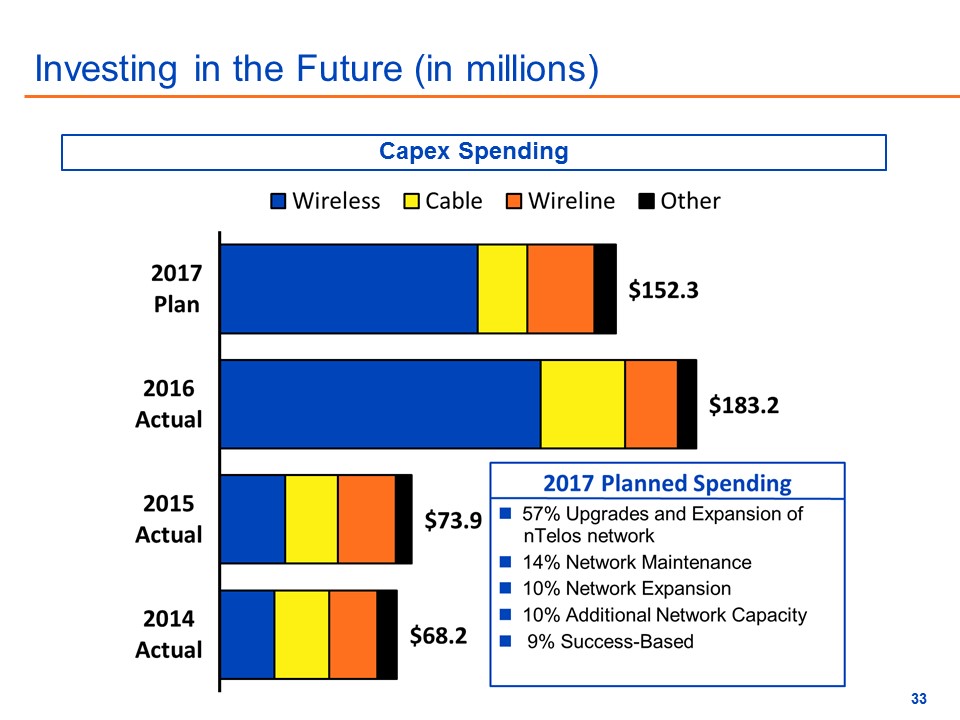
Investing in the Future (in millions) Capex Spending

May 2, 2017 2017 Shareholder Meeting