Attached files
| file | filename |
|---|---|
| 8-K - 8-K - FEDERAL REALTY INVESTMENT TRUST | frt-03312017x8kdoc.htm |
FEDERAL REALTY INVESTMENT TRUST | |||
SUPPLEMENTAL INFORMATION | |||
March 31, 2017 | |||
TABLE OF CONTENTS | |||
1 | First Quarter 2017 Earnings Press Release | ||
2 | Financial Highlights | ||
Consolidated Income Statements | |||
Consolidated Balance Sheets | |||
Funds From Operations / Summary of Capital Expenditures | |||
Market Data | |||
Components of Rental Income | |||
3 | Summary of Debt | ||
Summary of Outstanding Debt and Capital Lease Obligations | |||
Summary of Debt Maturities | |||
4 | Summary of Redevelopment Opportunities | ||
5 | Assembly Row, Pike & Rose, and Santana Row | ||
6 | Future Redevelopment Opportunities | ||
7 | 2017 Significant Acquisitions and Disposition | ||
8 | Real Estate Status Report | ||
9 | Retail Leasing Summary | ||
10 | Lease Expirations | ||
11 | Portfolio Leased Statistics | ||
12 | Summary of Top 25 Tenants | ||
13 | Reconciliation of FFO Guidance | ||
14 | Glossary of Terms | ||
1626 East Jefferson Street | |||
Rockville, Maryland 20852-4041 | |||
301/998-8100 | |||
1
Safe Harbor Language
Certain matters discussed within this Supplemental Information may be deemed to be forward-looking statements within the meaning of the federal securities laws. Although Federal Realty believes the expectations reflected in the forward-looking statements are based on reasonable assumptions, it can give no assurance that its expectations will be attained. These factors include, but are not limited to, the risk factors described in our Annual Report on Form 10-K filed on February 13, 2017, and include the following:
• | risks that our tenants will not pay rent, may vacate early or may file for bankruptcy or that we may be unable to renew leases or re-let space at favorable rents as leases expire; |
• | risks that we may not be able to proceed with or obtain necessary approvals for any redevelopment or renovation project, and that completion of anticipated or ongoing property redevelopment or renovation projects that we do pursue may cost more, take more time to complete or fail to perform as expected; |
• | risk that we are investing a significant amount in ground-up development projects that may be dependent on third parties to deliver critical aspects of certain projects, requires spending a substantial amount upfront in infrastructure, and assumes receipt of public funding which has been committed but not entirely funded; |
• | risks normally associated with the real estate industry, including risks that occupancy levels at our properties and the amount of rent that we receive from our properties may be lower than expected, that new acquisitions may fail to perform as expected, that competition for acquisitions could result in increased prices for acquisitions, that costs associated with the periodic maintenance and repair or renovation of space, insurance and other operations may increase, that environmental issues may develop at our properties and result in unanticipated costs, and, because real estate is illiquid, that we may not be able to sell properties when appropriate; |
• | risks that our growth will be limited if we cannot obtain additional capital; |
• | risks associated with general economic conditions, including local economic conditions in our geographic markets; |
• | risks of financing, such as our ability to consummate additional financings or obtain replacement financing on terms which are acceptable to us, our ability to meet existing financial covenants and the limitations imposed on our operations by those covenants, and the possibility of increases in interest rates that would result in increased interest expense; and |
• | risks related to our status as a real estate investment trust, commonly referred to as a REIT, for federal income tax purposes, such as the existence of complex tax regulations relating to our status as a REIT, the effect of future changes in REIT requirements as a result of new legislation, and the adverse consequences of the failure to qualify as a REIT. |
Given these uncertainties, readers are cautioned not to place undue reliance on any forward-looking statements that we make, including those in this Supplemental Information. Except as required by law, we make no promise to update any of the forward-looking statements as a result of new information, future events, or otherwise. You should review the risks contained in our Annual Report on Form 10-K, filed with the Securities and Exchange Commission on February 13, 2017.
2

NEWS RELEASE | www.federalrealty.com |
FOR IMMEDIATE RELEASE | |
Investor Inquiries: | Media Inquiries: |
Leah Andress | Andrea Simpson |
Investor Relations Associate | Vice President, Marketing |
301.998.8265 | 617.684.1511 |
landress@federalrealty.com | asimpson@federalrealty.com |
Federal Realty Investment Trust Announces First Quarter 2017 Operating Results
ROCKVILLE, Md. (May 3, 2017) - Federal Realty Investment Trust (NYSE:FRT) today reported operating results for its first quarter ended March 31, 2017. Highlights of the quarter include:
• | Generated earnings per diluted share of $0.78 for the quarter compared to $1.10 in first quarter 2016 which included a $0.37 gain on change in control of interests. |
• | Generated FFO per diluted share of $1.45 for the quarter compared to $1.38 in first quarter 2016, representing growth of 5.1%. |
• | Generated same center property operating income growth of 4.3% for the first quarter. |
• | Signed leases for 523,869 sf of comparable space (591,765 sf total) in the first quarter at an average rent of $34.91 psf and achieved cash basis rollover growth on those comparable spaces of 11%. |
• | Acquired Riverpoint Center, 211,000 sf shopping center on 17 acres of land in Chicago, Illinois for $107 million. |
• | Increased our 2017 FFO per diluted share guidance range to $5.85 - $5.93 |
“We’re very pleased to deliver another quarter of record bottom line results to our shareholders,” said Donald C. Wood, President and Chief Executive Office of Federal Realty. “Our team remains focused on uncovering value creative opportunities throughout our existing portfolio - whether it be through redevelopment or remerchandising - in order to keep our centers relevant for years to come. We also continue to identify potential infill acquisitions in order to re-stock our redevelopment pipeline and drive future growth opportunities. Our record results reflect the broad base of our balanced business plan as we continue to position our portfolio to meet the needs of the changing retail environment.”
Financial Results
Net income available for common shareholders was $56.1 million and earnings per diluted share was $0.78 for first quarter 2017 versus $76.8 million and $1.10, respectively, for first quarter 2016 which included a $0.37 gain on change in control of interests.
3

In the first quarter 2017, Federal Realty generated funds from operations available for common shareholders (FFO) of $105.8 million, or $1.45 per diluted share. This compares to FFO of $97.6 million, or $1.38 per diluted share, in first quarter 2016.
FFO is a non-GAAP supplemental earnings measure which the Trust considers meaningful in measuring its operating performance. A reconciliation of FFO to net income is attached to this press release.
Portfolio Results
In first quarter 2017, same-center property operating income increased 4.3% when including properties that are being redeveloped and 1.0% when excluding those properties. Our proactive anchor releasing efforts to reposition our properties for the future continued to negatively impact our same-store quarterly results.
The overall portfolio was 94.6% leased as of March 31, 2017, compared to 94.4% on December 31, 2016 and 94.1% on March 31, 2016. Federal Realty’s same center portfolio was 95.8% leased on March 31, 2017, compared to 95.7% on December 31, 2016 and 95.9% on March 31, 2016.
During first quarter 2017, Federal Realty signed 114 leases for 591,765 square feet of retail space. On a comparable space basis (i.e., spaces for which there was a former tenant), Federal Realty leased 523,869 square feet at an average cash basis contractual rent increase (i.e., excluding the impact of straight-line rents) of 11%. The average contractual rent on this comparable space for the first year of the new leases is $34.91 per square foot compared to the average contractual rent of $31.31 per square foot for the last year of the prior leases. The previous average contractual rent was calculated by including both the minimum rent and any percentage rent actually paid during the last year of the lease term for the re-leased space. On a straight-line basis, rent increases for comparable retail space averaged 23% for first quarter 2017.
Regular Quarterly Dividends
Federal Realty also announced today that its Board of Trustees declared a regular quarterly cash dividend of $0.98 per common share, resulting in an indicated annual rate of $3.92 per common share. The regular common dividend will be payable on July 17, 2017 to common shareholders of record as of June 22, 2017.
Summary of Other Quarterly Activities and Recent Developments
• | March 31, 2017 - Federal Realty acquired Riverpoint Center, a 211,000 square foot grocery anchored community shopping center with surface parking on 17 acres of land in Chicago, Illinois. The property is located in affluent Lincoln Park and is 3.5 miles northwest of downtown Chicago. The Trust sourced the acquisition off-market for $107 million cash. |
4

• | March 28, 2017 - Federal Realty announced its exclusive partnership with Freight Farms, a Boston-based company that retrofits shipping containers with vertical farming technology capable of growing acres' worth of |
produce in a fraction of the space of traditional farms. The partnership empowers anyone to use this technology while repurposing Federal Realty's unused parking spaces as a place to locally and sustainably produce food that benefits the shopping centers' tenants, customers and community.
Guidance
Federal Realty increased its 2017 guidance for FFO per diluted share to $5.85 to $5.93 and 2017 earnings per diluted share guidance to $3.35 to $3.43.
Conference Call Information
Federal Realty’s management team will present an in-depth discussion of the Trust’s operating performance on its first quarter 2017 earnings conference call, which is scheduled for Thursday, May 4, 2017 at 11:00AM ET. To participate, please call 877.445.3230 five to ten minutes prior to the call start time and use the passcode 94377266 (required). A replay of the webcast will be available on Federal Realty’s website www.federalrealty.com, which will remain available for 30 days following the call. A telephonic replay of the conference call will also be available through May 11, 2017 by dialing 855.859.2056; Passcode: 94377266.
About Federal Realty
Federal Realty is a recognized leader in the ownership, operation and redevelopment of high-quality retail based properties located primarily in major coastal markets from Washington, D.C. to Boston as well as San Francisco and Los Angeles. Founded in 1962, our mission is to deliver long term, sustainable growth through investing in densely populated, affluent communities where retail demand exceeds supply. Our expertise includes creating urban, mixed-use neighborhoods like Santana Row in San Jose, California, Pike & Rose in North Bethesda, Maryland and Assembly Row in Somerville, Massachusetts. These unique and vibrant environments that combine shopping, dining, living and working provide a destination experience valued by their respective communities. Federal Realty's 98 properties include over 2,800 tenants, in approximately 23 million square feet, and over 1,800 residential units.
Federal Realty has paid quarterly dividends to its shareholders continuously since its founding in 1962, and has increased its dividend rate for 49 consecutive years, the longest record in the REIT industry. Federal Realty shares are traded on the NYSE under the symbol FRT. For additional information about Federal Realty and its properties, visit www.FederalRealty.com.
5

Safe Harbor Language
Certain matters discussed within this press release may be deemed to be forward-looking statements within the meaning of the federal securities laws. Although Federal Realty believes the expectations reflected in the forward-looking statements are based on reasonable assumptions, it can give no assurance that its expectations will be attained. These factors include, but are not limited to, the risk factors described in our Annual Report on Form 10-K filed on February 13, 2017, and include the following:
• | risks that our tenants will not pay rent, may vacate early or may file for bankruptcy or that we may be unable to renew leases or re-let space at favorable rents as leases expire; |
• | risks that we may not be able to proceed with or obtain necessary approvals for any redevelopment or renovation project, and that completion of anticipated or ongoing property redevelopments or renovation projects that we do pursue may cost more, take more time to complete, or fail to perform as expected; |
• | risks that we are investing a significant amount in ground-up development projects that may not perform as planned, may be dependent on third parties to deliver critical aspects of certain projects, requires spending a substantial amount upfront in infrastructure, and assumes receipt of public funding which has been committed but not entirely funded; |
• | risks normally associated with the real estate industry, including risks that occupancy levels at our properties and the amount of rent that we receive from our properties may be lower than expected, that new acquisitions may fail to perform as expected, that competition for acquisitions could result in increased prices for acquisitions, that costs associated with the periodic maintenance and repair or renovation of space, insurance and other operations may increase, that environmental issues may develop at our properties and result in unanticipated costs, and, because real estate is illiquid, that we may not be able to sell properties when appropriate; |
• | risks that our growth will be limited if we cannot obtain additional capital; |
• | risks associated with general economic conditions, including local economic conditions in our geographic markets; |
• | risks of financing, such as our ability to consummate additional financings or obtain replacement financing on terms which are acceptable to us, our ability to meet existing financial covenants and the limitations imposed on our operations by those covenants, and the possibility of increases in interest rates that would result in increased interest expense; and |
• | risks related to our status as a real estate investment trust, commonly referred to as a REIT, for federal income tax purposes, such as the existence of complex tax regulations relating to our status as a REIT, the effect of future changes in REIT requirements as a result of new legislation, and the adverse consequences of the failure to qualify as a REIT. |
Given these uncertainties, readers are cautioned not to place undue reliance on any forward-looking statements that we make, including those in this press release. Except as may be required by law, we make no promise to update any of the forward-looking statements as a result of new information, future events or otherwise. You should carefully review the risks and risk factors included in our Annual Report on Form 10-K filed with the Securities and Exchange Commission on February 13, 2017.
6
Federal Realty Investment Trust | |||||||
Consolidated Income Statements | |||||||
March 31, 2017 | |||||||
Three Months Ended | |||||||
March 31, | |||||||
2017 | 2016 | ||||||
(in thousands, except per share data) | |||||||
(unaudited) | |||||||
REVENUE | |||||||
Rental income | $ | 204,447 | $ | 195,308 | |||
Other property income | 2,190 | 2,312 | |||||
Mortgage interest income | 752 | 724 | |||||
Total revenue | 207,389 | 198,344 | |||||
EXPENSES | |||||||
Rental expenses | 41,109 | 42,819 | |||||
Real estate taxes | 25,090 | 22,794 | |||||
General and administrative | 8,267 | 8,010 | |||||
Depreciation and amortization | 51,379 | 47,799 | |||||
Total operating expenses | 125,845 | 121,422 | |||||
OPERATING INCOME | 81,544 | 76,922 | |||||
Other interest income | 106 | 103 | |||||
Interest expense | (23,758 | ) | (23,729 | ) | |||
Income from real estate partnerships | — | 41 | |||||
INCOME FROM CONTINUING OPERATIONS | 57,892 | 53,337 | |||||
Gain on sale of real estate and change in control of interests | 178 | 25,726 | |||||
NET INCOME | 58,070 | 79,063 | |||||
Net income attributable to noncontrolling interests | (1,880 | ) | (2,108 | ) | |||
NET INCOME ATTRIBUTABLE TO THE TRUST | 56,190 | 76,955 | |||||
Dividends on preferred shares | (135 | ) | (135 | ) | |||
NET INCOME AVAILABLE FOR COMMON SHAREHOLDERS | $ | 56,055 | $ | 76,820 | |||
EARNINGS PER COMMON SHARE, BASIC | |||||||
Continuing operations | $ | 0.78 | $ | 0.73 | |||
Gain on sale of real estate and change in control of interests, net | — | 0.37 | |||||
$ | 0.78 | $ | 1.10 | ||||
Weighted average number of common shares, basic | 71,862 | 69,771 | |||||
EARNINGS PER COMMON SHARE, DILUTED | |||||||
Continuing operations | $ | 0.78 | $ | 0.73 | |||
Gain on sale of real estate and change in control of interests, net | — | 0.37 | |||||
$ | 0.78 | $ | 1.10 | ||||
Weighted average number of common shares, diluted | 72,005 | 69,957 | |||||
7
Federal Realty Investment Trust | |||||||
Consolidated Balance Sheets | |||||||
March 31, 2017 | |||||||
March 31, | December 31, | ||||||
2017 | 2016 | ||||||
(in thousands, except share and per share data) | |||||||
(unaudited) | |||||||
ASSETS | |||||||
Real estate, at cost | |||||||
Operating (including $1,235,147 and $1,226,918 of consolidated variable interest entities, respectively) | $ | 6,294,142 | $ | 6,125,957 | |||
Construction-in-progress | 687,356 | 599,260 | |||||
Asset held for sale | 33,856 | 33,856 | |||||
7,015,354 | 6,759,073 | ||||||
Less accumulated depreciation and amortization (including $217,449 and $209,239 of consolidated variable interest entities, respectively) | (1,766,239 | ) | (1,729,234 | ) | |||
Net real estate | 5,249,115 | 5,029,839 | |||||
Cash and cash equivalents | 20,112 | 23,368 | |||||
Accounts and notes receivable, net | 115,775 | 116,749 | |||||
Mortgage notes receivable, net | 29,904 | 29,904 | |||||
Investment in real estate partnerships | 14,540 | 14,864 | |||||
Prepaid expenses and other assets | 226,754 | 208,555 | |||||
TOTAL ASSETS | $ | 5,656,200 | $ | 5,423,279 | |||
LIABILITIES AND SHAREHOLDERS’ EQUITY | |||||||
Liabilities | |||||||
Mortgages payable (including $436,494 and $439,120 of consolidated variable interest entities, respectively) | $ | 468,284 | $ | 471,117 | |||
Capital lease obligations | 71,582 | 71,590 | |||||
Notes payable | 496,311 | 279,151 | |||||
Senior notes and debentures | 1,977,192 | 1,976,594 | |||||
Accounts payable and accrued expenses | 191,901 | 201,756 | |||||
Dividends payable | 71,647 | 71,440 | |||||
Security deposits payable | 16,499 | 16,285 | |||||
Other liabilities and deferred credits | 144,979 | 115,817 | |||||
Total liabilities | 3,438,395 | 3,203,750 | |||||
Commitments and contingencies | |||||||
Redeemable noncontrolling interests | 141,003 | 143,694 | |||||
Shareholders’ equity | |||||||
Preferred shares, authorized 15,000,000 shares, $.01 par: 5.417% Series 1 Cumulative Convertible Preferred Shares, (stated at liquidation preference $25 per share), 399,896 shares issued and outstanding | 9,997 | 9,997 | |||||
Common shares of beneficial interest, $.01 par, 100,000,000 shares authorized, 72,236,981 and 71,995,897 shares issued and outstanding, respectively | 725 | 722 | |||||
Additional paid-in capital | 2,736,921 | 2,718,325 | |||||
Accumulated dividends in excess of net income | (764,458 | ) | (749,734 | ) | |||
Accumulated other comprehensive loss | (1,493 | ) | (2,577 | ) | |||
Total shareholders’ equity of the Trust | 1,981,692 | 1,976,733 | |||||
Noncontrolling interests | 95,110 | 99,102 | |||||
Total shareholders’ equity | 2,076,802 | 2,075,835 | |||||
TOTAL LIABILITIES AND SHAREHOLDERS’ EQUITY | $ | 5,656,200 | $ | 5,423,279 | |||
8
Federal Realty Investment Trust | ||||||||
Funds From Operations / Summary of Capital Expenditures | ||||||||
March 31, 2017 | ||||||||
Three Months Ended | ||||||||
March 31, | ||||||||
2017 | 2016 | |||||||
(in thousands, except per share data) | ||||||||
Funds from Operations available for common shareholders (FFO) (1) | ||||||||
Net income | $ | 58,070 | $ | 79,063 | ||||
Net income attributable to noncontrolling interests | (1,880 | ) | (2,108 | ) | ||||
Gain on sale of real estate and change in control of interests, net | (70 | ) | (25,726 | ) | ||||
Depreciation and amortization of real estate assets | 44,682 | 41,728 | ||||||
Amortization of initial direct costs of leases | 4,684 | 4,204 | ||||||
Funds from operations | 105,486 | 97,161 | ||||||
Dividends on preferred shares | (135 | ) | (135 | ) | ||||
Income attributable to operating partnership units | 784 | 855 | ||||||
Income attributable to unvested shares | (340 | ) | (292 | ) | ||||
FFO | $ | 105,795 | $ | 97,589 | ||||
Weighted average number of common shares, diluted | 72,805 | 70,867 | ||||||
FFO per diluted share | $ | 1.45 | $ | 1.38 | ||||
Summary of Capital Expenditures | ||||||||
Non-maintenance capital expenditures | ||||||||
Development, redevelopment and expansions | $ | 105,826 | $ | 69,808 | ||||
Tenant improvements and incentives | 9,150 | 7,159 | ||||||
Total non-maintenance capital expenditures | 114,976 | 76,967 | ||||||
Maintenance capital expenditures | 3,427 | 1,689 | ||||||
Total capital expenditures | $ | 118,403 | $ | 78,656 | ||||
Dividends and Payout Ratios | ||||||||
Regular common dividends declared | $ | 70,696 | $ | 66,571 | ||||
Dividend payout ratio as a percentage of FFO | 67 | % | 68 | % | ||||
Notes:
1) | See Glossary of Terms. |
9
Federal Realty Investment Trust | |||||||||
Market Data | |||||||||
March 31, 2017 | |||||||||
March 31, | |||||||||
2017 | 2016 | ||||||||
(in thousands, except per share data) | |||||||||
Market Data | |||||||||
Common shares outstanding and operating partnership units (1) | 73,037 | 71,764 | |||||||
Market price per common share | $ | 133.50 | $ | 156.05 | |||||
Common equity market capitalization including operating partnership units | $ | 9,750,440 | $ | 11,198,772 | |||||
Series 1 preferred shares outstanding (2) | 400 | 400 | |||||||
Liquidation price per Series 1 preferred share | $ | 25.00 | $ | 25.00 | |||||
Series 1 preferred equity market capitalization | $ | 10,000 | $ | 10,000 | |||||
Equity market capitalization | $ | 9,760,440 | $ | 11,208,772 | |||||
Total debt (3) | 3,013,369 | 2,659,322 | |||||||
Total market capitalization | $ | 12,773,809 | $ | 13,868,094 | |||||
Total debt to market capitalization at the current market price | 24 | % | 19 | % | |||||
Fixed rate debt ratio: | |||||||||
Fixed rate debt and capital lease obligations (4) | 93 | % | 98 | % | |||||
Variable rate debt | 7 | % | 2 | % | |||||
100 | % | 100 | % | ||||||
Notes:
1) | Amounts include 799,962 and 902,368 operating partnership units outstanding at March 31, 2017 and 2016, respectively. |
2) | These shares, issued March 8, 2007, are unregistered. |
3) | Total debt includes capital leases, mortgages payable, notes payable, senior notes and debentures, net of premiums and discounts from our consolidated balance sheet. |
4) | Fixed rate debt includes our $275.0 million term loan as the rate is effectively fixed by two interest rate swap agreements. |
10
Federal Realty Investment Trust | |||||||
Components of Rental Income | |||||||
March 31, 2017 | |||||||
Three Months Ended | |||||||
March 31, | |||||||
2017 | 2016 | ||||||
(in thousands) | |||||||
Minimum rents(1) | |||||||
Retail and commercial | $ | 142,143 | $ | 134,586 | |||
Residential | 13,503 | 11,449 | |||||
Cost reimbursements | 41,518 | 41,802 | |||||
Percentage rents | 2,823 | 3,069 | |||||
Other | 4,460 | 4,402 | |||||
Total rental income | $ | 204,447 | $ | 195,308 | |||
Notes:
1) | Minimum rents include $3.6 million and $2.0 million for the three months ended March 31, 2017 and 2016, respectively, to recognize minimum rents on a straight-line basis. In addition, minimum rents include $1.1 million and $0.3 million for the three months ended March 31, 2017 and 2016, respectively, to recognize income from the amortization of in-place leases. |
11
Federal Realty Investment Trust | ||||||||||||||
Summary of Outstanding Debt and Capital Lease Obligations | ||||||||||||||
March 31, 2017 | ||||||||||||||
As of March 31, 2017 | ||||||||||||||
Stated maturity date | Stated interest rate | Balance | Weighted average effective rate (3) | |||||||||||
(in thousands) | ||||||||||||||
Mortgages Payable | ||||||||||||||
Secured fixed rate | ||||||||||||||
Plaza El Segundo | 8/5/2017 | 6.33% | $ | 175,000 | ||||||||||
The Grove at Shrewsbury (East) | 10/1/2017 | 5.82% | 42,272 | |||||||||||
The Grove at Shrewsbury (West) | 3/1/2018 | 6.38% | 10,732 | |||||||||||
Rollingwood Apartments | 5/1/2019 | 5.54% | 21,165 | |||||||||||
The Shops at Sunset Place | 9/1/2020 | 5.62% | 68,124 | |||||||||||
29th Place | 1/31/2021 | 5.91% | 4,501 | |||||||||||
THE AVENUE at White Marsh | 1/1/2022 | 3.35% | 52,705 | |||||||||||
Montrose Crossing | 1/10/2022 | 4.20% | 72,314 | |||||||||||
Brook 35 | 7/1/2029 | 4.65% | 11,500 | |||||||||||
Chelsea | 1/15/2031 | 5.36% | 6,500 | |||||||||||
Subtotal | 464,813 | |||||||||||||
Net unamortized premium and debt issuance costs | 3,471 | |||||||||||||
Total mortgages payable | 468,284 | 4.45% | ||||||||||||
Notes payable | ||||||||||||||
Unsecured fixed rate | ||||||||||||||
Term loan (1) | 11/21/2018 | LIBOR + 0.90% | 275,000 | |||||||||||
Various | Various through 2028 | 11.31% | 5,271 | |||||||||||
Unsecured variable rate | ||||||||||||||
Revolving credit facility (2) | 4/20/2020 | LIBOR + 0.825% | 217,000 | |||||||||||
Subtotal | 497,271 | |||||||||||||
Net unamortized debt issuance costs | (960 | ) | ||||||||||||
Total notes payable | 496,311 | 2.46% | (4) | |||||||||||
Senior notes and debentures | ||||||||||||||
Unsecured fixed rate | ||||||||||||||
5.90% notes | 4/1/2020 | 5.90% | 150,000 | |||||||||||
2.55% notes | 1/15/2021 | 2.55% | 250,000 | |||||||||||
3.00% notes | 8/1/2022 | 3.00% | 250,000 | |||||||||||
2.75% notes | 6/1/2023 | 2.75% | 275,000 | |||||||||||
3.95% notes | 1/15/2024 | 3.95% | 300,000 | |||||||||||
7.48% debentures | 8/15/2026 | 7.48% | 29,200 | |||||||||||
6.82% medium term notes | 8/1/2027 | 6.82% | 40,000 | |||||||||||
4.50% notes | 12/1/2044 | 4.50% | 450,000 | |||||||||||
3.625% notes | 8/1/2046 | 3.625% | 250,000 | |||||||||||
Subtotal | 1,994,200 | |||||||||||||
Net unamortized discount and debt issuance costs | (17,008 | ) | ||||||||||||
Total senior notes and debentures | 1,977,192 | 3.98% | ||||||||||||
Capital lease obligations | ||||||||||||||
Various | Various through 2106 | Various | 71,582 | 8.04% | ||||||||||
Total debt and capital lease obligations | $ | 3,013,369 | ||||||||||||
Total fixed rate debt and capital lease obligations | $ | 2,796,369 | 93 | % | 4.07% | |||||||||
Total variable rate debt | 217,000 | 7 | % | 1.77% | (4) | |||||||||
Total debt and capital lease obligations | $ | 3,013,369 | 100 | % | 3.90% | (4) | ||||||||
12
Three Months Ended | |||
March 31, | |||
2017 | 2016 | ||
Operational Statistics | |||
Ratio of EBITDA to combined fixed charges and preferred share dividends (5) | 4.48x | 5.38x | |
Ratio of adjusted EBITDA to combined fixed charges and preferred share dividends (5) | 4.48x | 4.46x | |
Notes:
1) | We entered into two interest rate swap agreements to fix the variable rate portion of our $275.0 million term loan at 1.72% through November 1, 2018. The swap agreements effectively fix the rate on the term loan at 2.62% and thus, the loan is included in fixed rate debt. |
2) | The maximum amount drawn under our revolving credit facility during the three months ended March 31, 2017 was $217.0 million, and the weighted average interest rate on borrowings under our revolving credit facility, before amortization of debt fees, was 1.6%. |
3) | The weighted average effective interest rate includes the amortization of any debt issuance costs and discounts and premiums, if applicable, except as described in Note 4. |
4) | The weighted average effective interest rate excludes $0.5 million in quarterly financing fees and quarterly debt fee amortization on our revolving credit facility which had a $217.0 million balance on March 31, 2017. In addition, the weighted average effective interest rate is calculated using the fixed rate on our term loan of 2.62% as the result of the interest rate swap agreements discussed in Note 1. The term loan is included in fixed rate debt. |
5) | Fixed charges consist of interest on borrowed funds (including capitalized interest), amortization of debt discount/premium and debt costs, and the portion of rent expense representing an interest factor. EBITDA includes a gain on sale of real estate and change in control of interests of $0.2 million and $25.7 million for the three months ended March 31, 2017 and 2016, respectively. Adjusted EBITDA is reconciled to net income in the Glossary of Terms. |
13
Federal Realty Investment Trust | |||||||||||||||||||||
Summary of Debt Maturities | |||||||||||||||||||||
March 31, 2017 | |||||||||||||||||||||
Year | Scheduled Amortization | Maturities | Total | Percent of Debt Maturing | Cumulative Percent of Debt Maturing | Weighted Average Rate (4) | |||||||||||||||
(in thousands) | |||||||||||||||||||||
2017 | $ | 4,737 | $ | 216,732 | $ | 221,469 | 7.3 | % | 7.3 | % | 4.7 | % | |||||||||
2018 | 5,525 | 285,502 | (1) | 291,027 | 9.6 | % | 16.9 | % | 2.9 | % | |||||||||||
2019 | 5,455 | 20,160 | 25,615 | 0.9 | % | 17.8 | % | 5.7 | % | ||||||||||||
2020 | 4,769 | 427,593 | (2) | 432,362 | 14.3 | % | 32.1 | % | 3.6 | % | (5) | ||||||||||
2021 | 3,110 | 253,625 | 256,735 | 8.5 | % | 40.6 | % | 2.8 | % | ||||||||||||
2022 | 1,237 | 366,323 | 367,560 | 12.1 | % | 52.7 | % | 3.5 | % | ||||||||||||
2023 | 1,237 | 330,010 | 331,247 | 10.9 | % | 63.6 | % | 3.9 | % | ||||||||||||
2024 | 1,003 | 300,000 | 301,003 | 9.9 | % | 73.5 | % | 4.2 | % | ||||||||||||
2025 | 543 | — | 543 | — | % | 73.5 | % | — | % | ||||||||||||
2026 | 490 | 29,200 | 29,690 | 1.0 | % | 74.5 | % | 7.5 | % | ||||||||||||
Thereafter | 19,115 | 751,500 | 770,615 | 25.5 | % | 100.0 | % | 4.5 | % | ||||||||||||
Total | $ | 47,221 | $ | 2,980,645 | $ | 3,027,866 | (3) | 100.0 | % | ||||||||||||
Notes:
1) | Our $275.0 million unsecured term loan matures on November 21, 2018, aubject to a one-year extension at our option. |
2) | Our $800.0 million revolving credit facility matures on April 20, 2020, subject to two six-month extensions at our option. As of March 31, 2017, there was $217.0 million outstanding under this credit facility. |
3) | The total debt maturities differs from the total reported on the consolidated balance sheet due to the unamortized net premium/(discount) and debt issuance costs on certain mortgage loans, notes payable, and senior notes as of March 31, 2017. |
4) | The weighted average rate reflects the weighted average interest rate on debt maturing in the respective year. |
5) | The weighted average rate excludes $0.5 million in quarterly financing fees and quarterly debt fee amortization on our revolving credit facility. |
14
Federal Realty Investment Trust | |||||||||||
Summary of Redevelopment Opportunities | |||||||||||
March 31, 2017 | |||||||||||
The following redevelopment opportunities have received or will shortly receive all necessary approvals to proceed and are actively being worked on by the Trust. (1) | |||||||||||
Property | Location | Opportunity | Projected ROI (2) | Projected Cost (1) | Cost to Date | Anticipated Stabilization (3) | |||||
(in millions) | (in millions) | ||||||||||
The Point | El Segundo, CA | Addition of 90,000 square feet of retail and 25,000 square feet of office space | 7 | % | $88 | $86 | 2017 | ||||
Towson Residential | Towson, MD | New 105 unit 5-story apartment building with above grade parking | 6 | % | $20 | $12 | 2018 | ||||
Plaza Del Mercado | Silver Spring, MD | Demolition of former grocery anchor space to construct spaces for new grocery anchor and fitness center tenants | 8 | % | $16 | $15 | 2017 | ||||
Tower Shops | Davie, FL | Addition of 50,000 square foot pad building | 12 | % | $15 | $14 | 2017 | ||||
Del Mar Village | Boca Raton, FL | Demolition of small shop spaces and relocation of tenants to accommodate new 37,000 square foot fitness center tenant | 7 | % | $11 | $4 | 2018 | ||||
Montrose Crossing | Rockville, MD | Demolition of 10,000 square foot restaurant building to construct an 18,000 square foot multi-tenant pad building | 11 | % | $10 | $1 | 2018 | ||||
Pike 7 | Vienna, VA | Addition of 8,300 square foot multi-tenant retail pad building | 7 | % | $10 | $4 | 2019 | ||||
Willow Lawn | Richmond, VA | Demolition of small shop and mini anchor spaces to construct new 49,000 square foot anchor space to accommodate new sporting goods retailer and new 17,000 square foot building for relocation of existing tenant | 7 | % | $10 | $1 | 2018 | ||||
Mercer Mall | Lawrenceville, NJ | Redevelopment of recently acquired office building pre-leased to a single tenant user | 7 | % | $9 | $4 | 2018 | ||||
The AVENUE at White Marsh | White Marsh, MD | Addition of two new pad sites totaling 13,000 square feet, a new 3,600 square foot restaurant building, and a drive up ATM | 10 | % | $5 | $3 | 2017 | ||||
Santana Row | San Jose, CA | Addition of two retail kiosks and open air plaza upgrades | 8 | % | $5 | $5 | Stabilized | ||||
Eastgate Crossing | Chapel Hill, NC | New 7,400 square foot multi-tenant pad building on site of existing gas station | 8 | % | $4 | $3 | 2017 | ||||
Free State Shopping Center | Bowie, MD | Demolition of 26,000 square foot vacant building to allow for construction of new 12,500 square foot pad building for new daycare tenant | 8 | % | $4 | $4 | Stabilized | ||||
Total Active Redevelopment projects (4) | 8 | % | $207 | $156 | |||||||
Notes:
(1) | There is no guarantee that the Trust will ultimately complete any or all of these opportunities, that the Projected Return on Investment (ROI) or Projected Costs will be the amounts shown or that stabilization will occur as anticipated. The projected ROI and Projected Cost are management's best estimate based on current information and may change over time. |
(2) | Projected ROI for redevelopment projects generally reflects only the deal specific cash, unleveraged incremental Property Operating Income (POI) generated by the redevelopment and is calculated as Incremental POI divided by incremental cost. Incremental POI is the POI generated by the redevelopment after deducting rent being paid or management's estimate of rent to be paid for the redevelopment space and any other space taken out of service to accommodate the redevelopment. Projected ROI for redevelopment projects does NOT include peripheral impacts, such as the impact on future lease rollovers at the property or the impact on the long-term value of the property. |
(3) | Stabilization is generally the year in which 95% physical occupancy of the redeveloped space is achieved. Economic stabilization may occur at a later point in time. |
(4) | All subtotals and totals reflect cost weighted-average ROIs. |
15
Federal Realty Investment Trust | |||||||||||||
Assembly Row, Pike & Rose, and Santana Row | |||||||||||||
March 31, 2017 | |||||||||||||
Projected POI Delivered (as a % of Total) | |||||||||||||
Projected | Total | Costs to | For Year Ended December 31, (2) | ||||||||||
Property (1) | Location | Opportunity | ROI (3) | Cost (4) | Date | 2017 | 2018 | 2019 | Expected Opening Timeframe | ||||
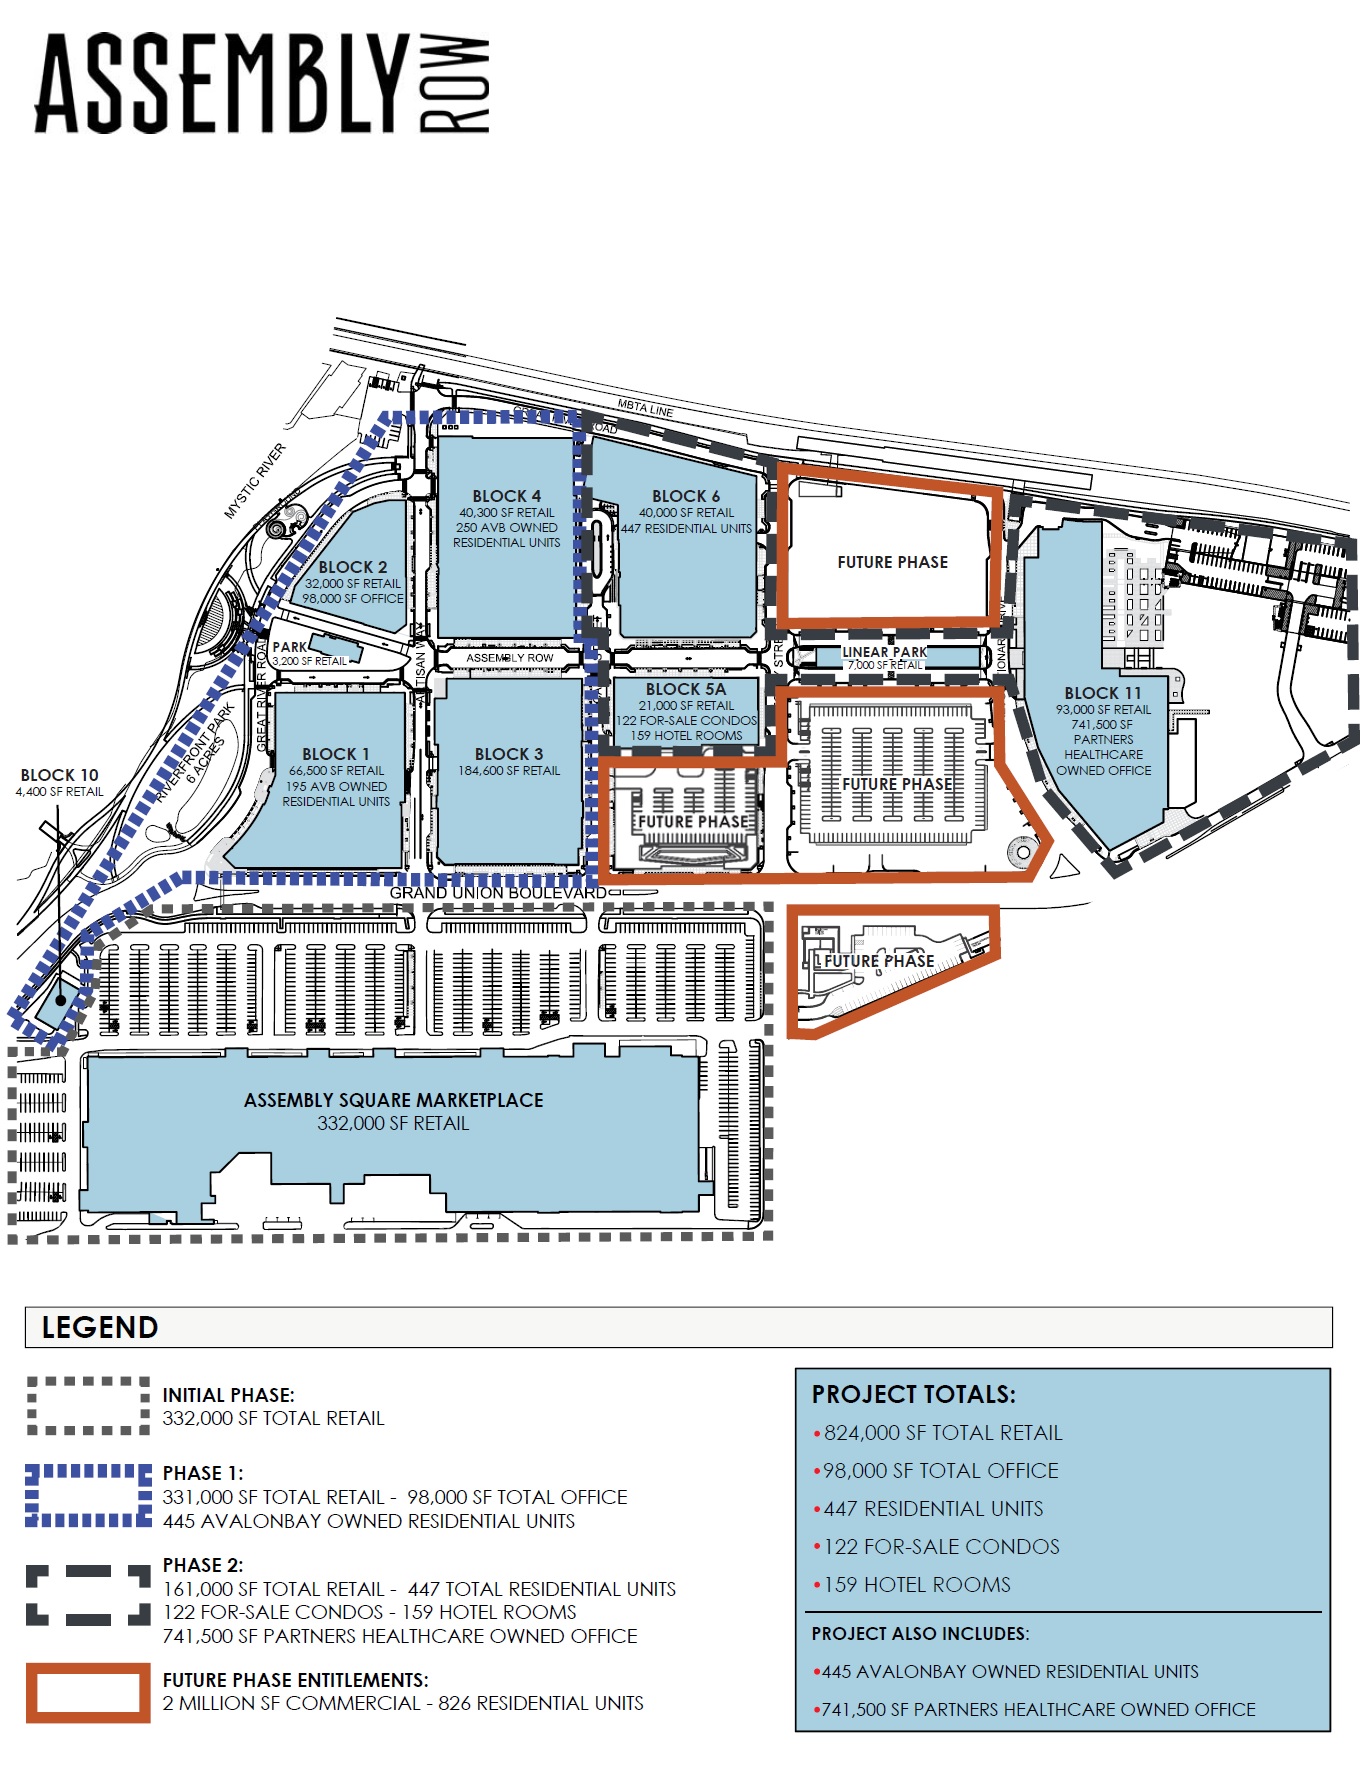
Assembly Row | Somerville, MA | ||||||||||||
Phase II | - 161,000 SF of retail | 7% | (5) | $280 - 295 | $231 | — | 50% | 90% | Opening projected 2Q 2017 through 2Q 2018 | ||||
- 447 residential units | 741,500 SF Partners Healthcare office space | ||||||||||||
- 159 boutique hotel rooms | (built by Partners) opened in 2016 | ||||||||||||
- 122 for-sale condominium units | — | (6) | $70 - 75 | $41 | Projected closings to commence 2Q 2018 | ||||||||
Future Phases | - 2M SF of commercial | TBD | TBD | TBD | |||||||||
- 826 residential units | |||||||||||||
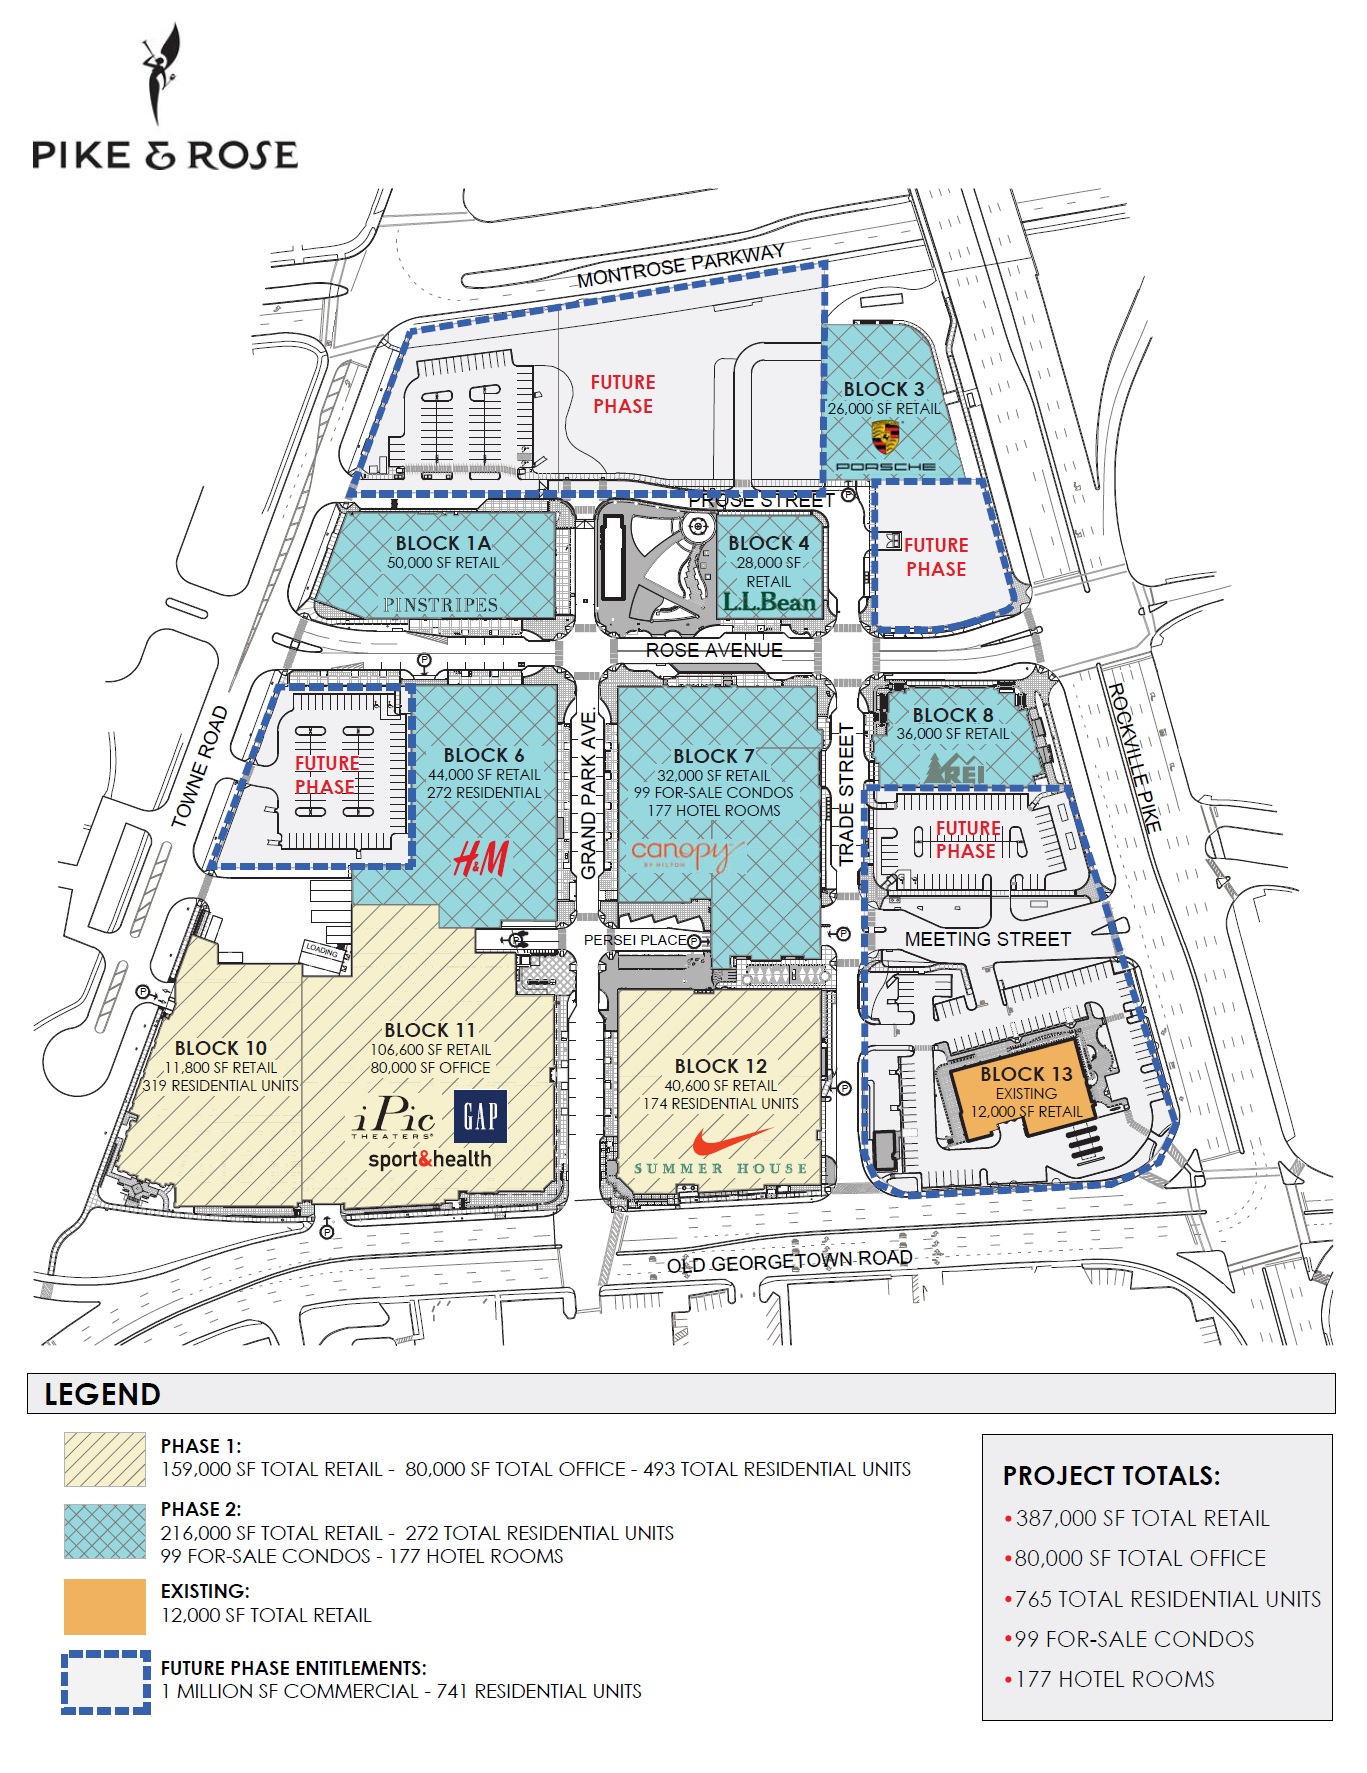
Pike & Rose | North Bethesda, MD | ||||||||||||
Phase I | - 159,000 SF of retail | 6-7% | (7) | $265 - 270 | $266 | 75% | 90% | 100% | Retail & office open | ||||
- 80,000 SF of office | Residential opened in 2014 (174 units) and | ||||||||||||
- 493 residential units | 2015/16 (319 units) | ||||||||||||
Phase II | - 216,000 SF of retail | 6-7% | (5) | $200 - 207 | $136 | — | 65% | 85% | Opening projected 2Q 2017 through 2Q 2018 | ||||
- 272 residential units | |||||||||||||
- 177 hotel rooms | |||||||||||||
- 99 for-sale condominium units | — | (6) | $53 - 58 | $34 | Projected closings to commence 2Q 2018 | ||||||||
Future Phases | - 1M SF of commercial | TBD | TBD | TBD | |||||||||
- 741 residential units | |||||||||||||
Santana Row | San Jose, CA | ||||||||||||
700 Santana Row | - 284,000 SF of office | 7% | $205 - 215 | $20 | — | — | TBD | Commenced construction 4Q 2016 | |||||
- 29,000 SF of retail & 1,300 parking spaces | Opening projected 2019 | ||||||||||||
Future Phases | - 321,000 SF of commercial | TBD | TBD | TBD | |||||||||
- 395 residential units | |||||||||||||
Notes:
(1) | Anticipated opening dates, total cost, projected return on investment (ROI), and projected POI percentages are subject to adjustment as a result of factors inherent in the development process, some of which may not be | |||||
under the direct control of the Company. Refer to the Company's filings with the Securities and Exchange Commission on Form 10-K and Form 10-Q for other risk factors. | ||||||
(2) | Percentage figures reflect (i) the projected POI (herein defined) for the stated year divided by (ii) the current projected annual stabilized POI for the Property. These percentages are projections only and we cannot give any | |||||
assurances that these amounts will actually be achieved. | ||||||
(3) | Projected ROI for development projects reflects the unleveraged Property Operating Income (POI) generated by the development and is calculated as POI divided by cost. | |||||
(4) | Projected costs for Assembly Row and Pike & Rose include an allocation of infrastructure costs for the entire project. | |||||
(5) | Costs are net of expected reimbursement by third parties and land sale proceeds from expected exercise of option. Phase II total costs include our share of the costs in the hotel. | |||||
(6) | Condominiums shown at cost; the projected ROI for Phase II does not assume any incremental profit on the sale of condominium units; condominiums are assumed to be sold at cost. | |||||
(7) | Excludes approximately $6 million of costs incurred to date of which we have claims for recovery against 3rd parties. | |||||
16
Federal Realty Investment Trust
Assembly Row Site Plan
March 31, 2017
17
Federal Realty Investment Trust
Pike & Rose Site Plan
March 31, 2017
18
Federal Realty Investment Trust | |||||||
Future Redevelopment Opportunities | |||||||
March 31, 2017 | |||||||
We have identified the following potential opportunities to create future shareholder value. Executing these opportunities could be subject to government approvals, tenant consents, market conditions, etc. Work on many of these new opportunities is in its preliminary stages and may not ultimately come to fruition. This list will change from time to time as we identify hurdles that cannot be overcome in the near term, and focus on those opportunities that are most likely to lead to the creation of shareholder value over time. | |||||||
Pad Site Opportunities - Opportunities to add both single tenant and multi-tenant stand alone pad buildings at existing retail properties. Many of these opportunities are "by right" and construction is awaiting appropriate retailer demand. | |||||||
Bethesda Row | Bethesda, MD | Fresh Meadows | Queens, NY | ||||
Dedham Plaza | Dedham, MA | Melville Mall | Huntington, NY | ||||
Escondido Promenade | Escondido, CA | Mercer Mall | Lawrenceville, NJ | ||||
Federal Plaza | Rockville, MD | Pan Am | Fairfax, VA | ||||
Flourtown | Flourtown, PA | Wildwood | Bethesda, MD | ||||
Property Expansion or Conversion - Opportunities at successful retail properties to convert previously underutilized land into new GLA and to convert other existing uses into more productive uses for the property. | |||||||
Barracks Road | Charlottesville, VA | Northeast | Philadelphia, PA | ||||
Bethesda Row | Bethesda, MD | Riverpoint Center | Chicago, IL | ||||
Brick | Brick, NJ | The Shops at Sunset Place | South Miami, FL | ||||
CocoWalk | Coconut Grove, FL | Third Street Promenade | Santa Monica, CA | ||||
Crossroads | Highland Park, IL | Troy | Parsippany, NJ | ||||
Darien | Darien, CT | Wildwood | Bethesda, MD | ||||
Fresh Meadows | Queens, NY | ||||||
Residential Opportunities - Opportunity to add residential units to existing retail and mixed-use properties. | |||||||
Barracks Road | Charlottesville, VA | Graham Park Plaza | Falls Church, VA | ||||
Bala Cynwyd | Bala Cynwyd, PA | Village at Shirlington | Arlington, VA | ||||
Longer Term Mixed-Use Opportunities | |||||||
Assembly Row (1) | Somerville, MA | San Antonio Center | Mountain View, CA | ||||
Bala Cynwyd | Bala Cynwyd, PA | Santana Row (3) | San Jose, CA | ||||
Pike 7 Plaza | Vienna, VA | Santana Row - Winchester Theater site | San Jose, CA | ||||
Pike & Rose (2) | North Bethesda, MD | ||||||
Notes: | |||||||
(1) | Assembly Row | Remaining entitlements after Phase II include approximately 2 million square feet of commercial-use buildings and 826 residential units. | |||||
(2) | Pike & Rose | Remaining entitlements after Phase II include 1 million square feet of commercial-use buildings and 741 residential units. | |||||
(3) | Santana Row | Remaining entitlements include approximately 321,000 square feet of commercial space and 395 residential units. | |||||
19
Federal Realty Investment Trust | |||||||||||||
2017 Significant Acquisitions and Disposition | |||||||||||||
March 31, 2017 | |||||||||||||
2017 Significant Acquisitions | |||||||||||||
Date | Property | City/State | GLA | Purchase Price | Principal Tenants | ||||||||
(in square feet) | (in millions) | ||||||||||||
February 1, 2017 | Hastings Ranch Plaza | Pasadena, California | 274,000 | $ | 29.5 | Marshalls / HomeGoods / CVS / Sears | (1) | ||||||
March 31, 2017 | Riverpoint Center | Chicago, Illinois | 211,000 | $ | 107.0 | Jewel Osco / Marshalls / Old Navy | (2) | ||||||
(1) | We acquired the leasehold interest in Hastings Ranch Plaza. The land is controlled under a long-term ground lease that expires on April 30, 2054. |
(2) | The acquisition was funded 100% on a short-term basis with our line of credit. |
2017 Significant Disposition
On April 4, 2017, the sale transaction related to the purchase option on our Partners HealthCare ground lease closed at our Assembly Row property in Somerville, Massachusetts. The sales price was $36.0 million, and the gain was approximately $18 million.
20
Federal Realty Investment Trust | |||||||||||||||||||||||
Real Estate Status Report | |||||||||||||||||||||||
March 31, 2017 | |||||||||||||||||||||||
Property Name | MSA Description | Real Estate at Cost | Mortgage and/or Capital Lease Obligation (1) | Acreage | GLA (2) | % Leased (2) | Residential Units | Grocery Anchor GLA | Grocery Anchor | Other Retail Tenants | |||||||||||||
(in thousands) | (in thousands) | ||||||||||||||||||||||
Washington Metropolitan Area | |||||||||||||||||||||||
Barcroft Plaza | Washington, DC-MD-VA | $ | 43,137 | 10 | 115,000 | 90 | % | 46,000 | Harris Teeter | ||||||||||||||
Bethesda Row | Washington, DC-MD-VA | 226,464 | 17 | 534,000 | 95 | % | 180 | 40,000 | Giant Food | Apple / Equinox / Barnes & Noble / Multiple Restaurants | |||||||||||||
Congressional Plaza | (3) | Washington, DC-MD-VA | 100,742 | 21 | 325,000 | 97 | % | 194 | 25,000 | The Fresh Market | Buy Buy Baby / Saks Fifth Avenue Off 5th / Container Store / Last Call Studio by Neiman Marcus | ||||||||||||
Courthouse Center | Washington, DC-MD-VA | 4,904 | 2 | 35,000 | 66 | % | |||||||||||||||||
Falls Plaza/Falls Plaza-East | Washington, DC-MD-VA | 13,969 | 10 | 144,000 | 95 | % | 51,000 | Giant Food | CVS / Staples | ||||||||||||||
Federal Plaza | Washington, DC-MD-VA | 68,149 | 18 | 248,000 | 99 | % | 14,000 | Trader Joe's | TJ Maxx / Micro Center / Ross Dress For Less | ||||||||||||||
Free State Shopping Center | Washington, DC-MD-VA | 64,036 | 29 | 265,000 | 95 | % | 73,000 | Giant Food | TJ Maxx / Ross Dress For Less / Office Depot | ||||||||||||||
Friendship Center | Washington, DC-MD-VA | 37,570 | 1 | 119,000 | 100 | % | Marshalls / Nordstrom Rack / DSW / Maggiano's | ||||||||||||||||
Gaithersburg Square | Washington, DC-MD-VA | 26,991 | 17 | 207,000 | 97 | % | Bed, Bath & Beyond / Ross Dress For Less / Ashley Furniture HomeStore | ||||||||||||||||
Graham Park Plaza | Washington, DC-MD-VA | 34,880 | 18 | 260,000 | 90 | % | 58,000 | Giant Food | Stein Mart | ||||||||||||||
Idylwood Plaza | Washington, DC-MD-VA | 16,790 | 7 | 73,000 | 97 | % | 30,000 | Whole Foods | |||||||||||||||
Laurel | Washington, DC-MD-VA | 56,167 | 26 | 389,000 | 84 | % | 61,000 | Giant Food | Marshalls / L.A. Fitness | ||||||||||||||
Leesburg Plaza | Washington, DC-MD-VA | 36,051 | 26 | 236,000 | 92 | % | 55,000 | Giant Food | Petsmart / Gold's Gym / Office Depot | ||||||||||||||
Montrose Crossing | (3) | Washington, DC-MD-VA | 154,127 | 72,314 | 36 | 364,000 | 92 | % | 73,000 | Giant Food | Marshalls / Old Navy / Barnes & Noble / Bob's Discount Furniture | ||||||||||||
Mount Vernon/South Valley/7770 Richmond Hwy | (5) | Washington, DC-MD-VA | 84,223 | 29 | 569,000 | 96 | % | 62,000 | Shoppers Food Warehouse | TJ Maxx / Home Depot / Bed, Bath & Beyond / Gold's Gym | |||||||||||||
Old Keene Mill | Washington, DC-MD-VA | 7,276 | 10 | 92,000 | 100 | % | 24,000 | Whole Foods | Walgreens / Planet Fitness | ||||||||||||||
Pan Am | Washington, DC-MD-VA | 28,917 | 25 | 227,000 | 98 | % | 65,000 | Safeway | Micro Center / CVS / Michaels | ||||||||||||||
Pentagon Row | Washington, DC-MD-VA | 98,330 | 14 | 298,000 | 83 | % | 45,000 | Harris Teeter | TJ Maxx / Bed, Bath & Beyond / DSW | ||||||||||||||
Pike & Rose | (4) | Washington, DC-MD-VA | 504,553 | 24 | 251,000 | 100 | % | 493 | iPic Theater / Sport & Health / Nike / Multiple Restaurants | ||||||||||||||
Pike 7 Plaza | Washington, DC-MD-VA | 42,731 | 13 | 164,000 | 100 | % | TJ Maxx / DSW / Crunch Fitness / Staples | ||||||||||||||||
Plaza del Mercado | Washington, DC-MD-VA | 45,463 | 10 | 117,000 | 92 | % | 18,000 | Aldi | CVS / L.A. Fitness | ||||||||||||||
Quince Orchard | Washington, DC-MD-VA | 38,235 | 16 | 267,000 | 95 | % | 19,000 | Aldi | HomeGoods / L.A. Fitness / Staples | ||||||||||||||
Rockville Town Square | (6) | Washington, DC-MD-VA | 50,081 | 4,470 | 12 | 187,000 | 96 | % | 25,000 | Dawson's Market | CVS / Gold's Gym / Multiple Restaurants | ||||||||||||
Rollingwood Apartments | Washington, DC-MD-VA | 10,575 | 21,165 | 14 | N/A | 96 | % | 282 | |||||||||||||||
Sam's Park & Shop | Washington, DC-MD-VA | 12,791 | 1 | 49,000 | 86 | % | Petco | ||||||||||||||||
Tower Shopping Center | Washington, DC-MD-VA | 21,739 | 12 | 112,000 | 92 | % | 26,000 | L.A. Mart | Talbots / Total Wine & More | ||||||||||||||
Tyson's Station | Washington, DC-MD-VA | 4,631 | 5 | 49,000 | 95 | % | 11,000 | Trader Joe's | |||||||||||||||
Village at Shirlington | (6) | Washington, DC-MD-VA | 63,355 | 6,604 | 16 | 266,000 | 90 | % | 28,000 | Harris Teeter | AMC / Carlyle Grand Café | ||||||||||||
Wildwood | Washington, DC-MD-VA | 19,822 | 12 | 83,000 | 98 | % | 20,000 | Balducci's | CVS | ||||||||||||||
Total Washington Metropolitan Area | 1,916,699 | 451 | 6,045,000 | 94 | % | ||||||||||||||||||
California | |||||||||||||||||||||||
Colorado Blvd | Los Angeles-Long Beach-Anaheim, CA | 19,366 | 1 | 69,000 | 99 | % | Pottery Barn / Banana Republic | ||||||||||||||||
Crow Canyon Commons | San Ramon, CA | 89,525 | 22 | 241,000 | 96 | % | 32,000 | Sprouts | Orchard Supply Hardware / Rite Aid | ||||||||||||||
East Bay Bridge | San Francisco-Oakland-Fremont, CA | 178,207 | 32 | 439,000 | 100 | % | 59,000 | Pak-N-Save | Home Depot / Target / Nordstrom Rack | ||||||||||||||
Escondido Promenade | (3) | San Diego, CA | 48,065 | 18 | 299,000 | 98 | % | TJ Maxx / Dick’s Sporting Goods / Ross Dress For Less / Toys R Us | |||||||||||||||
Hastings Ranch Plaza | (7) | Los Angeles-Long Beach-Anaheim, CA | 22,393 | 15 | 274,000 | 100 | % | Marshalls / HomeGoods / CVS / Sears | |||||||||||||||
Hermosa Avenue | Los Angeles-Long Beach-Anaheim, CA | 5,931 | < 1 | 23,000 | 100 | % | |||||||||||||||||
Hollywood Blvd | Los Angeles-Long Beach-Anaheim, CA | 46,698 | 3 | 180,000 | 91 | % | Marshalls / DSW / L.A. Fitness / La La Land | ||||||||||||||||
21
Federal Realty Investment Trust | |||||||||||||||||||||||
Real Estate Status Report | |||||||||||||||||||||||
March 31, 2017 | |||||||||||||||||||||||
Property Name | MSA Description | Real Estate at Cost | Mortgage and/or Capital Lease Obligation (1) | Acreage | GLA (2) | % Leased (2) | Residential Units | Grocery Anchor GLA | Grocery Anchor | Other Retail Tenants | |||||||||||||
(in thousands) | (in thousands) | ||||||||||||||||||||||
Kings Court | (5) | San Jose, CA | 11,667 | 8 | 79,000 | 100 | % | 31,000 | Lunardi's Super Market | CVS | |||||||||||||
Old Town Center | San Jose, CA | 36,996 | 8 | 98,000 | 99 | % | Anthropologie / Banana Republic / Gap | ||||||||||||||||
Plaza El Segundo / The Point | (3) | Los Angeles-Long Beach-Anaheim, CA | 279,795 | 175,000 | 50 | 494,000 | 96 | % | 66,000 | Whole Foods | Anthropologie / HomeGoods / Dick's Sporting Goods / Multiple Restaurants | ||||||||||||
Santana Row | San Jose, CA | 808,538 | 45 | 882,000 | 98 | % | 662 | Crate & Barrel / H&M / Container Store / Multiple Restaurants | |||||||||||||||
San Antonio Center | (5) | San Francisco-Oakland-San Jose, CA | 73,507 | 33 | 376,000 | 95 | % | 11,000 | Trader Joe's | Wal-mart / Kohl's / 24 Hour Fitness | |||||||||||||
Third Street Promenade | Los Angeles-Long Beach-Anaheim, CA | 78,122 | 2 | 209,000 | 96 | % | Banana Republic / Old Navy / J. Crew / Abercrombie & Fitch | ||||||||||||||||
Westgate Center | San Jose, CA | 150,028 | 44 | 647,000 | 98 | % | 38,000 | Walmart Neighborhood Market | Target / Nordstrom Rack / Nike Factory / Burlington | ||||||||||||||
150 Post Street | San Francisco, CA | 36,273 | < 1 | 105,000 | 81 | % | Shreve & Co. | ||||||||||||||||
Total California | 1,885,111 | 281 | 4,415,000 | 97 | % | ||||||||||||||||||
NY Metro/New Jersey | |||||||||||||||||||||||
Brick Plaza | Monmouth-Ocean, NJ | 71,729 | 46 | 422,000 | 68 | % | AMC / Barnes & Noble / Ulta / DSW | ||||||||||||||||
Brook 35 | (3) (5) | New York-Northern New Jersey-Long Island, NY-NJ-PA | 47,149 | 11,500 | 11 | 98,000 | 100 | % | Banana Republic / Gap / Coach / Williams-Sonoma | ||||||||||||||
Darien | New Haven-Bridgeport-Stamford-Waterbury | 49,305 | 9 | 95,000 | 97 | % | 45,000 | Stop & Shop | Equinox | ||||||||||||||
Fresh Meadows | New York, NY | 87,076 | 17 | 404,000 | 99 | % | 15,000 | Island of Gold | AMC / Kohl's / Michaels | ||||||||||||||
Greenlawn Plaza | Nassau-Suffolk, NY | 31,689 | 13 | 106,000 | 94 | % | 46,000 | Greenlawn Farms | Tuesday Morning | ||||||||||||||
Greenwich Avenue | New Haven-Bridgeport-Stamford-Waterbury | 14,127 | 1 | 36,000 | 100 | % | Saks Fifth Avenue | ||||||||||||||||
Hauppauge | Nassau-Suffolk, NY | 28,796 | 15 | 134,000 | 99 | % | 61,000 | Shop Rite | A.C. Moore | ||||||||||||||
Huntington | Nassau-Suffolk, NY | 46,789 | 21 | 279,000 | 99 | % | Nordstrom Rack / Bed, Bath & Beyond / Buy Buy Baby / Michaels | ||||||||||||||||
Huntington Square | Nassau-Suffolk, NY | 12,176 | 18 | 74,000 | 85 | % | Barnes & Noble | ||||||||||||||||
Melville Mall | Nassau-Suffolk, NY | 85,716 | 21 | 251,000 | 95 | % | Marshalls / Dick's Sporting Goods / Field & Stream / Macy's Backstage | ||||||||||||||||
Mercer Mall | (6) | Trenton, NJ | 125,074 | 55,601 | 50 | 530,000 | 99 | % | 75,000 | Shop Rite | TJ Maxx / Nordstrom Rack / Bed, Bath & Beyond / REI | ||||||||||||
The Grove at Shrewsbury | (3) (5) | New York-Northern New Jersey-Long Island, NY-NJ-PA | 123,935 | 53,004 | 21 | 192,000 | 100 | % | Lululemon / Anthropologie / Pottery Barn / Williams-Sonoma | ||||||||||||||
Troy | Newark, NJ | 35,165 | 19 | 211,000 | 67 | % | L.A. Fitness / Michaels | ||||||||||||||||
Total NY Metro/New Jersey | 758,726 | 262 | 2,832,000 | 91 | % | ||||||||||||||||||
Philadelphia Metropolitan Area | |||||||||||||||||||||||
Andorra | Philadelphia, PA-NJ | 25,802 | 22 | 264,000 | 93 | % | 24,000 | Acme Markets | Kohl's / L.A. Fitness / Staples | ||||||||||||||
Bala Cynwyd | Philadelphia, PA-NJ | 40,568 | 23 | 295,000 | 100 | % | 45,000 | Acme Markets | Lord & Taylor / Michaels / L.A. Fitness | ||||||||||||||
Ellisburg | Philadelphia, PA-NJ | 34,204 | 28 | 268,000 | 94 | % | 47,000 | Whole Foods | Buy Buy Baby / Stein Mart | ||||||||||||||
Flourtown | Philadelphia, PA-NJ | 16,892 | 24 | 156,000 | 98 | % | 75,000 | Giant Food | Movie Tavern | ||||||||||||||
Langhorne Square | Philadelphia, PA-NJ | 21,904 | 21 | 219,000 | 97 | % | 55,000 | Redner's Warehouse Mkts. | Marshalls / Planet Fitness | ||||||||||||||
Lawrence Park | Philadelphia, PA-NJ | 33,140 | 29 | 364,000 | 97 | % | 53,000 | Acme Markets | TJ Maxx / HomeGoods / Barnes & Noble | ||||||||||||||
Northeast | Philadelphia, PA-NJ | 28,374 | 19 | 288,000 | 86 | % | Marshalls / Burlington / A.C. Moore | ||||||||||||||||
Town Center of New Britain | Philadelphia, PA-NJ | 15,146 | 17 | 124,000 | 90 | % | 36,000 | Giant Food | Rite Aid / Dollar Tree | ||||||||||||||
22
Federal Realty Investment Trust | |||||||||||||||||||||||
Real Estate Status Report | |||||||||||||||||||||||
March 31, 2017 | |||||||||||||||||||||||
Property Name | MSA Description | Real Estate at Cost | Mortgage and/or Capital Lease Obligation (1) | Acreage | GLA (2) | % Leased (2) | Residential Units | Grocery Anchor GLA | Grocery Anchor | Other Retail Tenants | |||||||||||||
(in thousands) | (in thousands) | ||||||||||||||||||||||
Willow Grove | Philadelphia, PA-NJ | 30,094 | 13 | 211,000 | 96 | % | Marshalls / HomeGoods / Barnes & Noble | ||||||||||||||||
Wynnewood | Philadelphia, PA-NJ | 42,825 | 14 | 251,000 | 100 | % | 98,000 | Giant Food | Bed, Bath & Beyond / Old Navy / DSW | ||||||||||||||
Total Philadelphia Metropolitan Area | 288,949 | 210 | 2,440,000 | 95 | % | ||||||||||||||||||
New England | |||||||||||||||||||||||
Assembly Row / Assembly Square Marketplace | (4) | Boston-Cambridge-Quincy, MA-NH | 672,452 | 65 | 761,000 | 93 | % | TJ Maxx / AMC / LEGOLAND Discovery Center / Multiple Restaurants & Outlets | |||||||||||||||
Atlantic Plaza | Boston-Worcester-Lawrence-Lowell-Brockton, MA | 25,434 | 13 | 123,000 | 95 | % | 64,000 | Stop & Shop | |||||||||||||||
Campus Plaza | Boston-Worcester-Lawrence-Lowell-Brockton, MA | 30,393 | 15 | 116,000 | 98 | % | 46,000 | Roche Bros. | Burlington | ||||||||||||||
Chelsea Commons | Boston-Cambridge-Quincy, MA-NH | 42,849 | 6,500 | 37 | 222,000 | 100 | % | 56 | 16,000 | Sav-A-Lot | Home Depot / Planet Fitness | ||||||||||||
Dedham Plaza | Boston-Cambridge-Quincy, MA-NH | 38,533 | 19 | 241,000 | 94 | % | 80,000 | Star Market | Planet Fitness | ||||||||||||||
Linden Square | Boston-Cambridge-Quincy, MA-NH | 147,954 | 19 | 223,000 | 96 | % | 50,000 | Roche Bros. | CVS | ||||||||||||||
North Dartmouth | Boston-Cambridge-Quincy, MA-NH | 9,368 | 28 | 48,000 | 100 | % | 48,000 | Stop & Shop | |||||||||||||||
Queen Anne Plaza | Boston-Cambridge-Quincy, MA-NH | 18,294 | 17 | 149,000 | 100 | % | 50,000 | Big Y Foods | TJ Maxx / HomeGoods | ||||||||||||||
Saugus Plaza | Boston-Cambridge-Quincy, MA-NH | 15,258 | 15 | 169,000 | 100 | % | 55,000 | Super Stop & Shop | Kmart | ||||||||||||||
Total New England | 1,000,535 | 228 | 2,052,000 | 96 | % | ||||||||||||||||||
South Florida | |||||||||||||||||||||||
Cocowalk | (3) (8) | Miami-Ft Lauderdale | 108,837 | 3 | 222,000 | 76 | % | Gap / Cinepolis Theaters / Youfit Health Club | |||||||||||||||
Del Mar Village | Miami-Ft Lauderdale | 63,360 | 17 | 196,000 | 93 | % | 44,000 | Winn Dixie | CVS | ||||||||||||||
The Shops at Sunset Place | (3) | Miami-Ft Lauderdale | 121,019 | 68,124 | 10 | 523,000 | 82 | % | AMC / L.A. Fitness / Barnes & Noble / Restoration Hardware Outlet | ||||||||||||||
Tower Shops | Miami-Ft Lauderdale | 96,788 | 67 | 419,000 | 99 | % | 12,000 | Trader Joe's | TJ Maxx / Ross Dress For Less / Best Buy / DSW | ||||||||||||||
Total South Florida | 390,004 | 97 | 1,360,000 | 88 | % | ||||||||||||||||||
Baltimore | |||||||||||||||||||||||
Governor Plaza | Baltimore, MD | 27,375 | 24 | 243,000 | 100 | % | 16,500 | Aldi | Dick's Sporting Goods / A.C. Moore | ||||||||||||||
Perring Plaza | Baltimore, MD | 30,940 | 29 | 395,000 | 100 | % | 58,000 | Shoppers Food Warehouse | Home Depot / Micro Center / Burlington | ||||||||||||||
THE AVENUE at White Marsh | (5) | Baltimore, MD | 111,209 | 52,705 | 35 | 311,000 | 99 | % | AMC / Ulta / Old Navy / Barnes & Noble | ||||||||||||||
The Shoppes at Nottingham Square | Baltimore, MD | 17,466 | 4 | 32,000 | 100 | % | |||||||||||||||||
White Marsh Plaza | Baltimore, MD | 25,261 | 7 | 80,000 | 96 | % | 54,000 | Giant Food | |||||||||||||||
White Marsh Other | Baltimore, MD | 47,915 | 22 | 73,000 | 97 | % | |||||||||||||||||
Total Baltimore | 260,166 | 121 | 1,134,000 | 99 | % | ||||||||||||||||||
Chicago | |||||||||||||||||||||||
Crossroads | Chicago, IL | 31,895 | 14 | 168,000 | 83 | % | L.A. Fitness / Binny's / Guitar Center | ||||||||||||||||
Finley Square | Chicago, IL | 36,963 | 21 | 316,000 | 99 | % | Bed, Bath & Beyond / Buy Buy Baby / Petsmart / Portillo's | ||||||||||||||||
Garden Market | Chicago, IL | 13,885 | 2 | 140,000 | 98 | % | 63,000 | Mariano's Fresh Market | Walgreens | ||||||||||||||
North Lake Commons | Chicago, IL | 17,443 | 13 | 129,000 | 85 | % | 77,000 | Jewel Osco | |||||||||||||||
23
Federal Realty Investment Trust | |||||||||||||||||||||||
Real Estate Status Report | |||||||||||||||||||||||
March 31, 2017 | |||||||||||||||||||||||
Property Name | MSA Description | Real Estate at Cost | Mortgage and/or Capital Lease Obligation (1) | Acreage | GLA (2) | % Leased (2) | Residential Units | Grocery Anchor GLA | Grocery Anchor | Other Retail Tenants | |||||||||||||
(in thousands) | (in thousands) | ||||||||||||||||||||||
Riverpoint Center | (7) | Chicago, IL | 119,987 | 17 | 211,000 | 97 | % | 86,000 | Jewel Osco | Marshalls / Old Navy | |||||||||||||
Total Chicago | 220,173 | 67 | 964,000 | 94 | % | ||||||||||||||||||
Other | |||||||||||||||||||||||
Barracks Road | Charlottesville, VA | 64,292 | 40 | 498,000 | 97 | % | 99,000 | Harris Teeter / Kroger | Anthropologie / Nike / Bed, Bath & Beyond / Old Navy | ||||||||||||||
Bristol Plaza | Hartford, CT | 31,083 | 22 | 266,000 | 96 | % | 74,000 | Stop & Shop | TJ Maxx | ||||||||||||||
Eastgate Crossing | Raleigh-Durham-Chapel Hill, NC | 31,924 | 17 | 153,000 | 95 | % | 13,000 | Trader Joe's | Ulta / Stein Mart / Petco | ||||||||||||||
Gratiot Plaza | Detroit, MI | 19,828 | 20 | 217,000 | 100 | % | 69,000 | Kroger | Bed, Bath & Beyond / Best Buy / DSW | ||||||||||||||
Lancaster | (6) | Lancaster, PA | 13,989 | 4,907 | 11 | 127,000 | 98 | % | 75,000 | Giant Food | Michaels | ||||||||||||
29th Place | Charlottesville, VA | 40,804 | 4,501 | 15 | 169,000 | 97 | % | HomeGoods / DSW / Stein Mart / Staples | |||||||||||||||
Willow Lawn | Richmond-Petersburg, VA | 93,071 | 37 | 462,000 | 99 | % | 66,000 | Kroger | Old Navy / Ross Dress For Less / Gold's Gym / DSW | ||||||||||||||
Total Other | 294,991 | 162 | 1,892,000 | 98 | % | ||||||||||||||||||
Grand Total | $ | 7,015,354 | $ | 536,395 | 1,879 | 23,134,000 | 95 | % | 1,867 | ||||||||||||||
Notes: | |||||||||||||||||||||||
(1) | The mortgage or capital lease obligations differ from the total reported on the consolidated balance sheet due to the unamortized discount, premium, and/or debt issuance costs on certain mortgage payables. | ||||||||||||||||||||||
(2) | Represents the GLA and the percentage leased of the commercial portion of the property. Some of our properties include office space which is included in this square footage. Excludes newly created redevelopment square footage not yet in service, as well as residential and hotel square footage. | ||||||||||||||||||||||
(3) | The Trust has a controlling financial interest in this property. | ||||||||||||||||||||||
(4) | Portion of property is currently under development. See further discussion in the Assembly Row and Pike & Rose schedules. | ||||||||||||||||||||||
(5) | All or a portion of the property is owned in a "downREIT" partnership, of which a wholly owned subsidiary of the Trust is the sole general partner, with third party partners holding operating partnership units. | ||||||||||||||||||||||
(6) | All or a portion of property subject to capital lease obligation. | ||||||||||||||||||||||
(7) | As a result of the purchase price allocation, $6 million of net assets for above/below market leases acquired for Hastings Ranch Plaza were allocated from real estate at cost and $11 million of net liabilities for net below market leases acquired for Riverpoint Center were allocated to real estate at cost. | ||||||||||||||||||||||
(8) | This property includes partial interests in seven buildings in addition to our initial acquisition. | ||||||||||||||||||||||
24
Federal Realty Investment Trust | |||||||||||||||||||||||||||||||||||||||
Retail Leasing Summary (1) | |||||||||||||||||||||||||||||||||||||||
March 31, 2017 | |||||||||||||||||||||||||||||||||||||||
Total Lease Summary - Comparable (2) | |||||||||||||||||||||||||||||||||||||||
Quarter | Number of Leases Signed | % of Comparable Leases Signed | GLA Signed | Contractual Rent (3) Per Sq. Ft. | Prior Rent (4) Per Sq. Ft. | Annual Increase in Rent | Cash Basis % Increase Over Prior Rent | Straight-lined Basis % Increase Over Prior Rent | Weighted Average Lease Term (5) | Tenant Improvements & Incentives (6) | Tenant Improvements & Incentives Per Sq. Ft. | ||||||||||||||||||||||||||||
1st Quarter 2017 | 102 | 100 | % | 523,869 | $ | 34.91 | $ | 31.31 | $ | 1,884,636 | 11 | % | 23 | % | 8.1 | $ | 19,672,170 | $ | 37.55 | (7) | |||||||||||||||||||
4th Quarter 2016 | 77 | 100 | % | 274,622 | $ | 37.10 | $ | 32.27 | $ | 1,325,040 | 15 | % | 27 | % | 7.2 | $ | 9,874,657 | $ | 35.96 | (7) | |||||||||||||||||||
3rd Quarter 2016 | 93 | 100 | % | 427,021 | $ | 31.25 | $ | 27.40 | $ | 1,641,966 | 14 | % | 27 | % | 8.3 | $ | 15,287,078 | $ | 35.80 | ||||||||||||||||||||
2nd Quarter 2016 | 91 | 100 | % | 372,778 | $ | 38.21 | $ | 34.13 | $ | 1,522,734 | 12 | % | 25 | % | 6.6 | $ | 8,100,475 | $ | 21.73 | ||||||||||||||||||||
Total - 12 months | 363 | 100 | % | 1,598,290 | $ | 35.08 | $ | 31.09 | $ | 6,374,376 | 13 | % | 25 | % | 7.6 | $ | 52,934,380 | $ | 33.12 | ||||||||||||||||||||
New Lease Summary - Comparable (2) | |||||||||||||||||||||||||||||||||||||||
Quarter | Number of Leases Signed | % of Comparable Leases Signed | GLA Signed | Contractual Rent (3) Per Sq. Ft. | Prior Rent (4) Per Sq. Ft. | Annual Increase in Rent | Cash Basis % Increase Over Prior Rent | Straight-lined Basis % Increase Over Prior Rent | Weighted Average Lease Term (5) | Tenant Improvements & Incentives (6) | Tenant Improvements & Incentives Per Sq. Ft. | ||||||||||||||||||||||||||||
1st Quarter 2017 | 45 | 44 | % | 288,388 | $ | 35.45 | $ | 30.21 | $ | 1,509,806 | 17 | % | 31 | % | 10.2 | $ | 19,226,044 | $ | 66.67 | (7) | |||||||||||||||||||
4th Quarter 2016 | 28 | 36 | % | 115,640 | $ | 45.50 | $ | 34.45 | $ | 1,278,167 | 32 | % | 53 | % | 9.6 | $ | 9,592,450 | $ | 82.95 | (7) | |||||||||||||||||||
3rd Quarter 2016 | 39 | 42 | % | 168,213 | $ | 35.12 | $ | 28.99 | $ | 1,030,672 | 21 | % | 35 | % | 11.1 | $ | 10,692,617 | $ | 63.57 | ||||||||||||||||||||
2nd Quarter 2016 | 33 | 36 | % | 105,307 | $ | 43.13 | $ | 34.97 | $ | 858,882 | 23 | % | 40 | % | 9.0 | $ | 7,235,818 | $ | 68.71 | ||||||||||||||||||||
Total - 12 months | 145 | 40 | % | 677,548 | $ | 38.27 | $ | 31.37 | $ | 4,677,527 | 22 | % | 37 | % | 10.1 | $ | 46,746,929 | $ | 68.99 | ||||||||||||||||||||
Renewal Lease Summary - Comparable (2) (8) | |||||||||||||||||||||||||||||||||||||||
Quarter | Number of Leases Signed | % of Comparable Leases Signed | GLA Signed | Contractual Rent (3) Per Sq. Ft. | Prior Rent (4) Per Sq. Ft. | Annual Increase in Rent | Cash Basis % Increase Over Prior Rent | Straight-lined Basis % Increase Over Prior Rent | Weighted Average Lease Term (5) | Tenant Improvements & Incentives (6) | Tenant Improvements & Incentives Per Sq. Ft. | ||||||||||||||||||||||||||||
1st Quarter 2017 | 57 | 56 | % | 235,481 | $ | 34.24 | $ | 32.65 | $ | 374,830 | 5 | % | 14 | % | 5.4 | $ | 446,126 | $ | 1.89 | ||||||||||||||||||||
4th Quarter 2016 | 49 | 64 | % | 158,982 | $ | 30.99 | $ | 30.69 | $ | 46,873 | 1 | % | 6 | % | 4.5 | $ | 282,207 | $ | 1.78 | ||||||||||||||||||||
3rd Quarter 2016 | 54 | 58 | % | 258,808 | $ | 28.74 | $ | 26.37 | $ | 611,294 | 9 | % | 21 | % | 6.0 | $ | 4,594,461 | $ | 17.75 | ||||||||||||||||||||
2nd Quarter 2016 | 58 | 64 | % | 267,471 | $ | 36.28 | $ | 33.79 | $ | 663,852 | 7 | % | 19 | % | 5.4 | $ | 864,657 | $ | 3.23 | ||||||||||||||||||||
Total - 12 months | 218 | 60 | % | 920,742 | $ | 32.72 | $ | 30.88 | $ | 1,696,849 | 6 | % | 16 | % | 5.4 | $ | 6,187,451 | $ | 6.72 | ||||||||||||||||||||
Total Lease Summary - Comparable and Non-comparable (2) (9) | |||||||||||||||||||||||||||||||||||||||
Quarter | Number of Leases Signed | GLA Signed | Contractual Rent (3) Per Sq. Ft. | Weighted Average Lease Term (5) | Tenant Improvements & Incentives (6) | Tenant Improvements & Incentives Per Sq. Ft. | |||||||||||||||||||||||||||||||||
1st Quarter 2017 | 114 | 591,765 | $ | 34.87 | 8.3 | $ | 24,718,054 | $ | 41.77 | ||||||||||||||||||||||||||||||
4th Quarter 2016 | 89 | 347,604 | $ | 38.25 | 8.2 | $ | 11,290,441 | $ | 32.48 | ||||||||||||||||||||||||||||||
3rd Quarter 2016 | 102 | 452,836 | $ | 32.06 | 8.5 | $ | 17,575,645 | $ | 38.81 | ||||||||||||||||||||||||||||||
2nd Quarter 2016 | 103 | 467,364 | $ | 35.66 | 6.9 | $ | 9,864,863 | $ | 21.11 | ||||||||||||||||||||||||||||||
Total - 12 months | 408 | 1,859,569 | $ | 35.01 | 8.0 | $ | 63,449,003 | $ | 34.12 | ||||||||||||||||||||||||||||||
Notes: | |||||||||||||||||||||||||||||||||||||||
(1) | Leases on this report represent retail activity only; office and residential leases are not included. | ||||||||||||||||||||||||||||||||||||||
(2) | Comparable leases represent those leases signed on spaces for which there was a former tenant. | ||||||||||||||||||||||||||||||||||||||
(3) | Contractual rent represents contractual minimum rent under the new lease for the first 12 months of the term. | ||||||||||||||||||||||||||||||||||||||
(4) | Prior rent represents minimum rent and percentage rent, if any, paid by the prior tenant in the final 12 months of the term. | ||||||||||||||||||||||||||||||||||||||
(5) | Weighted average is determined on the basis of contractual rent for the first 12 months of the term. | ||||||||||||||||||||||||||||||||||||||
(6) | See Glossary of Terms. | ||||||||||||||||||||||||||||||||||||||
(7) | Approximately $3.5 million ($2.28 per square foot) in 1st Quarter 2017 and $0.3 million ($0.74 per square foot) in 4th Quarter 2016 of the Tenant Improvements & Incentives are for properties under active redevelopment (e.g. Montrose Crossing and Willow Lawn) and are included in the Projected Cost for those projects on the Summary of Redevelopment Opportunities. | ||||||||||||||||||||||||||||||||||||||
(8) | Renewal leases represent expiring leases rolling over with the same tenant in the same location. All other leases are categorized as new. | ||||||||||||||||||||||||||||||||||||||
(9) | The Number of Leases Signed, GLA Signed, Contractual Rent Per Sq Ft and Weighted Average Lease Term columns include information for leases signed at our Assembly Row and Pike & Rose projects. The Tenant Improvements & Incentives and Tenant Improvements & Incentives Per Sq Ft columns do not include the tenant improvements and incentives on leases signed for those projects; these amounts for leases signed for Assembly Row and Pike & Rose are included in the Projected Cost column for those projects shown on the Assembly Row and Pike & Rose schedule. | ||||||||||||||||||||||||||||||||||||||
25
Federal Realty Investment Trust | |||||||||||||||||||||||
Lease Expirations | |||||||||||||||||||||||
March 31, 2017 | |||||||||||||||||||||||
Assumes no exercise of lease options | |||||||||||||||||||||||
Anchor Tenants (1) | Small Shop Tenants | Total | |||||||||||||||||||||
Year | Expiring SF | % of Anchor SF | Minimum Rent PSF (2) | Expiring SF | % of Small Shop SF | Minimum Rent PSF (2) | Expiring SF (4) | % of Total SF | Minimum Rent PSF (2) | ||||||||||||||
2017 | 257,000 | 2 | % | $ | 16.45 | 602,000 | 8 | % | $ | 34.37 | 860,000 | 4 | % | $ | 29.01 | ||||||||
2018 | 1,711,000 | 12 | % | $ | 17.31 | 942,000 | 13 | % | $ | 39.52 | 2,652,000 | 12 | % | $ | 25.20 | ||||||||
2019 | 2,079,000 | 14 | % | $ | 19.24 | 809,000 | 12 | % | $ | 38.87 | 2,888,000 | 14 | % | $ | 24.74 | ||||||||
2020 | 1,359,000 | 9 | % | $ | 17.93 | 882,000 | 12 | % | $ | 40.52 | 2,241,000 | 10 | % | $ | 26.82 | ||||||||
2021 | 1,663,000 | 11 | % | $ | 20.68 | 897,000 | 13 | % | $ | 43.28 | 2,560,000 | 12 | % | $ | 28.60 | ||||||||
2022 | 1,919,000 | 13 | % | $ | 17.86 | 784,000 | 11 | % | $ | 40.71 | 2,702,000 | 13 | % | $ | 24.48 | ||||||||
2023 | 679,000 | 5 | % | $ | 21.65 | 465,000 | 7 | % | $ | 45.11 | 1,144,000 | 5 | % | $ | 31.19 | ||||||||
2024 | 857,000 | 6 | % | $ | 15.88 | 471,000 | 7 | % | $ | 44.63 | 1,329,000 | 6 | % | $ | 26.08 | ||||||||
2025 | 853,000 | 6 | % | $ | 22.39 | 471,000 | 7 | % | $ | 40.31 | 1,324,000 | 6 | % | $ | 28.77 | ||||||||
2026 | 526,000 | 4 | % | $ | 26.20 | 329,000 | 5 | % | $ | 46.08 | 854,000 | 4 | % | $ | 33.84 | ||||||||
Thereafter | 2,570,000 | 18 | % | $ | 22.38 | 356,000 | 5 | % | $ | 45.89 | 2,927,000 | 14 | % | $ | 25.24 | ||||||||
Total (3) | 14,473,000 | 100 | % | $ | 19.73 | 7,008,000 | 100 | % | $ | 41.14 | 21,481,000 | 100 | % | $ | 26.72 | ||||||||
Assumes all lease options are exercised | |||||||||||||||||||||||
Anchor Tenants (1) | Small Shop Tenants | Total | |||||||||||||||||||||
Year | Expiring SF | % of Anchor SF | Minimum Rent PSF (2) | Expiring SF | % of Small Shop SF | Minimum Rent PSF (2) | Expiring SF (4) | % of Total SF | Minimum Rent PSF (2) | ||||||||||||||
2017 | 79,000 | 1 | % | $ | 17.35 | 461,000 | 7 | % | $ | 34.07 | 540,000 | 2 | % | $ | 31.63 | ||||||||
2018 | 459,000 | 3 | % | $ | 20.92 | 570,000 | 8 | % | $ | 40.79 | 1,029,000 | 5 | % | $ | 31.93 | ||||||||
2019 | 537,000 | 4 | % | $ | 20.82 | 513,000 | 7 | % | $ | 40.14 | 1,050,000 | 5 | % | $ | 30.26 | ||||||||
2020 | 211,000 | 1 | % | $ | 23.26 | 567,000 | 8 | % | $ | 39.52 | 778,000 | 4 | % | $ | 35.11 | ||||||||
2021 | 387,000 | 3 | % | $ | 24.29 | 522,000 | 7 | % | $ | 46.18 | 909,000 | 4 | % | $ | 36.86 | ||||||||
2022 | 343,000 | 2 | % | $ | 23.95 | 542,000 | 8 | % | $ | 38.75 | 885,000 | 4 | % | $ | 33.02 | ||||||||
2023 | 390,000 | 3 | % | $ | 18.25 | 428,000 | 6 | % | $ | 41.72 | 818,000 | 4 | % | $ | 30.54 | ||||||||
2024 | 517,000 | 4 | % | $ | 20.82 | 362,000 | 5 | % | $ | 43.02 | 878,000 | 4 | % | $ | 29.96 | ||||||||
2025 | 362,000 | 2 | % | $ | 22.05 | 417,000 | 6 | % | $ | 40.80 | 779,000 | 4 | % | $ | 32.09 | ||||||||
2026 | 421,000 | 3 | % | $ | 26.18 | 390,000 | 6 | % | $ | 41.86 | 812,000 | 4 | % | $ | 33.72 | ||||||||
Thereafter | 10,767,000 | 74 | % | $ | 18.95 | 2,236,000 | 32 | % | $ | 42.26 | 13,003,000 | 60 | % | $ | 22.96 | ||||||||
Total (3) | 14,473,000 | 100 | % | $ | 19.73 | 7,008,000 | 100 | % | $ | 41.14 | 21,481,000 | 100 | % | $ | 26.72 | ||||||||
Notes: | |||||||||||||||||||||||
(1) | In Q1 2017, we changed the definition of an "anchor tenant" from a tenant leasing 15,000 square feet or more, to a tenant leasing 10,000 square feet or more. The table above reflects this updated definition. | ||||||||||||||||||||||
(2) | Minimum Rent reflects in-place contractual (defined as cash-basis excluding rent abatements) rent as of March 31, 2017. | ||||||||||||||||||||||
(3) | Represents occupied square footage as of March 31, 2017. | ||||||||||||||||||||||
(4) | Individual items may not add up to total due to rounding. | ||||||||||||||||||||||
26
Federal Realty Investment Trust | |||||||||||||
Portfolio Leased Statistics | |||||||||||||
March 31, 2017 | |||||||||||||
Overall Portfolio Statistics (1) | At March 31, 2017 | At March 31, 2016 | |||||||||||
Type | Size | Leased | Leased % | Size | Leased | Leased % | |||||||
Retail Properties (2) (3) (4) (sf) | 23,134,000 | 21,884,000 | 94.6 | % | 22,230,000 | 20,921,000 | 94.1 | % | |||||
Residential Properties (units) | 1,867 | 1,798 | 96.3 | % | 1,804 | 1,591 | 88.2 | % | |||||
Same Center Statistics (1) | At March 31, 2017 | At March 31, 2016 | |||||||||||
Type | Size | Leased | Leased % | Size | Leased | Leased % | |||||||
Retail Properties (2) (4) (5) (sf) | 17,633,000 | 16,885,000 | 95.8 | % | 17,615,000 | 16,889,000 | 95.9 | % | |||||
Residential Properties (units) (5) | 1,326 | 1,276 | 96.2 | % | 1,326 | 1,266 | 95.5 | % | |||||
Notes:
(1) | See Glossary of Terms. |
(2) | Leasable square feet excludes redevelopment square footage not yet placed in service. |
(3) | At March 31, 2017 leased percentage was 96.9% for anchor tenants and 90.2% for small shop tenants. See footnote 1 on page 26 discussing a change made in Q1 2017 to the definition of an anchor tenant. |
(4) | Occupied percentage was 93.1% and 92.7% at March 31, 2017 and 2016, respectively, and same center occupied percentage was 94.7% and 94.9% at March 31, 2017 and 2016, respectively. |
(5) | Excludes properties purchased, sold or under redevelopment or development. Excludes the six properties where we acquired our Partner's 70% interest on January 13, 2016, as we did not consolidate the properties for the entirety of the quarter ended March 31, 2016. |
27
Federal Realty Investment Trust | |||||||||||||||
Summary of Top 25 Tenants | |||||||||||||||
March 31, 2017 | |||||||||||||||
Rank | Tenant Name | Credit Ratings (S&P/Moody's/Fitch) (1) | Annualized Base Rent | Percentage of Total Annualized Base Rent (3) | Tenant GLA | Percentage of Total GLA (3) | Number of Stores Leased | ||||||||
1 | Ahold USA, Inc. | BBB / Baa2 / BBB | $ | 17,440,000 | 3.04 | % | 1,036,000 | 4.48 | % | 17 | |||||
2 | TJX Companies, The | A+ / A2 / NR | $ | 15,634,000 | 2.72 | % | 885,000 | 3.83 | % | 27 | |||||
3 | Gap, Inc., The | BB+ / Baa2 / BB+ | $ | 13,230,000 | 2.30 | % | 366,000 | 1.58 | % | 27 | |||||
4 | Bed, Bath & Beyond, Inc. | BBB+ / Baa1 / NR | $ | 13,170,000 | 2.29 | % | 736,000 | 3.18 | % | 20 | |||||
5 | Splunk, Inc. | NR / NR / NR | $ | 10,276,000 | 1.79 | % | 235,000 | 1.02 | % | 1 | |||||
6 | L.A. Fitness International LLC | B+ / B2 / NR | $ | 9,775,000 | 1.70 | % | 426,000 | 1.84 | % | 10 | |||||
7 | CVS Corporation | BBB+ / Baa1 / NR | $ | 8,499,000 | 1.48 | % | 207,000 | 0.89 | % | 17 | |||||
8 | AMC Entertainment Inc. | B+ / B2 / B | $ | 6,572,000 | 1.14 | % | 317,000 | 1.37 | % | 6 | |||||
9 | Ascena Retail Group, Inc. (Dress Barn, Loft, Lou & Grey, Ann Taylor, Catherine's, Justice, Lane Bryant) | BB- / Ba2 / NR | $ | 6,323,000 | 1.10 | % | 197,000 | 0.85 | % | 33 | |||||
10 | Dick's Sporting Goods, Inc. | NR / NR / NR | $ | 6,208,000 | 1.08 | % | 257,000 | 1.11 | % | 6 | |||||
11 | DSW, Inc. | NR / NR / NR | $ | 6,147,000 | 1.07 | % | 243,000 | 1.05 | % | 12 | |||||
12 | Home Depot, Inc. | A / A2 / A | $ | 5,674,000 | 0.99 | % | 438,000 | 1.89 | % | 5 | |||||
13 | Best Buy Stores, L.P. | BBB- / Baa1 / BBB- | $ | 5,610,000 | 0.98 | % | 186,000 | 0.80 | % | 4 | |||||
14 | Barnes & Noble, Inc. | NR / NR / NR | $ | 5,535,000 | 0.96 | % | 244,000 | 1.05 | % | 9 | |||||
15 | Michaels Stores, Inc. | BB- / Ba2 / NR | $ | 5,331,000 | 0.93 | % | 286,000 | 1.24 | % | 12 | |||||
16 | Bank of America, N.A. | BBB+ / Baa1 / A | $ | 5,185,000 | 0.90 | % | 97,000 | 0.42 | % | 21 | |||||
17 | Nordstrom, Inc. | BBB+ / Baa1 / BBB+ | $ | 4,913,000 | 0.86 | % | 195,000 | 0.84 | % | 5 | |||||
18 | AB Acquisition LLC (Acme, Safeway) | NR / B1 / NR | $ | 4,786,000 | 0.83 | % | 489,000 | 2.11 | % | 8 | |||||
19 | Kroger Co., The | BBB / Baa1 / BBB | $ | 4,677,000 | 0.81 | % | 419,000 | 1.81 | % | 9 | |||||
20 | Whole Foods Market, Inc. | BBB- / Baa3 / NR | $ | 4,425,000 | 0.77 | % | 167,000 | 0.72 | % | 4 | |||||
21 | Ross Stores, Inc. | A- / A3 / NR | $ | 4,245,000 | 0.74 | % | 238,000 | 1.03 | % | 8 | |||||
22 | Saks & Company | B+ / B1 / NR | $ | 4,090,000 | 0.71 | % | 100,000 | 0.43 | % | 3 | |||||
23 | Starbucks Corporation | A / A2 / A | $ | 3,958,000 | 0.69 | % | 66,000 | 0.29 | % | 40 | |||||
24 | Staples, Inc. | BBB- / Baa2 / BB+ | $ | 3,884,000 | 0.68 | % | 171,000 | 0.74 | % | 9 | |||||
25 | Wells Fargo Bank, N.A. | A / A2 / AA- | $ | 3,804,000 | 0.66 | % | 48,000 | 0.21 | % | 14 | |||||
Totals - Top 25 Tenants | $ | 179,391,000 | 31.24 | % | 8,049,000 | 34.79 | % | 327 | |||||||
Total: | $ | 574,164,000 | (2) | 23,134,000 | (4) | 2,883 | |||||||||
Notes: | |||||||||||||||
(1) | Credit ratings are as of March 31, 2017. Subsequent rating changes have not been reflected. | ||||||||||||||
(2) | Reflects aggregate, annualized in-place contractual (defined as cash-basis excluding rent abatements) minimum rent for all occupied spaces as of March 31, 2017. | ||||||||||||||
(3) | Individual items may not add up to total due to rounding. | ||||||||||||||
(4) | Excludes redevelopment square footage not yet placed in service. | ||||||||||||||
28
Federal Realty Investment Trust | |||||||
Reconciliation of FFO Guidance | |||||||
March 31, 2017 | |||||||
The following table provides a reconciliation of the range of estimated earnings per diluted share to estimated FFO per diluted share for the full year 2017. Estimates do not include the impact from potential acquisitions, potential dispositions, or land sale gains which have not closed as of May 3, 2017. | |||||||
Full Year 2017 Guidance Range | |||||||
Low | High | ||||||
Estimated net income available to common shareholders, per diluted share | $ | 3.35 | $ | 3.43 | |||
Adjustments: | |||||||
Estimated gain on sale of real estate, net | (0.25 | ) | (0.25 | ) | |||
Estimated depreciation and amortization of real estate | 2.50 | 2.50 | |||||
Estimated amortization of initial direct costs of leases | 0.24 | 0.24 | |||||
Estimated FFO per diluted share | $ | 5.85 | $ | 5.93 | |||
Note:
See Glossary of Terms. Individual items may not add up to total due to rounding.
29
Glossary of Terms
Adjusted EBITDA: Adjusted EBITDA is a non-GAAP measure that means net income or loss plus depreciation and amortization, net interest expense, income taxes, gain or loss on sale of real estate, and impairments of real estate, if any. Adjusted EBITDA is presented because it approximates a key performance measure in our debt covenants, but it should not be considered an alternative measure of operating results or cash flow from operations as determined in accordance with GAAP. The reconciliation of net income to EBITDA and Adjusted EBITDA for the three months ended March 31, 2017 and 2016 is as follows:
Three Months Ended | |||||||
March 31, | |||||||
2017 | 2016 | ||||||
(in thousands) | |||||||
Net income | $ | 58,070 | $ | 79,063 | |||
Depreciation and amortization | 51,379 | 47,799 | |||||
Interest expense | 23,758 | 23,729 | |||||
Other interest income | (106 | ) | (103 | ) | |||
EBITDA | 133,101 | 150,488 | |||||
Gain on sale of real estate and change in control of interests | (178 | ) | (25,726 | ) | |||
Adjusted EBITDA | $ | 132,923 | $ | 124,762 | |||
Funds From Operations (FFO): FFO is a supplemental measure of real estate companies' operating performances. The National Association of Real Estate Investment Trusts (“NAREIT”) defines FFO as follows: net income, computed in accordance with GAAP plus real estate related depreciation and amortization and excluding extraordinary items and gains and losses on sale of real estate, and impairment write-downs of depreciable real estate. NAREIT developed FFO as a relative measure of performance and liquidity of an equity REIT in order to recognize that the value of income-producing real estate historically has not depreciated on the basis determined under GAAP. However, FFO does not represent cash flows from operating activities in accordance with GAAP (which, unlike FFO, generally reflects all cash effects of transactions and other events in the determination of net income); should not be considered an alternative to net income as an indication of our performance; and is not necessarily indicative of cash flow as a measure of liquidity or ability to pay dividends. We consider FFO a meaningful, additional measure of operating performance primarily because it excludes the assumption that the value of real estate assets diminishes predictably over time, and because industry analysts have accepted it as a performance measure. Comparison of our presentation of FFO to similarly titled measures for other REITs may not necessarily be meaningful due to possible differences in the application of the NAREIT definition used by such REITs.
Property Operating Income: Rental income, other property income and mortgage interest income, less rental expenses and real estate taxes.
Overall Portfolio: Includes all operating properties owned in reporting period.
Same Center: Information provided on a same center basis is provided for only those properties that were owned, operated, and consolidated for the entirety of both periods being compared, excludes properties that were redeveloped, expanded or under development and properties purchased or sold at any time during the periods being compared. Same center growth statistics are calculated on a GAAP basis.
Tenant Improvements and Incentives: Represents not only the total dollars committed for the improvement (fit-out) of a space as it relates to a specific lease and, except for redevelopments, may also include base building costs (i.e. expansion, escalators or new entrances) which are required to make the space leasable. Incentives include amounts paid to tenants as an inducement to sign a lease that do not represent building improvements.
30