Attached files
| file | filename |
|---|---|
| EX-99.1 - EXHIBIT 99.1 - ANNALY CAPITAL MANAGEMENT INC | a51552027ex99_1.htm |
| 8-K - ANNALY CAPITAL MANAGEMENT, INC. 8-K - ANNALY CAPITAL MANAGEMENT INC | a51552027.htm |
Exhibit 99.2


First Quarter 2017Financial Summary May 3, 2017
This presentation, other written or oral communications, and our public documents to which we refer contain or incorporate by reference certain forward-looking statements which are based on various assumptions (some of which are beyond our control) and may be identified by reference to a future period or periods or by the use of forward-looking terminology, such as “may,” “will,” “believe,” “expect,” “anticipate,” “continue,” or similar terms or variations on those terms or the negative of those terms. Actual results could differ materially from those set forth in forward-looking statements due to a variety of factors, including, but not limited to, changes in interest rates; changes in the yield curve; changes in prepayment rates; the availability of mortgage-backed securities and other securities for purchase; the availability of financing and, if available, the terms of any financings; changes in the market value of our assets; changes in business conditions and the general economy; our ability to grow our commercial business; our ability to grow our residential mortgage credit business; credit risks related to our investments in credit risk transfer securities, residential mortgage-backed securities and related residential mortgage credit assets, commercial real estate assets and corporate debt; risks related to investments in mortgage servicing rights and ownership of a servicer; our ability to consummate any contemplated investment opportunities; changes in government regulations affecting our business; our ability to maintain our qualification as a REIT for U.S. federal income tax purposes; and our ability to maintain our exemption from registration under the Investment Company Act of 1940, as amended. For a discussion of the risks and uncertainties which could cause actual results to differ from those contained in the forward-looking statements, see “Risk Factors” in our most recent Annual Report on Form 10-K and any subsequent Quarterly Reports on Form 10-Q. We do not undertake, and specifically disclaim any obligation, to publicly release the result of any revisions which may be made to any forward-looking statements to reflect the occurrence of anticipated or unanticipated events or circumstances after the date of such statements, except as required by law.Non-GAAP Financial MeasuresBased upon recent regulatory guidance and interpretations on the use of non-GAAP financial measures, in its fourth quarter 2016 filings, news releases and presentations, the Company furnished both unrevised non-GAAP financial measures that excluded the premium amortization adjustment (“PAA”) as well as revised non-GAAP financial measures that included the PAA. In addition, the Company indicated that the fourth quarter 2016 would be the final quarter that the Company would report core earnings metrics that exclude the PAA. Beginning with the first quarter 2017, the Company is no longer disclosing non-GAAP financial measures that exclude the PAA. However, given its usefulness in evaluating the Company’s financial performance, the Company is continuing to separately disclose the PAA. Additionally, comparative prior period results reported in the current and future periods will conform to the revised presentation.The Company believes its non-GAAP financial measures are useful for management, investors, analysts, and other interested parties in evaluating the Company’s performance but should not be viewed in isolation and are not a substitute for financial measures computed in accordance with GAAP. Please see the section entitled “Non-GAAP Reconciliations” in the attached Appendix for a reconciliation to the most directly comparable GAAP financial measures. A reconciliation of GAAP net income (loss) to non-GAAP core earnings is provided on page 7 of this financial summary. Safe Harbor Notice 1
Unaudited, dollars in thousands except per share amounts Note: The endnotes for this page appear in the section entitled “Endnotes for Page 2” in the Appendix. Core earnings, core earnings per average common share and annualized core return on average equity represent non-GAAP measures. This presentation also includes additional non-GAAP measures, including economic interest expense and economic net interest income. See the section titled “Non-GAAP Reconciliations” in the Appendix for a reconciliation of non-GAAP financial measures to the most directly comparable GAAP financial measures. A reconciliation of GAAP net income (loss) to non-GAAP core earnings is provided on page 7 of this financial summary. Q1 2017 Financial Snapshot 2 For the quarters ended March 31, December 31, 2017 2016 Income Statement GAAP net income per average common share $0.41 $1.79 Core earnings per average common share (1) $0.29 $0.53 PAA cost (benefit) per average common share 0.02 (0.23) Annualized return on average equity 13.97% 57.23% Annualized core return on average equity 10.09% 17.53% Balance Sheet Book value per common share $11.23 $11.16 Leverage at period-end (2) 5.6x 5.8x Economic leverage at period-end (3) 6.1x 6.4x Capital ratio at period-end (4) 13.8% 13.1% Portfolio Agency mortgage-backed securities and debentures $72,708,490 $75,589,873 Mortgage servicing rights 632,166 652,216 Residential credit portfolio (5) 2,778,452 2,468,318 Commercial real estate investments (6) 5,550,464 5,881,236 Corporate debt 841,265 773,274 Total residential and commercial investments $82,510,837 $85,364,917 Net interest margin (7) 1.47% 2.49% Average yield on interest earning assets (8) 2.74% 3.81% Net interest spread 1.15% 2.28% Other Information Annualized operating expenses as a % of average assets 0.25% 0.25% Annualized operating expenses as a % of average equity 1.71% 1.72%
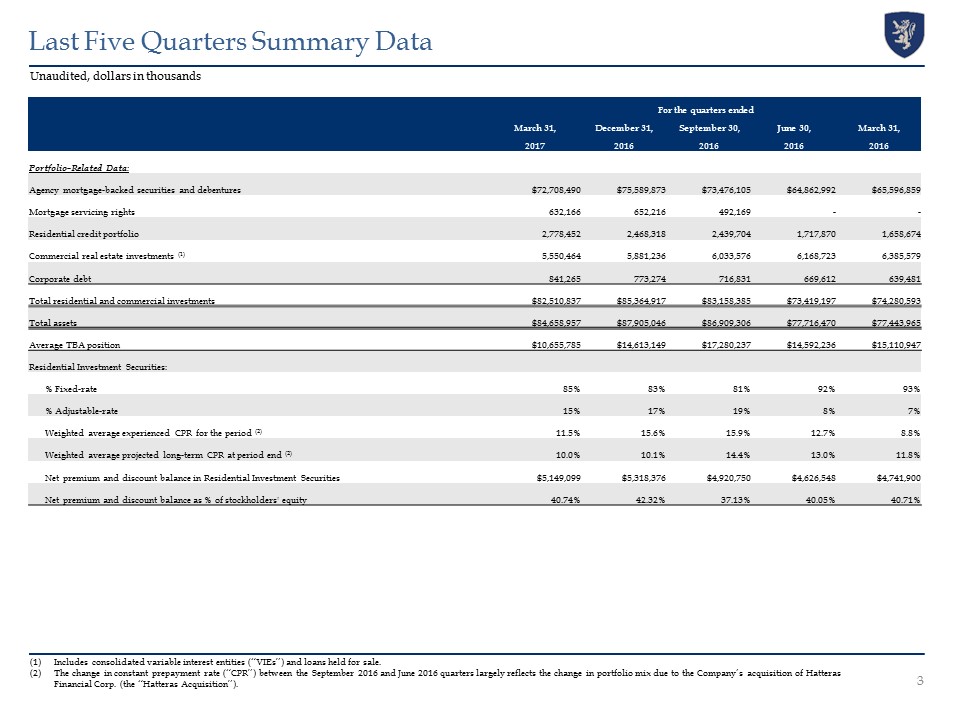
Unaudited, dollars in thousands Last Five Quarters Summary Data Includes consolidated variable interest entities (“VIEs”) and loans held for sale.The change in constant prepayment rate (“CPR”) between the September 2016 and June 2016 quarters largely reflects the change in portfolio mix due to the Company’s acquisition of Hatteras Financial Corp. (the “Hatteras Acquisition”). For the quarters ended March 31, December 31, September 30, June 30, March 31, 2017 2016 2016 2016 2016 Portfolio-Related Data: Agency mortgage-backed securities and debentures $72,708,490 $75,589,873 $73,476,105 $64,862,992 $65,596,859 Mortgage servicing rights 632,166 652,216 492,169 - - Residential credit portfolio 2,778,452 2,468,318 2,439,704 1,717,870 1,658,674 Commercial real estate investments (1) 5,550,464 5,881,236 6,033,576 6,168,723 6,385,579 Corporate debt 841,265 773,274 716,831 669,612 639,481 Total residential and commercial investments $82,510,837 $85,364,917 $83,158,385 $73,419,197 $74,280,593 Total assets $84,658,957 $87,905,046 $86,909,306 $77,716,470 $77,443,965 Average TBA position $10,655,785 $14,613,149 $17,280,237 $14,592,236 $15,110,947 Residential Investment Securities: % Fixed-rate 85% 83% 81% 92% 93% % Adjustable-rate 15% 17% 19% 8% 7% Weighted average experienced CPR for the period (2) 11.5% 15.6% 15.9% 12.7% 8.8% Weighted average projected long-term CPR at period end (2) 10.0% 10.1% 14.4% 13.0% 11.8% Net premium and discount balance in Residential Investment Securities $5,149,099 $5,318,376 $4,920,750 $4,626,548 $4,741,900 Net premium and discount balance as % of stockholders' equity 40.74% 42.32% 37.13% 40.05% 40.71% 3
Consists of common stock, additional paid-in capital, accumulated other comprehensive income (loss) and accumulated deficit.Measures total notional balances of interest rate swaps, interest rate swaptions and futures relative to repurchase agreements, other secured financing and to be announced (“TBA”) notional outstanding.Excludes forward starting swaps; weighted average fixed rate on forward starting receive fixed swaps was 1.38% as of June 30, 2016. There were no forward starting swaps as of March 31, 2017, December 31, 2016, September 30, 2016 or March 31, 2016. Unaudited, dollars in thousands except per share amounts Last Five Quarters Summary Data (cont’d) 4 For the quarters ended March 31, December 31, September 30, June 30, March 31, 2017 2016 2016 2016 2016 Liabilities, Capital and Hedging Data: Repurchase agreements $62,719,087 $65,215,810 $61,784,121 $53,868,385 $54,448,141 Other secured financing $3,876,150 $3,884,708 $3,804,742 $3,588,326 $3,588,326 Securitized debt of consolidated VIEs $3,477,059 $3,655,802 $3,712,821 $3,748,289 $3,802,682 Participation sold $12,760 $12,869 $12,976 $13,079 $13,182 Mortgages payable $311,707 $311,636 $327,632 $327,643 $334,765 Total debt $70,396,763 $73,080,825 $69,642,292 $61,545,722 $62,187,096 Total liabilities $72,011,608 $75,329,074 $73,647,503 $66,154,597 $65,785,958 Cumulative redeemable preferred stock $1,200,559 $1,200,559 $1,200,559 $913,059 $913,059 Common equity(1) $11,439,467 $11,367,621 $12,053,103 $10,640,156 $10,735,393 Total Annaly stockholders' equity $12,640,026 $12,568,180 $13,253,662 $11,553,215 $11,648,452 Non-controlling interests $7,323 $7,792 $8,141 $8,658 $9,555 Total equity $12,647,349 $12,575,972 $13,261,803 $11,561,873 $11,658,007 Weighted average days to maturity of repurchase agreements 88 96 128 129 136 Weighted average rate on repurchase agreements, at period-end 1.15% 1.07% 1.07% 1.02% 0.99% Weighted average rate on repurchase agreements, for the quarter 1.07% 1.01% 0.97% 1.00% 0.95% Leverage at period-end 5.6x 5.8x 5.3x 5.3x 5.3x Economic leverage at period-end 6.1x 6.4x 6.1x 6.1x 6.2x Capital ratio at period-end 13.8% 13.1% 13.3% 13.2% 13.2% Book value per common share $11.23 $11.16 $11.83 $11.50 $11.61 Total common shares outstanding 1,018,971 1,018,913 1,018,858 924,930 924,853 Hedge ratio(2) 63% 56% 52% 49% 51% Weighted average pay rate on interest rate swaps(3) 2.25% 2.22% 2.25% 2.28% 2.26% Weighted average receive rate on interest rate swaps(3) 1.15% 1.02% 0.88% 0.74% 0.69% Weighted average net rate on interest rate swaps 1.10% 1.20% 1.37% 1.54% 1.57%
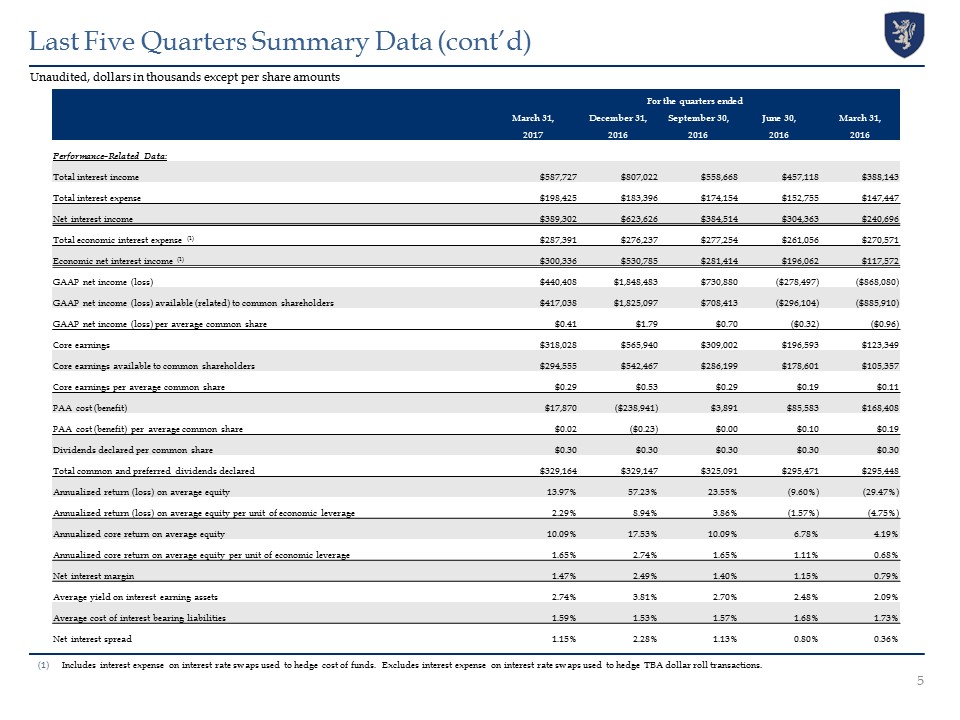
Includes interest expense on interest rate swaps used to hedge cost of funds. Excludes interest expense on interest rate swaps used to hedge TBA dollar roll transactions. Unaudited, dollars in thousands except per share amounts Last Five Quarters Summary Data (cont’d) 5 For the quarters ended March 31, December 31, September 30, June 30, March 31, 2017 2016 2016 2016 2016 Performance-Related Data: Total interest income $587,727 $807,022 $558,668 $457,118 $388,143 Total interest expense $198,425 $183,396 $174,154 $152,755 $147,447 Net interest income $389,302 $623,626 $384,514 $304,363 $240,696 Total economic interest expense (1) $287,391 $276,237 $277,254 $261,056 $270,571 Economic net interest income (1) $300,336 $530,785 $281,414 $196,062 $117,572 GAAP net income (loss) $440,408 $1,848,483 $730,880 ($278,497) ($868,080) GAAP net income (loss) available (related) to common shareholders $417,038 $1,825,097 $708,413 ($296,104) ($885,910) GAAP net income (loss) per average common share $0.41 $1.79 $0.70 ($0.32) ($0.96) Core earnings $318,028 $565,940 $309,002 $196,593 $123,349 Core earnings available to common shareholders $294,555 $542,467 $286,199 $178,601 $105,357 Core earnings per average common share $0.29 $0.53 $0.29 $0.19 $0.11 PAA cost (benefit) $17,870 ($238,941) $3,891 $85,583 $168,408 PAA cost (benefit) per average common share $0.02 ($0.23) $0.00 $0.10 $0.19 Dividends declared per common share $0.30 $0.30 $0.30 $0.30 $0.30 Total common and preferred dividends declared $329,164 $329,147 $325,091 $295,471 $295,448 Annualized return (loss) on average equity 13.97% 57.23% 23.55% (9.60%) (29.47%) Annualized return (loss) on average equity per unit of economic leverage 2.29% 8.94% 3.86% (1.57%) (4.75%) Annualized core return on average equity 10.09% 17.53% 10.09% 6.78% 4.19% Annualized core return on average equity per unit of economic leverage 1.65% 2.74% 1.65% 1.11% 0.68% Net interest margin 1.47% 2.49% 1.40% 1.15% 0.79% Average yield on interest earning assets 2.74% 3.81% 2.70% 2.48% 2.09% Average cost of interest bearing liabilities 1.59% 1.53% 1.57% 1.68% 1.73% Net interest spread 1.15% 2.28% 1.13% 0.80% 0.36%
Included within realized losses on interest rate swaps. Excludes interest expense on interest rate swaps used to hedge TBA dollar roll transactions. Unaudited, dollars in thousands Components of Economic Net Interest Income For the quarters ended March 31, December 31, September 30, June 30, March 31, 2017 2016 2016 2016 2016 Interest income: Residential Investment Securities $515,910 $740,664 $493,226 $394,850 $315,717 Residential mortgage loans 3,864 2,539 1,608 - - Commercial investment portfolio 64,345 61,431 61,240 59,578 70,187 Reverse repurchase agreements 3,608 2,388 2,594 2,690 2,239 Total interest income $587,727 $807,022 $558,668 $457,118 $388,143 Economic interest expense: Repurchase agreements $173,090 $162,676 $154,083 $136,176 $132,891 Interest expense on swaps used to hedge cost of funds(1) 88,966 92,841 103,100 108,301 123,124 Securitized debt of consolidated VIEs 14,850 12,087 12,046 11,226 9,033 Participation sold 153 155 157 157 158 Other 10,332 8,478 7,868 5,196 5,365 Total economic interest expense $287,391 $276,237 $277,254 $261,056 $270,571 Economic net interest income $300,336 $530,785 $281,414 $196,062 $117,572 6
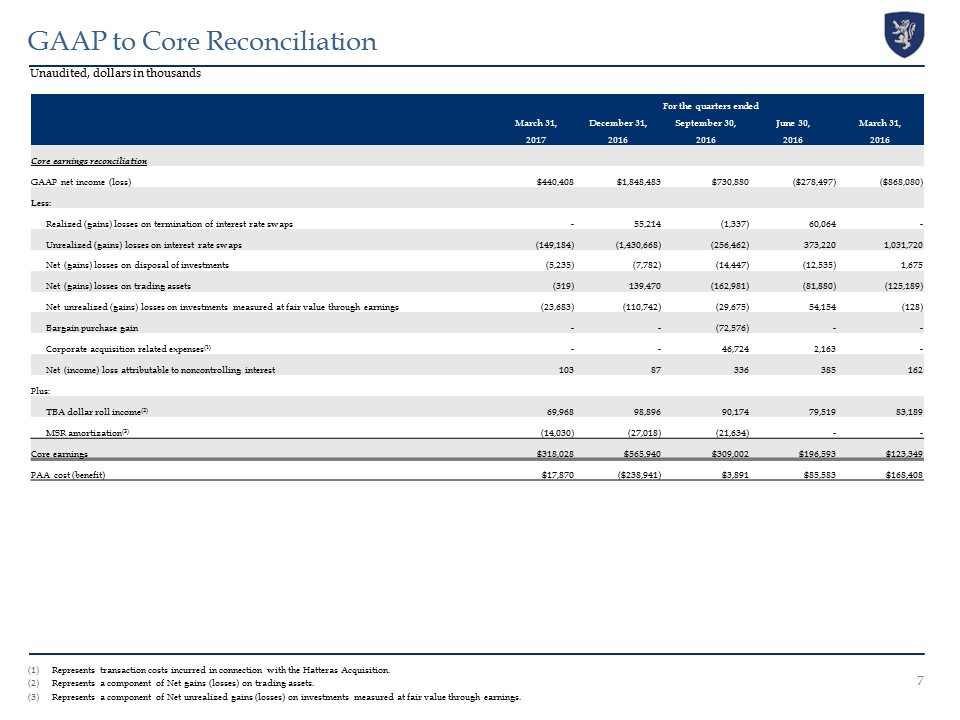
Represents transaction costs incurred in connection with the Hatteras Acquisition.Represents a component of Net gains (losses) on trading assets.Represents a component of Net unrealized gains (losses) on investments measured at fair value through earnings. Unaudited, dollars in thousands GAAP to Core Reconciliation 7 For the quarters ended March 31, December 31, September 30, June 30, March 31, 2017 2016 2016 2016 2016 Core earnings reconciliation GAAP net income (loss) $440,408 $1,848,483 $730,880 ($278,497) ($868,080) Less: Realized (gains) losses on termination of interest rate swaps - 55,214 (1,337) 60,064 - Unrealized (gains) losses on interest rate swaps (149,184) (1,430,668) (256,462) 373,220 1,031,720 Net (gains) losses on disposal of investments (5,235) (7,782) (14,447) (12,535) 1,675 Net (gains) losses on trading assets (319) 139,470 (162,981) (81,880) (125,189) Net unrealized (gains) losses on investments measured at fair value through earnings (23,683) (110,742) (29,675) 54,154 (128) Bargain purchase gain - - (72,576) - - Corporate acquisition related expenses(1) - - 46,724 2,163 - Net (income) loss attributable to noncontrolling interest 103 87 336 385 162 Plus: TBA dollar roll income(2) 69,968 98,896 90,174 79,519 83,189 MSR amortization(3) (14,030) (27,018) (21,634) - - Core earnings $318,028 $565,940 $309,002 $196,593 $123,349 PAA cost (benefit) $17,870 ($238,941) $3,891 $85,583 $168,408
Includes interest expense on interest rate swaps used to hedge cost of funds. Unaudited Changes in Key Metrics 8 For the quarters ended March 31, December 31, September 30, June 30, March 31, 2017 2016 2016 2016 2016 Book value, per common share rollforward: Book value, per common share, beginning of period $11.16 $11.83 $11.50 $11.61 $11.73 Net income (loss) attributable to common stockholders 0.41 1.79 0.70 (0.32) (0.96) Other comprehensive income (loss) attributable to common stockholders (0.04) (2.16) 0.00 0.51 1.11 Common dividends declared (0.30) (0.30) (0.30) (0.30) (0.30) Issuance of common stock 0.00 0.00 (0.07) 0.00 0.00 Buyback of common stock 0.00 0.00 0.00 0.00 0.03 Book value, per common share, end of period $11.23 $11.16 $11.83 $11.50 $11.61 Changes in net interest margin Prior quarter net interest margin 2.49% 1.40% 1.15% 0.79% 1.80% Quarter-over-quarter changes in contribution: Coupon on average interest-earning assets (including average TBA dollar roll balances) 0.11% 0.08% (0.18%) (0.05%) (0.04%) Net amortization of premiums (0.92%) 0.93% 0.34% 0.39% (0.86%) Interest expense and realized gain (loss) on interest rate swaps (0.10%) 0.04% 0.09% 0.03% (0.05%) TBA dollar roll income (0.11%) 0.04% 0.00% (0.01%) (0.06%) Current quarter net interest margin 1.47% 2.49% 1.40% 1.15% 0.79% Changes in net interest spread Prior quarter net interest spread 2.28% 1.13% 0.80% 0.36% 1.47% Quarter-over-quarter changes in contribution: Coupon on average interest earning assets (0.03%) (0.01%) (0.19%) (0.09%) (0.02%) Net amortization of premiums (1.04%) 1.12% 0.41% 0.48% (1.04%) Average cost of interest bearing liabilities(1) (0.06%) 0.04% 0.11% 0.05% (0.05%) Current quarter net interest spread 1.15% 2.28% 1.13% 0.80% 0.36%
Includes other income (loss), general and administrative expenses and income taxes.Includes other income (loss), mortgage servicing rights (“MSR”) amortization (a component of Net unrealized gains (losses) on financial instruments measured at fair value through earnings), general and administrative expenses (excluding corporate acquisition related expenses) and income taxes. Unaudited Changes in Key Metrics 9 For the quarters ended March 31, December 31, September 30, June 30, March 31, 2017 2016 2016 2016 2016 Changes in GAAP return on average equity Prior quarter GAAP return on average equity 57.23% 23.55% (9.60%) (29.47%) 22.15% Quarter-over-quarter changes in contribution: Coupon income 0.68% (0.46%) 0.02% (0.37%) 0.87% Net amortization of premiums and accretion of discounts (7.02%) 7.44% 2.24% 2.94% (6.76%) Interest expense and realized gain (loss) on interest rate swaps (0.70%) 0.73% 0.14% 0.24% (0.81%) Realized (gains) losses on termination of interest rate swaps 1.71% (1.75%) 2.11% (2.07%) 0.00% Unrealized (gains) / losses on interest rate swaps (39.57%) 36.03% 21.12% 22.17% (50.34%) Realized and unrealized (gains) / losses on investments and trading assets 1.58% (7.32%) 5.29% (2.81%) 5.10% Bargain purchase gain 0.00% (2.34%) 2.34% 0.00% 0.00% Other(1) 0.06% 1.35% (0.11%) (0.23%) 0.32% Current quarter GAAP return on average equity 13.97% 57.23% 23.55% (9.60%) (29.47%) Changes in core return on average equity Prior quarter core return on average equity 17.53% 10.09% 6.78% 4.19% 10.89% Quarter-over-quarter changes in contribution: Coupon income 0.68% (0.46%) 0.02% (0.37%) 0.88% Net amortization of premiums (7.04%) 7.32% 2.36% 2.95% (6.76%) Economic interest expense and other swaps expense (0.70%) 0.73% 0.14% 0.24% (0.81%) TBA dollar roll income (0.84%) 0.16% 0.17% (0.08%) (0.32%) Other(2) 0.46% (0.31%) 0.62% (0.15%) 0.31% Current quarter core return on average equity 10.09% 17.53% 10.09% 6.78% 4.19%
Unaudited Impact of PAA on Key Metrics 10 For the quarters ended March 31, December 31, September 30, June 30, March 31, 2017 2016 2016 2016 2016 As reported: Annualized core return on average equity 10.09% 17.53% 10.09% 6.78% 4.19% Net interest margin 1.47% 2.49% 1.40% 1.15% 0.79% Net interest spread 1.15% 2.28% 1.13% 0.80% 0.36% Average yield on interest earning assets 2.74% 3.81% 2.70% 2.48% 2.09% Impact of PAA on Reported Result: Cost / (Benefit) Annualized core return on average equity 0.57% (7.40%) 0.00% 2.95% 5.72% Net interest margin 0.08% (0.96%) 0.02% 0.39% 0.75% Net interest spread 0.09% (1.13%) 0.02% 0.47% 0.91% Average yield on interest earning assets 0.09% (1.13%) 0.02% 0.47% 0.91%
Weighted by face value.Weighted by notional value. Unaudited, dollars in thousands Residential Investments and TBA Derivative Overview as of March 31, 2017 11 Agency Fixed-Rate Securities (Pools) Weighted Avg. Current Weighted Avg. Weighted Avg. Weighted Avg. Weighted Avg. Estimated Years to Maturity Face Value % (1) Coupon Amortized Cost Fair Value 3-Month CPR Fair Value <=15 years $7,235,033 12.1% 3.15% 103.8% 103.3% 9.1% $7,471,121 20 years 5,106,987 8.5% 3.49% 104.7% 104.1% 12.7% 5,314,919 >=30 years 47,676,928 79.4% 3.77% 106.4% 104.2% 9.9% 49,661,983 Total/Weighted Avg. $60,018,948 100.0% 3.67% 105.9% 104.0% 10.1% $62,448,023 TBA Purchase Contracts Weighted Avg. Implied Cost Implied Market Type Notional Value % (2) Coupon Basis Value 15-year $4,080,000 40.3% 2.90% $4,151,160 $4,162,481 30-year 6,041,000 59.7% 3.80% 6,254,565 6,268,126 Total/Weighted Avg. $10,121,000 100.0% 3.43% $10,405,725 $10,430,607 Agency Adjustable-Rate Securities Weighted Avg. Current Weighted Avg. Weighted Avg. Weighted Avg. Weighted Avg. Estimated Months to Reset Face Value % (1) Coupon Amortized Cost Fair Value 3-Month CPR Fair Value 0 - 24 months $4,473,754 51.2% 2.96% 104.1% 104.9% 25.2% $4,690,738 25 - 40 months 2,560,458 29.3% 2.44% 103.3% 103.0% 19.2% 2,636,946 41 - 60 months 639,247 7.3% 2.82% 103.6% 102.6% 16.4% 655,617 61 - 90 months 450,372 5.2% 3.02% 103.7% 102.6% 12.8% 461,954 >90 months 607,730 7.0% 2.99% 102.9% 102.0% 9.1% 620,180 Total/Weighted Avg. $8,731,561 100.0% 2.80% 103.7% 103.8% 21.1% $9,065,435
Weighted by notional value.Weighted by fair value. Unaudited, dollars in thousands Residential Investments and TBA Derivative Overview as of March 31, 2017 (cont’d) 12 Agency Interest-Only Collateralized Mortgage-Backed Obligations Current Notional Weighted Avg. Weighted Avg. Weighted Avg. Weighted Avg. Estimated Type Value % (1) Coupon Amortized Cost Fair Value 3-Month CPR Fair Value Interest-Only $4,391,529 56.5% 3.27% 13.3% 11.7% 10.0% $513,700 Inverse Interest-Only 3,375,555 43.5% 5.16% 23.6% 20.2% 11.0% 681,332 Total/Weighted Avg. $7,767,084 100.0% 4.09% 17.8% 15.4% 10.4% $1,195,032 Mortgage Servicing Rights Unpaid Excess Weighted Avg. Principal Weighted Avg. Servicing Loan Age Estimated Type Balance Coupon Spread (months) Fair Value Total/Weighted Avg. $54,252,500 3.83% 0.24% 12.6 $632,166 Residential Credit Portfolio Current Face / Weighted Avg. Weighted Avg. Weighted Avg. Estimated Sector Notional Value % (2) Coupon Amortized Cost Fair Value Fair Value Credit Risk Transfer $639,847 24.7% 5.23% 100.9% 107.4% $686,943 Alt-A 216,336 6.9% 4.19% 84.0% 88.0% 190,453 Prime 204,218 6.8% 4.66% 86.9% 92.7% 189,229 Subprime 734,883 24.5% 2.59% 89.1% 92.8% 681,679 NPL/RPL 206,690 7.5% 4.07% 100.1% 100.4% 207,459 Prime Jumbo 124,090 4.5% 3.50% 100.4% 100.8% 125,111 Prime Jumbo Interest-Only 823,708 0.5% 0.38% 1.7% 1.8% 15,162 Residential Mortgage Loans 671,855 24.6% 4.33% 102.1% 101.6% 682,416 Total/Weighted Avg. $3,621,627 100.0% 3.21% $2,778,452
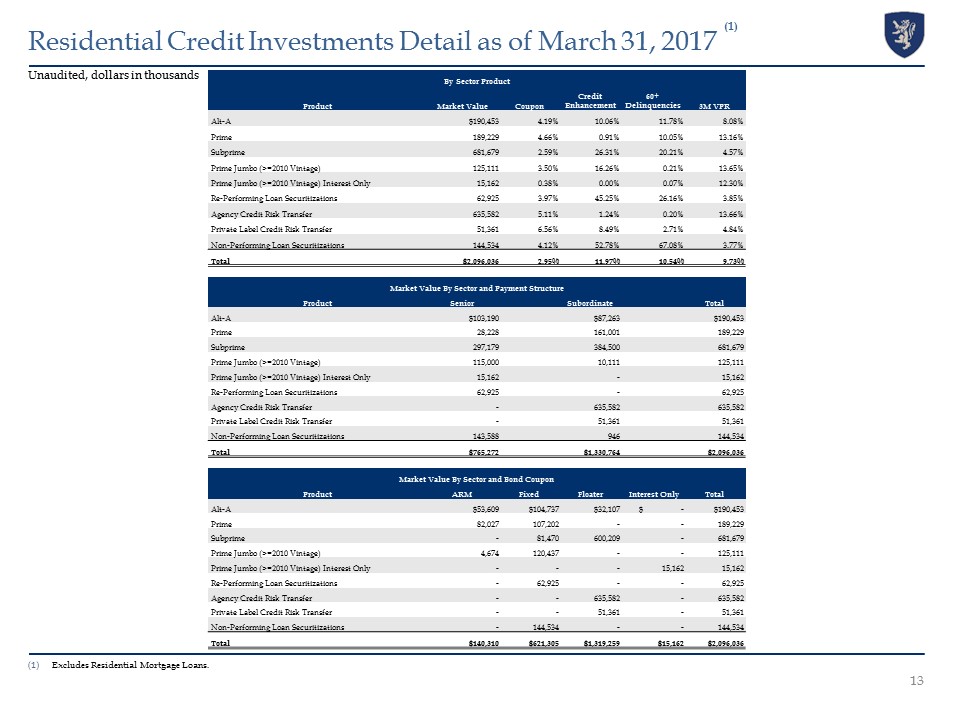
Excludes Residential Mortgage Loans. Unaudited, dollars in thousands Residential Credit Investments Detail as of March 31, 2017 (1) 13 By Sector Product Product Market Value Coupon Credit Enhancement 60+ Delinquencies 3M VPR Alt-A $190,453 4.19% 10.06% 11.78% 8.08% Prime 189,229 4.66% 0.91% 10.05% 13.16% Subprime 681,679 2.59% 26.31% 20.21% 4.57% Prime Jumbo (>=2010 Vintage) 125,111 3.50% 16.26% 0.21% 13.65% Prime Jumbo (>=2010 Vintage) Interest Only 15,162 0.38% 0.00% 0.07% 12.30% Re-Performing Loan Securitizations 62,925 3.97% 45.25% 26.16% 3.85% Agency Credit Risk Transfer 635,582 5.11% 1.24% 0.20% 13.66% Private Label Credit Risk Transfer 51,361 6.56% 8.49% 2.71% 4.84% Non-Performing Loan Securitizations 144,534 4.12% 52.78% 67.08% 3.77% Total $2,096,036 2.95% 11.97% 10.54% 9.73% Market Value By Sector and Payment Structure Product Senior Subordinate Total Alt-A $103,190 $87,263 $190,453 Prime 28,228 161,001 189,229 Subprime 297,179 384,500 681,679 Prime Jumbo (>=2010 Vintage) 115,000 10,111 125,111 Prime Jumbo (>=2010 Vintage) Interest Only 15,162 - 15,162 Re-Performing Loan Securitizations 62,925 - 62,925 Agency Credit Risk Transfer - 635,582 635,582 Private Label Credit Risk Transfer - 51,361 51,361 Non-Performing Loan Securitizations 143,588 946 144,534 Total $765,272 $1,330,764 $2,096,036 Market Value By Sector and Bond Coupon Product ARM Fixed Floater Interest Only Total Alt-A $53,609 $104,737 $32,107 $ - $190,453 Prime 82,027 107,202 - - 189,229 Subprime - 81,470 600,209 - 681,679 Prime Jumbo (>=2010 Vintage) 4,674 120,437 - - 125,111 Prime Jumbo (>=2010 Vintage) Interest Only - - - 15,162 15,162 Re-Performing Loan Securitizations - 62,925 - - 62,925 Agency Credit Risk Transfer - - 635,582 - 635,582 Private Label Credit Risk Transfer - - 51,361 - 51,361 Non-Performing Loan Securitizations - 144,534 - - 144,534 Total $140,310 $621,305 $1,319,259 $15,162 $2,096,036
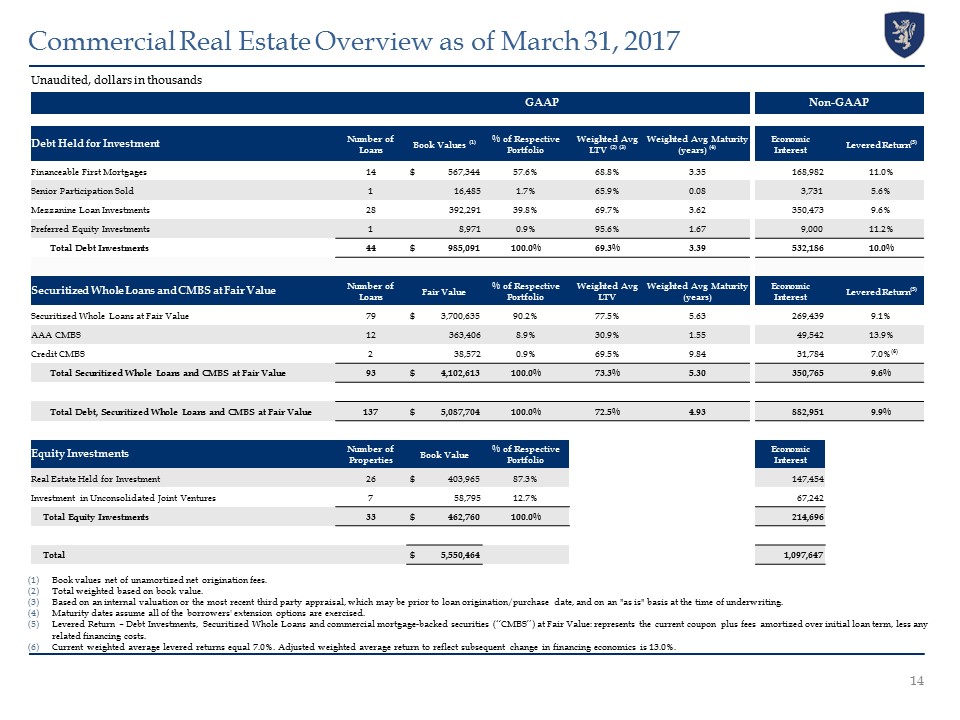
Unaudited, dollars in thousands Book values net of unamortized net origination fees.Total weighted based on book value.Based on an internal valuation or the most recent third party appraisal, which may be prior to loan origination/purchase date, and on an "as is" basis at the time of underwriting.Maturity dates assume all of the borrowers' extension options are exercised.Levered Return – Debt Investments, Securitized Whole Loans and commercial mortgage-backed securities (“CMBS”) at Fair Value: represents the current coupon plus fees amortized over initial loan term, less any related financing costs.Current weighted average levered returns equal 7.0%. Adjusted weighted average return to reflect subsequent change in financing economics is 13.0%. Commercial Real Estate Overview as of March 31, 2017 14 GAAP Non-GAAP Debt Held for Investment Number of Loans Book Values (1) % of Respective Portfolio Weighted Avg LTV (2) (3) Weighted Avg Maturity (years) (4) Economic Interest Levered Return(5) Financeable First Mortgages 14 $ 567,344 57.6% 68.8% 3.35 168,982 11.0% Senior Participation Sold 1 16,485 1.7% 65.9% 0.08 3,731 5.6% Mezzanine Loan Investments 28 392,291 39.8% 69.7% 3.62 350,473 9.6% Preferred Equity Investments 1 8,971 0.9% 95.6% 1.67 9,000 11.2% Total Debt Investments 44 $ 985,091 100.0% 69.3% 3.39 532,186 10.0% Securitized Whole Loans and CMBS at Fair Value Number of Loans Fair Value % of Respective Portfolio Weighted Avg LTV Weighted Avg Maturity (years) Economic Interest Levered Return(5) Securitized Whole Loans at Fair Value 79 $ 3,700,635 90.2% 77.5% 5.63 269,439 9.1% AAA CMBS 12 363,406 8.9% 30.9% 1.55 49,542 13.9% Credit CMBS 2 38,572 0.9% 69.5% 9.84 31,784 7.0%(6) Total Securitized Whole Loans and CMBS at Fair Value 93 $ 4,102,613 100.0% 73.3% 5.30 350,765 9.6% Total Debt, Securitized Whole Loans and CMBS at Fair Value 137 $ 5,087,704 100.0% 72.5% 4.93 882,951 9.9% Equity Investments Number of Properties Book Value % of Respective Portfolio Economic Interest Real Estate Held for Investment 26 $ 403,965 87.3% 147,454 Investment in Unconsolidated Joint Ventures 7 58,795 12.7% 67,242 Total Equity Investments 33 $ 462,760 100.0% 214,696 Total $ 5,550,464 1,097,647
Unaudited, dollars in thousands Middle Market Lending Overview as of March 31, 2017 15 Industry Dispersion Industry Fixed Rate Floating Rate Total Aircraft and Parts $ - $ 31,999 $ 31,999 Commercial Fishing - 38,816 38,816 Computer Programming, Data Processing, and Other Computer Related Services - 132,614 132,614 Drugs - 33,837 33,837 Groceries and Related Products - 14,865 14,865 Grocery Stores - 23,689 23,689 Home Health Care Services - 24,176 24,176 Insurance Agents, Brokers and Service 4,402 73,234 77,636 Management and Public Relations Services - 16,518 16,518 Medical and Dental Laboratories - 17,215 17,215 Miscellaneous Business Services 84,524 - 84,524 Miscellaneous Equipment Rental & Leasing - 19,623 19,623 Miscellaneous Health and Allied Services, not elsewhere classified - 9,764 9,764 Miscellaneous Nonmetallic Minerals, except Fuels - 24,694 24,694 Miscellaneous Plastic Products - 26,996 26,996 Motor Vehicles and Motor Vehicle Parts and Supplies - 12,291 12,291 Offices and Clinics of Doctors of Medicine - 92,171 92,171 Personnel Supply Services - 34,726 34,726 Public Warehousing & Storage - 55,287 55,287 Research, Development, and Testing Services - 17,744 17,744 Schools and Educational Services, not elsewhere classified - 20,916 20,916 Surgical, Medical, and Dental Instruments and Supplies - 13,240 13,240 Telephone Communications - 17,924 17,924 Total $ 88,926 $ 752,339 $ 841,265 Size Dispersion Position Size Amount Percentage $0 - $20 million $ 199,294 23.7% $20 - $40 million 354,715 42.1% $40 - $60 million 141,985 16.9% greater than $60 million 145,271 17.3% Total $ 841,265 100.0% Tenor Dispersion Remaining Term Amount Percentage One year or less $ - 0.0% One to three years 65,553 7.8% Three to five years 435,262 51.7% Greater than five years 340,450 40.5% Total $ 841,265 100.0% Lien Position Amount First lien loans $ 554,218 65.9% Second lien loans 198,121 23.6% Second lien notes 84,524 10.0% Subordinated notes 4,402 0.5% Total $ 841,265 100.0%
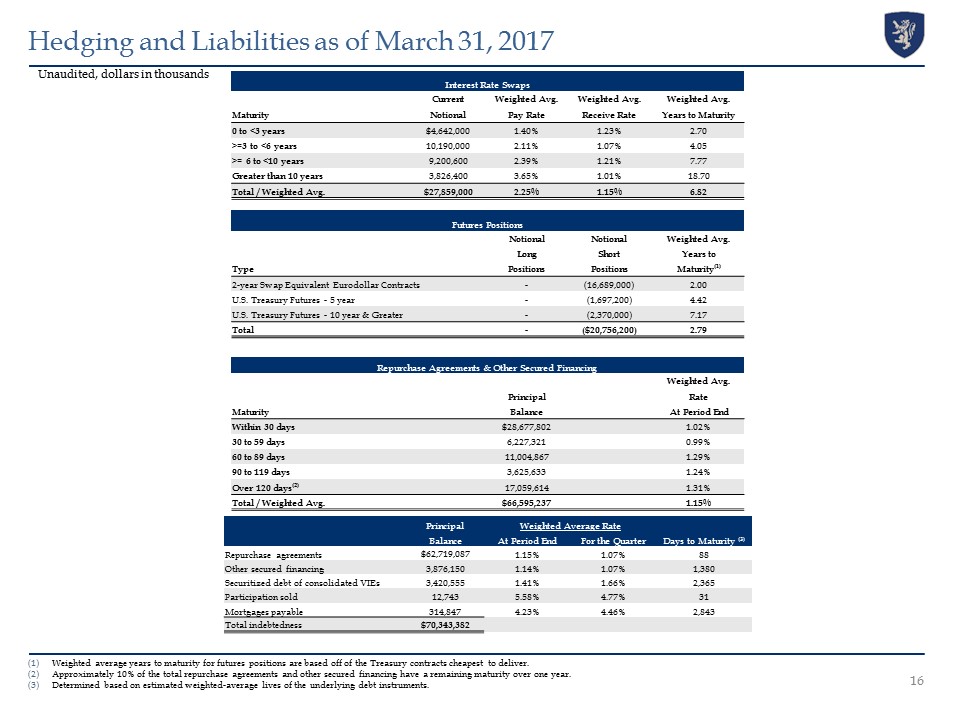
Weighted average years to maturity for futures positions are based off of the Treasury contracts cheapest to deliver.Approximately 10% of the total repurchase agreements and other secured financing have a remaining maturity over one year. Determined based on estimated weighted-average lives of the underlying debt instruments. Unaudited, dollars in thousands Hedging and Liabilities as of March 31, 2017 Principal Weighted Average Rate Balance At Period End For the Quarter Days to Maturity (3) Repurchase agreements $62,719,087 1.15% 1.07% 88 Other secured financing 3,876,150 1.14% 1.07% 1,380 Securitized debt of consolidated VIEs 3,420,555 1.41% 1.66% 2,365 Participation sold 12,743 5.58% 4.77% 31 Mortgages payable 314,847 4.23% 4.46% 2,843 Total indebtedness $70,343,382 16 Interest Rate Swaps Current Weighted Avg. Weighted Avg. Weighted Avg. Maturity Notional Pay Rate Receive Rate Years to Maturity 0 to <3 years $4,642,000 1.40% 1.23% 2.70 >=3 to <6 years 10,190,000 2.11% 1.07% 4.05 >= 6 to <10 years 9,200,600 2.39% 1.21% 7.77 Greater than 10 years 3,826,400 3.65% 1.01% 18.70 Total / Weighted Avg. $27,859,000 2.25% 1.15% 6.82 Futures Positions Notional Notional Weighted Avg. Long Short Years to Type Positions Positions Maturity(1) 2-year Swap Equivalent Eurodollar Contracts - (16,689,000) 2.00 U.S. Treasury Futures - 5 year - (1,697,200) 4.42 U.S. Treasury Futures - 10 year & Greater - (2,370,000) 7.17 Total - ($20,756,200) 2.79 Repurchase Agreements & Other Secured Financing Weighted Avg. Principal Rate Maturity Balance At Period End Within 30 days $28,677,802 1.02% 30 to 59 days 6,227,321 0.99% 60 to 89 days 11,004,867 1.29% 90 to 119 days 3,625,633 1.24% Over 120 days(2) 17,059,614 1.31% Total / Weighted Avg. $66,595,237 1.15%
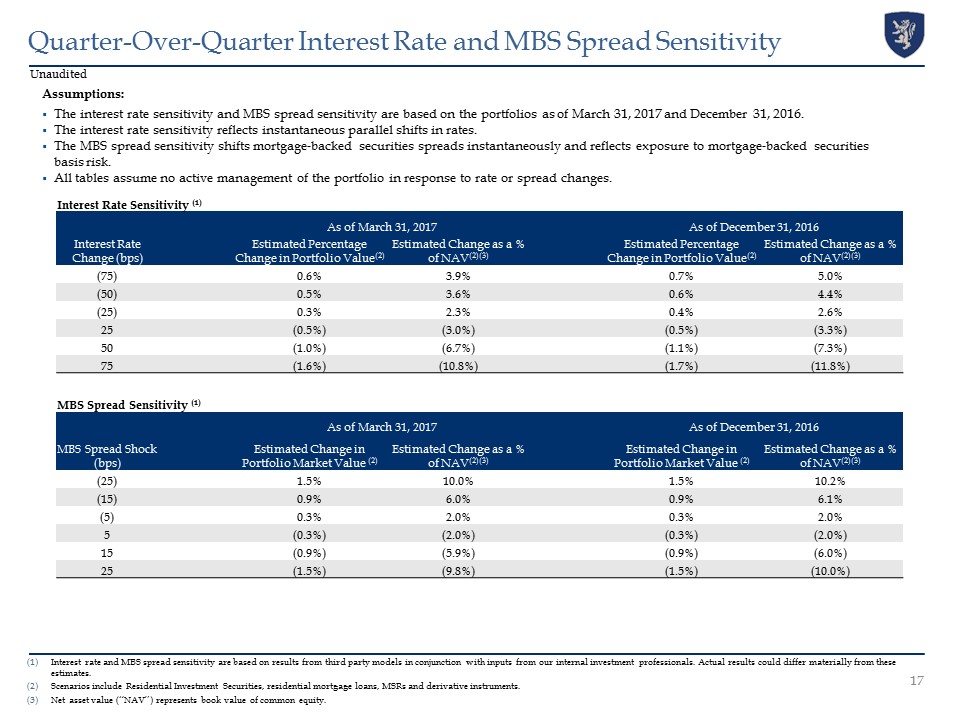
Interest rate and MBS spread sensitivity are based on results from third party models in conjunction with inputs from our internal investment professionals. Actual results could differ materially from these estimates.Scenarios include Residential Investment Securities, residential mortgage loans, MSRs and derivative instruments.Net asset value (“NAV”) represents book value of common equity. Unaudited Quarter-Over-Quarter Interest Rate and MBS Spread Sensitivity Assumptions:The interest rate sensitivity and MBS spread sensitivity are based on the portfolios as of March 31, 2017 and December 31, 2016.The interest rate sensitivity reflects instantaneous parallel shifts in rates.The MBS spread sensitivity shifts mortgage-backed securities spreads instantaneously and reflects exposure to mortgage-backed securities basis risk.All tables assume no active management of the portfolio in response to rate or spread changes. 17 Interest Rate Sensitivity (1) As of March 31, 2017 As of December 31, 2016 Interest Rate Change (bps) Estimated Percentage Change in Portfolio Value(2) Estimated Change as a % of NAV(2)(3) Estimated Percentage Change in Portfolio Value(2) Estimated Change as a % of NAV(2)(3) (75) 0.6% 3.9% 0.7% 5.0% (50) 0.5% 3.6% 0.6% 4.4% (25) 0.3% 2.3% 0.4% 2.6% 25 (0.5%) (3.0%) (0.5%) (3.3%) 50 (1.0%) (6.7%) (1.1%) (7.3%) 75 (1.6%) (10.8%) (1.7%) (11.8%) MBS Spread Sensitivity (1) As of March 31, 2017 As of December 31, 2016 MBS Spread Shock (bps) Estimated Change in Portfolio Market Value (2) Estimated Change as a % of NAV(2)(3) Estimated Change in Portfolio Market Value (2) Estimated Change as a % of NAV(2)(3) (25) 1.5% 10.0% 1.5% 10.2% (15) 0.9% 6.0% 0.9% 6.1% (5) 0.3% 2.0% 0.3% 2.0% 5 (0.3%) (2.0%) (0.3%) (2.0%) 15 (0.9%) (5.9%) (0.9%) (6.0%) 25 (1.5%) (9.8%) (1.5%) (10.0%)
Appendix
Endnotes for Page 2 Core earnings is defined as net income (loss) excluding gains or losses on disposals of investments and termination of interest rate swaps, unrealized gains or losses on interest rate swaps and investments measured at fair value through earnings, net gains and losses on trading assets, impairment losses, net income (loss) attributable to noncontrolling interest, corporate acquisition related expenses and certain other non-recurring gains or losses, and inclusive of TBA dollar roll income (a component of Net gains (losses) on trading assets) and realized amortization of MSRs (a component of net unrealized gains (losses) on investments measured at fair value through earnings).For purposes of calculating the Company’s leverage ratio, debt consists of repurchase agreements, other secured financing, securitized debt, participation sold and mortgages payable. Securitized debt, participation sold and mortgages payable are non-recourse to the Company.Computed as the sum of recourse debt, TBA derivative notional outstanding and net forward purchases of investments divided by total equity. Recourse debt consists of repurchase agreements and other secured financing. The ratio of total equity to total assets (inclusive of total market value of TBA derivatives and exclusive of consolidated VIEs associated with B Piece commercial mortgage-backed securities).Comprised of non-Agency mortgage-backed securities, credit risk transfer securities and residential mortgage loans.Includes consolidated VIEs and loans held for sale.Represents the sum of the Company’s annualized economic net interest income (inclusive of interest expense on interest rate swaps used to hedge cost of funds) plus TBA dollar roll income (less interest expense on swaps used to hedge TBA dollar roll transactions) divided by the sum of its average interest-earning assets plus average outstanding TBA derivative balances.Represents annualized interest income divided by average interest earning assets. Interest earning assets reflects the average amortized cost of our investments during the period. 19
To supplement its consolidated financial statements, which are prepared and presented in accordance with U.S. generally accepted accounting principles (“GAAP”), the Company provides non-GAAP financial measures. These measures should not be considered a substitute for, or superior to, financial measures computed in accordance with GAAP. These non-GAAP measures provide additional detail to enhance investor understanding of the Company’s period-over-period operating performance and business trends, as well as for assessing the Company’s performance versus that of industry peers. Reconciliations of these non-GAAP financial measures to their most directly comparable GAAP results are provided below. A reconciliation of GAAP net income (loss) to non-GAAP core earnings for the quarters ended March 31, 2017, December 31, 2016, September 30, 2016, June 30, 2016 and March 31, 2016 is provided on page 7 of this financial summary. Unaudited, dollars in thousands Non-GAAP Reconciliations For the quarters ended March 31, December 31, September 30, June 30, March 31, 2017 2016 2016 2016 2016 Economic Interest Expense Reconciliation GAAP interest expense $198,425 $183,396 $174,154 $152,755 $147,447 Add: Interest expense on interest rate swaps used to hedge cost of funds 88,966 92,841 103,100 108,301 123,124 Economic interest expense $287,391 $276,237 $277,254 $261,056 $270,571 Economic Core Metrics Interest Income $587,727 $807,022 $558,668 $457,118 $388,143 Average interest earning assets $85,664,151 $84,799,222 $82,695,270 $73,587,753 $74,171,943 Average yield on interest earning assets 2.74% 3.81% 2.70% 2.48% 2.09% Economic interest expense $287,391 $276,237 $277,254 $261,056 $270,571 Average interest bearing liabilities $72,422,968 $72,032,600 $70,809,712 $62,049,474 $62,379,695 Average cost of interest bearing liabilities 1.59% 1.53% 1.57% 1.68% 1.73% Net interest spread 1.15% 2.28% 1.13% 0.80% 0.36% Net interest margin 1.47% 2.49% 1.40% 1.15% 0.79% 20