Attached files
| file | filename |
|---|---|
| EX-99.1 - EX-99.1 - Regional Management Corp. | d239589dex991.htm |
| EX-10.6 - EX-10.6 - Regional Management Corp. | d239589dex106.htm |
| EX-10.5 - EX-10.5 - Regional Management Corp. | d239589dex105.htm |
| EX-10.4 - EX-10.4 - Regional Management Corp. | d239589dex104.htm |
| EX-10.3 - EX-10.3 - Regional Management Corp. | d239589dex103.htm |
| EX-10.2 - EX-10.2 - Regional Management Corp. | d239589dex102.htm |
| EX-10.1 - EX-10.1 - Regional Management Corp. | d239589dex101.htm |
| 8-K - 8-K - Regional Management Corp. | d239589d8k.htm |
Exhibit 99.2
REGIONAL TM
MANAGEMENT
1Q 2017 Earnings Call Presentation
May 2, 2017
Safe Harbor Statement
REGIONAL TM
MANAGEMENT
This presentation and the responses to various questions contain forward-looking statements, which reflect our current views with respect
to, among other things, the Company’s operations and financial performance. You can identify these forward-looking statements by the use of words such as “outlook,” “believes,”
“expects,” “potential,” “continues,” “may,” “will,” “should,” “seeks,” “approximately,” “predicts,” “intends,” “plans,”
“estimates,” “anticipates” or the negative version of these words or other comparable words. Such forward-looking statements are subject to various risks and uncertainties. Accordingly,
there are or will be important factors that could cause actual outcomes or results to differ materially from those indicated in these statements. These factors include but are not limited to those described under “Risk Factors” in the
Company’s Annual Report on Form 10-K and Quarterly Reports on Form 10-Q. We cannot guarantee future events, results, actions, levels of activity, performance or
achievements. Neither the Company nor any of its respective agents, employees or advisors undertake any duty or obligation to supplement, amend, update or revise any forward-looking statement, whether as a
result of new information or otherwise.
The information and opinions contained in this document are provided as of the date of this presentation and are subject to
change without notice. This document has not been approved by any regulatory or supervisory authority.
2
1Q17 Highlights -
Strong Year-over-Year Portfolio Growth
REGIONAL TM
MANAGEMENT
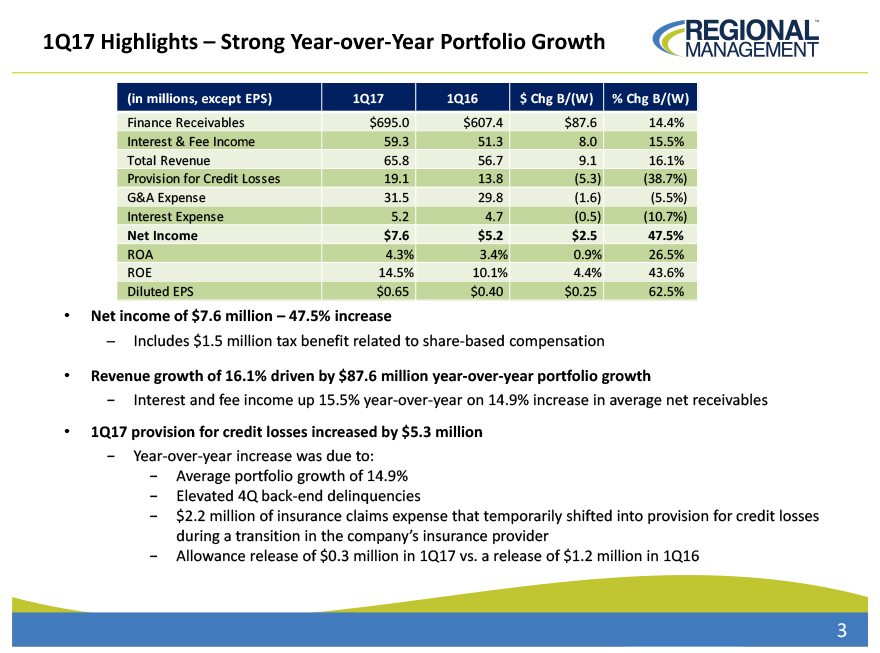
(in millions, except EPS)
1Q17 1Q16 $ Chg B/(W) % Chg B/(W)
Finance Receivables $695.0
$607.4 $87.6 14.4%
Interest & Fee Income
59.3 51.3 8.0
15.5%
Total Revenue
65.8 56.7 9.1 16.1%
Provision for Credit Losses
19.1 13.8 (5.3) (38.7%)
G&A Expense
31.5 29.8 (1.6) (5.5%)
Interest Expense
5.2 4.7 (0.5) (10.7%)
Net Income
$7.6 $5.2 $2.5 47.5%
ROA
4.3% 3.4% 0.9% 26.5%
ROE
14.5% 10.1% 4.4% 43.6%
Diluted EPS
$0.65 $0.40 $0.25 62.5%
Net income of $7.6 million - 47.5% increase
- Includes $1.5 million tax benefit related to share-based compensation
Revenue growth of 16.1% driven by $87.6 million
year-over-year portfolio growth
-
Interest and fee income up 15.5% year-over-year on 14.9% increase in average net receivables
1Q17 provision for credit losses increased by $5.3 million
- Year-over-year increase was due to:
- Average portfolio growth of 14.9%
-
Elevated 4Q back-end delinquencies
- $2.2 million of insurance claims expense that temporarily shifted into
provision for credit losses during a transition in the company’s insurance provider
- Allowance release of $0.3 million in 1Q17 vs. a release of $1.2 million
in 1Q16
3
Strategic Updates
REGIONAL TM
MANAGEMENT
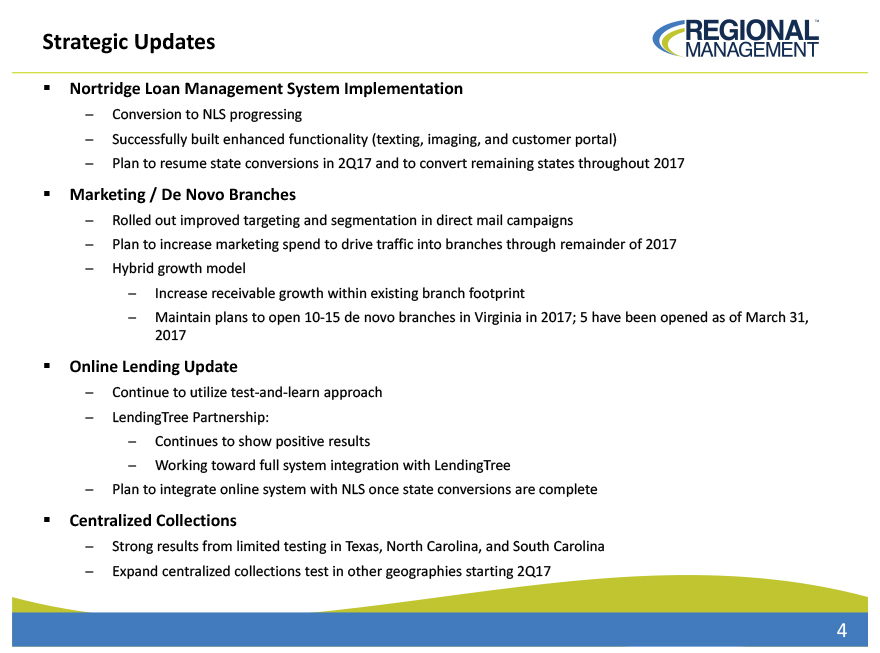
Nortridge Loan Management System Implementation
-
Conversion to NLS progressing
-
Successfully built enhanced functionality (texting, imaging, and customer portal)
-
Plan to resume state conversions in 2Q17 and to convert remaining states throughout 2017
Marketing
/ De Novo Branches
- Rolled out improved targeting and segmentation in direct mail campaigns
- Plan to increase marketing spend to drive traffic into branches through remainder of 2017
- Hybrid growth model
-
Increase receivable growth within existing branch footprint
-
Maintain plans to open 10-15 de novo branches in Virginia in 2017; 5 have been opened as of March 31,
2017
Online Lending Update
- Continue to utilize test-and-learn approach
- LendingTree Partnership:
- Continues to show positive results
- Working toward full system integration with LendingTree
- Plan to integrate online system with NLS once state conversions are complete
Centralized Collections
-
Strong results from limited testing in Texas, North Carolina, and South Carolina
-
Expand centralized collections test in other geographies starting 2Q17
4
Net Income Follows Seasonal Pattern of Ledger Growth
REGIONAL TM
MANAGEMENT
Millions
$750 $700 $650 $600 $550 $500 $450
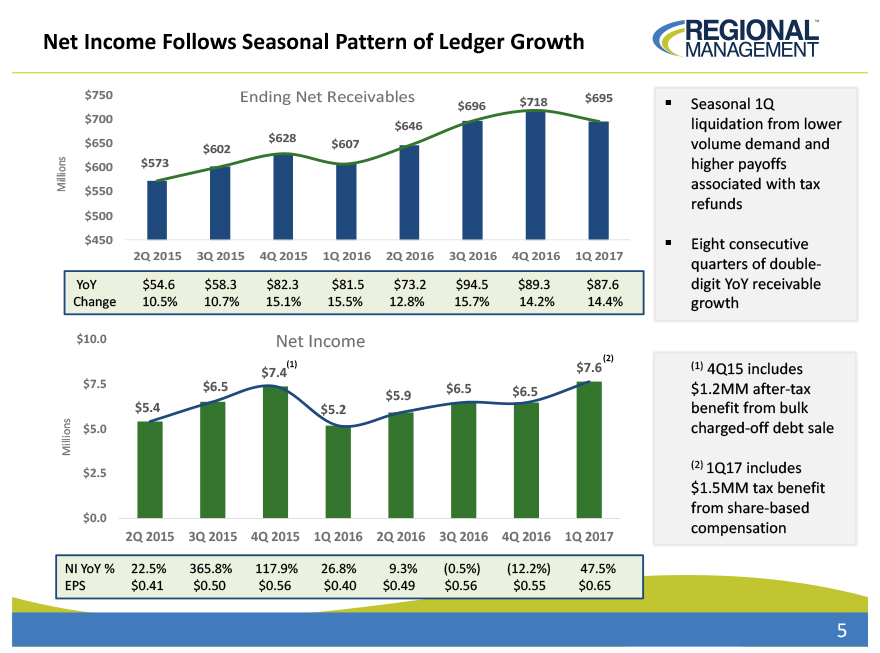
Ending Net Receivables $573 $602 $628 $607 $646 $696 $718 $695
2Q 2015 3Q 2015 4Q 2015 1Q 2016
2Q 2016 3Q 2016 4Q 2016 1Q 2017
YoY $54.6 $58.3 $82.3 $81.5 $73.2 $94.5 $89.3 $87.6
Change 10.5% 10.7% 15.1% 15.5% 12.8% 15.7% 14.2% 14.4%
Millions
$10.0 $7.5 $5.0 $2.5 $0.0
Net Income $5.4 $6.5 $7.4(1) $5.2 $5.9 $6.5 $6.5 $7.6 (2)
2Q 2015 3Q 2015 4Q 2015 1Q 2016 2Q 2016 3Q 2016 4Q 2016 1Q 2017
NI YoY %
22.5% 365.8% 117.9% 26.8% 9.3% (0.5%) (12.2%) 47.5%
EPS $0.41 $0.50 $0.56 $0.40 $0.49 $0.56 $0.55 $0.65
Seasonal 1Q liquidation from lower volume demand and higher payoffs associated with tax refunds
Eight consecutive quarters of double-digit YoY receivable growth
(1) 4Q15 includes
$1.2MM after-tax benefit from bulk charged-off debt sale
(2) 1Q17 includes
$1.5MM tax benefit from share-based compensation
5
Product Category Trends REGIONAL MANAGEMENT TM
in millions % Chg I/(D)
Ending Net Receivables 2Q15 3Q15 4Q15 1Q16 2Q16 3Q16 4Q16 1Q17 vs.
4Q16 vs. 1Q16 vs. 4Q16 vs. 1Q16
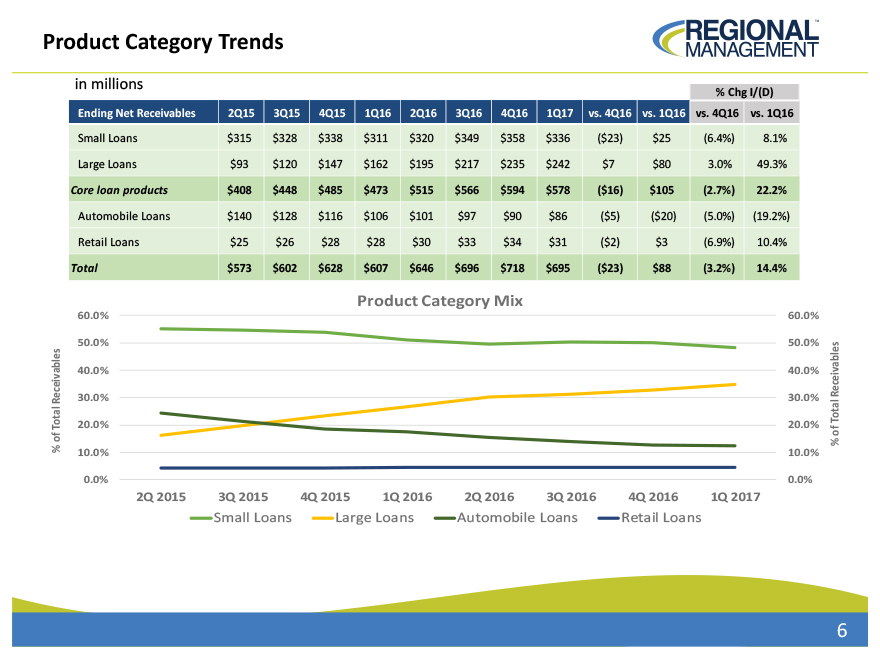
Small Loans $315 $328 $338 $311 $320 $349 $358 $336 ($23) $25 (6.4%) 8.1%
Large Loans $93 $120 $147 $162 $195 $217 $235 $242 $7 $80 3.0% 49.3%
Core loan products $408
$448 $485 $473 $515 $566 $594 $578 ($16) $105 (2.7%) 22.2%
Automobile Loans $140 $128 $116 $106 $101 $97 $90 $86 ($5) ($20) (5.0%) (19.2%)
Retail Loans $25 $26 $28 $28 $30 $33 $34 $31 ($2) $3 (6.9%) 10.4%
Total $573 $602 $628 $607
$646 $696 $718 $695 ($23) $88 (3.2%) 14.4%
Product Category Mix
% of Total
Receivables
60.0% 60.0%
50.0% 50.0%
40.0% 40.0%
30.0% 30.0%
20.0% 20.0%
10.0% 10.0%
0.0% 0.0%
% of Total Receivables
2Q 20153Q 2015 4Q 2015 1Q 2016 2Q 2016 3Q 2016 4Q 2016 1Q 2017
Small Loans Large Loans
Automobile Loans Retail Loans
6
Revenue Driven by Strong Year-over-Year Portfolio Growth
REGIONAL MANAGEMENT TM
Total Revenue
Millions
$68.0 $63.0 $58.0 $53.0 $48.0 $43.0
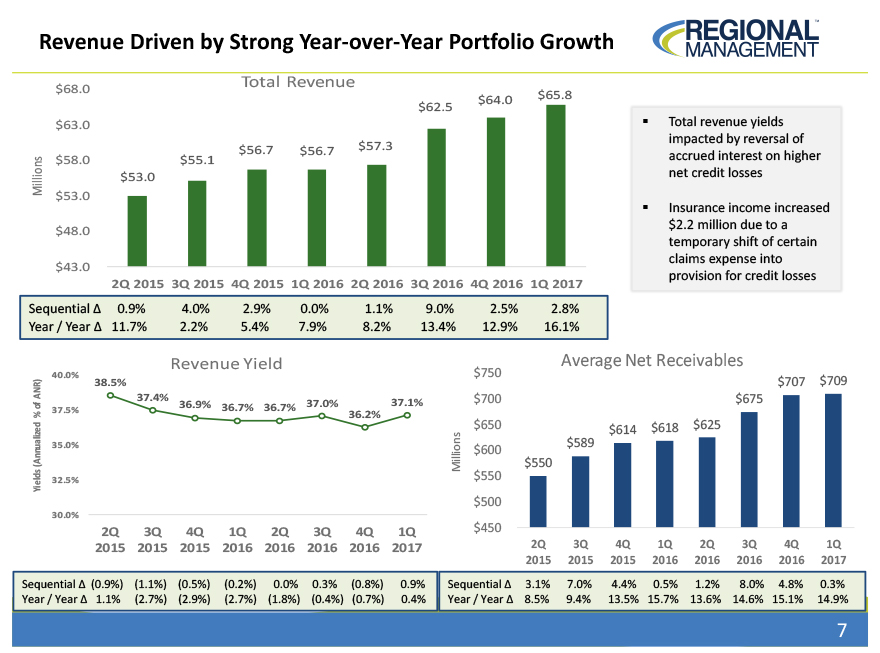
$53.0 $55.1 $56.7 $56.7 $57.3 $62.5 $64.0 $65.8
2Q 2015 3Q 2015 4Q 2015 1Q 2016 2Q 2016 3Q
2016 4Q 2016 1Q 2017
Sequential 0.9% 4.0% 2.9% 0.0% 1.1%9.0%2.5%2.8%
Year /
Year 11.7% 2.2% 5.4% 7.9% 8.2%13.4%12.9%16.1%
Total revenue yields impacted by reversal of accrued interest on higher net credit losses
Insurance income increased $2.2 million due to a temporary shift of certain claims expense into provision for credit losses
Revenue Yield
Yields (Annualized % of ANR)
40.0% 37.5% 35.0% 32.5% 30.0%
38.5% 37.4% 36.9% 36.7% 36.7% 37.0% 36.2% 37.1%
2Q 3Q 4Q 1Q 2Q 3Q 4Q 1Q
2015 2015 2015 2016 2016 2016 2016 2017
Sequential (0.9%) (1.1%) (0.5%) (0.2%) 0.0% 0.3% (0.8%) 0.9%
Year / Year 1.1% (2.7%) (2.9%)
(2.7%) (1.8%) (0.4%) (0.7%) 0.4%
Average Net Receivables
Millions $750 $700
$650 $600 $550 $500 $450
$550 $589 $614 $618 $625 $675 $707 $709
2Q 3Q 4Q 1Q
2Q 3Q 4Q 1Q
2015 2015 2015 2016 2016 2016 2016 2017
Sequential 3.1% 7.0% 4.4%
0.5% 1.2% 8.0% 4.8% 0.3%
Year / Year 8.5% 9.4% 13.5% 15.7% 13.6% 14.6% 15.1% 14.9%
7
Interest & Fee Income Driven by Strong Portfolio Growth
REGIONAL TM
MANAGEMENT
Interest and Fee Income
Millions
$65.0 $60.0 $55.0 $50.0 $45.0 $40.0
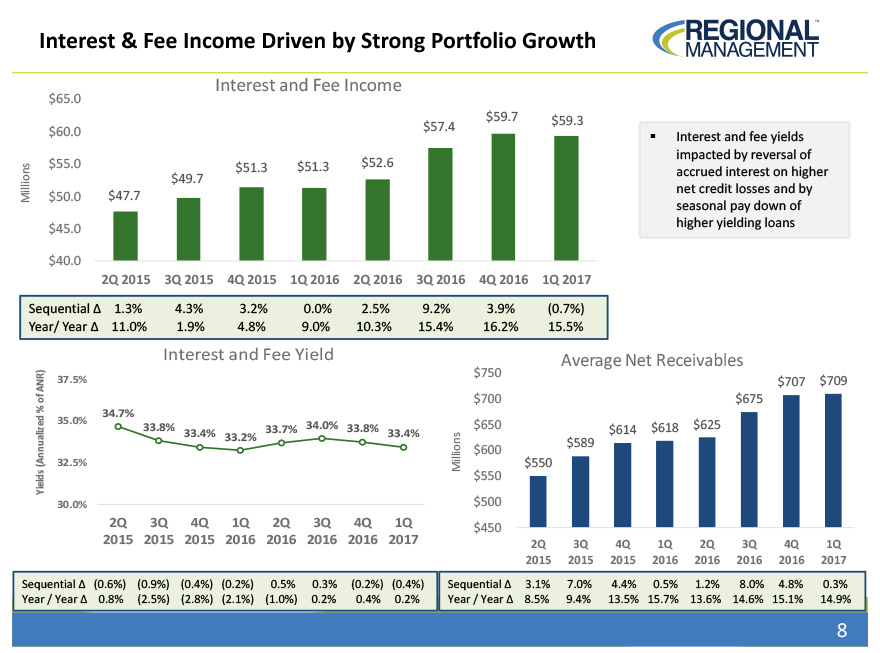
$47.7 $49.7 $51.3 $51.3 $52.6 $57.4 $59.7 $59.3
2Q 2015 3Q 2015 4Q 2015 1Q 2016 2Q 2016 3Q 2016 4Q 2016 1Q 2017
Sequential
1.3% 4.3% 3.2% 0.0% 2.5% 9.2% 3.9% (0.7%)
Year/ Year 11.0% 1.9% 4.8% 9.0% 10.3% 15.4% 16.2% 15.5%
Interest and fee yields impacted by reversal of accrued interest on higher net credit losses and by seasonal pay down of higher yielding loans
Interest and Fee Yield
Yields (Annualized % of ANR)
37.5% 35.0% 32.5% 30.0%
34.7% 33.8% 33.4% 33.2% 33.7% 34.0% 33.8% 33.4%
2Q 2015 3Q 2015 4Q 2015 1Q 2016 2Q 2016 3Q 2016 4Q 2016 1Q 2017
Sequential (0.6%) (0.9%)
(0.4%) (0.2%) 0.5% 0.3% (0.2%) (0.4%)
Year / Year 0.8% (2.5%) (2.8%) (2.1%) (1.0%) 0.2% 0.4% 0.2%
Average Net Receivables
Millions
$750 $700 $650 $600 $550 $500 $450
$550 $589 $614 $618 $625 $675 $707 $709
2Q 2015 3Q 2015 4Q 2015 1Q 2016 2Q 2016 3Q 2016 4Q 2016 1Q 2017
Sequential 3.1% 7.0% 4.4% 0.5%
1.2% 8.0% 4.8% 0.3%
Year / Year 8.5% 9.4% 13.5% 15.7% 13.6% 14.6% 15.1% 14.9%
8
Stabilizing Credit – Provision Consistent with Portfolio Growth
REGIONAL TM
MANAGEMENT
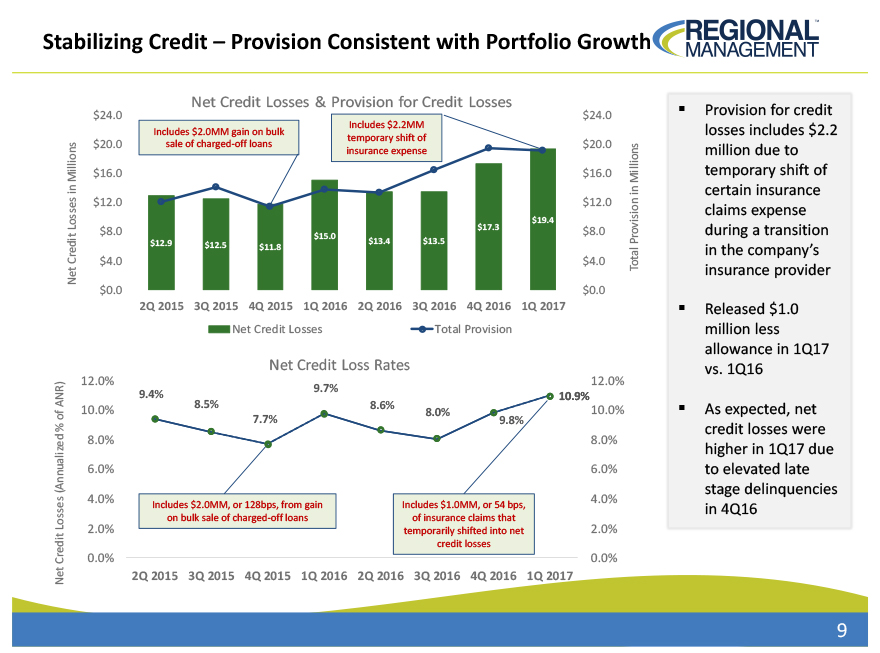
Net Credit Losses & Provision for Credit Losses
Net Credit Losses in Millions
$24.0 $20.0 $16.0 $12.0 $8.0 $4.0 $0.0
$24.0 $20.0 $16.0 $12.0 $8.0 $4.0 $0.0
Includes $2.0MM gain on bulk sale of charged-off loans
Includes $2.2MM temporary shift of
insurance expense
$12.9 $12.5 $11.8 $15.0 $13.4 $13.5 $17.3 $19.4
2Q 2015 3Q
2015 4Q 2015 1Q 2016 2Q 2016 3Q 2016 4Q 2016 1Q 2017
Total Provision in Millions
Net Credit Losses Total Provision
Net Credit Loss Rates
Net Credit Losses (Annualized % of ANR)
12.0% 10.0% 8.0% 6.0% 4.0% 2.0% 0.0%
12.0% 10.0% 8.0% 6.0% 4.0% 2.0% 0.0%
9.4% 8.5% 7.7% 9.7% 8.6% 8.0% 9.8% 10.9%
Includes $2.0MM, or 128bps, from gain on bulk sale of charged-off loans
Includes $1.0MM, or 54
bps, of insurance claims that temporarily shifted into net credit losses
2Q 2015 3Q 2015 4Q 2015 1Q 2016 2Q 2016 3Q 2016 4Q 2016 1Q 2017
Provision for credit losses includes $2.2 million due to temporary shift of certain insurance claims expense during a transition in the company’s insurance provider
Released $1.0 million less allowance in 1Q17 vs. 1Q16
As expected, net credit
losses were higher in 1Q17 due to elevated late stage delinquencies in 4Q16
9
Seasonal Pattern of Delinquency
REGIONAL TM
MANAGEMENT
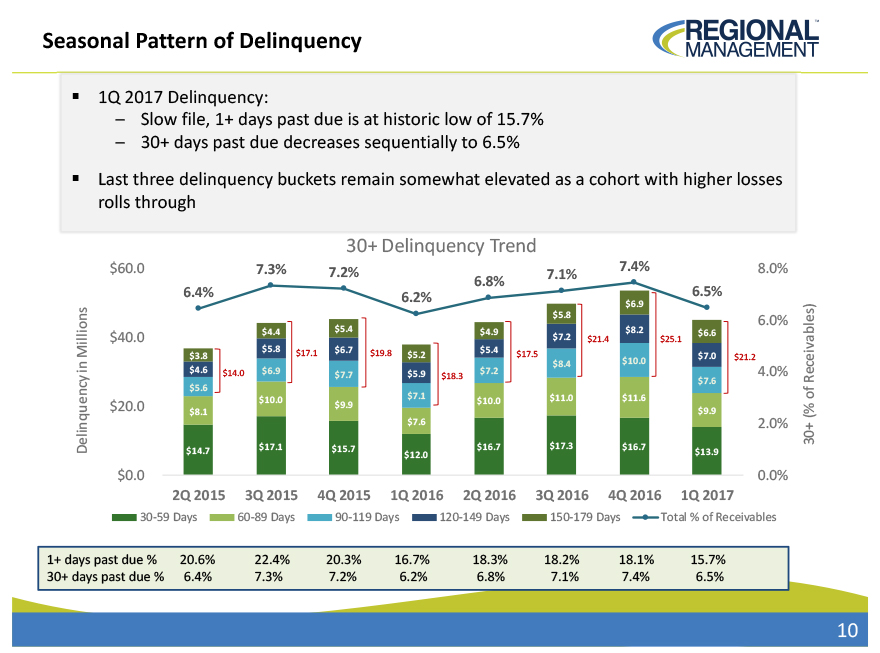
1Q 2017 Delinquency:
- Slow file, 1+ days past due is at historic low of 15.7%
- 30+ days past due decreases sequentially to 6.5%
Last three delinquency buckets remain
somewhat elevated as a cohort with higher losses rolls through
30+ Delinquency Trend
Delinquency in Millions
$60.0
7.3%
7.2%
7.1%
7.4%
8.0%
6.8%
6.4%
6.2%
6.5%
$6.9
$5.8
6.0%
$4.4
$5.4
$4.9
$8.2
$6.6
$40.0
$7.2 $21.4
$25.1
$3.8
$5.8 $17.1
$6.7 $19.8 $5.2
$5.4
$17.5
$7.0
$21.2
$8.4
$10.0
$4.6 $14.0 $6.9
$7.7
$5.9
$18.3
$7.2
4.0%
$7.6
$5.6
$10.0
$7.1
$10.0
$11.0
$11.6
$20.0
$8.1
$9.9
$9.9
$7.6
2.0%
$14.7
$17.1
$15.7
$16.7
$17.3
$16.7
$13.9
$12.0
$0.0
0.0%
2Q 2015
3Q 2015
4Q 2015
1Q 2016
2Q 2016
3Q 2016
4Q 2016 1Q 2017
30-59 Days
60-89 Days
90-119 Days
120-149 Days
150-179 Days
Total % of Receivables
1+ days past due % 20.6% 22.4% 20.3% 16.7% 18.3% 18.2% 18.1% 15.7%
30+ days
past due % 6.4% 7.3% 7.2% 6.2% 6.8% 7.1% 7.4% 6.5%
30+ (% of Receivables)
10
Continuing to Manage Expenses Closely
REGIONAL TM
MANAGEMENT
Millions
$50.0
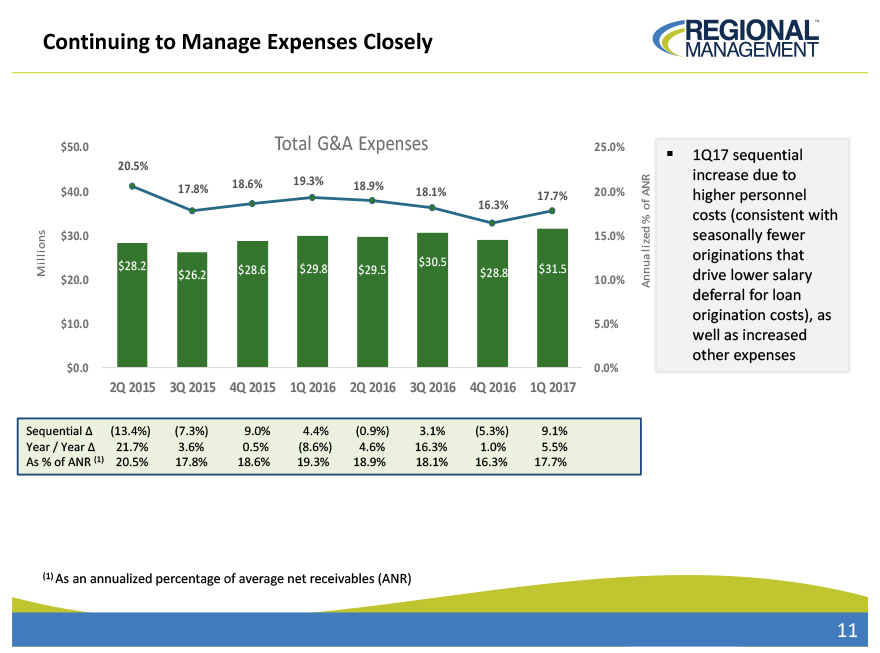
Total G&A Expenses
25.0%
20.5%
$40.0
17.8%
18.6%
19.3%
18.9%
18.1%
20.0%
17.7%
16.3%
$30.0
15.0%
$28.2
$29.8
$29.5
$30.5
$31.5
$26.2
$28.6
$28.8
$20.0
10.0%
$10.0
5.0%
$0.0
0.0%
2Q 2015
3Q 2015
4Q 2015
1Q 2016
2Q 2016
3Q 2016
4Q 2016
1Q 2017
Annualized % of ANR
Sequential
(13.4%)
(7.3%)
9.0%
4.4% (0.9%)
3.1%
(5.3%)
9.1%
Year / Year
21.7%
3.6%
0.5%
(8.6%) 4.6%
16.3%
1.0%
5.5%
As % of ANR (1)
20.5%
17.8%
18.6%
19.3% 18.9%
18.1%
16.3% 17.7%
1Q17 sequential increase due to higher personnel costs (consistent with seasonally fewer originations that drive lower salary deferral for loan origination costs), as well as
increased other expenses
(1) As an annualized percentage of average net receivables (ANR)
11