Attached files
| file | filename |
|---|---|
| 8-K - 8-K - FIRST BANCORP /NC/ | c465658_8k.htm |
| EX-99.1 - EXHIBIT 99.1 - FIRST BANCORP /NC/ | c465658_ex99-1.htm |
| EX-2.1 - EXHIBIT 2.1 - FIRST BANCORP /NC/ | c465658_ex2-1.htm |
Exhibit 99.2

First Bancorp Acquisition of ASB Bancorp, Inc. May 1st, 2017 ASBB

Forward - Looking Statements Forward Looking Statements This presentation contains certain forward looking statements within the meaning of the Private Securities Litigation Reform Act of 1995 giving First Bancorp's and ASB Bancorp's expectations or predictions of future financial or business performance or conditions. Forward - looking statements are typically identified by words such as "believe," "expect," "anticipate," "intend," "target," "estimate," "continue," "positions," "prospects" or "potential," by future conditional verb s s uch as "will," "would," "should," "could" or "may", or by variations of such words or by similar expressions. Such forward - looking statements include, but are not limited to, statements about the benefits of the combination of First Bancorp and ASB Bancorp, including future financial and operating results, expected cost savings, expected impact on future e arn ings, the combined company's plans, objectives, expectations and intentions and other statements that are not historical facts. These forward - looking statements are subject to numerous assumptions, risks and uncertainties which change over time. Forward - looking statements speak only as of the date they are made and you are cautioned not to place un due reliance on any forward - looking statements. We assume no duty to update forward - looking statements. In addition to factors previously disclosed in First Bancorp’s and ASB Bancorp's reports filed with the SEC, the following fa ct ors among others, could cause actual results to differ materially from forward - looking statements: ability to obtain regulatory approvals and meet other closing conditions to the merg er, including approval by ASB Bancorp’s shareholders, on the expected terms and schedule; delay in closing the merger; difficulties and delays in integrating the Fir st Bancorp and ASB Bancorp businesses or fully realizing cost savings and other benefits; business disruption following the proposed transaction; changes in asset quality and credit ris k; the inability to sustain revenue and earnings growth; changes in interest rates and capital markets; inflation; customer borrowing, repayment, investment and deposit practices; th e i ntroduction, withdrawal, success and timing of business initiatives; competitive conditions; the inability to realize cost savings or revenues or to implement integration p lan s and other consequences associated with mergers, acquisitions and divestitures; economic conditions; the reaction to the transaction of the companies' customers, employees an d c ounterparties; and the impact, extent and timing of technological changes, capital management activities, and other actions of the Board of Governors of the Federal Reserve and leg islative and regulatory actions and reforms. Non - GAAP Measures Statements included in this presentation include non - GAAP measures and should be read along with First Bancorp’s News Release of April 27, 2017 reporting our operating results as of and for the quarter ended March 31, 2017, which provides a reconciliation of non - GAAP measures to GAAP measures. Management believes that these non - GAAP measures provide additional useful information that allows readers to evaluate the ongoing performance of the company . Non - GAAP measures should not be considered as an alternative to any measure of performance or financial condition as promulgated under GAAP, and investors should consider the company’s performance and financial condition as reported under GAAP and all other relevant information when assessing the performance or financial condition of the company . Non - GAAP measures have limitations as analytical tools, and investors should not consider them in isolation or as a substitute for analysis of the company’s results or financial condition as reported under GAAP . 2

3 Opportunity Overview & Rationale Branch Map Strategic Rationale ASBB : 13 branches FBNC : 96 branches » Create the premier independent North Carolina community bank with over $5bn in assets Top 3 position in attractive Asheville market Community focus and relationships Combined entity is well - positioned to significantly benefit from market disruption (SSB / PSTB; TOWN / PAG; PNFP / BNCN; FNB / YDKN; CBF / COB) » Financially compelling Mid - single digit EPS accretion Limited TBV dilution with earnback of ~2.5 years Improves ROA profile » Low risk Overlapping market presence Long management history in Asheville Internal and external detailed credit review ASBB CEO remains with combined company » Strong cultural fit ASBB Highlights Assets ($mm): $803.5 Loans ($mm): $605.8 Deposits ($mm): $682.1 Branches: 13 MRQ Core ROA 0.93% NPAs / Assets 0.72% TCE / TA 11.67% Source: SNL Financial, Company reports.

4 NC Community Bank (1) State Market Share Source: SNL Financial. Deposit market share data as of June, 2016. (1) Defined as NC - headquartered banks with less than $10 bn total assets, pro forma for pending acquisitions. Excludes mutual / co - ops. » First Bancorp is the largest independent North Carolina community bank, with over $5bn in assets pro forma for the acquisition of ASB Bancorp Significant opportunities to attract talented bankers Excellent customer service proposition and competitive product offerings Presence in North Carolina’s most attractive markets NC Community Banking RankInstitution Number of NC Branches 2016 NC Total Deposits ($mm) 2016 NC Market Share (%) MRQ Total Assets ($mm) 1Pro Forma 102 $3,951 1.14% $5,245 First Bancorp 89 3,307 0.95 4,442 2Southern BancShares 51 1,634 0.47 2,513 3Fidelity BancShares 55 1,515 0.44 1,419 4HomeTrust Bancshares 18 1,214 0.35 3,165 5Peoples Bancorp of NC 20 846 0.24 1,110 6First South Bancorp 28 826 0.24 1,039 7Entegra Financial 13 778 0.22 1,385 8North State Bancorp 7 711 0.20 753 9Select Bancorp 13 662 0.19 847 ASB Bancorp 13 644 0.19 803 10Four Oaks Fincorp 13 554 0.16 737
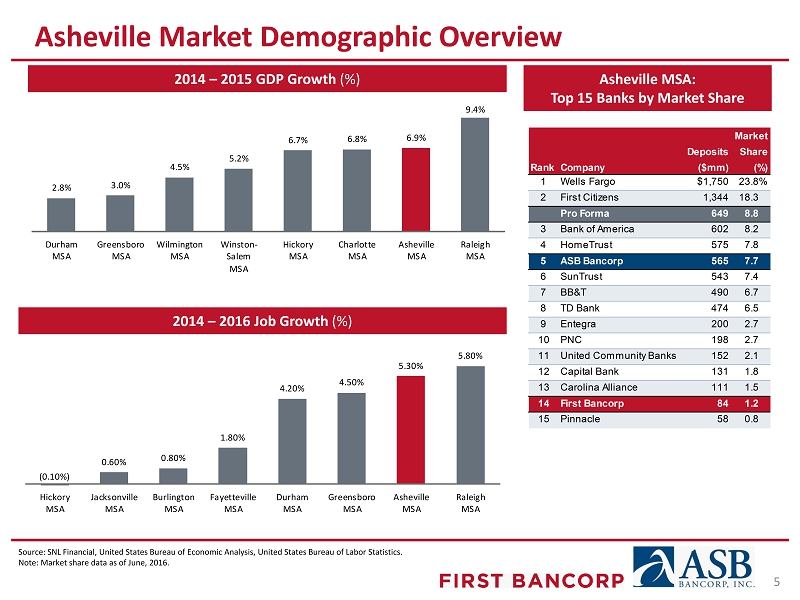
5 Asheville Market Demographic Overview 2014 – 2015 GDP Growth (%) Asheville MSA: Top 15 Banks by Market Share 2014 – 2016 Job Growth (%) Market Deposits Share Rank Company ($mm) (%) 1 Wells Fargo $1,750 23.8% 2 First Citizens 1,344 18.3 Pro Forma 649 8.8 3 Bank of America 602 8.2 4 HomeTrust 575 7.8 5 ASB Bancorp 565 7.7 6 SunTrust 543 7.4 7 BB&T 490 6.7 8 TD Bank 474 6.5 9 Entegra 200 2.7 10 PNC 198 2.7 11 United Community Banks 152 2.1 12 Capital Bank 131 1.8 13 Carolina Alliance 111 1.5 14 First Bancorp 84 1.2 15 Pinnacle 58 0.8 2.8% 3.0% 4.5% 5.2% 6.7% 6.8% 6.9% 9.4% Durham MSA Greensboro MSA Wilmington MSA Winston- Salem MSA Hickory MSA Charlotte MSA Asheville MSA Raleigh MSA (0.10%) 0.60% 0.80% 1.80% 4.20% 4.50% 5.30% 5.80% Hickory MSA Jacksonville MSA Burlington MSA Fayetteville MSA Durham MSA Greensboro MSA Asheville MSA Raleigh MSA Source: SNL Financial, United States Bureau of Economic Analysis, United States Bureau of Labor Statistics. Note: Market share data as of June, 2016.

6 Asheville MSA – Economic Snapshot Source: SNL Financial, Asheville Chamber of Commerce, Buncombe County Tourism Development Authority 2015 Annual Report, United States Bureau of Labor Statistics. Overview of Asheville MSA Diverse Presence of Industries & Companies » Small businesses drive the local economy: 96% of businesses in the Asheville MSA have fewer than 50 employees » Six Asheville companies were named to Inc. 5000’s list of the fastest growing companies in the United States in 2014 and have remained on it since » Southern Business & Development ranked Asheville one of the best mid - markets in the South for companies to relocate to in 2016 » Health Services and Private Education sectors make up the largest percentage of total employment in the Asheville metro region Health has been the fastest growing sector (rate of 62.5% since 2000) » Tourism is booming again An estimated 9.8 million visitors spent a total of $1.7 bn in 2014, an increase of 4.6%, respectively, from 2013 Construction 4% Manufacturing 11% Retail Trade 14% Transportation and Utilities 3% Wholesale 3% Information 1% Financial Activities 3% Professional & Business Service 11% Health Services & Private Education 21% Leisure & Hospitality 15% Government 14% Top Universities and Corporate Leaders
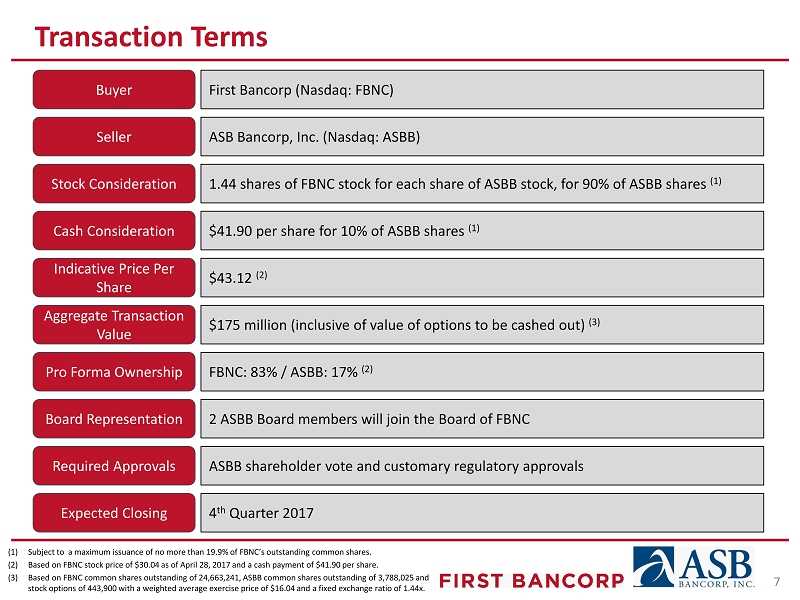
Transaction Terms First Bancorp (Nasdaq: FBNC) Seller ASB Bancorp, Inc. (Nasdaq: ASBB) Stock Consideration 1.44 shares of FBNC stock for each share of ASBB stock, for 90% of ASBB shares (1) Aggregate Transaction Value $175 million (inclusive of value of options to be cashed out) (3) Pro Forma Ownership FBNC: 83% / ASBB: 17% (2) Board Representation 2 ASBB Board members will join the Board of FBNC Required Approvals ASBB shareholder vote and customary regulatory approvals 4 th Quarter 2017 Expected Closing Buyer 7 Indicative Price Per Share $43.12 (2) Cash Consideration $41.90 per share for 10% of ASBB shares (1) (1) Subject to a maximum issuance of no more than 19.9% of FBNC’s outstanding common shares. (2) Based on FBNC stock price of $30.04 as of April 28, 2017 and a cash payment of $41.90 per share. (3) Based on FBNC common shares outstanding of 24,663,241, ASBB common shares outstanding of 3,788,025 and stock options of 443,900 with a weighted average exercise price of $16.04 and a fixed exchange ratio of 1.44x.

(1) Based on ASBB’s tangible book value per share of $24.75 as of 3/31/17 (2) F or the quarter ended 3/31/17 (3) Based on ASBB’s closing price of $35.04 on April 28, 2017 and indicative price per share of $43.12. Transaction Multiples 8 Price / MRQ Annualized EPS 21.6x (2) Price / TBV 174% (1) Market Premium 23% (3)

9 Transaction Assumptions and Financial Impact Assumptions Financial Impact Pro Forma Capital Ratios at Close » Loan credit mark of $7.1 million, or 1.2% of gross loans Based on comprehensive credit review performed by FBNC management and third party loan review firm » Cost savings of ~40% of ASBB noninterest expense 75% realized in 2018 and 100% thereafter » Merger related charges of $ 16 million pre - tax » Projected close Q4 ‘17 » Pro forma company over $5 billion in assets » Mid - single digit GAAP EPS accretion » Tangible book value dilution of approximately 1% » T angible book value earnback period of approximately 2.5 years » IRR of approximately 19% » TCE / TA: 8.3% » Tier 1 Leverage Ratio: 9.8% » CET1 Ratio: 11.1% » Total Capital Ratio: 13.0%

SHAREHOLDERS » Community banking model with a focus on serving clients » Increased branch presence in appealing North Carolina markets » Ability to provide enhanced products and services » Community bank market leader in North Carolina Benefits to the Combined Stakeholders » Strategically and financially attractive transaction » Successful Board and management team with strong community ties » Improved liquidity and dividend for ASBB shareholders » Opportunity for increased shareholder value for both companies » Similar cultures and markets allows for a simplified employee transition period » Larger organization creates opportunities for career advancement » Long - term dedicated management teams » Larger size increases public identity and recruiting capability CUSTOMERS EMPLOYEES 10

APPENDIX

North Carolina’s Most Populous Markets Source: Carolina Demography Asheville Charlotte Raleigh Winston - Salem Greensboro Fayetteville Greenville Less than 50 50 - 99 100 - 249 250 - 499 500 - 999 1,000 - 1,999 2,000 units or more Housing Units per Square Mile 12

FBNC ASBB Pro Forma Loan Portfolio Amount % of Total Loan Portfolio Amount % of Total Loan Portfolio Amount % of Total C&I $363,700 11.1% C&I $24,832 4.1% C&I $388,532 10.0% Owner-Occupied CRE 644,600 19.6 Owner-Occupied CRE 78,375 12.9 Owner-Occupied CRE 722,975 18.6 Non Owner-Occupied CRE 691,196 21.0 Non Owner-Occupied CRE 187,404 30.9 Non Owner-Occupied CRE 878,600 22.6 Residential Real Estate 806,660 24.5 Residential Real Estate 183,470 30.3 Residential Real Estate 990,130 25.4 C&D 424,539 12.9 C&D 46,359 7.7 C&D 470,898 12.1 Consumer & Other 359,364 10.9 Consumer & Other 85,558 14.1 Consumer & Other 444,922 11.4 Gross Loans & Leases $3,290,059 100.0% Gross Loans & Leases $605,998 100.0% Gross Loans & Leases $3,896,057 100.0% Yield on Total Loans 4.7% Yield on Total Loans 4.2% C&I 11% Owner - Occupied CRE 20% Non Owner - Occupied CRE 21% Residential Real Estate 24% C&D 13% Consumer & Other 11% C&I 4% Owner - Occupied CRE 13% Non Owner - Occupied CRE 31% Residential Real Estate 30% C&D 8% Consumer & Other 14% C&I 10% Owner - Occupied CRE 19% Non Owner - Occupied CRE 23% Residential Real Estate 25% C&D 12% Consumer & Other 11% Source : Call Reports and internal reports, as of March 31, 2017 Dollars in thousands Data as of or for the three months ended March 31, 2017 Excludes purchase accounting adjustments Pro Forma Loan Portfolio – Comparable Profile 13

Source: Call Reports and internal reports, as of March 31, 2017 Dollars in thousands Data as of or for the three months ended March 31, 2017 Excludes purchase accounting adjustments Pro Forma Deposit Portfolio – Comparable Profile 14 FBNC ASBB Pro Forma Deposit Portfolio Amount % of Total Deposit Portfolio Amount % of Total Deposit Portfolio Amount % of Total Non-Interest Bearing $958,175 26.4% Non-Interest Bearing $133,201 19.5% Non-Interest Bearing $1,091,376 25.3% Other Transaction Accts. 694,898 19.1 Other Transaction Accts. 167,362 24.5 Other Transaction Accts. 862,260 20.0 MMDA & Savings 1,228,027 33.8 MMDA & Savings 240,546 35.3 MMDA & Savings 1,468,573 34.1 Certificates of Deposit 748,070 20.6 Certificates of Deposit 140,960 20.7 Certificates of Deposit 889,030 20.6 Total Deposits $3,629,170 100.0% Total Deposits $682,069 100.0% Total Deposits $4,311,239 100.0% Cost of Deposits 0.18% Cost of Deposits 0.24% Non - Interest Bearing 26% Other Transaction Accts. 19% MMDA & Savings 34% Certificates of Deposit 21% Non - Interest Bearing 19% Other Transaction Accts. 25% MMDA & Savings 35% Certificates of Deposit 21% Non - Interest Bearing 25% Other Transaction Accts. 20% MMDA & Savings 34% Certificates of Deposit 21%

Additional Information About the Proposed Transaction Additional Information About the Proposed Transaction and Where to Find It This communication is being made in respect of the proposed transaction involving First Bancorp and ASB Bancorp, Inc. This material is not a solicitation of any vote or approval of ASB Bancorp, Inc.’s shareholders and is not a substitute for the proxy statement/prospectus or any other documents which First Bancorp and ASB Bancorp, Inc. may send in connection with the proposed merger . This communication does not constitute an offer to sell or the solicitation of an offer to buy any securities. In connection with the proposed transaction, First Bancorp intends to file with the SEC a Registration Statement on Form S - 4 tha t will include a proxy statement of ASB Bancorp, Inc. and a prospectus of First Bancorp, as well as other relevant documents concerning the pr opo sed transaction. Investors and security holders are also urged to carefully review and consider each of First Bancorp’s and ASB Ban corp, Inc.’s public filings with the SEC, including but not limited to their Annual Reports on Form 10 - K, their proxy statements, their Curre nt Reports on Form 8 - K and their Quarterly Reports on Form 10 - Q. ASB Bancorp, Inc. will mail the joint proxy statement/prospectus to the shar eholders of ASB Bancorp, Inc. BEFORE MAKING ANY VOTING OR INVESTMENT DECISIONS, INVESTORS AND SHAREHOLDERS OF ASB BANCORP, INC. ARE URGED TO CAREFULLY READ THE ENTIRE REGISTRATION STATEMENT AND PROXY STATEMENT/PROSPECTUS REGARDING THE PROPOSED MERGER WHEN IT BECOMES AVAILABLE AND ANY OTHER RELEVANT DOCUMENTS FILED WITH THE SEC, AS WELL AS ANY AMENDMENTS OR SUPPLEMENTS TO THOSE DOCUMENTS, BECAUSE THEY WILL CONTAIN IMPORTANT INFORMATION ABOUT THE PROPOSED TRANSACTION. Investors and security holders may obtain a free copy of the proxy statement/prospectus (when available) and other filings co nta ining information about First Bancorp and ASB Bancorp, Inc. at the SEC’s website at www.sec.gov. Investors and security holders may al so obtain free copies of the documents filed with the SEC by First Bancorp on its website at www.localfirstbank.com and by ASB Bancorp, In c. at www.ashevillesavingsbank.com. First Bancorp, ASB Bancorp, Inc. and certain of their respective directors and executive officers, under the SEC’s rules, may be deemed to be participants in the solicitation of proxies of ASB Bancorp, Inc.’s shareholders in connection with the proposed transaction. Information about the directors and executive officers of First Bancorp and their ownership of First Bancorp common stock is set forth in the p rox y statement for First Bancorp’s 2017 Annual Meeting of Shareholders, as filed with the SEC on Schedule 14A on March 27, 2017. Information about the directors and executive officers of ASB Bancorp, Inc. and their ownership of ASB Bancorp, Inc.’s common stock is set forth in the proxy statement for ASB Bancorp, Inc.’s 2017 Annual Meeting of Shareholders, as filed with the SEC on a Schedule 14A on April 5, 2017. Additional information regarding the interests of those participants and other persons who may be deemed participants in the transaction ma y be obtained by reading the proxy statement/prospectus regarding the proposed transaction when it becomes available. Free copies of this document may be obtained as described in the preceding paragraph. 15