Attached files
| file | filename |
|---|---|
| 8-K - FORM 8-K - CMS ENERGY CORP | d387691d8k.htm |
Exhibit 99.1

First Quarter 2017 Results & Outlook May 1, 2017 PEOPLE PLANET PROFIT
CMS Energy: World Class Performance Delivering Hometown Service This presentation is made as of the date hereof and contains “forward-looking statements” as defined in Rule 3b-6 of the Securities Exchange Act of 1934, Rule 175 of the Securities Act of 1933, and relevant legal decisions. The forward-looking statements are subject to risks and uncertainties. All forward-looking statements should be considered in the context of the risk and other factors detailed from time to time in CMS Energy’s and Consumers Energy’s Securities and Exchange Commission filings. Forward-looking statements should be read in conjunction with “FORWARD-LOOKING STATEMENTS AND INFORMATION” and “RISK FACTORS” sections of CMS Energy’s and Consumers Energy’s Form 10-K for the year ended December 31, 2016 and as updated in subsequent 10-Qs. CMS Energy’s and Consumers Energy’s “FORWARD-LOOKING STATEMENTS AND INFORMATION” and “RISK FACTORS” sections are incorporated herein by reference and discuss important factors that could cause CMS Energy’s and Consumers Energy’s results to differ materially from those anticipated in such statements. CMS Energy and Consumers Energy undertake no obligation to update any of the information presented herein to reflect facts, events or circumstances after the date hereof. The presentation also includes non-GAAP measures when describing CMS Energy’s results of operations and financial performance. A reconciliation of each of these measures to the most directly comparable GAAP measure is included in the appendix and posted on our website at www.cmsenergy.com. CMS Energy provides historical financial results on both a reported (GAAP) and adjusted (non-GAAP) basis and provides forward-looking guidance on an adjusted basis. Adjustments could include items such as discontinued operations, asset sales, impairments, restructuring costs, regulatory items from prior years, or other items. Management views adjusted earnings as a key measure of the company’s present operating financial performance and uses adjusted earnings for external communications with analysts and investors. Internally, the company uses adjusted earnings to measure and assess performance. Because the company is not able to estimate the impact of specific line items, which have the potential to significantly impact, favorably or unfavorably, the company’s reported earnings in future periods, the company is not providing reported earnings guidance nor is it providing a reconciliation for the comparable future period earnings. The adjusted earnings should be considered supplemental information to assist in understanding our business results, rather than as a substitute for the reported earnings. Investors and others should note that CMS Energy routinely posts important information on its website and considers the Investor Relations section, www.cmsenergy.com/investor-relations, a channel of distribution. 1
Agenda First Quarter Results People, Planet, Profit PEOPLE PLANET PROFIT Performance — Consumers Energy Way Patti Poppe President & CEO Financial Results and Outlook Tom Webb Executive VP & CFO 2
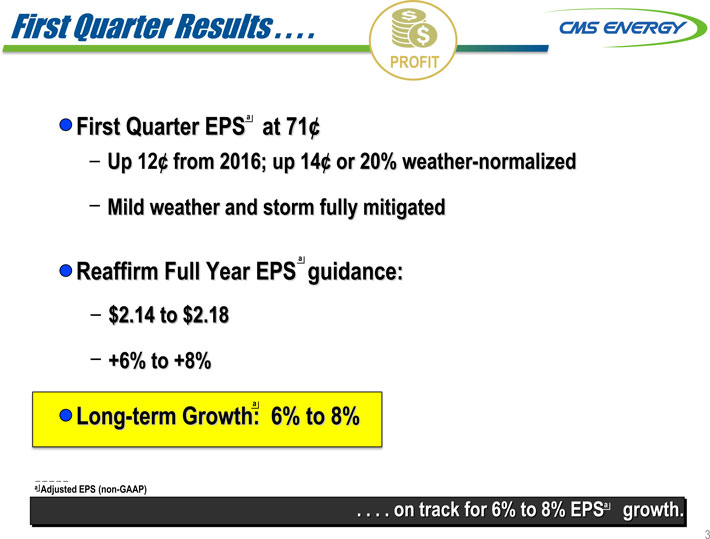
First Quarter Results . . . . PROFIT First Quarter EPSa at 71¢ Up 12¢ from 2016; up 14¢ or 20% weather-normalized Mild weather and storm fully mitigated Reaffirm Full Year EPS a guidance: $2.14 to $2.18 +6% to +8% Long-term Growth: a 6% to 8% a Adjusted EPS (non-GAAP) . . . . on track for 6% to 8% EPSa growth. 3

The Triple Bottom Line . . . . PEOPLE • PLANET • PROFIT PEOPLE PLANET PROFIT PERFORMANCE . . . . world class performance delivering hometown service. 4
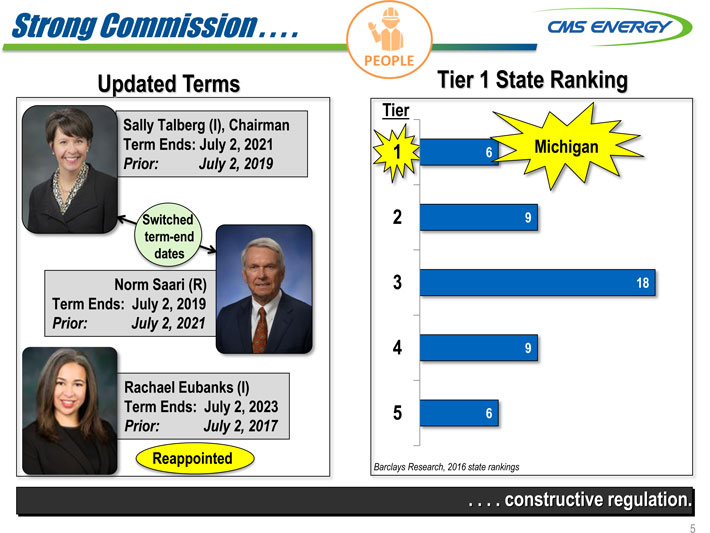
Strong Commission . . . . Updated Terms Sally Talberg (I), Chairman Term Ends: July 2, 2021 Prior: July 2, 2019 Switched term-end dates Norm Saari (R) Term Ends: July 2, 2019 Prior: July 2, 2021 Rachael Eubanks (I) Term Ends: July 2, 2023 Prior: July 2, 2017 Reappointed Tier 1 State Ranking Tier . . . . constructive regulation. 5
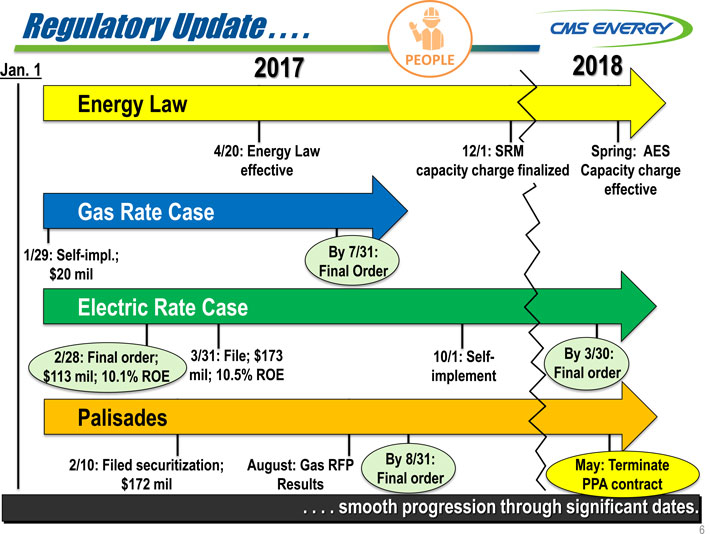
Regulatory Update . . . . PEOPLE 2018 2017 Jan. 1 Energy Law 4/20: Energy Law effective 12/1: SRM capacity charge finalized Spring: AES Capacity charge effective Gas Rate Case 1/29: Self-impl.; $20 mil By 7/31: Final Order 3/31: File; $173 mil; 10.5% ROE 2/28: Final order; $113 mil; 10.1% ROE 10/1: Self-implement By 3/30: Final order Palisades 2/10: Filed securitization; $172 mil August: Gas RFP Results By 8/31: Final order May: Terminate PPA contract . . . . smooth progression through significant dates. 6
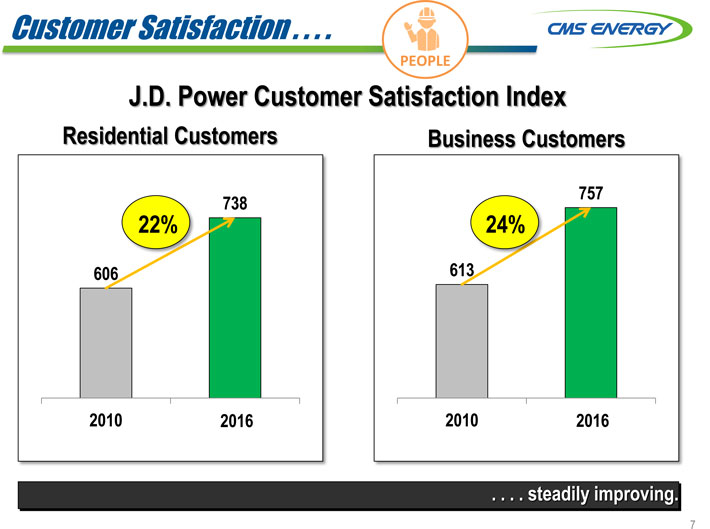
Customer Satisfaction . . . . PEOPLE J.D. Power Customer Satisfaction Index Residential Customers Business Customers 738 757 22% 24% 606 613 2010 2016 2010 2016 . . . . steadily improving. 7
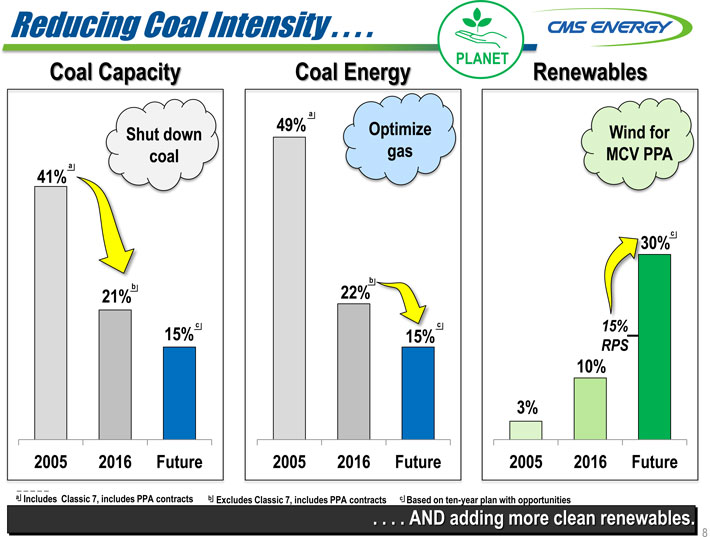
Reducing Coal Intensity . . . . PLANET Coal Capacity Coal Energy Renewables 49% a Optimize Wind for Shut down coal gas MCV PPA 41% a 30%c b 21%b 22% 15% c 15% c 15% RPS 10% 3% a Includes Classic 7, includes PPA contracts b Excludes Classic 7, includes PPA contracts c Based on ten-year plan with opportunities AND adding more clean renewables. 8
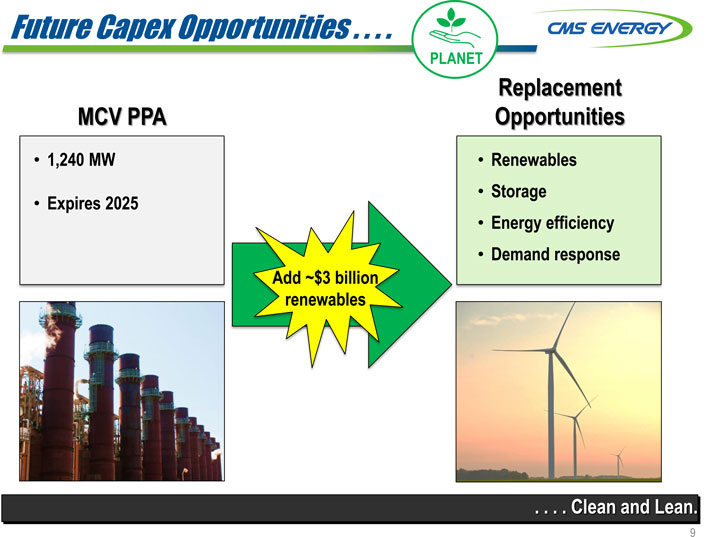
Future Capex Opportunities . . . . PLANET Replacement Opportunities MCV PPA 1,240 MW Expires 2025 Renewables Storage Energy efficiency Demand response Add ~$3 billion renewables . . . . Clean and Lean. 9
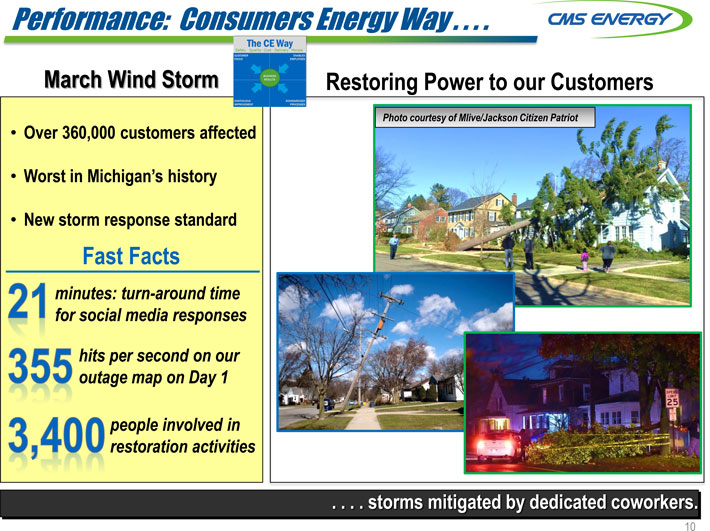
Performance: Consumers Energy Way . . . . March Wind Storm Restoring Power to our Customers Photo courtesy of Mlive/Jackson Citizen Patriot Over 360,000 customers affected Worst in Michigan’s history New storm response standard Fast Facts minutes: turn-around time for social media responses hits per second on our outage map on Day 1 people involved in restoration activities . . . . storms mitigated by dedicated coworkers. 10
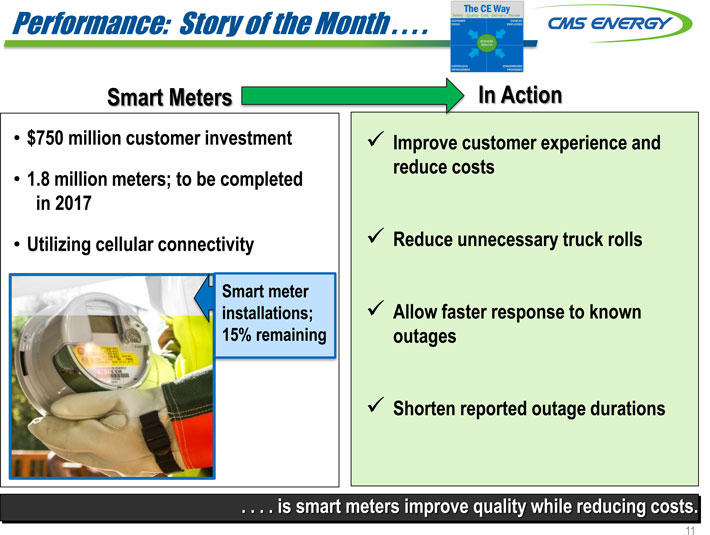
Performance: Story of the Month . . . . Smart Meters In Action $750 million customer investment 1.8 million meters; to be completed in 2017 Utilizing cellular connectivity Improve customer experience and reduce costs Reduce unnecessary truck rolls Allow faster response to known outages Shorten reported outage durations Smart meter installations; 15% remaining . . . . is smart meters improve quality while reducing costs. 11
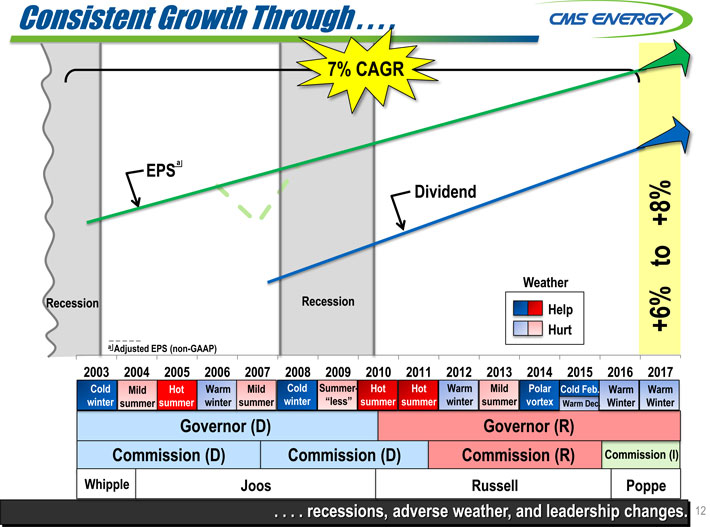
Consistent Growth Through . . . . +8% to Weather Recession Recession Help +6% Hurt a Adjusted EPS (non-GAAP) 2003 2004 2005 2006 2007 2008 2009 2010 2011 2012 2013 2014 2015 2016 2017 Cold Mild Hot Warm Mild Cold Summer- Hot Hot Warm Mild Polar Cold Feb. Warm Warm winter summer summer winter summer winter “less” summer summer winter summer vortex Warm Dec. Winter Winter Governor (D) Governor (R) Commission (D) Commission (D) Commission (R) Commission (I) Whipple Joos Russell Poppe recessions, adverse weather, and leadership changes. 12
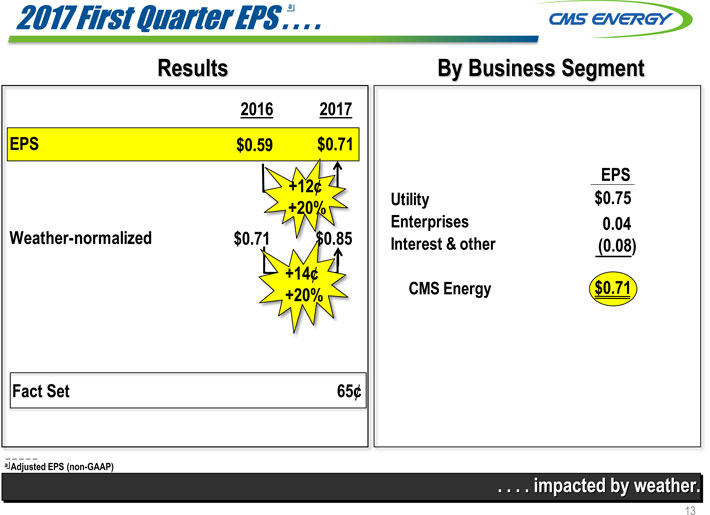
2017 First Quarter EPS . a . . Results By Business Segment 2016 2017 EPS $0.59 $0.71 +12¢ EPS +20% $0.75 0.04 Weather-normalized $0.71 $0.85(0.08) +14¢ $0.71 +20% a Adjusted EPS (non-GAAP) impacted by weather. 13
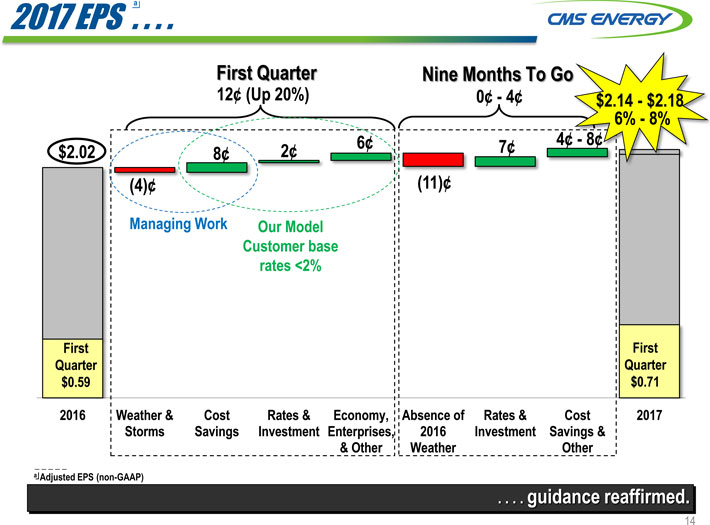
2017 EPS . a . . First Quarter Nine Months To Go 12¢(Up 20%) 0¢—4¢ $2.14—$2.18 6%—8% $2.02 8¢ 2¢ 6¢ 7¢ 4¢—8¢ (4)¢(11)¢ Managing Work Our Model Customer base rates <2% First First Quarter Quarter $0.59 $0.71 2016 Weather & Cost Rates & Economy, Absence of Rates & Cost 2017 Storms Savings Investment Enterprises, 2016 Investment Savings & & Other Weather Other a Adjusted EPS (non-GAAP) guidance reaffirmed. 14
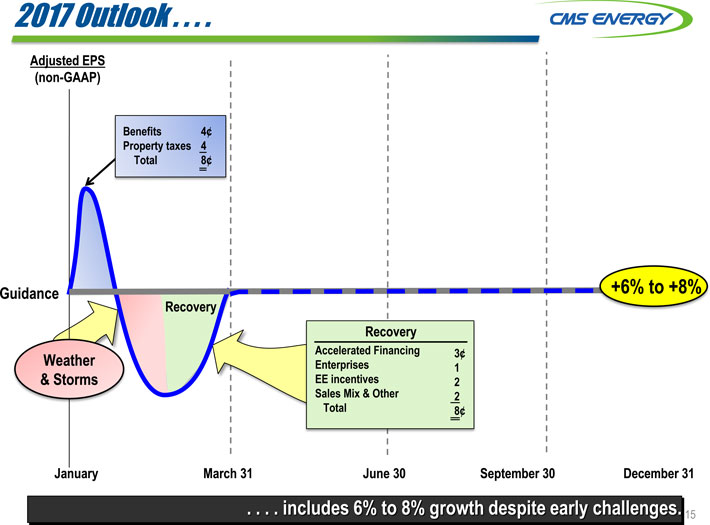
2017 Outlook . . . . Adjusted EPS (non-GAAP) Benefits 4¢ Property taxes 4 Total 8¢ Guidance +6% to +8% Recovery Recovery Accelerated Financing 3¢ Weather Enterprises 1 & Storms EE incentives 2 Sales Mix & Other 2 Total 8¢ January March 31 June 30 September 30 December 31 . . . . includes 6% to 8% growth despite early challenges. 15
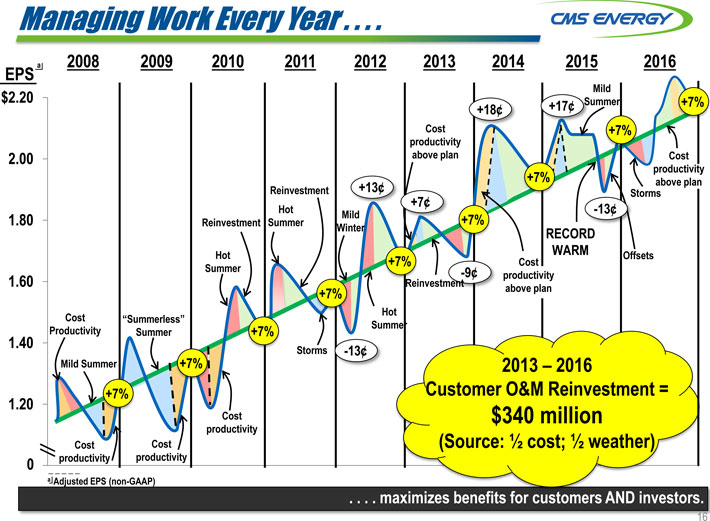
Managing Work Every Year . . . . a 2008 2009 2010 2011 2012 2013 2014 2015 2016 EPS Mild $ 2.20 +18¢ +17¢ Summer +7% Cost +7% productivity $ 2.00 above plan Cost productivity Reinvestment +13¢ +7% Storms above plan +7¢ Hot -13¢ $ 1.80 Reinvestment Summer Mild +7% Winter RECORD Hot WARM Offsets +7% Cost $ 1.60 Summer Reinvestment -9¢ productivity +7% above plan Cost “Summerless” Hot Productivity Summer +7% Summer $ 1.40 Storms -13¢ Mild Summer +7% 2013 – 2016 +7% Customer O&M Reinvestment = $ 1.20 Cost $340 million productivity Cost Cost(Source: 1⁄2 cost; 1⁄2 weather) 0 productivity productivity a Adjusted EPS (non-GAAP) maximizes benefits for customers AND investors. 16
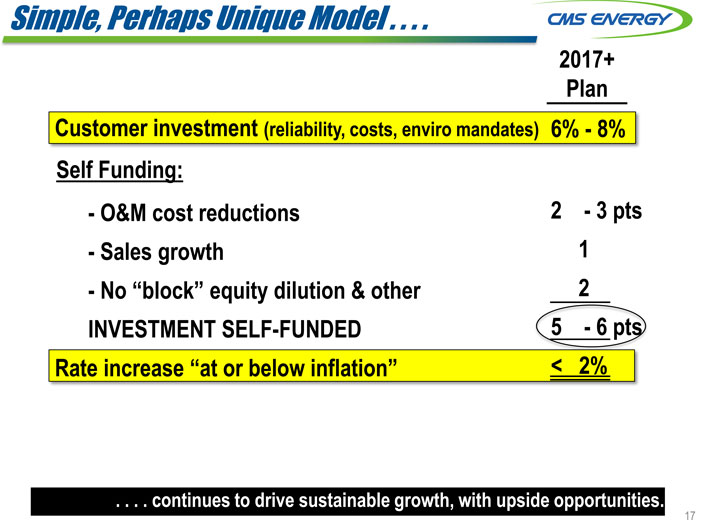
Simple, Perhaps Unique Model . . . . 2017+ Plan Customer investment (reliability, costs, enviro mandates) 6%—8% Self Funding: —O&M cost reductions 2—3 pts—Sales growth 1—No “block” equity dilution & other 2 INVESTMENT SELF-FUNDED 5—6 pts Rate increase “at or below inflation” < 2% . . . . continues to drive sustainable growth, with upside opportunities. 17
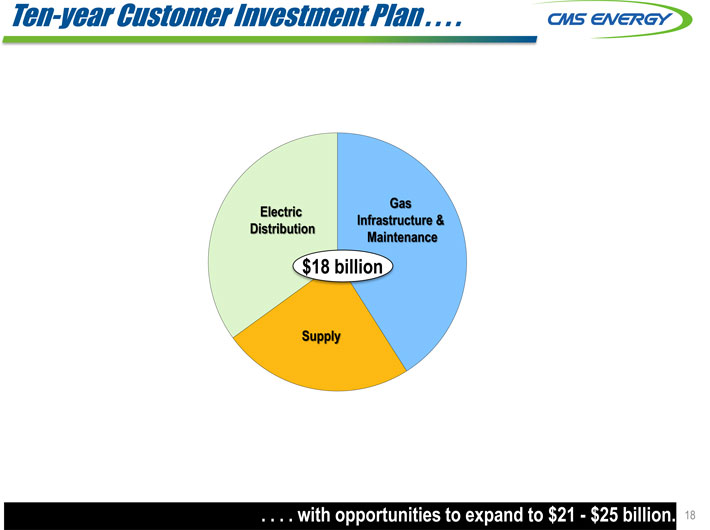
Ten-year Customer Investment Plan . . . . Gas Electric Infrastructure & Distribution Maintenance $18 billion Supply . . . . with opportunities to expand to $21—$25 billion. 18
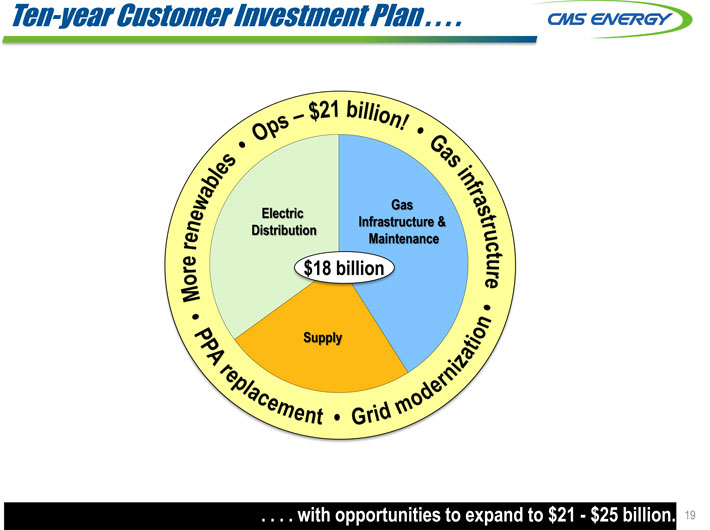
Ten-year Customer Investment Plan . . . . Electric Distribution Gas Infrastructure & Maintenance Supply $18 billion . . . . with opportunities to expand to $21—$25 billion. 19
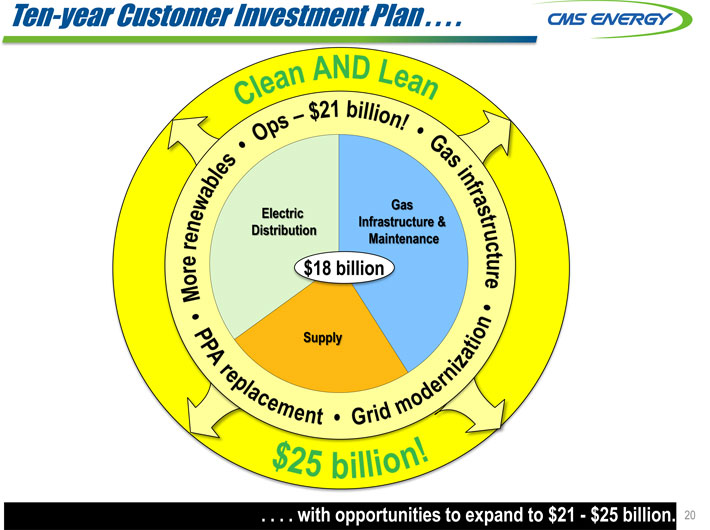
Ten-year Customer Investment Plan . . . . Electric Distribution Gas Infrastructure & Maintenance Supply . . . . with opportunities to expand to $21—$25 billion. 20
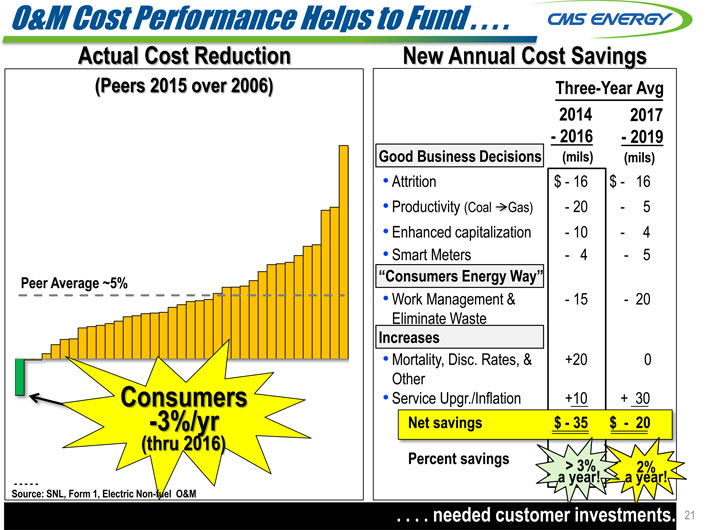
O&M Cost Performance Helps to Fund . . . . Actual Cost Reduction (Peers 2015 over 2006) Peer Average ~5% Consumers -3%/yr (thru 2016) — ——Source: SNL, Form 1, Electric Non-fuel O&M New Annual Cost Savings Three-Year Avg 2014 2017 —2016—2019 Good Business Decisions(mils)(mils) • Attrition $—16 $—16 • Productivity (Coal Gas)—20—5 • Enhanced capitalization—10—4 • Smart Meters—4—5 “Consumers Energy Way”• Work Management &—15—20 Eliminate Waste Increases • Mortality, Disc. Rates, & +20 0 Other • Service Upgr./Inflation +10 + 30 Net savings $—35 $—20 Percent savings > 3% 2% a year! a year! needed customer investments. 21
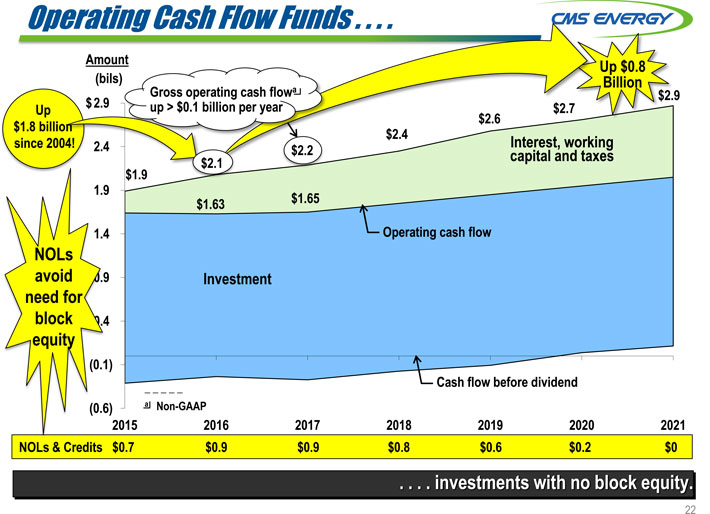
Operating Cash Flow Funds . . . . Amount (bils) Amount Up $0.8 (bils) Billion Gross operating cash flowa 9 Up $ 2.9 up > $0.1 billion per year $1.8 billio since 200 king $2.1 $2.2 taxes $1.9 9 $1.63 $1.65 4 Operating cash flow NOLs avoid 9 Investment need for block 4 equity 1) Cash flow before dividend 6) a Non-GAAP 2015 2016 2017 2018 2019 2020 2021 NOLs & Credits $0.7 $0.9 $0.9 $0.8 $0.6 $0.2 $0 investments with no block equity. 22
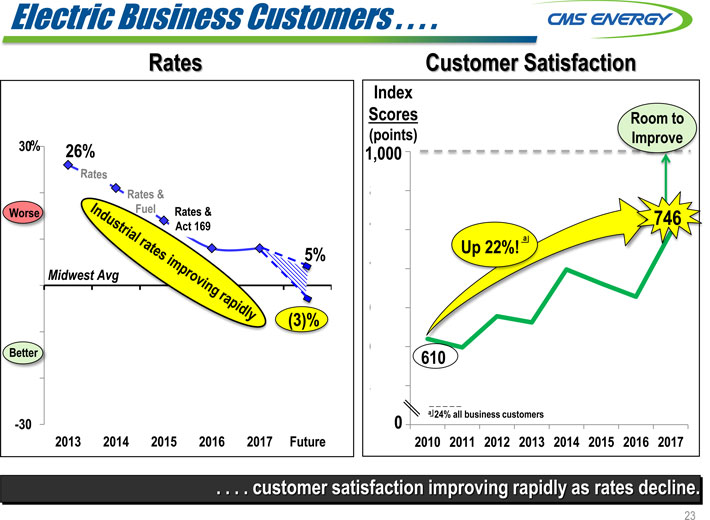
Electric Business Customers . . . . Rates Customer Satisfaction Index Scores Room to (points) Improve 30% 26% 1,000 Rates & Worse 746 5% Up 22%! a Midw (3)% Better 610 -30 0 a 24% all business customers 2013 2014 2015 2016 2017 Future 2010 2011 2012 2013 2014 2015 2016 2017 . . . . customer satisfaction improving rapidly as rates decline. 23
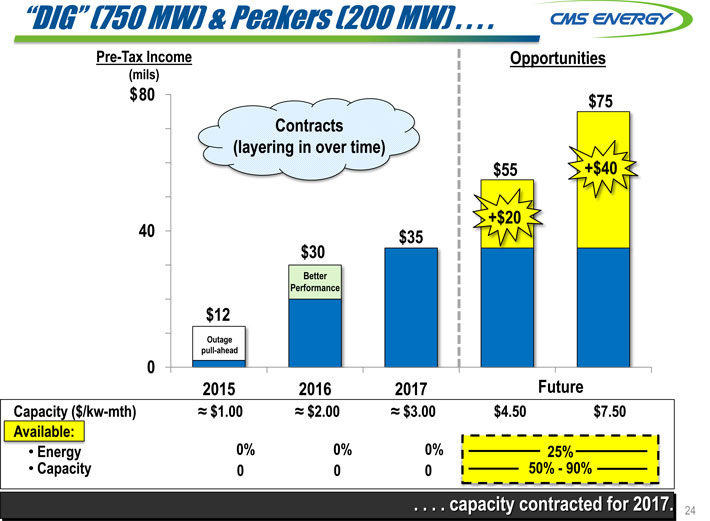
“DIG” (750 MW) & Peakers (200 MW) . . . . Pre-Tax Income Opportunities (mils) $ 80 $75 Contracts (layering in over time) $55 +$40 +$20 40 $35 $30 Better Performance $12 Outage pull-ahead 0 2015 2016 2017 Future Capacity ($/kw-mth) ? $1.00 ? $2.00 ? $3.00 $4.50 $7.50 Available: • Energy 0% 0% 0% 25% • Capacity 0 0 0 50%—90% capacity contracted for 2017. 24
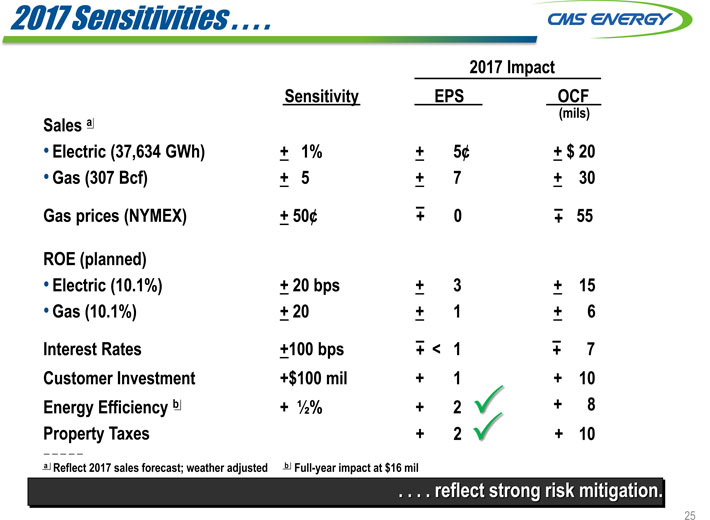
2017 Sensitivities . . . . 2017 Impact Sensitivity EPS OCF (mils) Sales a • Electric (37,634 GWh) + 1% + 5¢ + $ 20 • Gas (307 Bcf) + 5 + 7 + 30 Gas prices (NYMEX) + 50¢ + – 0 + – 55 ROE (planned) • Electric (10.1%) + 20 bps + 3 + 15 • Gas (10.1%) + 20 + 1 + 6 – – Interest Rates +100 bps + < 1 + 7 Customer Investment +$100 mil + + 10 Energy Efficiency b + 1⁄2% + ? + 8 Property Taxes + + 10 a Reflect 2017 sales forecast; weather adjusted b Full-year impact at $16 mil reflect strong risk mitigation. 25
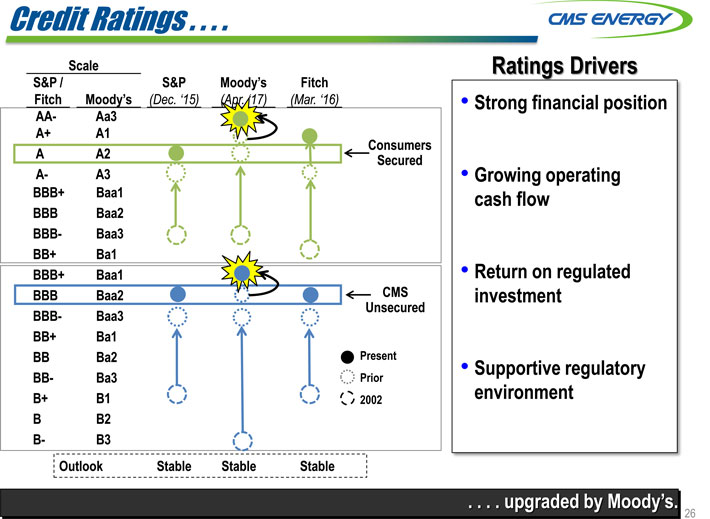
Credit Ratings . . . . Scale S&P / S&P Moody’s Fitch Fitch Moody’s(Dec. ‘15)(Apr. ‘17)(Mar. ‘16) AA- Aa3 A+ A1 Consumers A A2 Secured A- A3 BBB+ Baa1 BBB Baa2 BBB- Baa3 BB+ Ba1 BBB+ Baa1 BBB Baa2 CMS BBB- Baa3 Unsecured BB+ Ba1 BB Ba2 Present BB- Ba3 Prior B+ B1 2002 B B2 B- B3 Outlook Stable Stable Stable Ratings Drivers Strong financial position Growing operating cash flow Return on regulated investment Supportive regulatory environment . . . . upgraded by Moody’s. 26
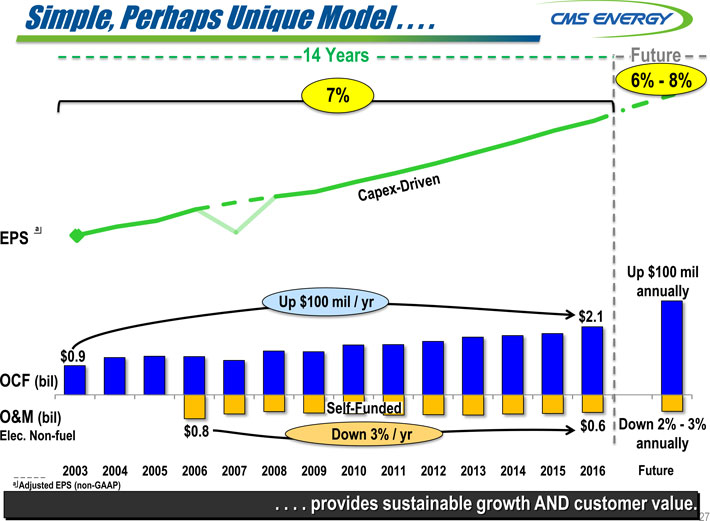
Simple, Perhaps Unique Model 14 Years Future 6%—8% 7% EPS a Up $100 mil Up $100 mil / yr annually $2.1 $0.9 OCF (bil) Self-Funded O&M (bil) $0.8 $0.6 Down 2%—3% Elec. Non-fuel Down 3% / yr annually 2003 2004 2005 2006 2007 2008 2009 2010 2011 2012 2013 2014 2015 2016 Future a Adjusted EPS (non-GAAP) provides sustainable growth AND customer value. 27
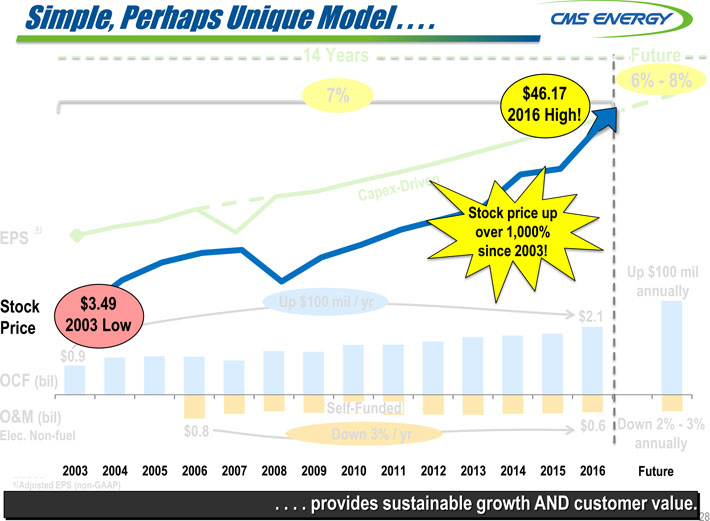
Simple, Perhaps Unique Model . . . . 14 Years Future 6%—8% 7% $46.17 2016 High! Stock price up a over 1,000% EPS since 2003! Up $100 mil annually Stock $3.49 Up $100 mil / yr $2.1 Price 2003 Low $0.9 OCF (bil) Self-Funded O&M (bil) Down 2%—3% $0.8 $0.6 Elec. Non-fuel Down 3% / yr annually 2003 2004 2005 2006 2007 2008 2009 2010 2011 2012 2013 2014 2015 2016 Future a Adjusted EPS (non-GAAP) . . . . provides sustainable growth AND customer value. 28
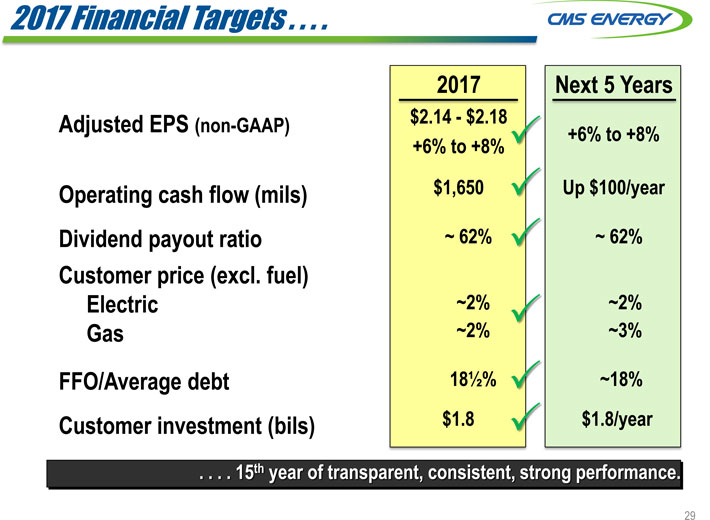
2017 Financial Targets . . . . 2017 Next 5 Years Adjusted EPS (non-GAAP) $2.14—$2 +6% to +8% +6% to Operating cash flow (mils) $1,650? $100/year Dividend payout ratio ~ 62%? ~ 62% Customer price (excl. fuel) Electric ~2%? ~2% Gas ~2% ~3% FFO/Average debt 18 1⁄2%? ~18% Customer investment (bils) $1.8 ? $1.8/year . . . . 15th year of transparent, con erformance. 29

WORLD CLASS PERFORMANCE DELIVERING HOMETOWN SERVICE 30
THANK YOU 31
 .
.
Q & A 32

GAAP Reconciliat ationion 33
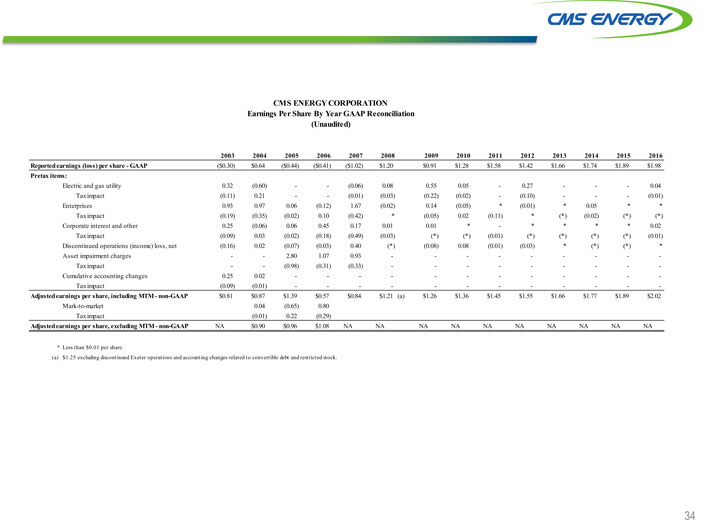
CMS ENERGY CORPORATION Earnings Per Share By Year GAAP Reconciliation (Unaudited) 2003 2004 2005 2006 2007 2008 2009 2010 2011 2012 2013 2014 2015 2016 Reported earnings (loss) per share—GAAP($0.30) $0.64($0.44)($0.41)($1.02) $1.20 $0.91 $1.28 $1.58 $1.42 $1.66 $1.74 $1.89 $1.98 Pretax items: Electric and gas utility 0.32(0.60) —(0.06) 0.08 0.55 0.05—0.27 ——0.04 Tax impact(0.11) 0.21 —(0.01)(0.03)(0.22)(0.02) -(0.10) — -(0.01) Enterprises 0.93 0.97 0.06(0.12) 1.67(0.02) 0.14(0.05)*(0.01)* 0.05** Tax impact(0.19)(0.35)(0.02) 0.10(0.42)*(0.05) 0.02(0.11)*(*)(0.02)(*)(*) Corporate interest and other 0.25(0.06) 0.06 0.45 0.17 0.01 0.01* -**** 0.02 Tax impact(0.09) 0.03(0.02)(0.18)(0.49)(0.03)(*)(*)(0.01)(*)(*)(*)(*)(0.01) Discontinued operations (income) loss, net(0.16) 0.02(0.07)(0.03) 0.40(*)(0.08) 0.08(0.01)(0.03)*(*)(*)* Asset impairment charges — 2.80 1.07 0.93 — — — —— Tax impact —(0.98)(0.31)(0.33) — — — —— Cumulative accounting changes 0.25 0.02 — — — — — — Tax impact(0.09)(0.01) — — — — — — Adjusted earnings per share, including MTM—non-GAAP $0.81 $0.87 $1.39 $0.57 $0.84 $1.21 (a) $1.26 $1.36 $1.45 $1.55 $1.66 $1.77 $1.89 $2.02 Mark-to-market 0.04(0.65) 0.80 Tax impact(0.01) 0.22(0.29) Adjusted earnings per share, excluding MTM—non-GAAP NA $0.90 $0.96 $1.08 NA NA NA NA NA NA NA NA NA NA * Less than $0.01 per share. (a) $1.25 excluding discontinued Exeter operations and accounting changes related to convertible debt and restricted stock. 34
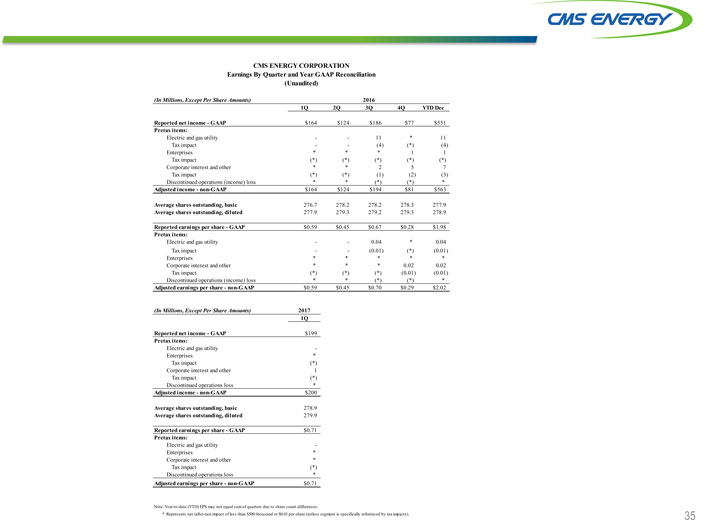
CMS ENERGY CORPORATION Earnings By Quarter and Year GAAP Reconciliation (Unaudited) (In Millions, Except Per Share Amounts) 2016 1Q 2Q 3Q 4Q YTD Dec Reported net income—GAAP $164 $124 $186 $77 $551 Pretax items: Electric and gas utility — 11* 11 Tax impact —(4)(*)(4) Enterprises*** 1 1 Tax impact(*)(*)(*)(*)(*) Corporate interest and other** 2 5 7 Tax impact(*)(*)(1)(2)(3) Discontinued operations (income) loss**(*)(*)* Adjusted income—non-GAAP $164 $124 $194 $81 $563 Average shares outstanding, basic 276.7 278.2 278.2 278.3 277.9 Average shares outstanding, diluted 277.9 279.3 279.2 279.3 278.9 Reported earnings per share—GAAP $0.59 $0.45 $0.67 $0.28 $1.98 Pretax items: Electric and gas utility — 0.04* 0.04 Tax impact —(0.01)(*)(0.01) Enterprises***** Corporate interest and other*** 0.02 0.02 Tax impact(*)(*)(*)(0.01)(0.01) Discontinued operations (income) loss**(*)(*)* Adjusted earnings per share—non-GAAP $0.59 $0.45 $0.70 $0.29 $2.02 (In Millions, Except Per Share Amounts) 2017 1Q Reported net income—GAAP $199 Pretax items: Electric and gas utility— Enterprises* Tax impact(*) Corporate interest and other 1 Tax impact(*) Discontinued operations loss* Adjusted income—non-GAAP $200 Average shares outstanding, basic 278.9 Average shares outstanding, diluted 279.9 Reported earnings per share—GAAP $0.71 Pretax items: Electric and gas utility— Enterprises* Corporate interest and other* Tax impact(*) Discontinued operations loss* Adjusted earnings per share—non-GAAP $0.71 Note: Year-to-date (YTD) EPS may not equal sum of quarters due to share count differences. * Represents net (after-tax) impact of less than $500 thousand or $0.01 per share (unless segment is specifically referenced by taximpacts). 35
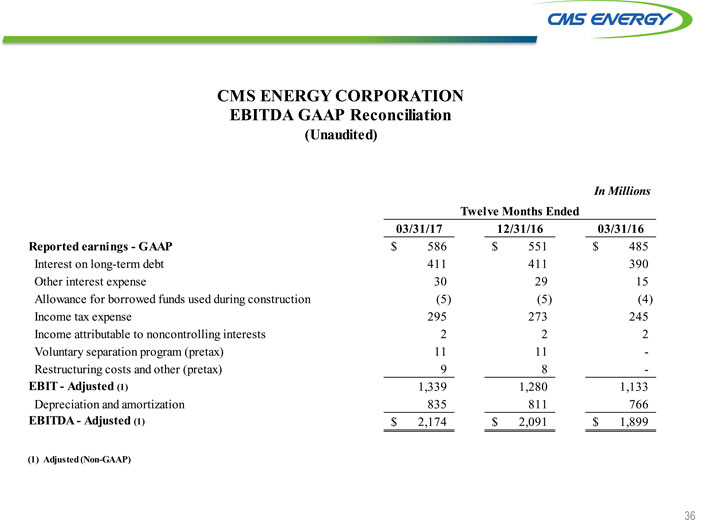
CMS ENERGY CORPORATION EBITDA GAAP Reconciliation (Unaudited) In Millions Twelve Months Ended 03/31/17 12/31/16 03/31/16 Reported earnings—GAAP $ 586 $ 551 $ 485 Interest on long-term debt 411 411 390 Other interest expense 30 29 15 Allowance for borrowed funds used during construction(5)(5)(4) Income tax expense 295 273 245 Income attributable to noncontrolling interests 2 2 2 Voluntary separation program (pretax) 11 11—Restructuring costs and other (pretax) 9 8—EBIT—Adjusted (1) 1,339 1,280 1,133 Depreciation and amortization 835 811 766 EBITDA—Adjusted (1) $ 2,174 $ 2,091 $ 1,899 (1) Adjusted (Non-GAAP) 36
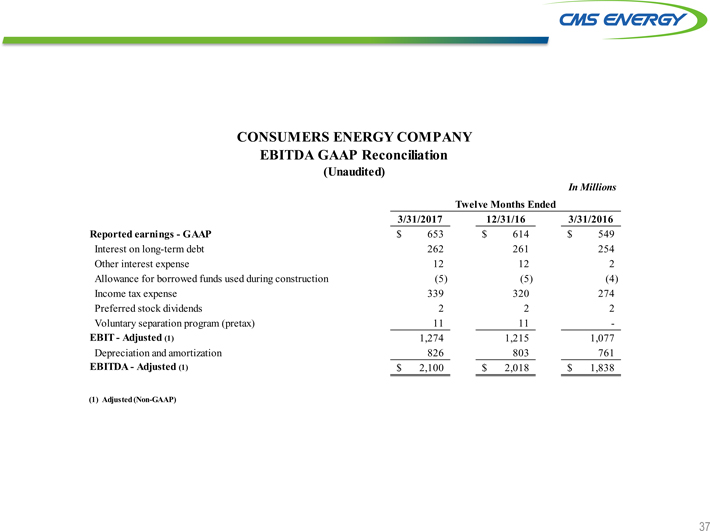
CONSUMERS ENERGY COMPANY EBITDA GAAP Reconciliation (Unaudited) In Millions Twelve Months Ended 3/31/2017 12/31/16 3/31/2016 Reported earnings—GAAP $ 653 $ 614 $ 549 Interest on long-term debt 262 261 254 Other interest expense 12 12 2 Allowance for borrowed funds used during construction(5)(5)(4) Income tax expense 339 320 274 Preferred stock dividends 2 2 2 Voluntary separation program (pretax) 11 11—EBIT—Adjusted (1) 1,274 1,215 1,077 Depreciation and amortization 826 803 761 EBITDA—Adjusted (1) $ 2,100 $ 2,018 $ 1,838 (1) Adjusted (Non-GAAP) 37
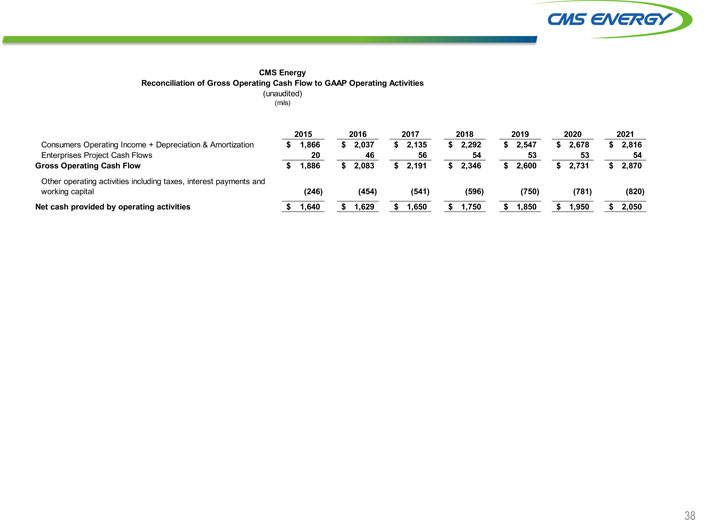
CMS Energy Reconciliation of Gross Operating Cash Flow to GAAP Operating Activities (unaudited) (mils) 2015 2016 2017 2018 2019 2020 2021 Consumers Operating Income + Depreciation & Amortization $ 1,866 $ 2,037 $ 2,135 $ 2,292 $ 2,547 $ 2,678 $ 2,816 Enterprises Project Cash Flows 20 46 56 54 53 53 54 Gross Operating Cash Flow $ 1,886 $ 2,083 $ 2,191 $ 2,346 $ 2,600 $ 2,731 $ 2,870 Other operating activities including taxes, interest payments and working capital(246)(454)(541)(596)(750)(781)(820) Net cash provided by operating activities $ 1,640 $ 1,629 $ 1,650 $ 1,750 $ 1,850 $ 1,950 $ 2,050 38
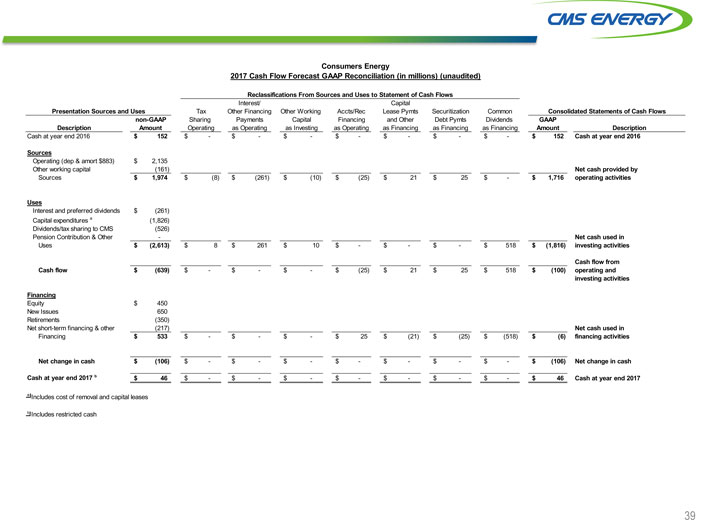
Consumers Energy 2017 Cash Flow Forecast GAAP Reconciliation (in millions) (unaudited) Reclassifications From Sources and Uses to Statement of Cash Flows Interest/ Capital Presentation Sources and Uses Tax Other Financing Other Working Accts/Rec Lease Pymts Securitization Common Consolidated Statements of Cash Flows non-GAAP Sharing Payments Capital Financing and Other Debt Pymts Dividends GAAP Description Amount Operating as Operating as Investing as Operating as Financing as Financing as Financing Amount Description Cash at year end 2016 $ 152 $—$—$—$—$—$—$—$ 152 Cash at year end 2016 Sources Operating (dep & amort $883) $ 2,135 Other working capital(161) Net cash provided by Sources $ 1,974 $(8) $(261) $(10) $(25) $ 21 $ 25 $—$ 1,716 operating activities Uses Interest and preferred dividends $(261) Capital expenditures a(1,826) Dividends/tax sharing to CMS(526) Pension Contribution & Other—Net cash used in Uses $(2,613) $ 8 $ 261 $ 10 $—$—$—$ 518 $ (1,816) investing activities Cash flow from Cash flow $(639) $—$—$—$(25) $ 21 $ 25 $ 518 $ (100) operating and investing activities Financing Equity $ 450 New Issues 650 Retirements(350) Net short-term financing & other(217) Net cash used in Financing $ 533 $—$—$—$ 25 $(21) $(25) $(518) $(6) financing activities Net change in cash $(106) $—$—$—$—$—$—$—$ (106) Net change in cash Cash at year end 2017 b $ 46 $—$—$—$—$—$—$—$ 46 Cash at year end 2017 a Includes cost of removal and capital leases b Includes restricted cash 39
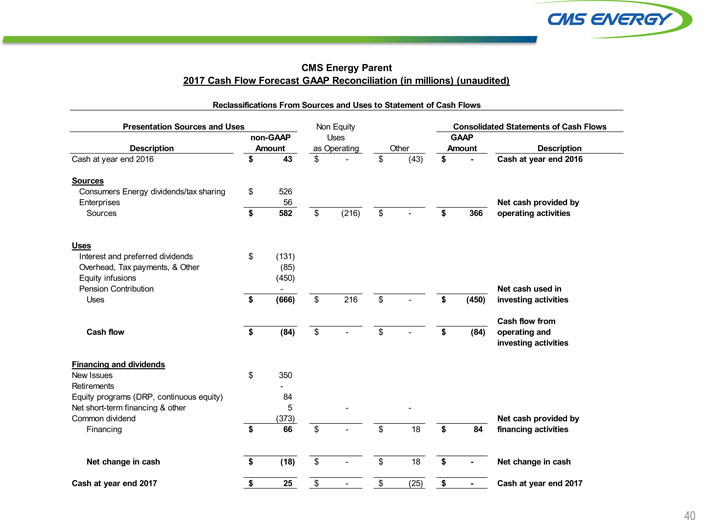
CMS Energy Parent 2017 Cash Flow Forecast GAAP Reconciliation (in millions) (unaudited) Reclassifications From Sources and Uses to Statement of Cash Flows Presentation Sources and Uses Non Equity Consolidated Statements of Cash Flows non-GAAP Uses GAAP Description Amount as Operating Other Amount Description Cash at year end 2016 $ 43 $—$(43) $—Cash at year end 2016 Sources Consumers Energy dividends/tax sharing $ 526 Enterprises 56 Net cash provided by Sources $ 582 $(216) $—$ 366 operating activities Uses Interest and preferred dividends $(131) Overhead, Tax payments, & Other(85) Equity infusions(450) Pension Contribution—Net cash used in Uses $(666) $ 216 $—$(450) investing activities Cash flow from Cash flow $(84) $—$—$(84) operating and investing activities Financing and dividends New Issues $ 350 Retirements— Equity programs (DRP, continuous equity) 84 Net short-term financing & other 5 — Common dividend(373) Net cash provided by Financing $ 66 $—$ 18 $ 84 financing activities Net change in cash $(18) $—$ 18 $—Net change in cash Cash at year end 2017 $ 25 $—$(25) $—Cash at year end 2017 40
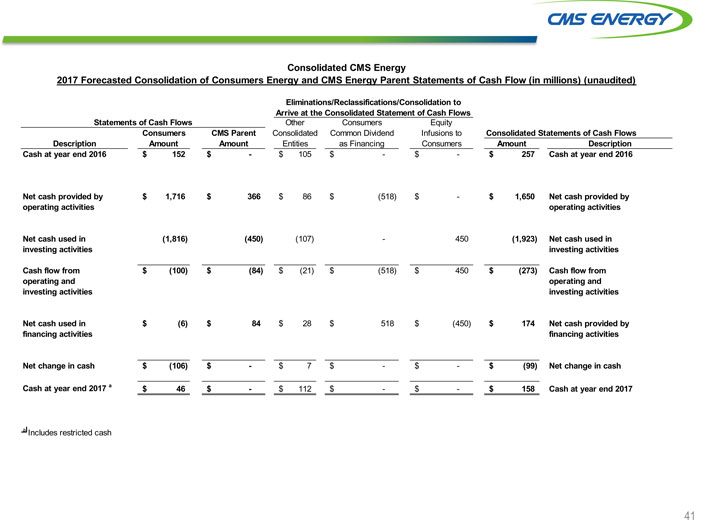
Consolidated CMS Energy 2017 Forecasted Consolidation of Consumers Energy and CMS Energy Parent Statements of Cash Flow (in millions) (unaudited) Eliminations/Reclassifications/Consolidation to Arrive at the Consolidated Statement of Cash Flows Statements of Cash Flows Other Consumers Equity Consumers CMS Parent Consolidated Common Dividend Infusions to Consolidated Statements of Cash Flows Description Amount Amount Entities as Financing Consumers Amount Description Cash at year end 2016 $ 152 $—$ 105 $—$—$ 257 Cash at year end 2016 Net cash provided by $ 1,716 $ 366 $ 86 $(518) $—$ 1,650 Net cash provided by operating activities operating activities Net cash used in(1,816)(450)(107)—450(1,923) Net cash used in investing activities investing activities Cash flow from $(100) $(84) $(21) $(518) $ 450 $(273) Cash flow from operating and operating and investing activities investing activities Net cash used in $(6) $ 84 $ 28 $ 518 $(450) $ 174 Net cash provided by financing activities financing activities Net change in cash $(106) $—$ 7 $—$—$(99) Net change in cash Cash at year end 2017 a $ 46 $—$ 112 $—$—$ 158 Cash at year end 2017 a Includes restricted cash 41
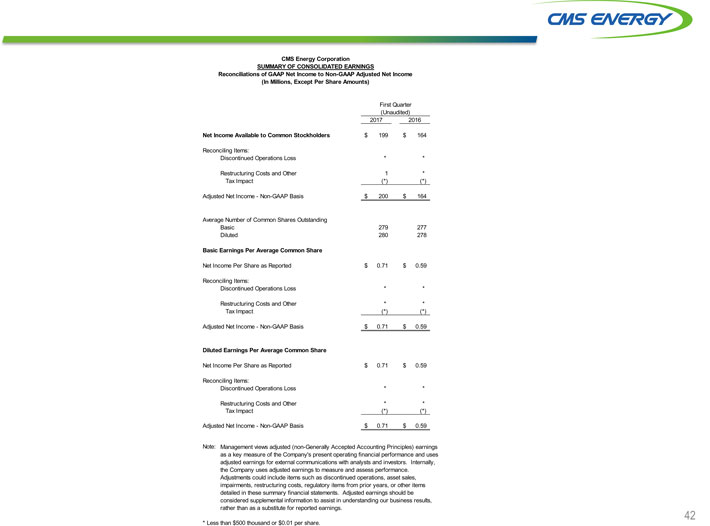
CMS Energy Corporation SUMMARY OF CONSOLIDATED EARNINGS Reconciliations of GAAP Net Income to Non-GAAP Adjusted Net Income (In Millions, Except Per Share Amounts) First Quarter (Unaudited) 2017 2016 Net Income Available to Common Stockholders $ 199 $ 164 Reconciling Items: Discontinued Operations Loss** Restructuring Costs and Other 1* Tax Impact(*)(*) Adjusted Net Income—Non-GAAP Basis $ 200 $ 164 Average Number of Common Shares Outstanding Basic 279 277 Diluted 280 278 Basic Earnings Per Average Common Share Net Income Per Share as Reported $ 0.71 $ 0.59 Reconciling Items: Discontinued Operations Loss** Restructuring Costs and Other** Tax Impact(*)(*) Adjusted Net Income—Non-GAAP Basis $ 0.71 $ 0.59 Diluted Earnings Per Average Common Share Net Income Per Share as Reported $ 0.71 $ 0.59 Reconciling Items: Discontinued Operations Loss** Restructuring Costs and Other** Tax Impact(*)(*) Adjusted Net Income—Non-GAAP Basis $ 0.71 $ 0.59 Note: Management views adjusted (non-Generally Accepted Accounting Principles) earnings as a key measure of the Company’s present operating financial performance and uses adjusted earnings for external communications with analysts and investors. Internally, the Company uses adjusted earnings to measure and assess performance. Adjustments could include items such as discontinued operations, asset sales, impairments, restructuring costs, regulatory items from prior years, or other items detailed in these summary financial statements. Adjusted earnings should be considered supplemental information to assist in understanding our business results, rather than as a substitute for reported earnings. * Less than $500 thousand or $0.01 per share. 42