Attached files
| file | filename |
|---|---|
| EX-99.1 - EX-99.1 - SOUTH STATE Corp | a17-11977_1ex99d1.htm |
| 8-K - 8-K - SOUTH STATE Corp | a17-11977_18k.htm |
Exhibit 99.2
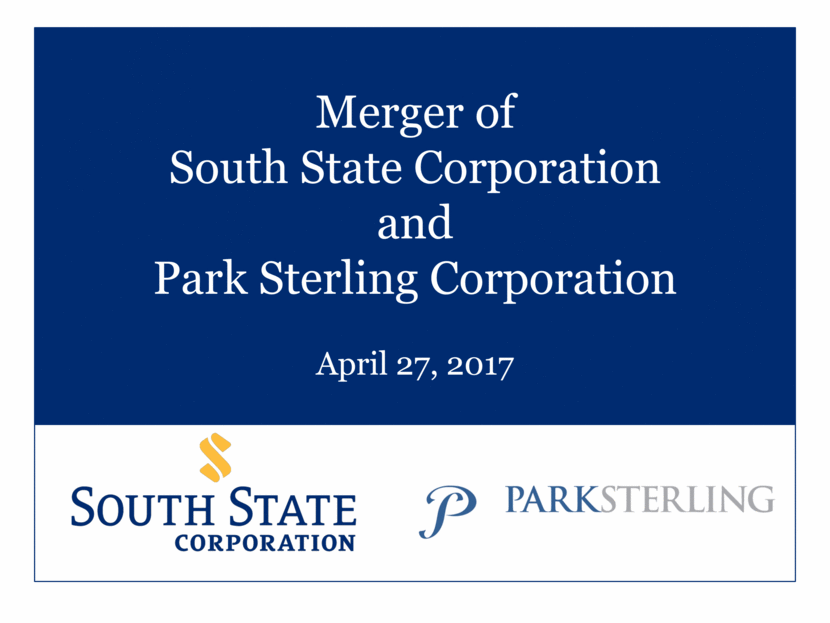
Merger of South State Corporation and Park Sterling Corporation April 27, 2017
Forward Looking Statements 2 CAUTION REGARDING FORWARD-LOOKING STATEMENTS Statements included in this communication which are not historical in nature or do not relate to current facts are intended to be, and are hereby identified as, forward-looking statements for purposes of the safe harbor provided by Section 27A of the Securities Act of 1933 and Section 21E of the Securities Exchange Act of 1934. The words “may,” “will,” “anticipate,” “could,” “should,” “would,” “believe,” “contemplate,” “expect,” “estimate,” “continue,” “plan,” “project” and “intend,” as well as other similar words and expressions of the future, are intended to identify forward-looking statements. South State Corporation (“South State”) and Park Sterling Corporation (“Park Sterling”) caution readers that forward-looking statements are subject to certain risks and uncertainties that could cause actual results to differ materially from anticipated results. Such risks and uncertainties, include, among others, the following possibilities: the occurrence of any event, change or other circumstances that could give rise to the right of one or both of the parties to terminate the definitive merger agreement between South State and Park Sterling; the outcome of any legal proceedings that may be instituted against South State or Park Sterling; the failure to obtain necessary regulatory approvals (and the risk that such approvals may result in the imposition of conditions that could adversely affect the combined company or the expected benefits of the transaction), and shareholder approvals or to satisfy any of the other conditions to the transaction on a timely basis or at all; the possibility that the anticipated benefits of the transaction are not realized when expected or at all, including as a result of the impact of, or problems arising from, the integration of the two companies or as a result of the strength of the economy and competitive factors in the areas where South State and Park Sterling do business; the possibility that the transaction may be more expensive to complete than anticipated, including as a result of unexpected factors or events; diversion of management’s attention from ongoing business operations and opportunities; potential adverse reactions or changes to business or employee relationships, including those resulting from the announcement or completion of the transaction; South State’s ability to complete the acquisition and integration of Park Sterling successfully; credit risk associated with commercial real estate, commercial business and construction lending; interest risk involving the effect of a change in interest rates on both of South State’s and Park Sterling’s earnings and the market value of the portfolio equity; liquidity risk affecting each bank’s ability to meet its obligations when they come due; price risk focusing on changes in market factors that may affect the value of traded instruments; transaction risk arising from problems with service or product delivery; compliance risk involving risk to earnings or capital resulting from violations of or nonconformance with laws, rules, regulations, prescribed practices, or ethical standards; strategic risk resulting from adverse business decisions or improper implementation of business decisions; reputation risk that adversely affects earnings or capital arising from negative public opinion; cybersecurity risk related to the dependence of South State and Park Sterling on internal computer systems and the technology of outside service providers, as well as the potential impacts of third-party security breaches, which subjects each company to potential business disruptions or financial losses resulting from deliberate attacks or unintentional events; economic downturn risk resulting from changes in the credit markets, greater than expected noninterest expenses, excessive loan losses and other factors and the implementation of federal spending cuts currently scheduled to go into effect; and other factors that may affect future results of South State and Park Sterling. Additional factors that could cause results to differ materially from those described above can be found in South State’s Annual Report on Form 10-K for the year ended December 31, 2016, which is on file with the Securities and Exchange Commission (the “SEC”) and available in the “Investor Relations” section of South State’s website, http://www.southstatebank.com, under the heading “SEC Filings” and in other documents South State files with the SEC, and in Park Sterling’s Annual Report on Form 10-K for the year ended December 31, 2016, which is on file with the SEC and available on the “Investor Relations” page linked to Park Sterling’s website, http://www.parksterlingbank.com, under the heading “Regulatory Filings” and in other documents Park Sterling files with the SEC. All forward-looking statements speak only as of the date they are made and are based on information available at that time. Neither South State nor Park Sterling assumes any obligation to update forward-looking statements to reflect circumstances or events that occur after the date the forward-looking statements were made or to reflect the occurrence of unanticipated events except as required by federal securities laws. As forward-looking statements involve significant risks and uncertainties, caution should be exercised against placing undue reliance on such statements. IMPORTANT ADDITIONAL INFORMATION In connection with the proposed transaction between South State and Park Sterling, South State will file with the SEC a Registration Statement on Form S-4 that will include a Joint Proxy Statement of South State and Park Sterling and a Prospectus of South State, as well as other relevant documents concerning the proposed transaction. The proposed transaction involving South State and Park Sterling will be submitted to Park Sterling’s shareholders and South State’s shareholders for their consideration. This communication shall not constitute an offer to sell or the solicitation of an offer to buy any securities nor shall there be any sale of securities in any jurisdiction in which such offer, solicitation or sale would be unlawful prior to registration or qualification under the securities laws of such jurisdiction. Shareholders of South State and shareholders of Park Sterling are urged to read the registration statement and the joint proxy statement/prospectus regarding the transaction when it becomes available and any other relevant documents filed with the SEC, as well as any amendments or supplements to those documents, because they will contain important information. Shareholders will be able to obtain a free copy of the definitive joint proxy statement/prospectus, as well as other filings containing information about South State and Park Sterling, without charge, at the SEC’s website (http://www.sec.gov). Copies of the joint proxy statement/prospectus and the filings with the SEC that will be incorporated by reference in the joint proxy statement/prospectus can also be obtained, without charge, by directing a request to South State Corporation, 520 Gervais Street, Columbia, South Carolina 29201, Attention: John C. Pollok, Senior Executive Vice President, CFO and COO, (800) 277-2175 or to Park Sterling Corporation, 1043 E. Morehead Street, Suite 201, Charlotte, North Carolina 28204, Attention: Donald K. Truslow, (704) 323-4292. Participants in THE Solicitation South State, Park Sterling and certain of their respective directors, executive officers and employees may be deemed to be participants in the solicitation of proxies in respect of the proposed transaction. Information regarding South State’s directors and executive officers is available in its definitive proxy statement, which was filed with the SEC on March 6, 2017, and certain of its Current Reports on Form 8-K. Information regarding Park Sterling’s directors and executive officers is available in its definitive proxy statement, which was filed with the SEC on April 13, 2017, and certain of its Current Reports on Form 8-K. Other information regarding the participants in the proxy solicitation and a description of their direct and indirect interests, by security holdings or otherwise, will be contained in the joint proxy statement/prospectus and other relevant materials filed with the SEC. Free copies of this document may be obtained as described in the preceding paragraph.
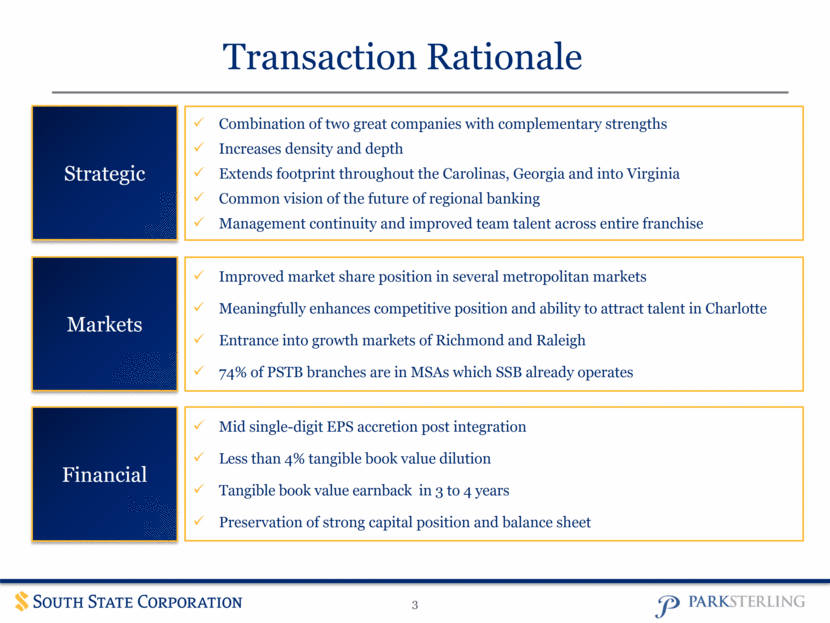
Mid single-digit EPS accretion post integration Less than 4% tangible book value dilution Tangible book value earnback in 3 to 4 years Preservation of strong capital position and balance sheet Financial Improved market share position in several metropolitan markets Meaningfully enhances competitive position and ability to attract talent in Charlotte Entrance into growth markets of Richmond and Raleigh 74% of PSTB branches are in MSAs which SSB already operates Transaction Rationale Markets Strategic Combination of two great companies with complementary strengths Increases density and depth Extends footprint throughout the Carolinas, Georgia and into Virginia Common vision of the future of regional banking Management continuity and improved team talent across entire franchise 3
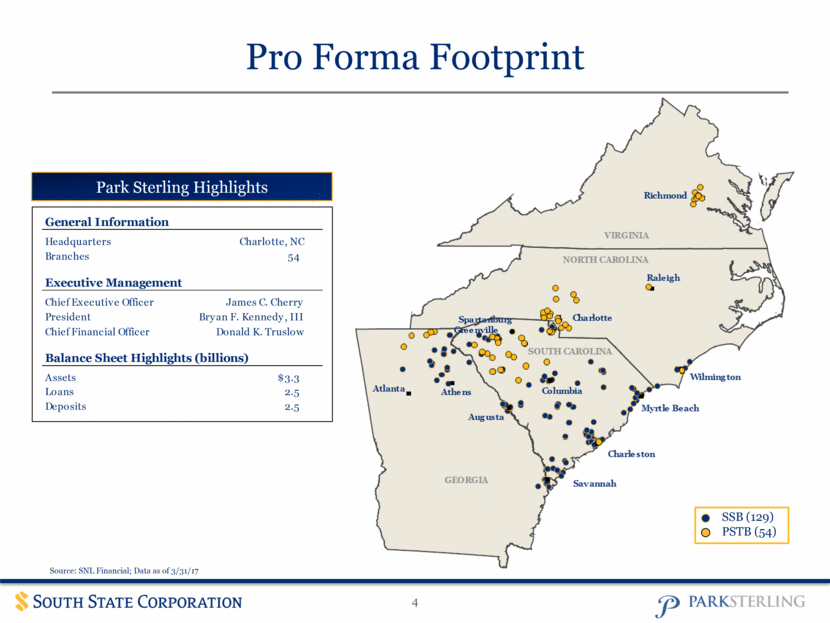
4 Source: SNL Financial; Data as of 3/31/17 Pro Forma Footprint Park Sterling Highlights SSB (129) PSTB (54) General Information Headquarters Charlotte, NC Branches 54 Executive Management Chief Executive Officer James C. Cherry President Bryan F. Kennedy, III Chief Financial Officer Donald K. Truslow Balance Sheet Highlights (billions) Assets $3.3 Loans 2.5 Check for TARP, Deposits 2.5 SBLF, Preferred Etc.
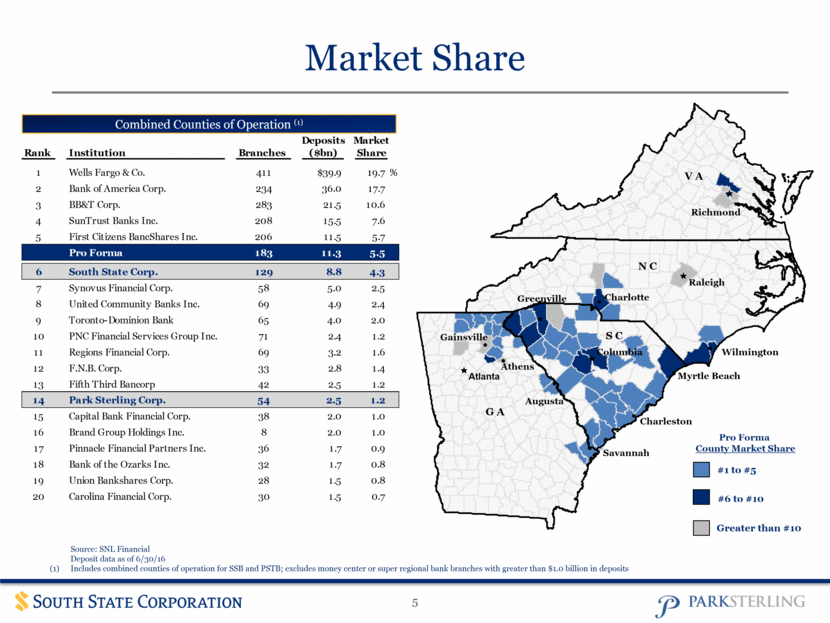
5 Market Share Source: SNL Financial Deposit data as of 6/30/16 Includes combined counties of operation for SSB and PSTB; excludes money center or super regional bank branches with greater than $1.0 billion in deposits Combined Counties of Operation (1) Pro Forma County Market Share #1 to #5 #6 to #10 Greater than #10 V A S C G A N C Atlanta Athens Gainsville Raleigh Charlotte Greenville Columbia Augusta Savannah Charleston Richmond Wilmington Myrtle Beach Deposits Market Rank Institution Branches ($bn) Share 1 Wells Fargo & Co. 411 $39.9 19.7 % 2 Bank of America Corp. 234 36.0 17.7 3 BB&T Corp. 283 21.5 10.6 4 SunTrust Banks Inc. 208 15.5 7.6 5 First Citizens BancShares Inc. 206 11.5 5.7 Pro Forma 183 11.3 5.5 6 South State Corp. 129 8.8 4.3 7 Synovus Financial Corp. 58 5.0 2.5 8 United Community Banks Inc. 69 4.9 2.4 9 Toronto-Dominion Bank 65 4.0 2.0 10 PNC Financial Services Group Inc. 71 2.4 1.2 11 Regions Financial Corp. 69 3.2 1.6 12 F.N.B. Corp. 33 2.8 1.4 13 Fifth Third Bancorp 42 2.5 1.2 14 Park Sterling Corp. 54 2.5 1.2 15 Capital Bank Financial Corp. 38 2.0 1.0 16 Brand Group Holdings Inc. 8 2.0 1.0 17 Pinnacle Financial Partners Inc. 36 1.7 0.9 18 Bank of the Ozarks Inc. 32 1.7 0.8 19 Union Bankshares Corp. 28 1.5 0.8 20 Carolina Financial Corp. 30 1.5 0.7
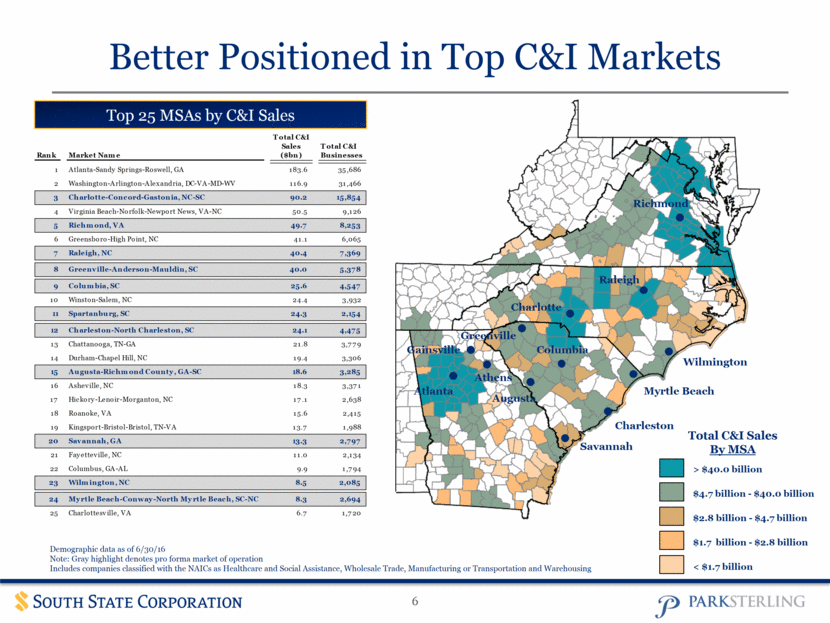
6 Better Positioned in Top C&I Markets Demographic data as of 6/30/16 Note: Gray highlight denotes pro forma market of operation Includes companies classified with the NAICs as Healthcare and Social Assistance, Wholesale Trade, Manufacturing or Transportation and Warehousing Top 25 MSAs by C&I Sales Richmond Raleigh Charlotte Greenville Wilmington Myrtle Beach Charleston Savannah Atlanta Athens Augusta Columbia Gainsville Total C&I Sales By MSA > $40.0 billion $4.7 billion - $40.0 billion $2.8 billion - $4.7 billion $1.7 billion - $2.8 billion < $1.7 billion Total C&I Sales Total C&I Rank Market Name ($bn) Businesses 1 Atlanta-Sandy Springs-Roswell, GA 183.6 35,686 2 Washington-Arlington-Alexandria, DC-VA-MD-WV 116.9 31,466 3 Charlotte-Concord-Gastonia, NC-SC 90.2 15,854 4 Virginia Beach-Norfolk-Newport News, VA-NC 50.5 9,126 5 Richmond, VA 49.7 8,253 6 Greensboro-High Point, NC 41.1 6,065 7 Raleigh, NC 40.4 7,369 8 Greenville-Anderson-Mauldin, SC 40.0 5,378 9 Columbia, SC 25.6 4,547 10 Winston-Salem, NC 24.4 3,932 11 Spartanburg, SC 24.3 2,154 12 Charleston-North Charleston, SC 24.1 4,475 13 Chattanooga, TN-GA 21.8 3,779 14 Durham-Chapel Hill, NC 19.4 3,306 15 Augusta-Richmond County, GA-SC 18.6 3,285 16 Asheville, NC 18.3 3,371 17 Hickory-Lenoir-Morganton, NC 17.1 2,638 18 Roanoke, VA 15.6 2,415 19 Kingsport-Bristol-Bristol, TN-VA 13.7 1,988 20 Savannah, GA 13.3 2,797 21 Fayetteville, NC 11.0 2,134 22 Columbus, GA-AL 9.9 1,794 23 Wilmington, NC 8.5 2,085 24 Myrtle Beach-Conway-North Myrtle Beach, SC-NC 8.3 2,694 25 Charlottesville, VA 6.7 1,720
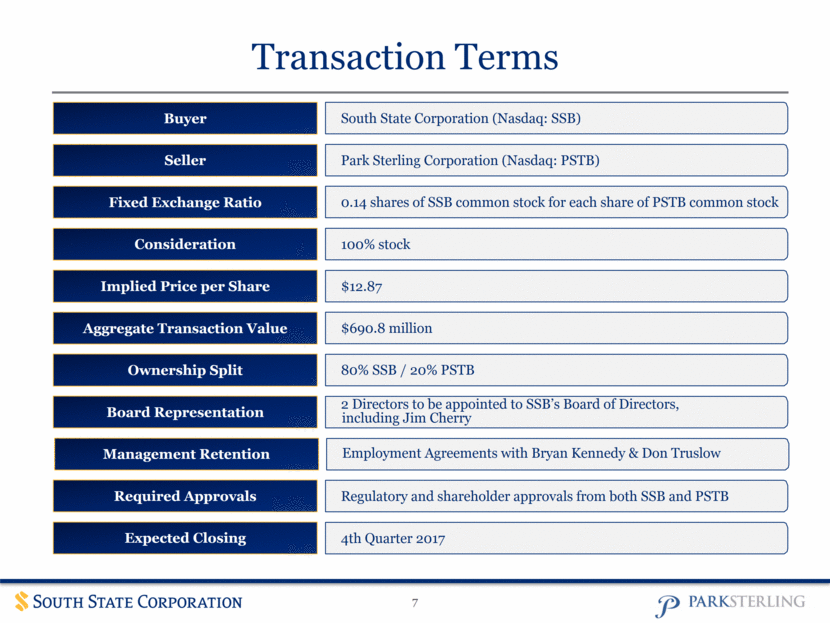
South State Corporation (Nasdaq: SSB) Park Sterling Corporation (Nasdaq: PSTB) 0.14 shares of SSB common stock for each share of PSTB common stock $12.87 $690.8 million 100% stock 80% SSB / 20% PSTB 2 Directors to be appointed to SSB’s Board of Directors, including Jim Cherry Regulatory and shareholder approvals from both SSB and PSTB 4th Quarter 2017 Transaction Terms 7 Buyer Seller Fixed Exchange Ratio Implied Price per Share Aggregate Transaction Value Consideration Ownership Split Board Representation Required Approvals Expected Closing Employment Agreements with Bryan Kennedy & Don Truslow Management Retention
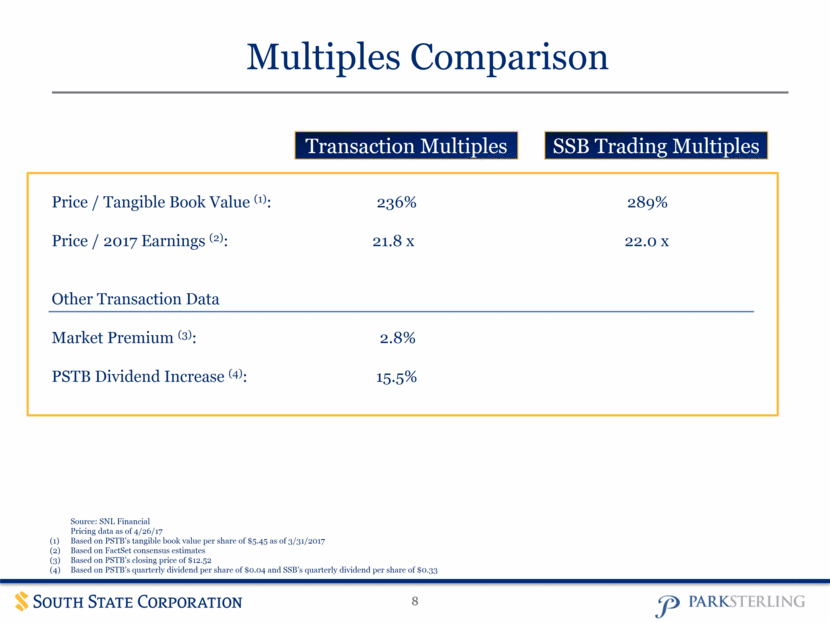
Transaction Multiples 8 Multiples Comparison SSB Trading Multiples Source: SNL Financial Pricing data as of 4/26/17 Based on PSTB’s tangible book value per share of $5.45 as of 3/31/2017 Based on FactSet consensus estimates Based on PSTB’s closing price of $12.52 Based on PSTB’s quarterly dividend per share of $0.04 and SSB’s quarterly dividend per share of $0.33 Price / Tangible Book Value (1): 236% 289% Price / 2017 Earnings (2): 21.8 x 22.0 x Other Transaction Data Market Premium (3): 2.8% PSTB Dividend Increase (4): 15.5%
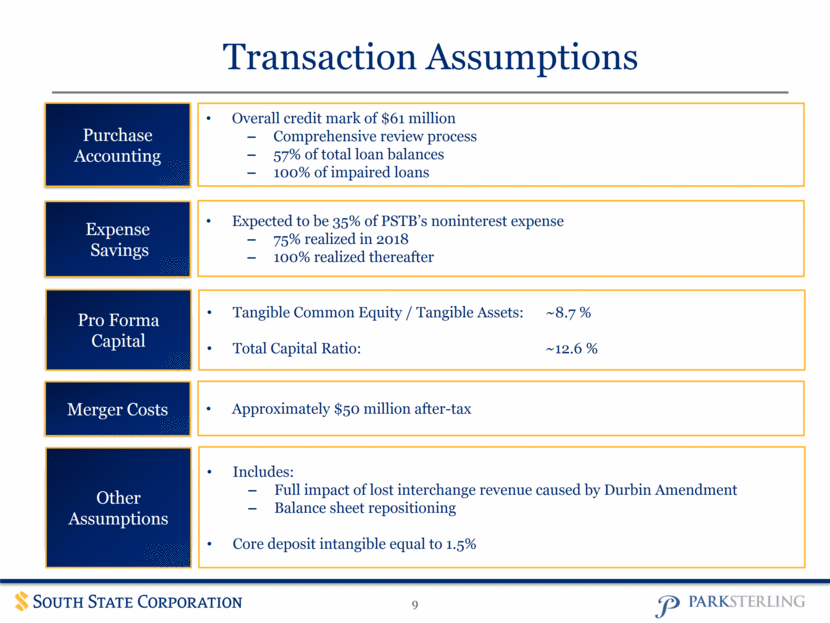
Approximately $50 million after-tax Merger Costs Expected to be 35% of PSTB’s noninterest expense 75% realized in 2018 100% realized thereafter Transaction Assumptions Expense Savings Purchase Accounting Overall credit mark of $61 million Comprehensive review process 57% of total loan balances 100% of impaired loans 9 Tangible Common Equity / Tangible Assets: ~8.7 % Total Capital Ratio: ~12.6 % Pro Forma Capital Includes: Full impact of lost interchange revenue caused by Durbin Amendment Balance sheet repositioning Core deposit intangible equal to 1.5% Other Assumptions
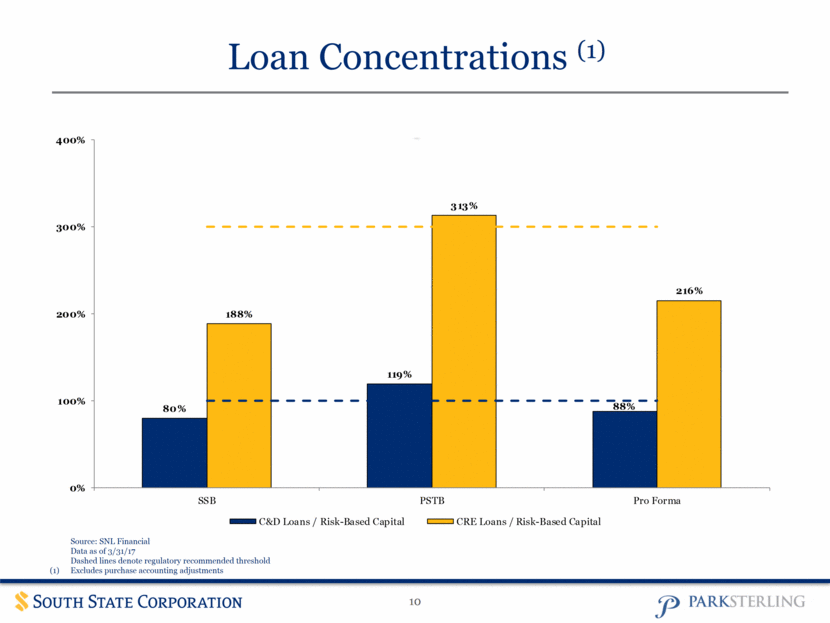
10 Loan Concentrations (1) Source: SNL Financial Data as of 3/31/17 Dashed lines denote regulatory recommended threshold Excludes purchase accounting adjustments 80% 119% 88% 188% 313% 216% 0% 100% 200% 300% 400% SSB PSTB Pro Forma C&D Loans / Risk-Based Capital CRE Loans / Risk-Based Capital
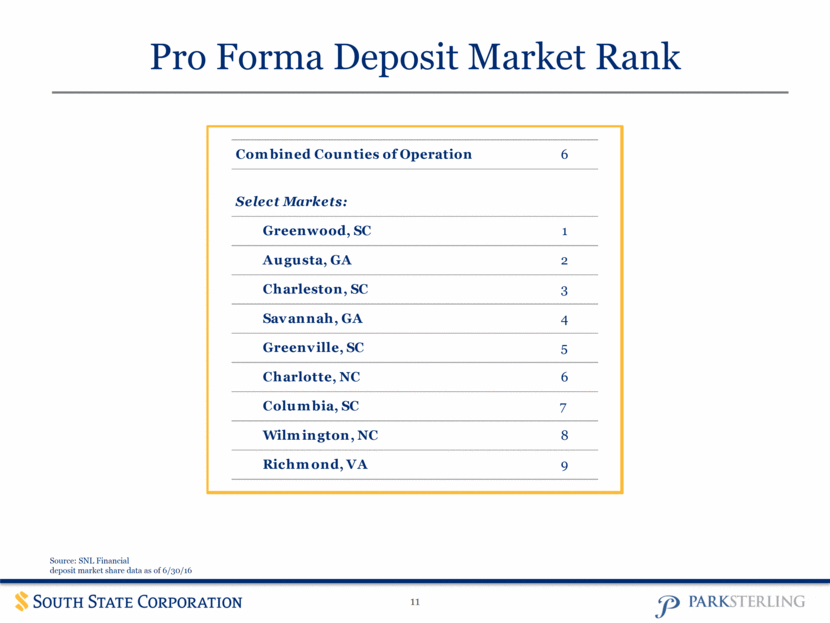
11 Source: SNL Financial deposit market share data as of 6/30/16 Pro Forma Deposit Market Rank Combined Counties of Operation 6 Select Markets: Greenwood, SC 1 Augusta, GA 2 Charleston, SC 3 Savannah, GA 4 Greenville, SC 5 Charlotte, NC 6 Columbia, SC 7 Wilmington, NC 8 Richmond, VA 9
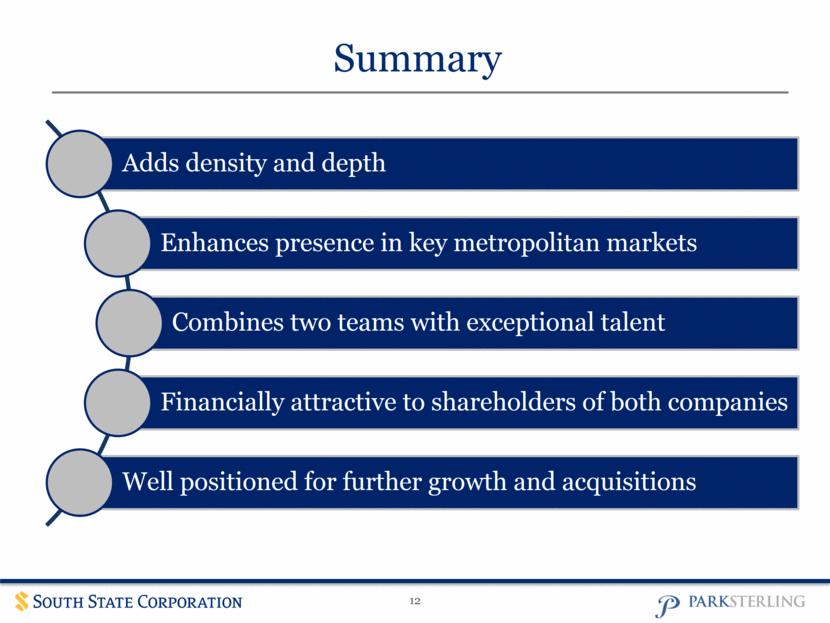
Summary 12 Adds density and depth Enhances presence in key metropolitan markets Combines two teams with exceptional talent Financially attractive to shareholders of both companies Well positioned for further growth and acquisitions
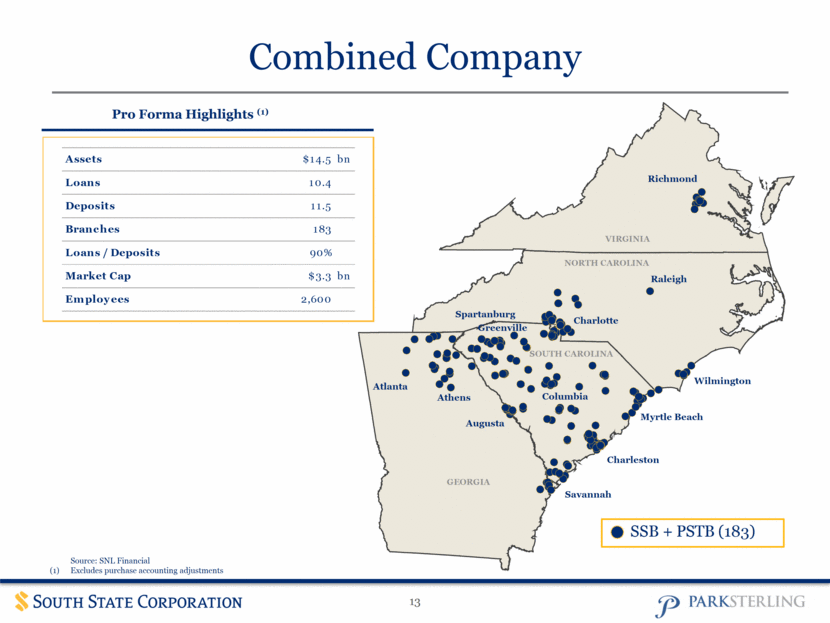
13 Source: SNL Financial (1) Excludes purchase accounting adjustments Combined Company Pro Forma Highlights (1) SSB + PSTB (183) Wilmington Myrtle Beach Charleston Savannah Spartanburg Greenville Atlanta Athens Augusta Columbia Raleigh Charlotte Richmond Assets $14.5 bn Loans 10.4 Deposits 11.5 Branches 183 Loans / Deposits 90% Market Cap $3.3 bn Employees 2,600
Appendix 14
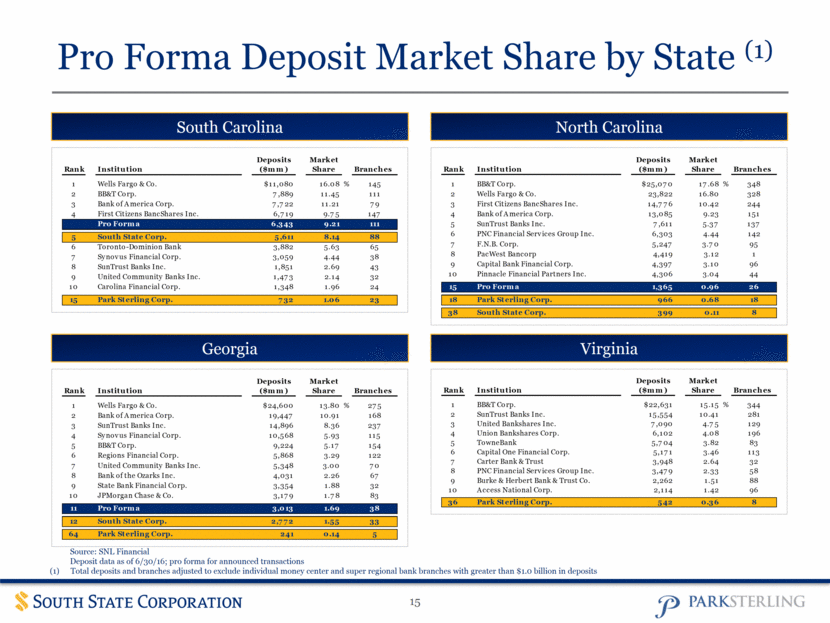
15 Pro Forma Deposit Market Share by State (1) Source: SNL Financial Deposit data as of 6/30/16; pro forma for announced transactions Total deposits and branches adjusted to exclude individual money center and super regional bank branches with greater than $1.0 billion in deposits South Carolina Georgia North Carolina Virginia Deposits Market Rank Institution ($mm) Share Branches 1 Wells Fargo & Co. $11,080 16.08 % 145 2 BB&T Corp. 7,889 11.45 111 3 Bank of America Corp. 7,722 11.21 79 4 First Citizens BancShares Inc. 6,719 9.75 147 Pro Forma 6,343 9.21 111 5 South State Corp. 5,611 8.14 88 6 Toronto-Dominion Bank 3,882 5.63 65 7 Synovus Financial Corp. 3,059 4.44 38 8 SunTrust Banks Inc. 1,851 2.69 43 9 United Community Banks Inc. 1,473 2.14 32 10 Carolina Financial Corp. 1,348 1.96 24 0.00 15 Park Sterling Corp. 732 1.06 23 Deposits Market Rank Institution ($mm) Share Branches 1 BB&T Corp. $25,070 17.68 % 348 2 Wells Fargo & Co. 23,822 16.80 328 3 First Citizens BancShares Inc. 14,776 10.42 244 4 Bank of America Corp. 13,085 9.23 151 5 SunTrust Banks Inc. 7,611 5.37 137 6 PNC Financial Services Group Inc. 6,303 4.44 142 7 F.N.B. Corp. 5,247 3.70 95 8 PacWest Bancorp 4,419 3.12 1 9 Capital Bank Financial Corp. 4,397 3.10 96 10 Pinnacle Financial Partners Inc. 4,306 3.04 44 15 Pro Forma 1,365 0.96 26 18 Park Sterling Corp. 966 0.68 18 38 South State Corp. 399 0.11 8 Deposits Market Rank Institution ($mm) Share Branches 1 Wells Fargo & Co. $24,600 13.80 % 275 2 Bank of America Corp. 19,447 10.91 168 3 SunTrust Banks Inc. 14,896 8.36 237 4 Synovus Financial Corp. 10,568 5.93 115 5 BB&T Corp. 9,224 5.17 154 6 Regions Financial Corp. 5,868 3.29 122 7 United Community Banks Inc. 5,348 3.00 70 8 Bank of the Ozarks Inc. 4,031 2.26 67 9 State Bank Financial Corp. 3,354 1.88 32 10 JPMorgan Chase & Co. 3,179 1.78 83 11 Pro Forma 3,013 1.69 38 12 South State Corp. 2,772 1.55 33 64 Park Sterling Corp. 241 0.14 5 Deposits Market Rank Institution ($mm) Share Branches 1 BB&T Corp. $22,631 15.15 % 344 2 SunTrust Banks Inc. 15,554 10.41 281 3 United Bankshares Inc. 7,090 4.75 129 4 Union Bankshares Corp. 6,102 4.08 196 5 TowneBank 5,704 3.82 83 6 Capital One Financial Corp. 5,171 3.46 113 7 Carter Bank & Trust 3,948 2.64 32 8 PNC Financial Services Group Inc. 3,479 2.33 58 9 Burke & Herbert Bank & Trust Co. 2,262 1.51 88 10 Access National Corp. 2,114 1.42 96 36 Park Sterling Corp. 542 0.36 8
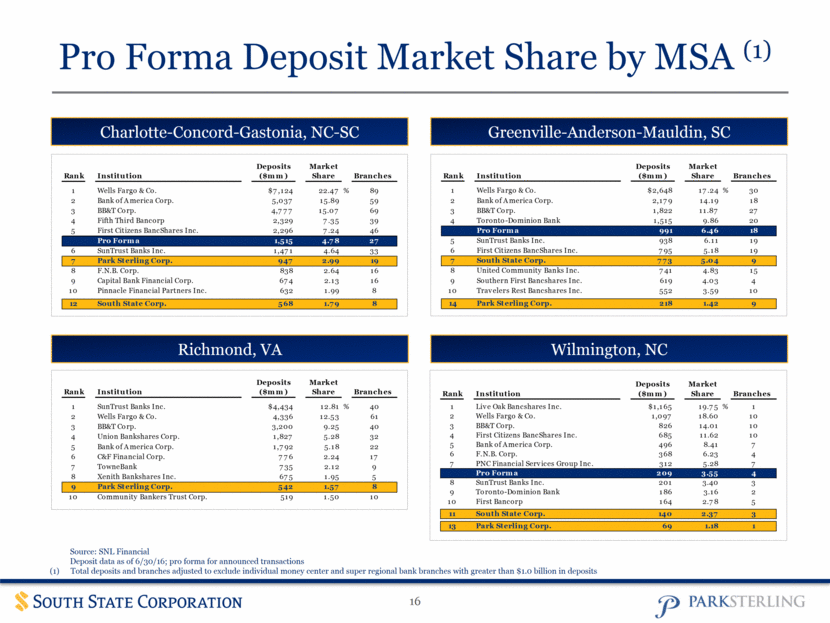
16 Pro Forma Deposit Market Share by MSA (1) Richmond, VA Greenville-Anderson-Mauldin, SC Charlotte-Concord-Gastonia, NC-SC Wilmington, NC Source: SNL Financial Deposit data as of 6/30/16; pro forma for announced transactions Total deposits and branches adjusted to exclude individual money center and super regional bank branches with greater than $1.0 billion in deposits Deposits Market Rank Institution ($mm) Share Branches 1 Wells Fargo & Co. $7,124 22.47 % 89 2 Bank of America Corp. 5,037 15.89 59 3 BB&T Corp. 4,777 15.07 69 4 Fifth Third Bancorp 2,329 7.35 39 5 First Citizens BancShares Inc. 2,296 7.24 46 Pro Forma 1,515 4.78 27 6 SunTrust Banks Inc. 1,471 4.64 33 7 Park Sterling Corp. 947 2.99 19 8 F.N.B. Corp. 838 2.64 16 9 Capital Bank Financial Corp. 674 2.13 16 10 Pinnacle Financial Partners Inc. 632 1.99 8 12 South State Corp. 568 1.79 8 Deposits Market Rank Institution ($mm) Share Branches 1 Wells Fargo & Co. $2,648 17.24 % 30 2 Bank of America Corp. 2,179 14.19 18 3 BB&T Corp. 1,822 11.87 27 4 Toronto-Dominion Bank 1,515 9.86 20 Pro Forma 991 6.46 18 5 SunTrust Banks Inc. 938 6.11 19 6 First Citizens BancShares Inc. 795 5.18 19 7 South State Corp. 773 5.04 9 8 United Community Banks Inc. 741 4.83 15 9 Southern First Bancshares Inc. 619 4.03 4 10 Travelers Rest Bancshares Inc. 552 3.59 10 14 Park Sterling Corp. 218 1.42 9 Deposits Market Rank Institution ($mm) Share Branches 1 SunTrust Banks Inc. $4,434 12.81 % 40 2 Wells Fargo & Co. 4,336 12.53 61 3 BB&T Corp. 3,200 9.25 40 4 Union Bankshares Corp. 1,827 5.28 32 5 Bank of America Corp. 1,792 5.18 22 6 C&F Financial Corp. 776 2.24 17 7 TowneBank 735 2.12 9 8 Xenith Bankshares Inc. 675 1.95 5 9 Park Sterling Corp. 542 1.57 8 10 Community Bankers Trust Corp. 519 1.50 10 Deposits Market Rank Institution ($mm) Share Branches 1 Live Oak Bancshares Inc. $1,165 19.75 % 1 2 Wells Fargo & Co. 1,097 18.60 10 3 BB&T Corp. 826 14.01 10 4 First Citizens BancShares Inc. 685 11.62 10 5 Bank of America Corp. 496 8.41 7 6 F.N.B. Corp. 368 6.23 4 7 PNC Financial Services Group Inc. 312 5.28 7 Pro Forma 209 3.55 4 8 SunTrust Banks Inc. 201 3.40 3 9 Toronto-Dominion Bank 186 3.16 2 10 First Bancorp 164 2.78 5 11 South State Corp. 140 2.37 3 13 Park Sterling Corp. 69 1.18 1
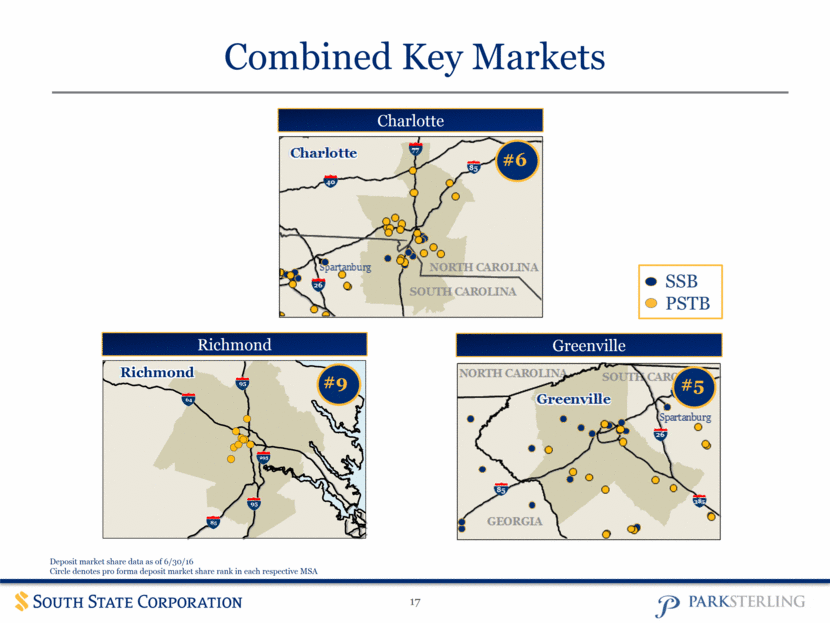
17 Deposit market share data as of 6/30/16 Circle denotes pro forma deposit market share rank in each respective MSA Combined Key Markets 95 85 64 295 95 #9 Charlotte #6 SSB (129) PSTB (54) #5 Greenville Richmond SSB PSTB
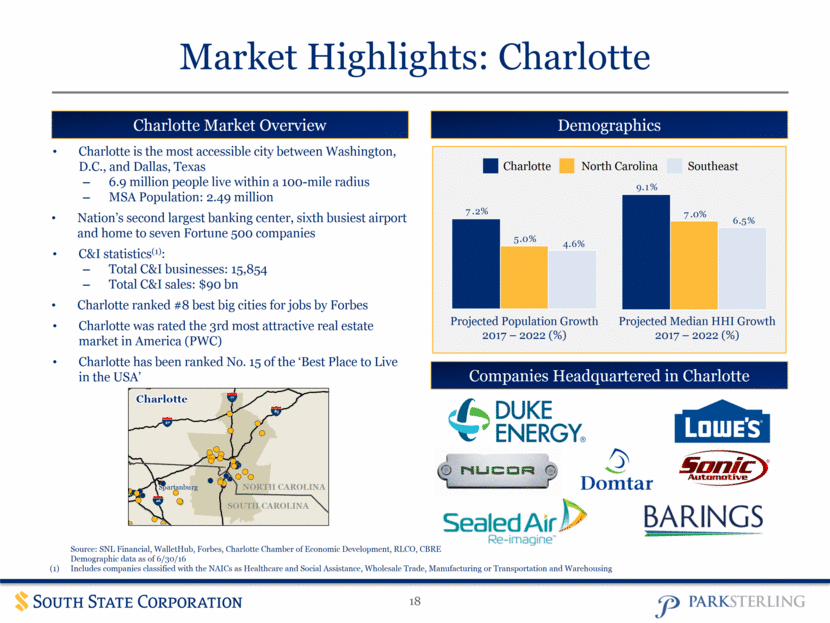
18 Market Highlights: Charlotte Charlotte Market Overview Charlotte is the most accessible city between Washington, D.C., and Dallas, Texas 6.9 million people live within a 100-mile radius MSA Population: 2.49 million Nation’s second largest banking center, sixth busiest airport and home to seven Fortune 500 companies C&I statistics(1): Total C&I businesses: 15,854 Total C&I sales: $90 bn Charlotte ranked #8 best big cities for jobs by Forbes Charlotte was rated the 3rd most attractive real estate market in America (PWC) Charlotte has been ranked No. 15 of the ‘Best Place to Live in the USA’ Demographics Companies Headquartered in Charlotte Projected Population Growth 2017 – 2022 (%) Projected Median HHI Growth 2017 – 2022 (%) Charlotte North Carolina Southeast Source: SNL Financial, WalletHub, Forbes, Charlotte Chamber of Economic Development, RLCO, CBRE Demographic data as of 6/30/16 (1) Includes companies classified with the NAICs as Healthcare and Social Assistance, Wholesale Trade, Manufacturing or Transportation and Warehousing 40 26 77 85 7.2% 5.0% 4.6% 9.1% 7.0% 6.5%
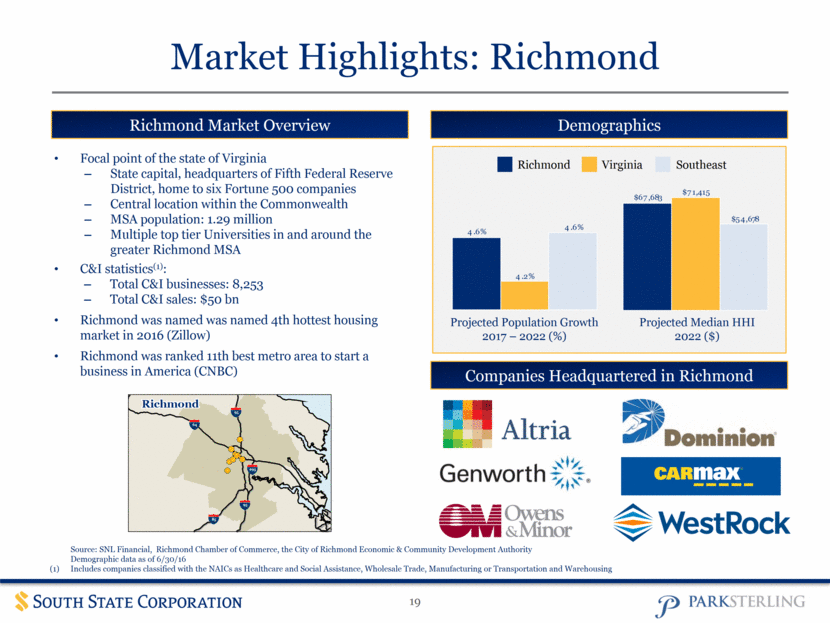
19 Market Highlights: Richmond Richmond Market Overview Demographics Companies Headquartered in Richmond Projected Population Growth 2017 – 2022 (%) Projected Median HHI 2022 ($) Richmond Virginia Southeast Focal point of the state of Virginia State capital, headquarters of Fifth Federal Reserve District, home to six Fortune 500 companies Central location within the Commonwealth MSA population: 1.29 million Multiple top tier Universities in and around the greater Richmond MSA C&I statistics(1): Total C&I businesses: 8,253 Total C&I sales: $50 bn Richmond was named was named 4th hottest housing market in 2016 (Zillow) Richmond was ranked 11th best metro area to start a business in America (CNBC) Source: SNL Financial, Richmond Chamber of Commerce, the City of Richmond Economic & Community Development Authority Demographic data as of 6/30/16 (1) Includes companies classified with the NAICs as Healthcare and Social Assistance, Wholesale Trade, Manufacturing or Transportation and Warehousing 95 85 64 295 95 $67,683 $71,415 $54,678 4.6% 4.2% 4.6%
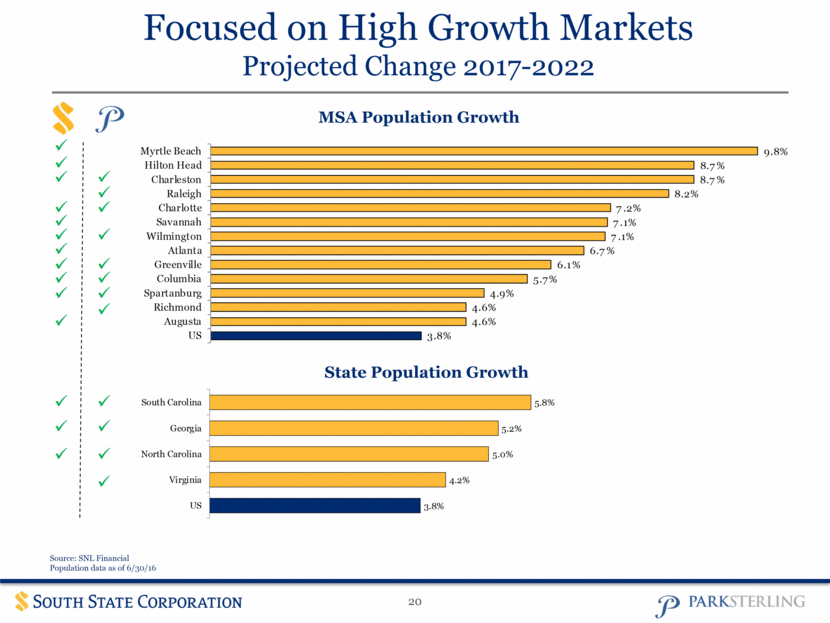
20 Focused on High Growth Markets Projected Change 2017-2022 Source: SNL Financial Population data as of 6/30/16 MSA Population Growth State Population Growth 3.8% 4.6% 4.6% 4.9% 5.7% 6.1% 6.7% 7.1% 7.1% 7.2% 8.2% 8.7% 8.7% 9.8% US Augusta Richmond Spartanburg Columbia Greenville Atlanta Wilmington Savannah Charlotte Raleigh Charleston Hilton Head Myrtle Beach 3.8% 4.2% 5.0% 5.2% 5.8% US Virginia North Carolina Georgia South Carolina
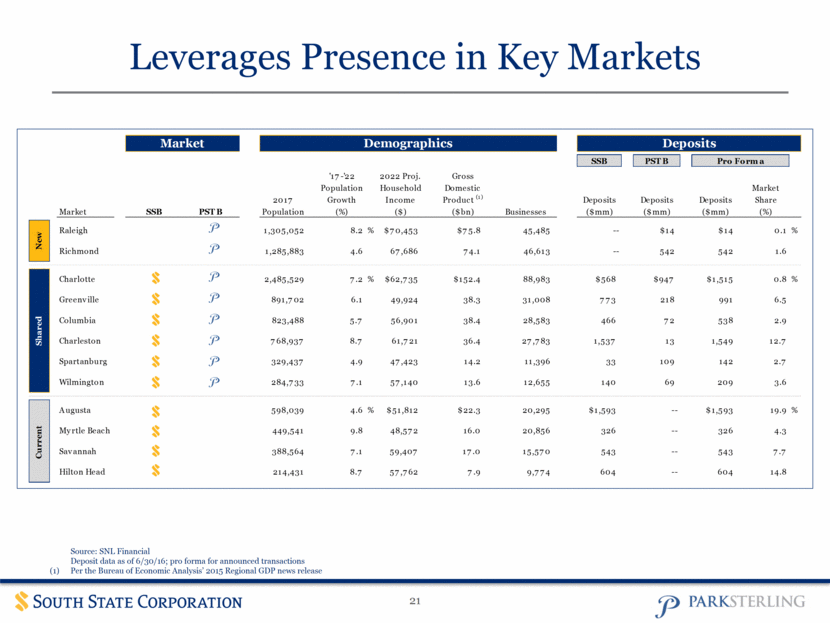
21 Leverages Presence in Key Markets Source: SNL Financial Deposit data as of 6/30/16; pro forma for announced transactions (1) Per the Bureau of Economic Analysis’ 2015 Regional GDP news release Market Demographics Deposits SSB PSTB Pro Forma '17-'22 2022 Proj. Gross Population Household Domestic Market 2017 Growth Income Product (1) Deposits Deposits Deposits Share Market SSB PSTB Population (%) ($) ($bn) Businesses ($mm) ($mm) ($mm) (%) Raleigh 1,305,052 8.2 % $70,453 $75.8 45,485 -- $14 $14 0.1 % Richmond 1,285,883 4.6 67,686 74.1 46,613 -- 542 542 1.6 Charlotte 2,485,529 7.2 % $62,735 $152.4 88,983 $568 $947 $1,515 0.8 % Greenville 891,702 6.1 49,924 38.3 31,008 773 218 991 6.5 Columbia 823,488 5.7 56,901 38.4 28,583 466 72 538 2.9 Charleston 768,937 8.7 61,721 36.4 27,783 1,537 13 1,549 12.7 Spartanburg 329,437 4.9 47,423 14.2 11,396 33 109 142 2.7 Wilmington 284,733 7.1 57,140 13.6 12,655 140 69 209 3.6 Augusta 598,039 4.6 % $51,812 $22.3 20,295 $1,593 -- $1,593 19.9 % Myrtle Beach 449,541 9.8 48,572 16.0 20,856 326 -- 326 4.3 Savannah 388,564 7.1 59,407 17.0 15,570 543 -- 543 7.7 Hilton Head 214,431 8.7 57,762 7.9 9,774 604 -- 604 14.8 Current New Shared
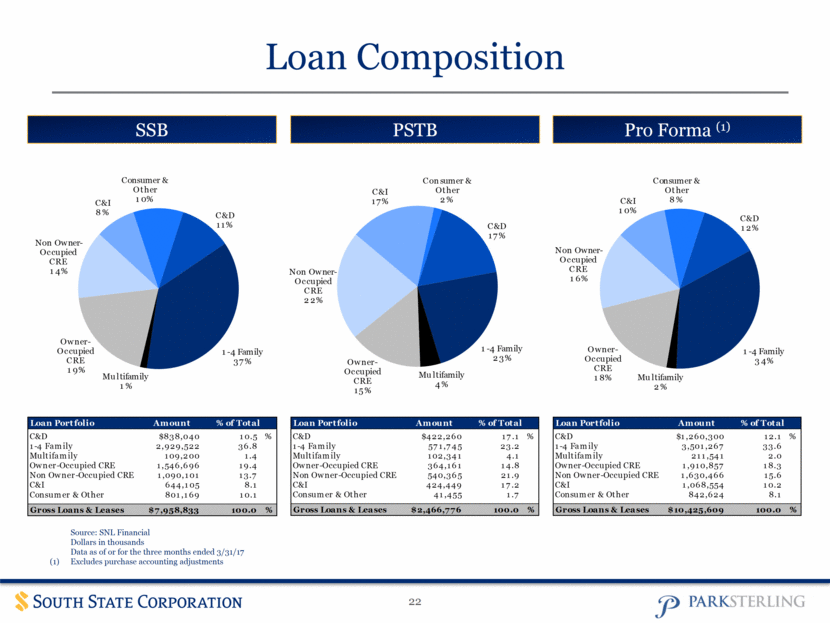
Loan Composition SSB 22 PSTB Pro Forma (1) Source: SNL Financial Dollars in thousands Data as of or for the three months ended 3/31/17 (1) Excludes purchase accounting adjustments C&D 11% 1 - 4 Family 37% Multifamily 1% Owner - Occupied CRE 19% Non Owner - Occupied CRE 14% C&I 8% Consumer & Other 10% C&D 12% 1 - 4 Family 34% Multifamily 2% Owner - Occupied CRE 18% Non Owner - Occupied CRE 16% C&I 10% Consumer & Other 8% C&D 17% 1 - 4 Family 23% Multifamily 4% Owner - Occupied CRE 15% Non Owner - Occupied CRE 22% C&I 17% Consumer & Other 2% Loan Portfolio Amount % of Total C&D $838,040 10.5 % 1-4 Family 2,929,522 36.8 Multifamily 109,200 1.4 Owner-Occupied CRE 1,546,696 19.4 Non Owner-Occupied CRE 1,090,101 13.7 C&I 644,105 8.1 Consumer & Other 801,169 10.1 Gross Loans & Leases $7,958,833 100.0 % Loan Portfolio Amount % of Total C&D $422,260 17.1 % 1-4 Family 571,745 23.2 Multifamily 102,341 4.1 Owner-Occupied CRE 364,161 14.8 Non Owner-Occupied CRE 540,365 21.9 C&I 424,449 17.2 Consumer & Other 41,455 1.7 Gross Loans & Leases $2,466,776 100.0 % Loan Portfolio Amount % of Total C&D $1,260,300 12.1 % 1-4 Family 3,501,267 33.6 Multifamily 211,541 2.0 Owner-Occupied CRE 1,910,857 18.3 Non Owner-Occupied CRE 1,630,466 15.6 C&I 1,068,554 10.2 Consumer & Other 842,624 8.1 Gross Loans & Leases $10,425,609 100.0 %
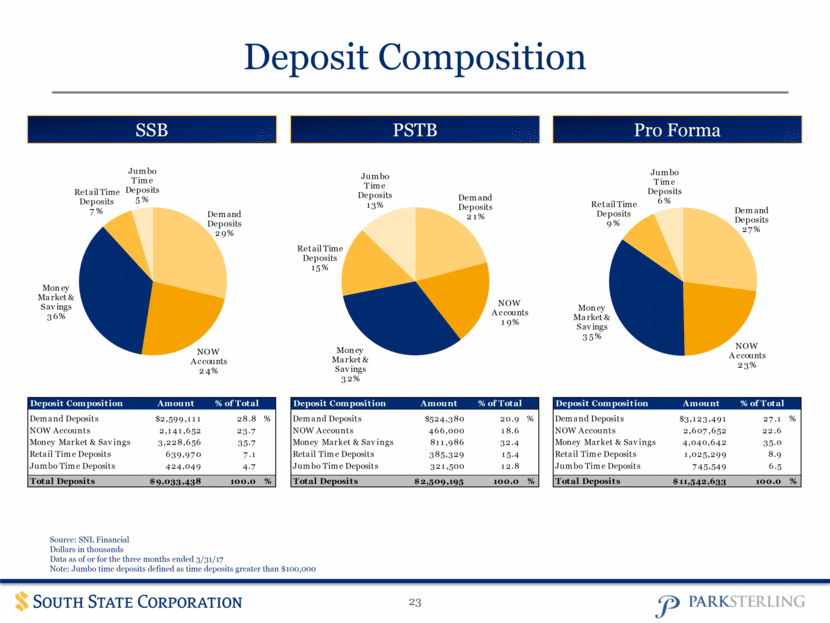
23 SSB PSTB Pro Forma Source: SNL Financial Dollars in thousands Data as of or for the three months ended 3/31/17 Note: Jumbo time deposits defined as time deposits greater than $100,000 Deposit Composition Deposit Composition Amount % of Total Demand Deposits $2,599,111 28.8 % NOW Accounts 2,141,652 23.7 Money Market & Savings 3,228,656 35.7 Retail Time Deposits 639,970 7.1 Jumbo Time Deposits 424,049 4.7 Total Deposits $9,033,438 100.0 % Deposit Composition Amount % of Total Demand Deposits $524,380 20.9 % NOW Accounts 466,000 18.6 Money Market & Savings 811,986 32.4 Retail Time Deposits 385,329 15.4 Jumbo Time Deposits 321,500 12.8 Total Deposits $2,509,195 100.0 % Deposit Composition Amount % of Total Demand Deposits $3,123,491 27.1 % NOW Accounts 2,607,652 22.6 Money Market & Savings 4,040,642 35.0 Retail Time Deposits 1,025,299 8.9 Jumbo Time Deposits 745,549 6.5 Total Deposits $11,542,633 100.0 % Demand Deposits 29% NOW Accounts 24% Money Market & Savings 36% Retail Time Deposits 7% Jumbo Time Deposits 5% Demand Deposits 21% NOW Accounts 19% Money Market & Savings 32% Retail Time Deposits 15% Jumbo Time Deposits 13% Demand Deposits 27% NOW Accounts 23% Money Market & Savings 35% Retail Time Deposits 9% Jumbo Time Deposits 6%
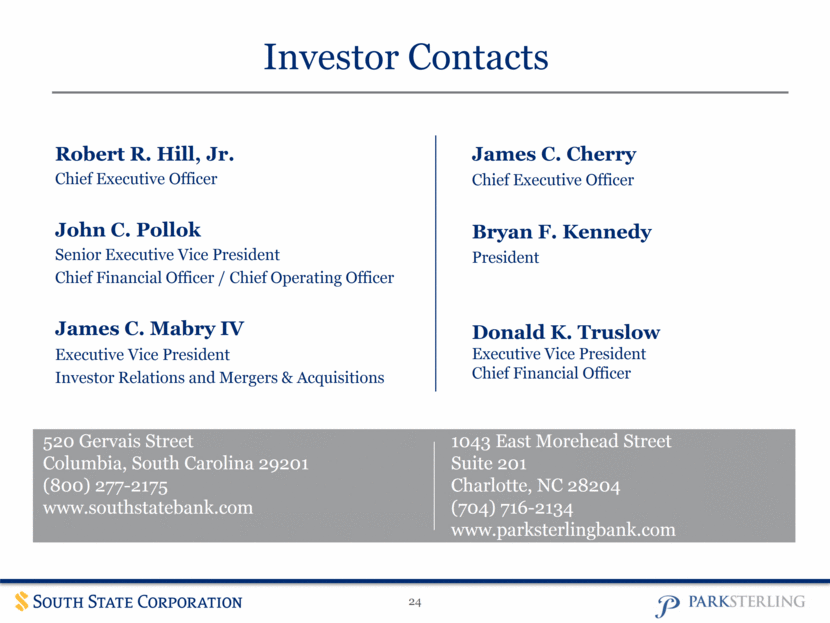
Robert R. Hill, Jr. Chief Executive Officer John C. Pollok Senior Executive Vice President Chief Financial Officer / Chief Operating Officer James C. Mabry IV Executive Vice President Investor Relations and Mergers & Acquisitions 520 Gervais Street Columbia, South Carolina 29201 800-277-2175 www.southstatebank.com Investor Contacts James C. Cherry Chief Executive Officer Bryan F. Kennedy President Donald K. Truslow Executive Vice President Chief Financial Officer 24 1043 East Morehead Street Suite 201 Charlotte, NC 28204 (704) 716-2134 www.parksterlingbank.com 520 Gervais Street Columbia, South Carolina 29201 (800) 277-2175 www.southstatebank.com