Attached files
| file | filename |
|---|---|
| 8-K - FORM 8-K - FIRST PRIORITY FINANCIAL CORP. | d386757d8k.htm |
Exhibit 99.1

First Priority Financial Corp.
Annual Shareholders’ Meeting
April 27th, 2017
Safe Harbor Regarding Forward Looking Statements
This presentation contains certain forward-looking information about First Priority Financial Corp. that is intended to be covered by the safe harbor for forward-looking statements
provided by the Private Securities Litigation Reform Act of 1995. Forward-looking statements are statements that are not historical facts and can be identified by the use of forward-looking terminology such as the words “believes,”
“expects,” “anticipates,” “estimates,” “plans,” “projects,” “predicts,” “intends,” “seeks,” “will,” “may,” “should,” “would,”
“continues,” “hope” and similar expressions, or the negative of these terms. Such statements are based on current expectations and are subject to risks, uncertainties and changes in condition, significance, value, and effect.
Such risks, uncertainties and changes in condition, significance, value and effect could cause First Priority Financial Corp.’s actual results to differ materially from those anticipated events.
Factors, risks, uncertainties, and contingencies that may cause actual results to differ from those anticipated include, but are not limited to, the following: the strength of the
United States economy in general and the strength of the regional and local economies in which First Priority conducts operations; the effects of changing economic conditions in First Priority’s market areas and nationally; the effects of, and
changes in, trade, monetary, and fiscal policies and laws, including interest rate policies of the Board of Governors of the Federal Reserve System; changes in federal and state banking, insurance, and investment laws and regulations which could
impact First Priority’s operations; inflation, interest rate, market, and monetary fluctuations; First Priority’s timely development of competitive new products and services in a changing environment and the acceptance of such products and
services by customers; the impact of changes in financial services policies, laws, and regulations, and the impact of changes in and interpretations of generally accepted accounting principles; the occurrence of adverse changes in the securities
markets; the effects of changes in technology or in consumer spending and savings habits; armed conflicts involving the United States; regulatory or judicial proceedings; changes in asset quality; and First Priority’s success in managing the
risks involved in the foregoing.
You are cautioned not to place undue reliance on any such forward-looking statements, which speak only as of the date of this
presentation.
April 27, 2017 FPFC Annual Shareholder Meeting
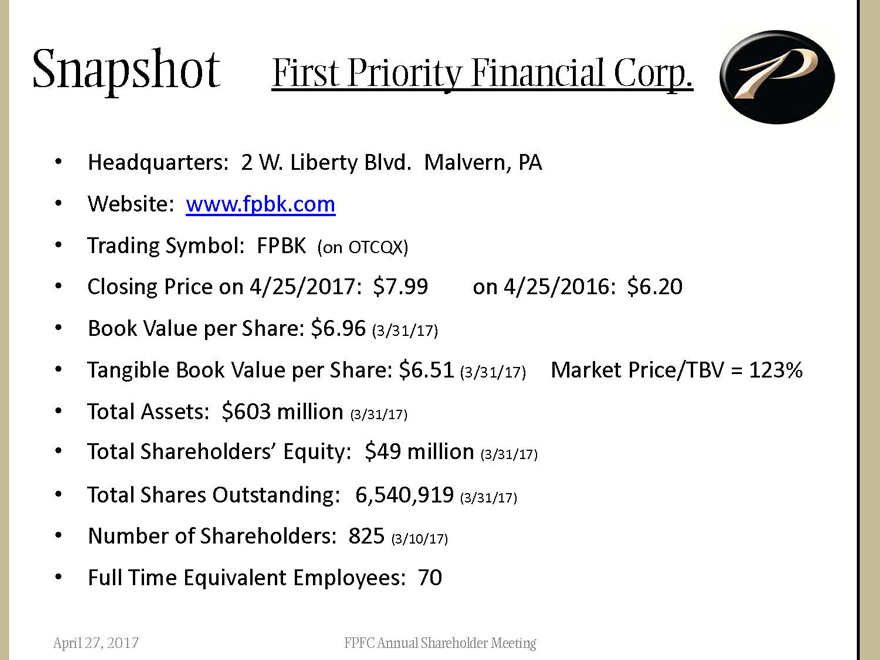
Snapshot First Priority Financial Corp.
Headquarters: 2 W. Liberty Blvd. Malvern, PA
Website: www.fpbk.com
Trading Symbol: FPBK (on OTCQX)
Closing Price on 4/25/2017: $7.99 on 4/25/2016: $6.20
Book Value per Share: $6.96 (3/31/17)
Tangible Book Value per Share: $6.51
(3/31/17) Market Price/TBV = 123%
Total Assets: $603 million (3/31/17)
Total
Shareholders’ Equity: $49 million (3/31/17)
Total Shares Outstanding: 6,540,919 (3/31/17)
Number of Shareholders: 825 (3/10/17)
Full Time Equivalent Employees: 70
April 27, 2017 FPFC Annual Shareholder Meeting
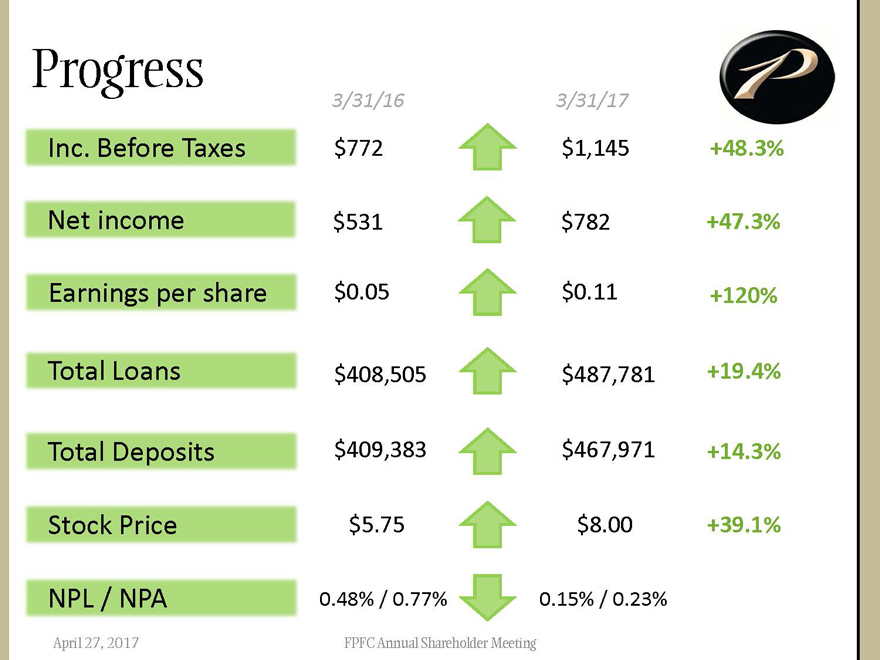
Progress
3/31/16 3/31/17
Inc. Before Taxes $772 $1,145 +48.3%
Net income $531 $782 +47.3%
Earnings per share $0.05 $0.11 +120%
Total Loans $408,505 $487,781 +19.4%
Total Deposits $409,383 $467,971 +14.3%
Stock Price $5.75 $8.00 +39.1%
NPL / NPA 0.48% / 0.77% 0.15% / 0.23%
April 27, 2017 FPFC Annual Shareholder Meeting
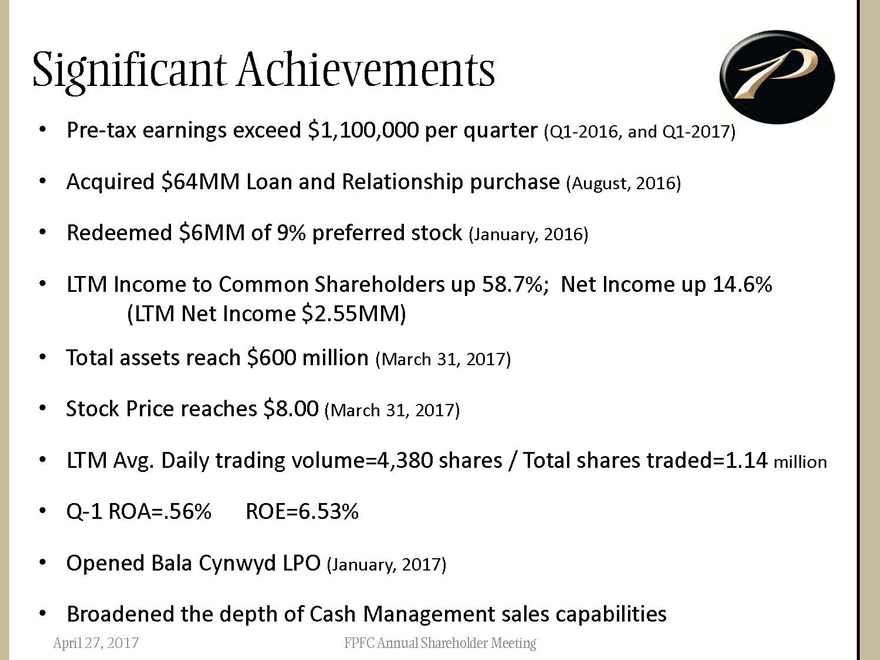
Significant Achievements
Pre-tax earnings exceed $1,100,000 per quarter (Q1-2016, and Q1-2017)
Acquired $64MM Loan and Relationship purchase (August, 2016)
Redeemed $6MM of 9% preferred
stock (January, 2016)
LTM Income to Common Shareholders up 58.7%; Net Income up 14.6%
(LTM Net Income $2.55MM)
Total assets reach $600 million (March 31, 2017)
Stock Price reaches $8.00 (March 31, 2017)
LTM Avg. Daily trading volume=4,380 shares / Total
shares traded=1.14 million
Q-1 ROA=.56% ROE=6.53%
Opened Bala Cynwyd LPO (January, 2017)
Broadened the depth of Cash Management sales
capabilities
April 27, 2017 FPFC Annual Shareholder Meeting
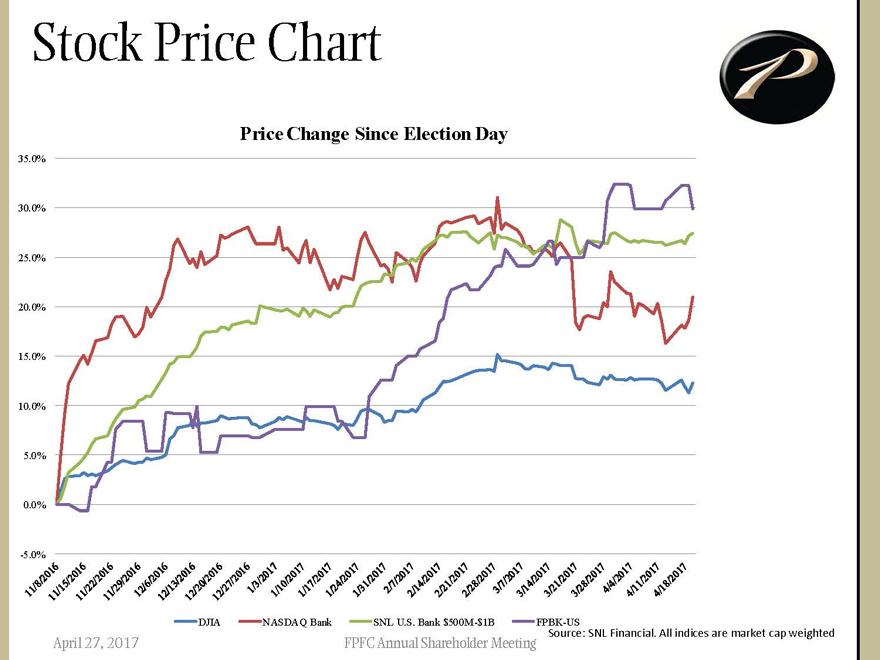
Stock Price Chart
Price
Change Since Election Day
35.0%
30.0%
25.0%
20.0%
15.0%
10.0%
5.0%
0.0%
-5.0%
11/8/2016 11/15/2016 11/22/2016 11/29/2016 12/6/2016 12/13/2016
12/20/2016 12/27/2016 1/3/2017 1/10/2017 1/17/2017 1/24/2017 1/31/2017 2/7/2017 2/14/2017 2/21/2017 2/28/2017 3/7/2017 3/14/2017 3/21/2017 3/28/2017 4/4/2017 4/11/2017 4/18/2017
DJIA NASDAQ Bank SNL U.S. Bank $500M-$1B FPBK-US
Source: SNL Financial. All indices are market cap weighted
April 27,
2017 FPFC Annual Shareholder Meeting
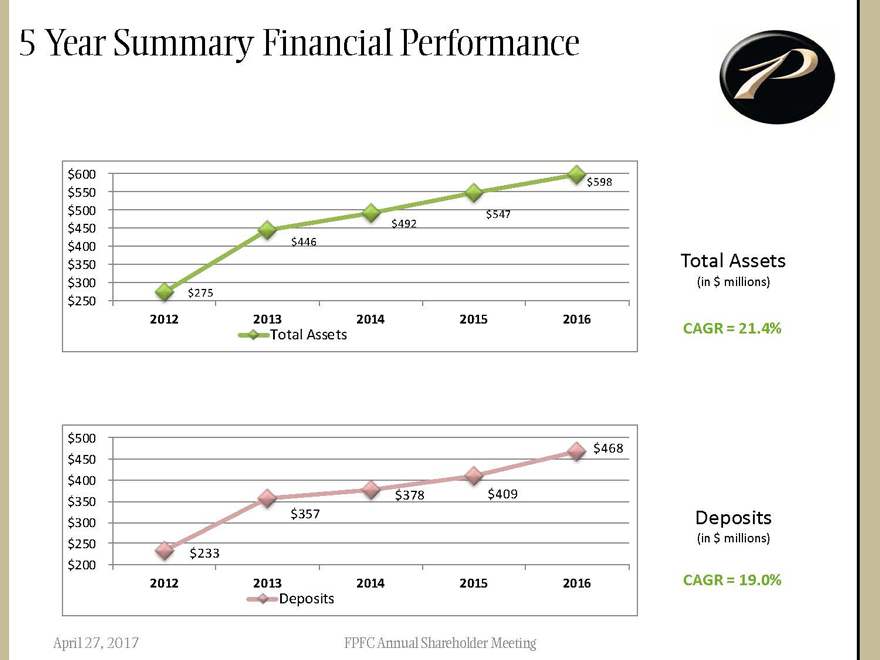
5 Year Summary Financial Performance
$600 $598
$550
$500 $547
$450 $492
$400 $446
$350
$300
$250 $275
2012 2013 2014 2015 2016
Total Assets
Total Assets
(in $ millions)
CAGR = 21.4%
$500 $468
$450
$400
$350 $378 $409
$300 $357
$250 $233
$200
2012 2013 2014 2015 2016
Deposits
Deposits
(in $ millions)
CAGR = 19.0%
April 27, 2017 FPFC Annual Shareholder Meeting
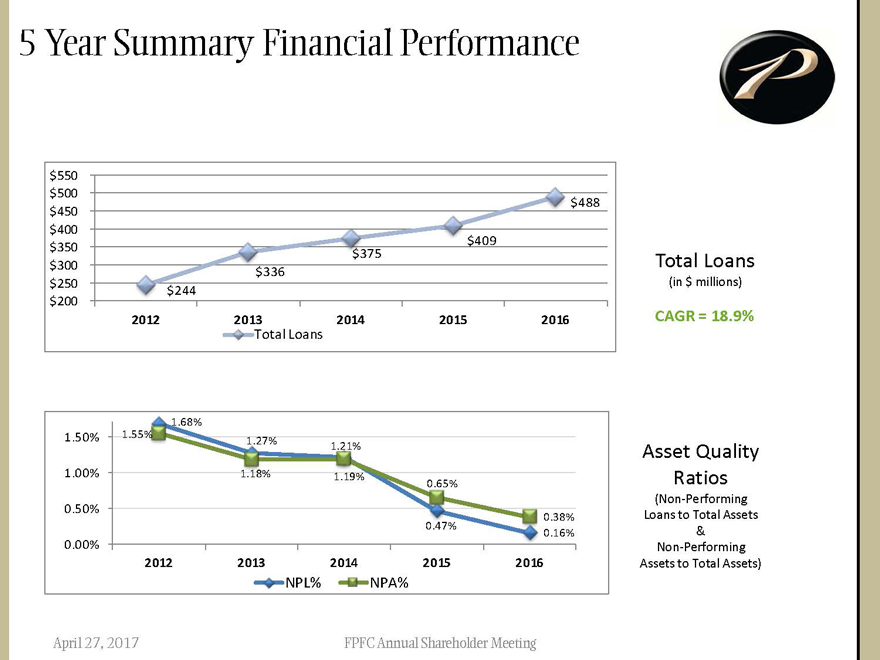
5 Year Summary Financial Performance
$550
$500
$450 $488
$400
$409
$350 $375
$300 $336
$250 $244
$200
2012 2013 2014 2015 2016
Total Loans
Total Loans
(in $ millions)
CAGR = 18.9%
1.68%
1.50% 1.55% 1.27% 1.21%
1.00% 1.18% 1.19% 0.65%
0.50% 0.38%
0.47% 0.16%
0.00%
2012 2013 2014 2015 2016
NPL% NPA%
Asset Quality Ratios
(Non-Performing Loans to Total
Assets & Non-Performing Assets to Total Assets)
April 27, 2017 FPFC Annual Shareholder Meeting
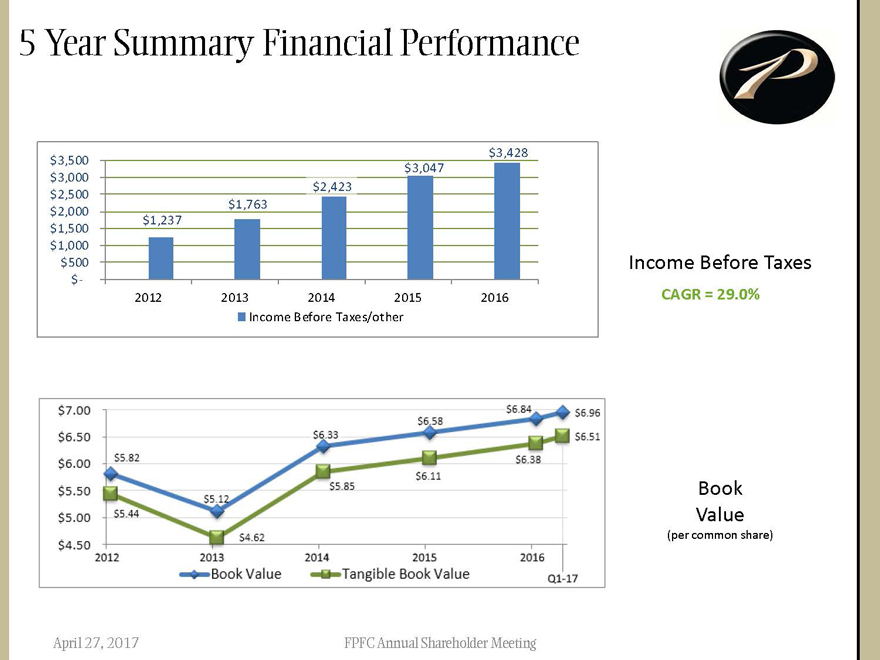
5 Year Summary Financial Performance
P
$3,428
$3,500 $3,047
$3,000
$2,500 $2,423
$2,000 $1,763
$1,500 $1,237
$1,000
$500
$-
2012 2013 2014 2015 2016
Income Before Taxes/other
Income Before Taxes
CAGR = 29.0%
$7.00 $6.50 $6.00 $5.50 $5.00 $4.50
$5.82 $5.44 $5.12 $4.62 $6.33 $5.85 $6.58 $6.11 $6.84
$6.38 $6.96 $6.51
2012 2013 2014 2015 2016
Book Value Tangible Book Value Q1-17
Book Value
(per common share)
April 27, 2017 FPFC Annual Shareholder Meeting
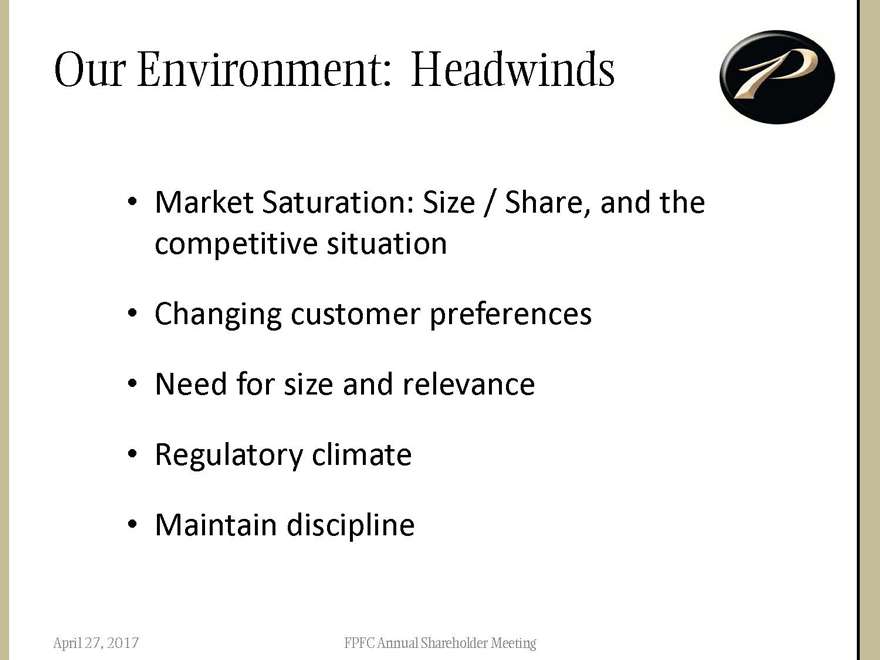
Our Environment: Headwinds
P
Market Saturation: Size / Share, and the competitive situation
Changing customer preferences
Need for size and relevance
Regulatory climate
Maintain discipline
April 27, 2017 FPFC Annual Shareholder Meeting
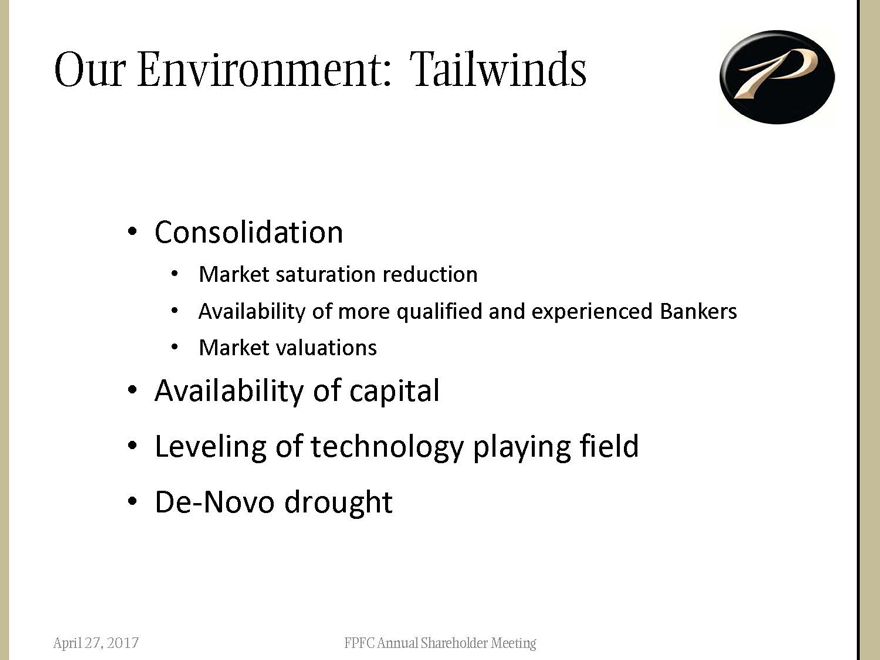
Our Environment: Tailwinds
P
Consolidation
Market saturation reduction
Availability of more qualified and experienced Bankers
Market valuations
Availability of capital
Leveling of technology playing field
De-Novo drought
April 27, 2017 FPFC Annual Shareholder Meeting
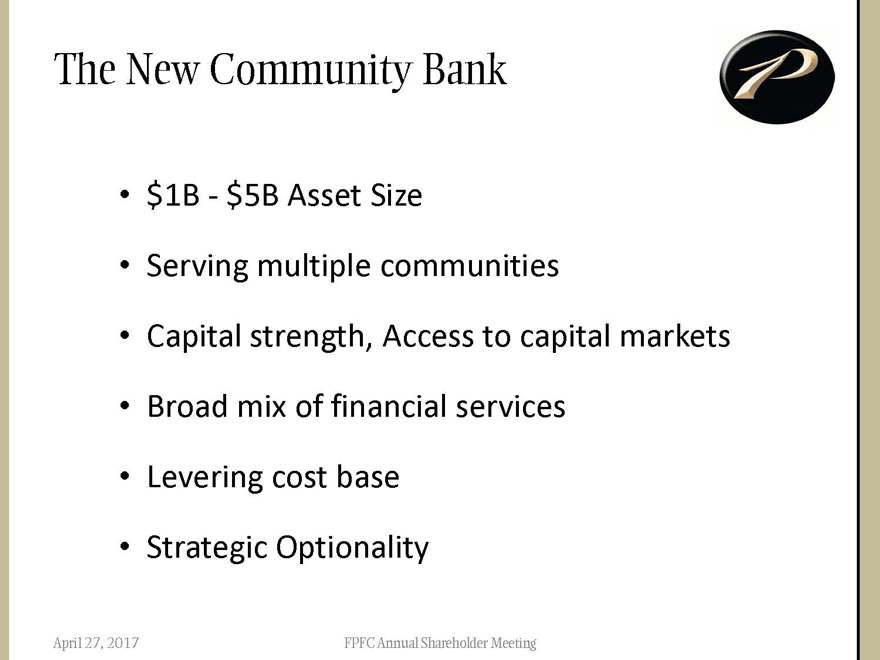
The New Community Bank
P
$1B - $5B Asset Size
Serving multiple communities
Capital strength, Access to capital markets
Broad mix of financial services
Levering cost base
Strategic Optionality
April 27, 2017 FPFC Annual Shareholder Meeting

Progress
P
3/31/16 3/31/17
Inc. Before Taxes $772 $1,145 +48.3%
Net income $531 $782 +47.3%
Earnings per share $0.05 $0.11 +120%
Total Loans $408,505 $487,781 +19.4%
Total Deposits $409,383 $467,971 +14.3%
Stock Price $5.75 $8.00 +39.1%
NPL / NPA 0.48% / 0.77% 0.15% / 0.23%
April 27, 2017 FPFC Annual Shareholder Meeting