Attached files
| file | filename |
|---|---|
| EX-99.1 - EX-99.1 - CALIFORNIA WATER SERVICE GROUP | a17-11989_1ex99d1.htm |
| 8-K - 8-K - CALIFORNIA WATER SERVICE GROUP | a17-11989_18k.htm |
Exhibit 99.2
California Water Service Group First Quarter 2017 Earnings Call Presentation April 27, 2017

Forward-Looking Statements This presentation contains forward-looking statements within the meaning established by the Private Securities Litigation Reform Act of 1995 ("Act"). The forward-looking statements are intended to qualify under provisions of the federal securities laws for "safe harbor" treatment established by the Act. Forward-looking statements are based on currently available information, expectations, estimates, assumptions and projections, and management's judgment about the California drought and its effect on the Company. Words such as would, expects, intends, plans, believes, estimates, assumes, anticipates, projects, predicts, forecasts or variations of such words or similar expressions are intended to identify forward-looking statements. The forward-looking statements are not guarantees of future performance. They are subject to uncertainty and changes in circumstances. Actual results may vary materially from what is contained in a forward-looking statement. Factors that may cause a result different than expected or anticipated include, but are not limited to: governmental and regulatory commissions' decisions; changes in regulatory commissions' policies and procedures; the timeliness of regulatory commissions' actions concerning rate relief; eminent domain actions affecting our water systems; electric power interruptions; the ability to successfully implement conservation measures; changes in customer water use patterns; the impact of weather and climate on water sales and operating results; and, other risks and unforeseen events. When considering forward-looking statements, you should keep in mind the cautionary statements included in this paragraph, as well as the annual 10-K, Quarterly 10-Q, and other reports filed from time-to-time with the Securities and Exchange Commission (SEC). The Company assumes no obligation to provide public updates of forward-looking statements. 2

Marty Kropelnicki President & CEO Tom Smegal Vice President, CFO & Treasurer Paul Townsley Vice President, Regulatory Matters & Corporate Development 3

Presentation Overview Financial Results for the First Quarter Financial Highlights Q1 2017-Q1 2016 EPS Bridge Regulatory Update Drought and Winter Storm Update Financial Effects of the Drought Net WRAM receivable 2011-present Water Quality Initiatives Cap Ex 2007 Recorded to 2018 Projected Rate Base 2014 recorded to 2019 projected What’s next in 2017? • • • • • • • • • • • 4

5 Financial Results: First Quarter (amounts are in millions, except for EPS) Q1 2016 Q1 2017 Variance Operating Revenue $121.7 $122.0 0.3% Operating Expenses 115.5 114.0 -1.3% Income from Operations 6.3 8.0 28.4% Other Income 0.3 1.3 386.1% Net Interest 7.3 8.2 12.0% Net Income/Loss -$0.8 $1.1 EPS -$0.02 $0.02

Financial Highlights – Q1 6 • Quarterly earnings increase of $1.9 million, largely attributable to: o Increase in revenue of $11.5 million from GRC rate increases o Decrease of $1.8 million in incremental drought-related costs o Increase in other income of $1.0 million, primarily due to implementation of allowance for equity funds used during construction (AFUDC) •Company-and developer-funded capital investments were $51.9 million, a decrease of 8.3% compared to Q1 2016 due in part to wet weather

-$0.02 7 EPS Bridge Q1 2016 to Q1 2017 $0.10 $0.08 $0.06 $0.04 $0.02 $0.00 -$0.02 -$0.04 -$0.06 $0.081 $0.003$0.02 $0.016 -$0.043 $0.024 -$0.041

Notes to Quarterly EPS Changes Increased rate relief is driven by recent GRC decisions. Change in unbilled revenue accrual is seasonal and reflects changes due to weather and other factors. Increased depreciation is consistent with $236.3 million additional capital investment placed into service in 2016 and depreciation rates adopted in the GRC. First quarter drought response costs were reduced from $2.0 million in 2016 to $0.2 million in 2017. Governor Brown ended the drought state of emergency in April except for four counties in the San Joaquin valley. • • • • The GRC allowed use of AFUDC rates for construction financing costs in the GRC cycle. The AFUDC income represents the change in regulatory asset and is expected to increase during the year as the company spends capital. • See Forward-Looking Statements for factors which could cause actual results to differ materially from expectations presented here. 8

2017 California GRC Adopted Revenue (in millions) by Month Total 2017 Adopted Revenue of $648.2M $80 $70 $60 $50 $40 $30 $20 $10 $0 63.3 46.4 9 68.067.069.5 59.5 52.1 52.0 41.541.742.045.0

California Regulatory Update New tariff rates in effect January 1 as approved in the GRC decision Filed cost of capital application on April 3, 2017 Requested 10.75% ROE and 53.4% equity capital structure Beginning of a process which will set cost of capital beginning in 2018 • • Company in the planning stages of its 2018 GRC filing 10 See Forward-Looking Statements for factors which could cause actual results to differ materially from expectations presented here.

Other Regulatory Notes California escalation increases of $17.2 million in 2018 and $16.3 million in 2019 are subject to earnings test which reviews capital investment performance $30 million of aggregate California advice letter revenue will be included in rates after completion of specific projects through 2019 • • In the first quarter, Cal Water filed two advice letters for $0.9 million annual revenue which became effective on April 15, 2017 Company will file an application to incorporate Travis Air Force Base into its California service territory in the second quarter Hawaii Water is in process with a $1.5 million rate increase request for its Pukalani sewer service area • • • See Forward-Looking Statements for factors which could cause actual results to differ materially from expectations presented here. 11

12 See Forward-Looking Statements for factors which could cause actual results to differ materially from expectations presented here. DroughtandWinter StormUpdate • California moved from five-year drought to the wettest water year in California history o As of April 21, precipitation in northern Sierra is 209% of annual average o Snow accumulations are 191% of average for date • On April 7, Governor Brown declared an end to the drought emergency in 54 of California’s 58 counties o Two Cal Water districts remain under a declared drought; they serve San Joaquin Valley cities where groundwater was impacted by five years of drought o Drought surcharges were suspended on July 29, 2016 • First step toward permanent water use regulations released by the State Board in January, start of a multi-year process

costs on earnings) since 2008 with WRAM 2016 through Q2 2017 drought costs later in 2017 the first quarter filing as part of the adopted Sales Reconciliation Mechanism 13 Financial Effects of the Drought •Cal Water has been “decoupled” (minimizes effect of sales and production o Sales decline will not reduce profits o Revenue accrual, not included in WRAM, is a temporary impact o During the drought, the WRAM receivable balance declined •Since drought emergency is ended, Cal Water anticipates filing to recover •Due to continued sales decline, net WRAM receivable may grow in 2017 •Extremely wet winter led to lower recorded sales and an increase in WRAM receivable in •2017 undercollection will be billed as surcharges beginning in 2018 •Cal Water will have the opportunity to adjust adopted sales along with its 2018 escalation See Forward-Looking Statements for factors which could cause actual results to differ materially from expectations presented here.
Net WRAM Receivable Balance (in millions) (End of Year balance except current period) $60 $48 $50 $46 $45 $45 $37 $40 $30 $20 $10 $0 2011 2012 2013 2014 2015 2016 3/31/2016 14 $51 $40

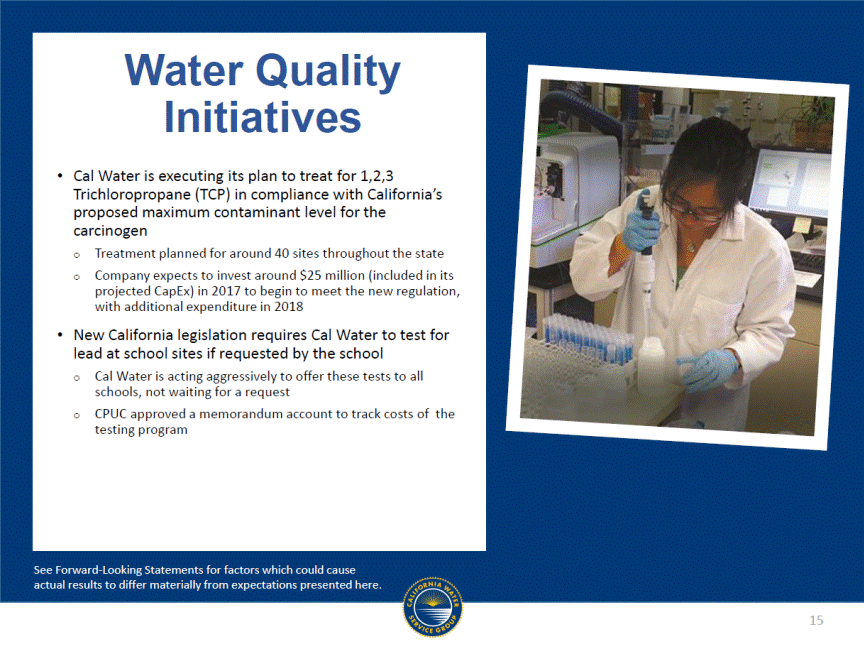
15 See Forward-Looking Statements for factors which could cause actual results to differ materially from expectations presented here. WaterQuality Initiatives • Cal Water is executing its plan to treat for 1,2,3 Trichloropropane (TCP) in compliance with California’s proposed maximum contaminant level for the carcinogen o Treatment planned for around 40 sites throughout the state o Company expects to invest around $25 million (included in its projected CapEx) in 2017 to begin to meet the new regulation, with additional expenditure in 2018 • New California legislation requires Cal Water to test for lead at school sites if requested by the school o Cal Water is acting aggressively to offer these tests to all schools, not waiting for a request o CPUC approved a memorandum account to track costs of the testing program
Capital (in millions) Investment History and Projection $250 $200 $150 $118 $116 $113 $111 $108 $99 $100 $50 $0 2007 2008 2009 2010 2011 2012 2013 2014 2015 2016 *2017 *2018 *2017-2018 amounts are based upon Company projections including 2015 California Rate Case decision See Forward-Looking Statements for factors which could cause actual results to differ materially from expectations presented here. 16 $229 CAGR = 13.0% (2007-2016)$177 $210$215 $131 $76 Q1 2017 $51.9M

Regulated (in millions) Rate Base of CWT $1,600 $1,400 $1,200 $1,058 $1,000 $800 $600 $400 $200 $0 2014 2015 2016 Est. 2017 Est. 2018 Est. 2019 See Forward-Looking Statements for factors which could cause actual results to differ materially from expectations presented here. 17 $1,399* $1,249* $1,140* $978$1,004

What’s next in 2017? • • Ongoing proceedings in cost of capital application anticipated throughout the summer. Company continues to focus on capital investment to comply with California’s proposed 1,2,3-Trichlorpropane (TCP) regulation, pass 2018 escalation earnings tests, and complete “advice letter” projects on schedule. With $51.9 million invested to date, we project $200-$220 million for the full year. Drought response expenses should end in Q2, followed by a request to recover 2016-2017 costs. Cal Water will begin lead testing in schools within our service areas. • • 18 See Forward-Looking Statements for factors which could cause actual results to differ materially from expectations presented here.

Discussion
