Attached files
| file | filename |
|---|---|
| EX-31.1 - EX-31.1 - Allied World Assurance Co Holdings, AG | a2231777zex-31_1.htm |
| EX-31.2 - EX-31.2 - Allied World Assurance Co Holdings, AG | a2231777zex-31_2.htm |
UNITED STATES
SECURITIES AND EXCHANGE COMMISSION
WASHINGTON, D.C. 20549
Form 10-K/A
(Amendment No. 1)
| (Mark One) | | |
ý |
|
ANNUAL REPORT PURSUANT TO SECTION 13 OR 15(d) OF THE SECURITIES EXCHANGE ACT OF 1934 |
For the fiscal year ended December 31, 2016 |
||
OR |
||
o |
|
TRANSITION REPORT PURSUANT TO SECTION 13 OR 15(d) OF THE SECURITIES EXCHANGE ACT OF 1934 |
For the transition period from to |
||
Commission file number: 001-32938
ALLIED WORLD ASSURANCE COMPANY HOLDINGS, AG
(Exact Name of Registrant as Specified in Its Charter)
| Switzerland (State or Other Jurisdiction of Incorporation or Organization) |
| 98-0681223 (I.R.S. Employer Identification No.) |
Gubelstrasse 24, Park Tower, 15th Floor, 6300 Zug, Switzerland
(Address of Principal Executive Offices and Zip Code)
41-41-768-1080
(Registrant’s Telephone Number, Including Area Code)
Securities registered pursuant to Section 12(b) of the Act:
| Title of Each Class |
| Name of Each Exchange on Which Registered |
|---|---|---|
| Common Shares, par value CHF 4.10 per share | | New York Stock Exchange, Inc. |
Securities registered pursuant to Section 12(g) of the Act: None
Indicate by check mark if the registrant is a well-known seasoned issuer, as defined in Rule 405 of the Securities Act. Yes ý No o
Indicate by check mark if the registrant is not required to file reports pursuant to Section 13 or Section 15(d) of the Act. Yes o No ý
Indicate by check mark whether the registrant (1) has filed all reports required to be filed by Section 13 or 15(d) of the Securities Exchange Act of 1934 during the preceding 12 months (or for such shorter period that the registrant was required to file such reports), and (2) has been subject to such filing requirements for the past 90 days. Yes ý No o
Indicate by check mark whether the registrant has submitted electronically and posted on its corporate Web site, if any, every Interactive Data File required to be submitted and posted pursuant to Rule 405 of Regulation S-T (§232.405 of this chapter) during the preceding 12 months (or for such shorter period that the registrant was required to submit and post such files). Yes ý No o
Indicate by check mark if disclosure of delinquent filers pursuant to Item 405 of Regulation S-K is not contained herein, and will not be contained, to the best of the registrant’s knowledge, in the definitive proxy or information statements incorporated by reference in Part III of this Form 10-K or any amendment to this Form 10-K. ý
Indicate by check mark whether the registrant is a large accelerated filer, an accelerated filer, a non-accelerated filer, a smaller reporting company, or an emerging growth company. See the definitions of “large accelerated filer,” “accelerated filer,” “smaller reporting company,” and “emerging growth company” in Rule 12b-2 of the Exchange Act.
| Large accelerated filer o | | Accelerated filer o | | Non-accelerated filer o (Do not check if a smaller reporting company) |
|
Smaller reporting company o Emerging growth company o |
If an emerging growth company, indicate by check mark if the registrant has elected not to use the extended transition period for complying with any new or revised financial accounting standards provided pursuant to Section 13(a) of the Exchange Act. o
Indicate by check mark whether the registrant is a shell company (as defined in Rule 12b-2 of the Act). Yes o No ý
The aggregate market value of common shares held by non-affiliates of the registrant as of June 30, 2016 (the last business day of the registrant’s most recently completed second fiscal quarter) was approximately $3.1 billion based on the closing sale price of the registrant’s common shares on the New York Stock Exchange on that date.
As of February 22, 2017, 87,316,864 common shares were outstanding.
TABLE OF CONTENTS
-i-
On February 28, 2017, Allied World Assurance Company Holdings, AG (the “company”) filed its Annual Report on Form 10-K for the fiscal year ended December 31, 2016 (the “Original Form 10-K”). This Amendment No. 1 (the “Amendment”, and together with the Original Form 10-K, the “Form 10-K”) amends Part III, Items 10 through 14 of the Original Form 10-K to include information previously omitted from the Original Form 10-K in reliance on General Instruction G(3) to Form 10-K. General Instruction G(3) to Form 10-K provides that registrants may incorporate by reference certain information from a definitive proxy statement that involves the election of directors if such definitive proxy statement is filed with the Securities and Exchange Commission (the “SEC”) within 120 days after the end of the fiscal year. The company does not anticipate that its definitive proxy statement involving the election of directors will be filed by April 30, 2017 (i.e., within 120 days after the end of the company’s 2016 fiscal year). Accordingly, Part III of the Original Form 10-K is hereby amended and restated as set forth below.
In addition, as required by Rule 12b-15 under the Securities Exchange Act of 1934, as amended, new certifications by our principal executive officer and principal financial officer are filed as exhibits to this Amendment under Item 15 of Part IV hereof.
Except as stated herein, this Amendment does not reflect events occurring after the filing of the Original Form 10-K with the SEC on February 28, 2017 and no attempt has been made in this Amendment to modify or update other disclosures as presented in the Original Form 10-K.
-ii-
Item 10. Directors, Executive Officers and Corporate Governance.
Board of Directors
The company’s board of directors (the “Board”) currently consists of eight
members. The biography of each current director below contains information regarding the person’s service as a director on the Board, his or her business experience, director positions
at other companies held currently or at any time during the last five years, and his or her applicable experiences, qualifications, attributes and skills.
| | | | | |
| | Barbara T. Alexander, 68 | | ||
| | | | | |
| |
Position, Principal Occupation and Business Experience: Ms. Alexander has been an independent consultant since January 2004. Prior to that, she was a Senior Advisor to UBS AG and predecessor firms from October 1999 to January 2004, and Managing Director of the North American Construction and Furnishings Group in the Corporate Finance Department of UBS from 1992 to October 1999. From 1987 to 1992, Ms. Alexander was a Managing Director in the Corporate Finance Department of Salomon Brothers Inc. From 1972 to 1987, she held various positions at Salomon Brothers, Smith Barney, Investors Diversified Services, and Wachovia Bank and Trust Company. Ms. Alexander is currently a member of the board of directors of QUALCOMM Incorporated, where she is Chairperson of the Compensation Committee; and Choice Hotels International, Inc., where she is Chairperson of the Audit Committee and a member of the Diversity Committee. Ms. Alexander previously served on the board of directors of KB Home from October 2010 to April 2014, Federal Home Loan Mortgage Corporation (Freddie Mac) from November 2004 to March 2010, Centex Corporation from July 1999 to August 2009, Burlington Resources Inc. from January 2004 to March 2006 and Harrah’s Entertainment Inc. from February 2002 to April 2007. Ms. Alexander was selected as one of seven Outstanding Directors in Corporate America in 2003 by Board Alert magazine and was one of five Director of the Year honorees in 2008 by the Forum for Corporate Directors. She has also served on the board of directors of HomeAid America, Habitat for Humanity International and Covenant House. Key Attributes, Experience and Skills: Having been a member of numerous public company boards of directors, Ms. Alexander is familiar with a full range of corporate and board functions. She also has extensive experience in corporate finance, investment and strategic planning matters. The Board believes that, among other qualifications, Ms. Alexander’s extensive experience in corporate finance, investment and strategic planning matters gives her the skills to serve as a director. |
|
Director Since: August 2009 Board Committees: Audit (Chair), Compensation, Enterprise Risk and Investment Other Current Public Boards: QUALCOMM Incorporated (NASDAQ: QCOM) and Choice Hotels International (NYSE: CHH) |
-1-
| | | | | |
| | Scott A. Carmilani, 52 | | ||
| | | | | |
| |
Position, Principal Occupation and Business Experience: Mr. Carmilani was elected our President and Chief Executive Officer in January 2004 and was appointed Chairman of the Board in January 2008. Mr. Carmilani was, prior to joining our company as Executive Vice President in February 2002, the President of the Mergers & Acquisition Insurance Division of subsidiaries of American International Group, Inc. (“AIG”) and responsible for the management, marketing and underwriting of transactional insurance products for clients engaged in mergers, acquisitions or divestitures. Mr. Carmilani was previously the Regional Vice-President overseeing the New York general insurance operations of AIG. Before that he was the Divisional President of the Middle Market Division of National Union Fire Insurance Company of Pittsburgh, Pa., which underwrites directors and officers liability, employment practice liability and fidelity insurance for middle-market-sized companies. Prior to joining our company, he held a succession of underwriting and management positions with subsidiaries of AIG since 1987. Mr. Carmilani is currently a member of the board of trustees of the Visiting Nurse Association (VNA) Health Group, Inc. of New Jersey. Key Attributes, Experience and Skills: The Board believes that, among other qualifications, Mr. Carmilani’s extensive expertise and experience in the insurance and reinsurance industry give him the skills to serve as a director. |
|
Director Since: September 2003 Board Committees: Executive (Chair) Other Current Public Boards: None |
|
| | | |||
| | | | | |
| | Bart Friedman, 72 | | ||
| | | | | |
| |
Position, Principal Occupation and Business Experience: Mr. Friedman was elected Vice Chairman of the Board in July 2006 and was appointed Lead Independent Director of the Board in January 2008. Mr. Friedman was a partner at Cahill Gordon & Reindel LLP, a New York law firm (“Cahill”), from 1980 to 2016 and has served as Senior Counsel at Cahill since January 2017. Mr. Friedman specializes in corporate governance, special committees and director representation. Mr. Friedman worked early in his career at the SEC. Mr. Friedman is currently chairman of the board of directors of Sanford Bernstein Mutual Funds, where he is a member of the Audit Committee and the Nominating and Governance Committee, and a member of the board of directors of Ovid Therapeutics Inc., where he is chairman of the Audit Committee. He is also the chairman of the Audit Committee of The Brookings Institution, a member of the board of directors of the Lincoln Center for the Performing Arts, where he is chairman of the Audit Committee and the Compensation Committee, and a member of the board of trustees of the Cooper-Hewitt Smithsonian Design Museum, where he serves as Treasurer. Key Attributes, Experience and Skills: The Board believes that, among other qualifications, Mr. Friedman’s extensive expertise and experience in corporate governance and investment matters give him the skills to serve as a director. |
|
Director Since: March 2006 Lead Independent Director Board Committees: Compensation, Investment and Nominating & Corporate Governance (Chair) Other Current Public Boards: Sanford Bernstein Mutual Funds |
-2-
| | | | | |
| | Patricia L. Guinn, 62 | | ||
| | | | | |
| |
Position, Principal Occupation and Business Experience: Ms. Guinn retired from Towers Watson in June 2015 where she served as Managing Director of its Risk and Financial Services segment and a member of its Management Committee since 2010. Prior to this, she held a variety of leadership roles at Towers Perrin, one of Towers Watson’s predecessor companies, which she joined in 1976. For more than 30 years, Ms. Guinn has consulted on risk management, mergers and acquisitions, financial analysis and performance measurement for insurance companies. She is currently a member of the board of directors of Reinsurance Group of America, Incorporated. Ms. Guinn previously served on the board of directors of Towers Perrin from 2001 to 2005 and again from 2008 to 2010. Ms. Guinn is currently a director of the International Insurance Society. She is a Fellow of the Society of Actuaries, a member of the American Academy of Actuaries and a Chartered Enterprise Risk Analyst. Key Attributes, Experience and Skills: The Board believes that, among other qualifications, Ms. Guinn’s extensive experience in the insurance and reinsurance industry as well as expertise with risk management matters give her the skills to serve as a director. |
|
Director Since: December 2015 Board Committees: Audit, Enterprise Risk and Nominating & Corporate Governance Other Current Public Boards: Reinsurance Group of America, Incorporated (NYSE: RGA) |
|
| | | |||
| | | | | |
| | Fiona E. Luck, 59 | | ||
| | | | | |
| |
Position, Principal Occupation and Business Experience: Ms. Luck served as Executive Vice President and Chief of Staff at XL Group plc (“XL”) from June 2006 until June 2009 and then Special Advisor to the Chief Executive Officer until January 2010. From 1999 to 2006, she served in various roles at XL, including as Executive Vice President of Group Operations and Interim Chief Financial Officer. From 1997 to 1999, she served as Senior Vice President of Financial Lines and later as Executive Vice President of Joint Ventures and Strategic Alliances at ACE Bermuda Insurance Ltd. From 1983 to 1997, she served in various roles at Marsh and McLennan, Inc., including as Managing Director and Head of the Global Broking operations in Bermuda. She is currently a member of the board of directors of the Bermuda Monetary Authority where she serves on its Audit & Risk Management Committee, Human Capital Committee and Non-Executive Directors Committee; and Gen Life Ltd and Gen Two Ltd. She previously served on the board of directors of Catlin Group Ltd from August 2012 until its merger with XL in May 2015 where she was Chair of the Compensation Committee and a member of the Audit, Investment and Nomination Committees. She also served on the board of directors of Kenbelle Capital LP from 2012 to 2015, Hardy Underwriting Bermuda Ltd. from 2010 to 2012 and Primus Guaranty Ltd. from 2007 to 2009. Ms. Luck also serves on the board of trustees of the David Shepherd Wildlife Foundation and the board of directors of Knowledge Quest. She is a member of the Institute of Chartered Accountants of Scotland. Key Attributes, Experience and Skills: The Board believes that, among other qualifications, Ms. Luck’s extensive expertise and experience in the insurance and reinsurance industry give her the skills to serve as a director. |
|
Director Since: December 2015 Board Committees: Compensation, Enterprise Risk and Executive Other Current Public Boards: None |
-3-
| | | | | |
| | Patrick de Saint-Aignan, 68 | | ||
| | | | | |
| |
Position, Principal Occupation and Business Experience: Mr. de Saint-Aignan held multiple positions at Morgan Stanley internationally from 1974 to 2007, where he was a Managing Director and, most recently, an Advisory Director. He held responsibilities in corporate finance and capital markets and headed successively Morgan Stanley’s global fixed income derivatives and debt capital markets activities, its office in Paris, France, and the firm-wide risk management function. He was also a Founder, Director and Chairman of the International Swaps and Derivatives Association (1985-1992); Censeur on the Supervisory Board of IXIS Corporate and Investment Bank (2005-2007); a member of the board of directors of Bank of China Limited (2006-2008), where he was Chairman of the Audit Committee and a member of the Risk Policy Committee and the Personnel and Remuneration Committee; and a member of the board of directors and non-executive Chairman of the European Kyoto Fund (2010-2011). Mr. de Saint-Aignan is currently a member of the board of directors of State Street Corporation, where he is a member of its Risk Committee and its Examining and Audit Committee. Key Attributes, Experience and Skills: The Board believes that, among other qualifications, Mr. de Saint-Aignan’s broad experience and expertise in corporate finance, risk management and investment matters as well as his international business background give him the skills to serve as a director. |
|
Director Since: August 2008 Board Committees: Audit, Compensation, Enterprise Risk (Chair) and Investment Other Current Public Boards: State Street Corporation (NYSE: STT) |
-4-
| | | | | |
| | Eric S. Schwartz, 54 | | ||
| | | | | |
| |
Position, Principal Occupation and Business Experience: Mr. Schwartz is the founder and has been Chief Executive Officer of 76 West Holdings, a private investment company, since June 2008. In support of the activities of 76 West, he has served as Chairman of Applied Data Finance, LLC, a non-prime consumer finance company, since November 2014; as a director of Demica Limited, a trade finance company, since July 2014; as former Chairman and more recently a director of Jefferson National Financial Corp., an insurance company focused on the variable annuity market, since January 2012; as Chairman of Gold Bullion International LLC, a precious metals dealer, since January 2012; as a director of Indostar Capital Finance, a finance company based in India, since April 2011; and as a director of Binary Event Network, an electronic prediction marketplace, since May 2011. He served as a director of Atlanta Hawks Basketball & Entertainment, LLC from March 2014 to June 2015. He also served as Chairman-elect of Nikko Asset Management from June 2008 until its sale in June 2009; and as a director of Prosper Marketplace, an internet-based consumer lending company, from March 2012 until January 2013. Mr. Schwartz is a former Co-CEO of Goldman Sachs Asset Management. He joined The Goldman Sachs Group, Inc. (“Goldman Sachs”) in 1984 and served in various leadership positions at the firm during his tenure at Goldman Sachs. In 1994, he became a partner in the Equity Capital Markets unit of Goldman Sachs’ Investment Banking Division and later served as Co-Head of its Global Equities and Investment Management Divisions. He joined Goldman Sachs’ Management Committee in 2001 and was named Co-Head of its Partnership Committee in 2005. In June 2007, he retired from Goldman Sachs. He serves as a member of the Investment Committee for the endowment of UJA-Federation New York, where he served as its Chairman for many years, and as a director of the Food Bank for New York City, Securing America’s Future Energy, City Harvest and The Jewish Community Center Krakow, Poland. Key Attributes, Experience and Skills: The Board believes that, among other qualifications, Mr. Schwartz’s broad experience and expertise in corporate finance and investment matters as well as his international business background give him the skills to serve as a director. |
|
Director Since: October 2013 Board Committees: Compensation and Investment (Chair) Other Current Public Boards: None |
-5-
| | | | | |
| | Samuel J. Weinhoff, 66 | | ||
| | | | | |
| |
Position, Principal Occupation and Business Experience: Mr. Weinhoff has served as a consultant to the insurance industry since 2000. Prior to this, Mr. Weinhoff was head of the Financial Institutions Group for Schroder & Co. from 1997 until 2000. He was also a Managing Director at Lehman Brothers, where he worked from 1985 to 1997. Mr. Weinhoff had ten years prior experience at the Home Insurance Company and the Reliance Insurance Company in a variety of positions, including excess casualty reinsurance treaty underwriter, investment department analyst, and head of corporate planning and reporting. Mr. Weinhoff is currently the Lead Director on the board of directors of Infinity Property and Casualty Corporation where he is a member of the Executive Committee and Chairman of the Nominating and Governance Committee. Mr. Weinhoff served on the board of directors of Inter-Atlantic Financial, Inc. from July 2007 to October 2009. Key Attributes, Experience and Skills: The Board believes that, among other qualifications, Mr. Weinhoff’s extensive insurance and reinsurance industry experience as well as expertise in corporate finance and strategic planning matters give him the skills to serve as a director. |
|
Director Since: July 2006 Board Committees: Audit, Compensation (Chair), Enterprise Risk, Executive, Investment and Nominating & Corporate Governance Other Current Public Boards: Infinity Property and Casualty Corporation (NASDAQ: IPCC) |
| Board and Committee Membership(1) |
Name
|
| Audit
|
| Compensation
|
| Enterprise Risk
|
| Executive
|
| Investment
|
| Nominating
|
|---|---|---|---|---|---|---|---|---|---|---|---|---|
Barbara T. Alexander* |
| C |
| · |
| · |
| |
| · |
| |
Scott A. Carmilani |
| | | | C |
| | |||||
Bart Friedman** |
| |
| · |
| |
| |
| · |
| C |
Patricia L. Guinn* |
| · |
| | · |
| | | · |
|||
Fiona E. Luck* |
| |
| · |
| · |
| · |
| |
| |
Patrick de Saint-Aignan* |
| · |
| · |
| C |
| | · |
| ||
Eric S. Schwartz* |
| |
| · |
| |
| |
| C |
| |
Samuel J. Weinhoff* |
| · |
| C |
| · |
| · |
| · |
| · |
| | | | | | | | | | | | | |
Number of 2016 Meetings |
| 5 |
| 4 |
| 4 |
| 0 |
| 4 |
| 3 |
· Member |
|
C Chair |
|
* Independent Director |
|
** Lead Independent Director |
- (1)
- All committees, except the Executive Committee, are comprised of independent directors only.
Director Independence
The Board has determined that Mses. Alexander, Guinn and Luck, and Messrs. Friedman, de Saint-Aignan, Schwartz and Weinhoff are independent directors under the listing standards of the New York Stock Exchange (the “NYSE”). We require that a majority of our directors meet the criteria for independence under applicable law and the rules of the NYSE. The Board has adopted a policy to assist it and the Nominating & Corporate Governance Committee in their determination as to whether a nominee or director qualifies as independent. This policy contains categorical standards for determining independence and includes the independence standards required by the SEC and the NYSE, as well as standards published by institutional investor groups and other corporate governance experts. In making its determination of independence, the Board applied these standards for director independence and determined that no material relationship existed between the company and these directors. A copy of the Board Policy on Director Independence was attached as an appendix to the company’s Proxy Statement filed with the SEC on March 13, 2015.
-6-
Meetings and Committees of the Board
During the year ended December 31, 2016, there were fifteen meetings of our Board, five meetings of the Audit Committee, four meetings of the Compensation Committee, four meetings of the Enterprise Risk Committee, no meeting of the Executive Committee, four meetings of the Investment Committee and three meetings of the Nominating & Corporate Governance Committee. Each of our directors other than Mr. Friedman attended at least 75% of the aggregate number of Board meetings and committee meetings of which he or she was a member during the period he or she served on the Board. Mr. Friedman missed three Board meetings and contemporaneous committee meetings due to medical issues, bringing his overall attendance rate to less than 75% of the aggregate number of Board meetings and committee meetings of which he was a member in 2016. Our non-management directors meet separately from the other directors in an executive session at least quarterly. Mr. Friedman, our Vice Chairman of the Board and Lead Independent Director, or his designee, served as the presiding director of the executive sessions of our non-management and independent directors held in 2016. The Lead Independent Director also has the authority to call meetings of the independent directors or full Board.
Board Leadership Structure
The Board has chosen a leadership structure that combines the role of the Chief Executive Officer and the Chairman of the Board while also having a Lead Independent Director. The Lead Independent Director assumes many of the responsibilities typically held by a non-executive chairman of the board and a list of his responsibilities is provided in the chart below. The company’s rationale for combining the Chief Executive Officer and Chairman of the Board positions relates principally to the Board’s belief that at this stage of our development, the company and its shareholders will be best served if the Chairman is in close proximity to the senior management team on a regular and continual basis.
| Lead Independent Director |
The Lead Independent Director is elected solely by and from the independent directors. Responsibilities include:
- ·
- organizing and presiding over all meetings of the Board at which the Chairman of the
Board is not present, including all executive sessions of the non-management and independent directors;
- ·
- serving as the liaison between the Chairman of the Board and the non-management
directors;
- ·
- overseeing the information sent to the Board by management;
- ·
- approving meeting agendas and schedules for the Board to assure that there is sufficient
time for discussion of all agenda items;
- ·
- facilitating communication between the Board and management;
- ·
- being available to communicate with and respond to certain inquiries of the
company’s shareholders; and
- ·
- performing such other duties as requested by the Board.
-7-
Our Board has also approved Corporate Governance Guidelines, a Code of Business Conduct and Ethics and a Code of Ethics for Chief Executive Officer and Senior Financial Officers. Printed copies of these documents as well as the committee charters discussed below are available by sending a written request to our Corporate Secretary. The foregoing information is available on our website at www.awac.com under “Investors — Corporate Information — Governance Documents”.
Audit Committee. Pursuant to its charter, the Audit Committee is responsible for overseeing our independent auditors, internal auditors, compliance with legal and regulatory standards and the integrity of our financial reporting. Each member of the Audit Committee has been determined by the Board to be “financially literate” within the meaning of the NYSE Listing Standards and each has been designated by the Board as an “audit committee financial expert,” as defined by the applicable rules of the SEC, based on either their extensive prior accounting and auditing experience or having a range of experience in varying executive positions in the insurance or financial services industry.
Compensation Committee. Pursuant to its charter, the Compensation Committee has the authority to establish compensation policies and recommend compensation programs to the Board, including administering all equity and incentive compensation plans of the company. Pursuant to its charter, the Compensation Committee also has the authority to review the competitiveness of the non-management directors’ compensation programs and recommend to the Board these compensation programs and all payouts made thereunder. Additional information on the Compensation Committee’s consideration of executive compensation, including a discussion of the roles of the company’s Chief Executive Officer and the independent compensation consultant in such executive compensation consideration, is included in Item 11. “Executive Compensation — Compensation Discussion and Analysis” below.
Enterprise Risk Committee. Pursuant to its charter, the Enterprise Risk Committee oversees management’s assessment and mitigation of the company’s enterprise risks and reviews and recommends to the Board for approval the company’s overall firm-wide risk appetite statement and oversees management’s compliance therewith.
Executive Committee. The Executive Committee has the authority to oversee the general business and affairs of the company to the extent permitted by Swiss law.
Investment Committee. Pursuant to its charter, the Investment Committee is responsible for adopting and overseeing compliance with the company’s Investment Policy Statement, which contains investment guidelines and other parameters for the investment portfolio. The Investment Committee oversees the company’s overall investment strategy and the company’s investment risk exposures.
Nominating & Corporate Governance Committee. Pursuant to its charter, the Nominating & Corporate Governance Committee is responsible for identifying individuals believed to be qualified to become directors and to recommend such individuals to the Board and to oversee corporate governance matters and practices.
The criteria adopted by the Board for use in evaluating the suitability of all nominees for director include the following:
| | · |
| high personal and professional ethics, values and integrity; |
| | · |
| education, skill and experience with insurance, reinsurance or other businesses and organizations that the Board deems relevant and useful, including whether such attributes or background would contribute to the diversity of the Board; |
-8-
| | · |
| ability and willingness to serve on any committees of the Board; and |
| | · |
| ability and willingness to commit adequate time to the proper functioning of the Board and its committees. |
In addition to considering candidates suggested by shareholders, the Nominating & Corporate Governance Committee considers candidates recommended by current directors, officers and others. The Nominating & Corporate Governance Committee screens all director candidates. The Nominating & Corporate Governance Committee determines whether or not the candidate meets the company’s general qualifications and specific qualities for directors and whether or not additional information is appropriate.
The Board and the Nominating & Corporate Governance Committee do not have a specific policy regarding diversity. Instead, in addition to the general qualities that the Board requires of all nominees and directors, such as high personal and professional ethics, values and integrity, the Board and the Nominating & Corporate Governance Committee strive to have a diverse group of directors with differing experiences, qualifications, attributes and skills to further enhance the quality of the Board. As we are an insurance and reinsurance company that (i) sells products that protect other companies and individuals from complex risks, (ii) has a significant investment portfolio and (iii) faces operational risks similar to those at other international companies, the Board and the Nominating & Corporate Governance Committee believe that having a group of directors who have the range of experience and skills to understand and oversee this type of business is critical. The Board and the Nominating & Corporate Governance Committee do not believe that each director must be an expert in every aspect of our business, but instead strive to have well-rounded, collegial directors who contribute to the diversity of ideas and strengthen the Board’s capabilities as a whole. Through their professional careers and experiences, the Board and the Nominating & Corporate Governance Committee believe that each director has obtained certain attributes that further the goals discussed above.
Risk Oversight
While the assumption of risk is inherent to our business, we believe we have developed a strong risk management culture throughout our organization that is fostered and maintained by our senior management, with oversight by the Board through its committees. The Board primarily delegates its risk management oversight to three of its committees: the Audit Committee, the Enterprise Risk Committee and the Investment Committee, who regularly report to the Board. The Audit Committee primarily oversees those risks that may directly or indirectly impact the company’s financial statements, the Enterprise Risk Committee primarily oversees the company’s business and operational risks and the Investment Committee primarily oversees the company’s investment portfolio risks. The Enterprise Risk Committee also reviews and recommends for approval by the Board our overall firm-wide risk appetite statement, and oversees management’s compliance with this statement. Each committee has broad powers to ensure that it has the resources to satisfy its duties under its charter, including the ability to request reports from any officer or employee of the company and the authority to retain special counsel or other experts and consultants as it deems appropriate.
Each of these committees receives regular reports from senior management who have day-to-day risk management responsibilities, including from our Chief Executive Officer. The Audit Committee receives reports from our Chief Executive Officer, Chief Financial Officer, Chief Actuary, General Counsel, Chief Information Officer, Head of Internal Audit and the company’s independent auditors. These reports address various aspects of risk assessment and management relating to the company’s financial statements. The Enterprise Risk Committee meets regularly with our Chief Executive Officer; President, Underwriting and Global Risk; Chief Risk Officer; and Chief Actuary as part
-9-
of its oversight of the company’s underwriting, pricing and claims risks. Throughout the year, the Enterprise Risk Committee will also receive reports from other operational areas. To assist it in its oversight of the company’s investment risk exposures, the Investment Committee receives reports from our senior investment personnel and external investment managers and advisors.
As open communications and equal access to information can be an important part of the Board’s risk oversight, all of the directors receive the information sent to each committee prior to any committee meeting. Board members are also encouraged to, and often do, attend all committee meetings regardless of whether he or she is a member of such committee.
Director Compensation
In 2016, compensation for our non-management directors consisted of the following:
| Fees for Non-Management Directors |
| | Position
|
| Annual Cash Retainers
|
| Annual Value of RSU Award |
| ||||||
|---|---|---|---|---|---|---|---|---|---|---|---|---|
| | Board Member |
| |
$ |
85,000 |
|
|
|
$ |
90,000 |
| |
| | Lead Independent Director |
| |
$ |
15,000 |
| | | — |
| | |
| | Audit Committee and Enterprise Risk Committee Chair |
| |
$ |
50,000 |
|
|
|
— |
| | |
| | Compensation Committee and Investment Committee Chair |
| |
$ |
35,000 |
| | | — |
| | |
| | Nominating & Corporate Governance Committee Chair |
| |
$ |
8,000 |
|
|
|
— |
| | |
| | Audit Committee Member |
| |
$ |
25,000 |
| | | — |
| | |
Our non-management directors received $3,000 for each Board meeting attended and $2,000 for each committee meeting attended. We also provide to all non-management directors reimbursement of expenses incurred in connection with their service on the Board, including the reimbursement of director educational expenses.
As discussed in footnote 2 to the “Stock Awards” column of the “Non-Management Directors Compensation” table below, in February 2016, each non-management director received an annual equity award of restricted stock units (“RSUs”) of the company worth approximately $90,000. Each RSU represents the right to receive one newly-issued, fully paid and non-assessable common share of the company at a future date and fully vests on the first anniversary of the date of grant, subject to continued service as a director through such date. The RSUs were awarded to our non-management directors pursuant to the Allied World Assurance Company Holdings, AG 2012 Omnibus Incentive Compensation Plan (the “2012 Omnibus Plan”) and, other than with respect to vesting terms, were granted on similar terms and conditions as those generally granted to our employees. In 2016, these annual equity awards were granted concurrently with the grant of equity awards to members of our senior management following the preparation and completion of the 2016 year-end financial statements.
-10-
The following table provides information concerning the compensation paid to the company’s non-management directors for fiscal year 2016.
| Non-Management Directors Compensation(1) |
Name
|
| Fees Earned or Paid in Cash |
| Stock Awards(2) |
| Other Compensation(3) |
| Total
|
| ||||||||||
|---|---|---|---|---|---|---|---|---|---|---|---|---|---|---|---|---|---|---|---|
Barbara T. Alexander |
| |
$ |
214,000 |
|
|
|
$ |
87,447 |
|
|
|
$ |
5,000 |
|
|
$ |
306,447 |
|
James F. Duffy(4) |
| |
$ |
57,666 |
| | |
$ |
— |
| | |
$ |
7,509 |
| | $ |
65,175 |
|
Bart Friedman |
| |
$ |
156,000 |
|
|
|
$ |
87,447 |
|
|
|
$ |
— |
|
|
$ |
243,447 |
|
Patricia L. Guinn |
| |
$ |
167,875 |
| | |
$ |
87,447 |
| | |
$ |
10,000 |
| | $ |
265,322 |
|
Fiona E. Luck |
| |
$ |
142,000 |
|
|
|
$ |
87,447 |
|
|
|
$ |
10,000 |
|
|
$ |
239,447 |
|
Patrick de Saint-Aignan |
| |
$ |
239,000 |
| | |
$ |
87,447 |
| | |
$ |
10,000 |
| | $ |
336,447 |
|
Eric S. Schwartz |
| |
$ |
174,000 |
|
|
|
$ |
87,447 |
|
|
|
$ |
— |
|
|
$ |
261,447 |
|
Samuel J. Weinhoff |
| |
$ |
227,000 |
| | |
$ |
87,447 |
| | |
$ |
10,000 |
| | $ |
324,447 |
|
- (1)
- In
2016, our non-management directors did not receive any non-equity incentive plan compensation and did not have any pension or deferred compensation plan
compensation that would be required to be included in this table. Accordingly, other columns generally required pursuant to SEC rules are not included in the “Non-Management Directors
Compensation” table.
- (2)
- As
of December 31, 2016, our non-management directors held an aggregate of 19,159 RSUs under the 2012 Omnibus Plan, with each director holding 2,737 RSUs. In
accordance with SEC rules, the amounts shown in the “Stock Awards” column equal the estimate of aggregate compensation costs to be recognized with respect to RSU awards
granted in 2016 determined as of the grant date under Financial Accounting Standards Board Accounting Standards Codification (ASC) Topic 718, Stock Compensation (“FASB ASC Topic
718”), and excluding the effect of estimated forfeitures. The fair value has been calculated for purposes of the “Stock Awards” column in the table above
by using the closing price of our common shares on the date of grant ($31.95 per common share for the awards issued on February 22, 2016). In determining the fair value of awards for directors
and all of our employees, the Board uses the daily volume-weighted average sales price of our common shares for the 20 consecutive trading days up to and including the second trading day prior to the
date of grant ($32.88 per common share, or a $89,993 aggregate grant to each director on February 22, 2016).
- (3)
- Reflects
matching contributions made under the company’s matching gift program, which is available to all employees and directors. Under this program,
the company will match contributions to eligible non-profit organizations, up to a maximum of $10,000 per year.
- (4)
- Reflects compensation for service through April 19, 2016, Mr. Duffy’s date of resignation.
Stock Ownership Policy
In order to promote equity ownership and further align the interests of the Board with our shareholders, the Board adopted a stock ownership policy for all non-management directors. Under this policy, a non-management director is expected to own, within five years after his or her joining the Board, equity interests of the company with a value equal to five times the then-current annual cash retainer for serving on the Board. Non-management directors are expected not to sell any common shares until they are in compliance with this policy. Mr. Carmilani, our President, Chief Executive Officer and Chairman of the Board, is subject to a stock ownership policy for senior employees as described in Item 11. “Executive Compensation — Compensation Discussion and Analysis — Stock Ownership Policy” below.
-11-
Executive Officers
Our executive officers are elected by and serve at the discretion of the Board. The following table identifies the executive officers of the company, including their respective ages and positions as of the date hereof.
| Name |
| Age |
| Position |
|---|---|---|---|---|
| | | | | |
Scott A. Carmilani(1) |
| 52 |
| President, Chief Executive Officer and Chairman of the Board |
John R. Bender |
| 52 |
| Chief Executive Officer, Reinsurance, Allied World Reinsurance Management Company |
Thomas A. Bradley |
| 59 |
| Executive Vice President & Chief Financial Officer |
Wesley D. Dupont |
| 48 |
| Executive Vice President & General Counsel |
Frank N. D’Orazio |
| 48 |
| President, Underwriting and Global Risk |
Marshall J. Grossack |
| 57 |
| Executive Vice President & Chief Actuary |
Louis P. Iglesias |
| 53 |
| President, North America Allied World Assurance Company (U.S.) Inc. and Allied World National Assurance Company |
Julian James |
| 54 |
| President, Global Markets Allied World Assurance Company (Europe) dac |
John J. McElroy |
| 52 |
| Chief Operating Officer |
Kent W. Ziegler |
| 54 |
| Senior Vice President, Finance and Chief Accounting Officer |
- (1)
- Please see Mr. Carmilani’s biography under “Board of Directors” above.
John R. Bender has been the Chief Executive Officer, Reinsurance of Allied World Reinsurance Management Company since August 2014 and oversees our reinsurance platform on a global basis. From February 2012 to August 2014, he served as the President of Allied World Reinsurance Management Company. From August 2009 to February 2012, he served as the President and Chief Operating Officer of Allied World Reinsurance Company, one of our subsidiaries. He joined us in November 2007 as the Chief Operating Officer of Allied World Reinsurance Company. From November 2007 through November 2011, Mr. Bender was responsible for establishing and expanding the company’s U.S. reinsurance platform and for overseeing its day-to-day operations. Since December 2011, Mr. Bender has assumed responsibility for providing strategic leadership and executing business strategies for our global reinsurance operations. Prior to joining us, Mr. Bender held several senior management positions at Platinum Underwriters Holdings, Ltd., including Chief Underwriting Officer, Casualty from November 2005 to October 2007 and Senior Vice President, Commercial Liability Products from October 2002 to November 2005. From 1989 to October 2002, he held numerous claims and underwriting positions with St. Paul Reinsurance Management Company.
Thomas A. Bradley joined the company as Executive Vice President & Chief Financial Officer in September 2012. Prior to joining us, Mr. Bradley had served as the Chief Financial Officer of Dorsey & Whitney LLP, a large international law firm, since August 2011. From April 2009 to April 2011, Mr. Bradley served in various financial positions at the Fair Isaac Corporation, a business services company, including as its Executive Vice President and Chief Financial Officer. From April 2004 to February 2009, Mr. Bradley served in various financial and operational positions at Zurich Financial North America, a financial services company, including as its Executive Vice President and Chief
-12-
Financial Officer. Prior to that, he held a host of senior financial and operational positions at USF&G Corporation/St. Paul Companies.
Wesley D. Dupont has been our Executive Vice President & General Counsel since September 2009 and presently oversees our legal, compliance, claims and human resources functions on a global basis. From December 2005 to September 2009, he served as our Senior Vice President, General Counsel and served as our Corporate Secretary through May 2012. In November 2003, Mr. Dupont began working for American International Company Limited, a subsidiary of AIG, and began providing legal services to us pursuant to an administrative services contract with American International Company Limited. Through that contract, Mr. Dupont served as our Senior Vice President, General Counsel and Secretary from April 2004 until November 30, 2005. As of December 1, 2005, Mr. Dupont became an employee of our company. Prior to joining American International Company Limited, Mr. Dupont worked as an attorney at Paul, Hastings, Janofsky & Walker LLP, a large international law firm, where he specialized in general corporate and securities law. From April 2000 to July 2002, Mr. Dupont was a Managing Director and the General Counsel for Fano Securities, LLC, a specialized securities brokerage firm. Prior to that, Mr. Dupont worked as an attorney at Kelley Drye & Warren LLP, another large international law firm, where he also specialized in general corporate and securities law.
Frank N. D’Orazio has been the President, Underwriting and Global Risk since December 31, 2014 and is responsible for the oversight and governance of our underwriting activities, enterprise risk management and ceded reinsurance strategies globally. From September 2009 to December 2014, Mr. D’Orazio served as the President — Bermuda and International Insurance of Allied World Assurance Company, Ltd, one of our subsidiaries, where he was responsible for providing strategic leadership and executing business strategies for the Bermuda, Europe and Asia insurance platforms. Prior to that, he served as the Chief Underwriting Officer of Allied World Assurance Company, Ltd since September 2008. From March 2005 to September 2008, Mr. D’Orazio was the company’s Senior Vice President — General Casualty where he was responsible for managing the company’s general casualty and healthcare operations in Bermuda, Europe and the United States. Mr. D’Orazio joined the company in June 2003 as Vice President — General Casualty. Prior to joining our company, Mr. D’Orazio worked for the retail insurance market arm of Munich-American Re-Insurance from August 1994 to May 2003, where he held a succession of underwriting and management positions. Mr. D’Orazio held various underwriting positions in the excess casualty division of Chubb from June 1990 to July 1994.
Marshall J. Grossack has been our Executive Vice President-Chief Actuary since September 2009. He served as our Senior Vice President and Chief Corporate Actuary from July 2004 to September 2009. From June 2002 until July 2004, Mr. Grossack was a Vice President and Actuary for American International Company Limited, a subsidiary of AIG, and provided services to us pursuant to a former administrative services contract with American International Company Limited. From June 1999 until June 2002, Mr. Grossack worked as the Southwest Region Regional Actuary for subsidiaries of AIG in Dallas, Texas.
Louis P. Iglesias has been the President, North America for Allied World Assurance Company (U.S.) Inc. and Allied World National Assurance Company, two of our subsidiaries, since January 31, 2014 and is responsible for providing strategic leadership and executing business strategies for our United States and Canada insurance platforms. Since December 31, 2014, he has also been responsible for providing strategic leadership and executing business strategies for our Bermuda insurance platform. From April 2012 through January 2014, he was the President, U.S. Property & Casualty for Allied World Assurance Company (U.S.) Inc. and Allied World National Assurance Company. From 1994 to April 2012, Mr. Iglesias served in various senior management positions at AIG, including Chief Executive Officer for Commercial Casualty, President for the Risk Management Group, President for AIG Environmental and President of AIG Construction. Prior to AIG, Mr. Iglesias worked at Travelers and Reliance insurance companies.
-13-
Julian James has been the President, Global Markets of Allied World Assurance Company (Europe) dac since December 31, 2014 and is responsible for providing strategic leadership and executing business strategies for our direct insurance operations in Europe and Asia Pacific, which includes offices in Australia, Hong Kong, Labuan and Singapore. In addition, Mr. James has served as the Chief Executive Officer of Allied World Managing Agency Limited since April 2014. From March 2013 to December 2014, Mr. James served as the President of Allied World Assurance Company (Europe) dac and was responsible for providing strategic leadership and executing business strategies for the company’s European insurance platform. From September 2007 to January 2013, Mr. James served as the Chief Executive Officer at Lockton International. From 1997 to April 2007, Mr. James held senior management positions at Lloyd’s, most recently as Director, Worldwide Markets, where he was responsible for all of Lloyd’s commercial activities outside of the United Kingdom, including the management of its trading licenses as well as oversight of its global branding and communications. Before joining Lloyd’s, Mr. James was the Development Director of brokers Sedgwick Energy and Marine Limited and a member of the division’s Executive Management Committee. Prior to that, he spent five years working in senior positions with Sedgwick, where he began his career in 1981, in North America. In February 2016, he was elected to serve on the Council of Lloyd’s.
John J. McElroy was appointed our Chief Operating Officer in March 2012. In this role, he oversees the company’s operations and administration, information technology, new product development, marketing, broker relations and project management on a global basis. From May 2008 through February 2012, Mr. McElroy served as President, Professional Lines, of Allied World Assurance Company (U.S.) Inc. and Allied World National Assurance Company and oversaw the underwriting of all directors and officers liability, errors and omissions liability and medical malpractice liability insurance products by the company’s U.S. insurance operations. From June 2004, when he joined us, through April 2008, Mr. McElroy served as our Senior Vice President, Field Operations Officer, during which time he was responsible for expanding our U.S. insurance operations, developing our network of U.S. offices and increasing brand and product visibility. Prior to joining us, Mr. McElroy worked with Gulf Insurance Group for 12 years where he held various underwriting and other senior management positions. He began his career at AIG underwriting directors and officers liability insurance for large commercial risks.
Kent W. Ziegler has been our Senior Vice President, Finance and Chief Accounting Officer since February 2013. Prior to joining us, from January 2010 through January 2013, Mr. Ziegler served as the Senior Vice President and Chief Financial Officer of the Retail Real Estate Division of JPMorgan Chase & Co. From 2005 to 2009, Mr. Ziegler served in JPMorgan Chase’s Business Banking Division, most recently as the Senior Vice President and Chief Financial Officer. From 1989 to 2004, Mr. Ziegler served in various financial and operational positions at Gulf Insurance Group, including as the Executive Vice President, Chief Financial Officer and Chief Administrative Officer. He began his career in public accounting at Ernst & Young.
Section 16(a) Beneficial Ownership Reporting Compliance
Section 16(a) of the Exchange Act requires our directors and executive officers, and persons who own more than 10% of a registered class of our equity securities, to file reports of ownership of, and transactions in, our equity securities with the SEC. Such directors, executive officers and shareholders are also required to furnish us with copies of all Section 16(a) reports they file. Purchases and sales of our equity securities by such persons are published on our website under the “SEC Filings” link under “Investors”.
Based on a review of the copies of such reports, and on written representations from our reporting persons, we believe that all Section 16(a) filing requirements applicable to our directors, executive officers and shareholders were complied with during the fiscal year 2016.
-14-
Item 11. Executive Compensation.
| COMPENSATION DISCUSSION AND ANALYSIS |
Compensation Program Overview
In accordance with the rules of the NYSE, a majority of the members of the Board are independent and the Compensation Committee is presently comprised of six independent Board members. The Board has adopted a Compensation Committee Charter discussed earlier in this Form 10-K. The Compensation Committee oversees our compensation programs and makes recommendations to the Board. Pursuant to Swiss law, the Board is required to make all final compensation decisions regarding our Chief Executive Officer (“CEO”), our Chief Financial Officer (“CFO”) and our three other most highly compensated officers who were serving as executive officers at the end of our 2016 fiscal year (collectively, our “named executive officers” or “NEOs”). We have achieved considerable growth since our inception in November 2001 and our compensation programs have been designed to reward executives who contribute to our continuing success.
The Compensation Committee has selected Farient Advisors, LLC (“Farient”) as its independent compensation advisor. At the committee’s direction, Farient has conducted an extensive review of our executive compensation strategy and programs to ensure strong alignment between executive compensation, business strategy and long-term shareholder value creation.
Compensation Philosophy. The insurance and reinsurance industry is very competitive, cyclical and often volatile, and our success depends in substantial part on our ability to attract and retain talented, high-achieving employees who will remain motivated and committed to the company during all insurance industry cycles. We have a strong pay-for-performance philosophy. Given our historically strong performance, we have set salaries and target bonuses for our executives as a group at approximately the median of the market, and total direct compensation, which includes salaries, target bonuses and the grant date value of equity, at between the 50th and 75th percentiles of the market. Total direct compensation for our executives as a group is delivered at the higher end of this pay positioning range following years in which performance is high relative to our peer group of insurance and reinsurance companies for compensation benchmarking purposes (the “Peer Group”) and at the lower end of this range following years in which performance is low relative to our Peer Group. Accordingly, the Compensation Committee believes that an effective executive compensation program is one that:
- ➢
- Rewards strong company and individual performance,
- ➢
- Aligns the interests of the executive officers with the
company’s shareholders, and
- ➢
- Balances the objectives of pay-for-performance and retention.
The Compensation Committee’s objectives for the company’s compensation programs are to:
- ➢
- Drive and reward employee performance that supports the
company’s business objectives and financial success;
- ➢
- Attract and retain talented and highly-skilled employees;
- ➢
- Align the interests of the executives with the company’s
shareholders by:
- ·
- having a substantial portion of compensation in long-term, performance-based equity
awards, a large portion of which is “at risk” with vesting dependent on the company achieving certain performance targets over time, particularly at the senior officer
level where such persons can more directly affect the company’s financial success;
- ·
- regularly evaluating the company’s compensation programs to help ensure that they do not encourage excessive risk taking; and
-15-
- ·
- tying incentive opportunity to a blend of metrics that focus on key company objectives,
correlate with the creation of shareholder value and encourage prudent risk taking;
and
- ➢
- Remain competitive with other insurance and reinsurance companies, particularly other insurance and reinsurance companies with which the company competes for talent.
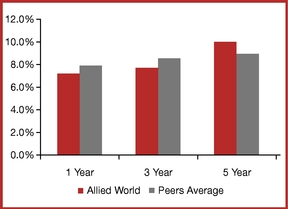
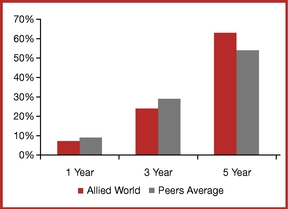
The charts below show the company’s net income return on equity (adjusted for other comprehensive income) and diluted book value per share growth (adjusted for dividends) relative to the Peer Group over a 1-year, 3-year and 5-year period. Please see Item 7. “Management’s Discussion and Analysis of Financial Condition and Results of Operations — Overview — Non-GAAP Financial Measures” in the Original Form 10-K for reconciliations to the most directly comparable financial measures under generally accepted accounting principles.
| Net Income Return on Equity (Adjusted for other comprehensive income) |
| Diluted Book Value per Share Growth (Adjusted for dividends) |
|
|
|
Components of Executive Compensation. The components of our executive compensation programs and the terms of each are shown in the table below:
|
Components of Executive Compensation |
| | | | | | | | | | | | | |
| |
Element |
| |
Type |
| |
Terms |
| ||||
| | | | | | | | | | | | | |
|
| Cash |
| |
| Base Salary |
| | · The fixed element of each NEO’s annual cash compensation. |
| ||
| | | | | | | | | | | | | |
|
| |
| |
| Annual Cash Bonus |
| | · A cash incentive opportunity based upon the achievement of annual goals. · The performance measures used to fund the bonus pool include: o Comprehensive income before interest and taxes (“CIBIT”) (weighted one-third); o Return on equity (“ROE”) relative to our Peer Group (weighted one-third); and o A corporate scorecard of financial, operational and strategic objectives (weighted one-third). · Individual performance is used to determine the allocation of the bonus pool. For more information, please see “2016 Cash Compensation — ”How is CIBIT Calculated?” and “2016 Cash Compensation — How is ROE calculated and defined?” |
| ||
| | | | | | | | | | | | | |
-16-
| | | | | | | |||||||
|
|
|
|
|
|
|||||||
| | | | | | | | | | | | | |
|
|
Equity-Based |
|
|
| Performance-Based |
| | · An opportunity to earn shares in the company (or an equivalent value in cash) with vesting dependent upon our achieving certain performance targets over a three-year performance period. · The performance measures used to determine the actual versus target number of shares earned include: o Book value growth calculated on a CAGR basis (weighted one-half); and o ROE relative to our Peer Group (weighted one-half). For more information, please see “2016 Equity-Based Compensation — ”How is Book Value Calculated?” and “2016 Equity-Based Compensation — How is ROE calculated and defined?” |
| ||
| | | | | | | | | | | | | |
|
| |
| |
| Restricted Stock |
| | · An opportunity to earn shares in the company (or an equivalent value in cash) with vesting dependent upon our NEOs satisfying time-based vesting conditions. · RSUs generally vest pro rata over four years. |
| ||
| | | | | | | | | | | | | |
|
| Retirement |
| |
| 401(k) Plan |
| | · A qualified savings plan that provides participants with the opportunity to defer a portion of their compensation, up to the U.S. Internal Revenue Service (“IRS”) tax code limitations, and receive a company matching contribution. |
| ||
| | | | | | | | | | | | | |
|
| |
| |
| Supplemental |
| | · A plan that supplements the 401(k) plan by providing, on a non-qualified basis, for deferral of compensation in excess of the IRS tax code limitations. |
| ||
| | | | | | | | | | | | | |
|
| Other |
| |
| Perquisites |
| | · Certain other benefits provided to executives by the company. |
| ||
| | | | | | | | | | | | | |
-17-
The mix of our total direct compensation that was paid to our NEOs in 2016 (comprised of base salary, annual cash bonus and equity-based incentive compensation at grant value) is shown below:
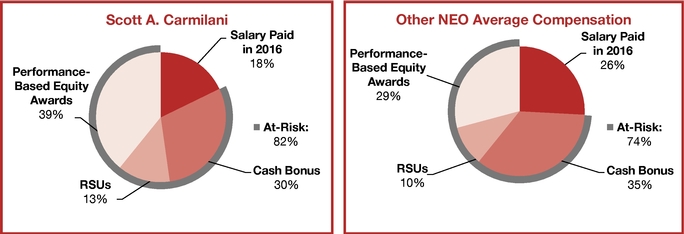
As shown in the charts above, the Compensation Committee manages the pay mix such that a substantial portion of pay is dedicated to “at risk” compensation, including annual cash bonuses and equity-based incentive compensation. The Compensation Committee believes that this mix of pay best aligns the interests of our executives, including the NEOs, with those of our shareholders over time.
We use ROE relative to our Peer Group for both our short-term cash bonus program and our long-term, equity-based compensation program because:
| | · |
| The measure correlates closely with shareholder value over both the short- and longer-term; |
| | · |
| The Compensation Committee believes that utilizing the same metric for both the short- and long-term compensation programs ensures that short-term management decisions are not influenced by short-term gain at the expense of long-term performance; |
| | · |
| By using the same metric, the Compensation Committee is promoting sustained performance of the company in this area over both the short- and longer-term; |
| | · |
| ROE is a widely used financial metric in the insurance and reinsurance industry in assessing company performance; and |
| | · |
| The Compensation Committee believes that it is important to use both absolute and relative performance measures to help ensure that our compensation programs are linked to key internal objectives while also being sensitive to how we perform relative to our Peer Group. |
Our Compensation Practices. We continue to implement and maintain what we believe are leading practices in our compensation programs and related areas. These practices include the following:
| | · |
| We prohibit our employees and directors from pledging our securities and hedging and other derivative transactions in our securities (see “Stock Ownership Policy” below). |
| | · |
| We require our executive officers to meet stock ownership requirements, and we prohibit them from selling any shares if doing so would cause them to fall below required levels (see “Stock Ownership Policy” below). We also have stock ownership requirements for our directors, as discussed earlier in this Form 10-K. |
-18-
| | · |
| We prohibit the repricing or exchange of stock options or similar equity awards without shareholder approval. |
| | · |
| We do not pay dividends or dividend equivalents on unvested equity awards. |
| | · |
| Our annual equity awards provide for four-year vesting and our performance-based equity awards have a three-year performance period, except in limited circumstances involving certain terminations of employment. This time horizon encourages long-term sustained performance and retention of our executives. |
| | · |
| We can recover, or “clawback”, equity-based compensation paid to executives for fraud, intentional misconduct or actions that contribute materially to any financial restatement (see “2012 Omnibus Plan” below). |
| | · |
| The Compensation Committee has engaged an independent compensation consultant that has no other ties to the company or its management. |
Shareholder Engagement. We provide our shareholders with the opportunity to cast an annual advisory vote on executive compensation (the “say-on-pay proposal”) under U.S. securities laws in addition to binding executive compensation votes required under Swiss law. Prior to 2016, shareholders strongly supported our executive compensation programs, approving the say-on-pay proposals with 98.4%, 98.8% and 98.9% support in 2013, 2014 and 2015, respectively.
At our Annual Shareholder Meeting held in April 2016, shareholders approved our binding executive compensation proposal with 99.4% support. However, shareholders approved our advisory say-on-pay proposal with a lower level of support of 64.3%, even though our compensation program design had not materially changed from prior years and overall compensation levels had substantially decreased commensurate with our financial performance. As part of the proxy solicitation process, and following the 2016 Annual Shareholder Meeting, we engaged in an extensive shareholder outreach effort, contacting our 28 largest institutional shareholders representing approximately 63% of the company’s outstanding shares. Members of the company’s management, its Investor Relations Department and, in some cases, the independent Chair of the Compensation Committee, conducted conference calls with those shareholders that responded to outreach efforts to solicit shareholder feedback, respond to questions and ensure that shareholders understand our executive compensation programs and are afforded an opportunity to voice any concerns.
Shareholders noted that they generally supported the company’s compensation program design, particularly the emphasis on long-term, performance-based equity awards that reflected our strong pay-for-performance philosophy. Shareholders also noted that they appreciated our outreach efforts and the opportunity to engage in discussions with the independent Chair of the Compensation Committee. Although shareholders did not identify any specific issues with our executive compensation programs, the Compensation Committee deliberated on the results of the 2016 say-on-pay vote in multiple meetings and considered shareholder feedback, market data and advice from its independent compensation consultant in its ongoing review of the compensation program design.
Compensation Oversight and Process
The Compensation Committee has established a number of processes to assist it in ensuring that NEO compensation is achieving its objectives. Among those are:
| | · |
| Assessment of the company’s performance on both an absolute and relative basis; |
| | · |
| Assessment of individual performance via interactions with the CEO and other NEOs; |
-19-
| | · |
| Engaging an independent compensation consultant that reports directly to the committee; |
| | · |
| Assessment of risks associated with the company’s compensation programs; |
| | · |
| Pay-for-performance analysis; |
| | · |
| Assessment of benefits and perquisites; |
| | · |
| Analyzing the relationship of actual pay to performance; and |
| | · |
| Total compensation review, which includes: |
| |
|
| · Benchmarking target pay levels for base salary, annual cash bonuses, long-term incentive compensation and total direct compensation; |
| |
|
| · Reviewing perquisites and contributions to retirement plans; and |
| |
|
| · Reviewing the design of the compensation programs, including goal-setting and calibrating the level of pay with performance. |
In determining the level of compensation for the NEOs, both quantitative and qualitative factors of the company’s and each NEO’s performance are analyzed. The Compensation Committee primarily uses formulaic factors to assess company performance. However, due to the potential volatility of the insurance and reinsurance industry and thus the company’s financial results, the Compensation Committee believes that it is appropriate to also use non-formulaic factors to assess company and individual performance.
Relationship Between Pay and Performance. The success of the company’s business and resulting value for our shareholders is contingent upon our successfully selecting, pricing and managing insurance and reinsurance risks over the long-term. Our business requires that we assess, select and respond to identified market opportunities in a highly disciplined and cost-effective manner. To reinforce this approach, our executive compensation programs are designed to align executives’ interests closely with shareholder interests by tying executive compensation directly to equity results, as well as to those financial and strategic results that drive shareholder value, including sustainable, profitable growth; high returns; efficient, risk-adjusted capital deployment; and the company’s strategic positioning. In this regard, key features of our executive compensation programs include:
| | · |
| A significant portion of target compensation being “at risk” (82% for the CEO and 74%, on average, for our other NEOs); |
| | · |
| A significant portion of target compensation being linked to long-term performance (52% for the CEO and 39%, on average, for other NEOs); |
| | · |
| A balance of measures (mostly formulaic, with some non-formulaic) that encourage short-term actions that will benefit shareholders in the long-run; |
| | · |
| Use of performance measures in our annual cash bonus and equity incentive compensation programs that have been demonstrated analytically to be relevant to creating shareholder value, including CIBIT, growth in book value, ROE, and in our corporate scorecard, combined ratio, which is a measure of our underwriting performance; |
| | · |
| Performance goals set at competitive levels; and |
| | · |
| Linking the funding of the annual cash bonus pool to corporate results (with award allocation tied to individual results). |
-20-
For the 2016 performance year, the Compensation Committee reviewed an assessment conducted by Farient on the company’s pay and performance alignment. Farient determined that the company’s performance improved in 2016 relative to the prior year, despite market conditions that remained challenging, including excess capacity and increased competition, and that the company’s total shareholder return also increased significantly, in part due to the pending acquisition of the company by Fairfax Financial Holdings Limited (“Fairfax”). The Compensation Committee also considered Mr. Carmilani’s role in evaluating potential strategic transactions involving the company and successfully negotiating the terms with Fairfax to obtain significant value for our shareholders. The company’s quartile rank in performance is shown in the chart below:
|
Company’s Performance Relative to Its Peer Group as of December 31, 2016 (In quartiles. 1=first quartile, the highest level; 4=fourth quartile, the lowest level) |
Performance Metric
|
| 2016 (one year) Rank |
| 2014-2016 (three year) Rank |
| 2012-2016 (five year) Rank |
| |||||||||
|---|---|---|---|---|---|---|---|---|---|---|---|---|---|---|---|---|
|
Diluted Book Value per Share Growth (adjusted for dividends) |
|
| 3 | | | | 3 | | | | 2 | | | |||
| Annualized Net Income ROAE (adjusted for other comprehensive income) |
| | 3 | | | | 4 | | | | 2 | | | |||
| Combined Ratio | | | 3 | | | | 3 | | | | 2 | | | |||
| Total Shareholder Return | | | 1 | | | | 3 | | | | 1 | | | |||
Given our relative performance, as well as the Compensation Committee’s philosophy that pay should be commensurate with performance, the committee determined that our CEO compensation has been positioned appropriately relative to performance. The Compensation Committee is committed to ensuring that CEO and other NEO compensation are appropriately aligned with performance, and will continue to monitor our pay-for-performance alignment as an input in making pay decisions.
Assessment of Individual Performance. All of our NEOs have specific objectives that are established at the beginning of each year. Each NEO’s performance (other than our CEO’s performance) is reviewed annually by Mr. Carmilani, our CEO, based on his individual skills and qualifications, management responsibilities and initiatives, staff development and the achievement of departmental, geographic and/or established business goals and objectives, depending on the role of the NEO. Each NEO’s performance was assessed on both company and individual achievements in light of current market conditions. Mr. Carmilani’s performance was reviewed by the Compensation Committee and was also assessed on both the company’s achievements and his individual achievements in light of current market conditions in the insurance and reinsurance industry. In 2016, these performance reviews formed the basis on which compensation-related decisions were made for annual cash bonuses and grants of performance-based and time-vested RSU awards, as well as 2017 base salaries and target bonus opportunities.
Roles of the CEO and the Compensation Committee. The Compensation Committee recommends to the Board for approval the company’s compensation programs and the total amount available for the base salaries, cash bonuses and equity-based compensation for the NEOs and the other executive officers as a group. The Compensation Committee also determines the company’s compensation philosophy and objectives and sets the framework for the NEOs’ compensation structure. Within this framework, Mr. Carmilani, our CEO, recommends to the Compensation Committee all aspects of compensation for each NEO, excluding himself. He reviews the recommendations, survey data and other materials provided to him by our Human Resources Department and Farient as well as proxy statements and other publicly available information of our industry peers. He also assesses the company’s and each NEO’s performance as described above. The conclusions and recommendations
-21-
resulting from these reviews and consultations, including proposed salary adjustments, annual cash bonus amounts and equity award amounts, are then presented to the Compensation Committee for its review and consideration. The Compensation Committee has discretion to modify any recommendation it receives from Mr. Carmilani, but strongly relies on his recommendations.
The Board and NEO Interactions. The Board has the opportunity to meet with the NEOs regularly during the year. In 2016, the company’s NEOs met with and made presentations to the Board regarding their respective business lines or responsibilities. The company believes that the interaction among its NEOs and the Board is important in enabling the Board, including the members of the Compensation Committee, to form its own assessment of each NEO’s performance.
The Role of Our Independent Advisor. The Compensation Committee directed Farient to conduct analyses on key aspects of NEO and other senior officer pay and performance, and to provide recommendations about compensation plan design. Farient reports directly to the Compensation Committee and in 2016 did not provide any non-executive consulting services to the company that would require disclosure under SEC rules. Farient meets with members of senior management to gain a greater understanding of key issues facing the company and to review its cash and equity compensation programs. The Compensation Committee meets separately with Farient to review in detail all compensation-related decisions regarding the CEO as well as the structure of the company’s compensation programs. During this review, the Compensation Committee also receives Farient’s analyses of the Peer Group, NEO pay and performance for the company and its peers, a compensation risk assessment, analyses of compensation best practices and current compensation trends.
The Compensation Committee has assessed the independence of Farient pursuant to SEC rules and concluded that no conflict of interest exists that would prevent Farient from serving as an independent advisor to the Compensation Committee.
Timing of Awards. The Compensation Committee believes that compensation decisions regarding employees should be made after year-end results have been determined to better align employee compensation with company performance and shareholder value. This requires that annual cash bonuses, equity awards and base salary adjustments be determined after year-end financials have been prepared and completed. The Compensation Committee’s policy is to approve compensation decisions at its regularly scheduled meeting during the first quarter of the year.
Benchmarking. The Compensation Committee reviews our competitive pay positioning annually based on a report prepared by Farient. Farient compiles data on over 30 of our top positions, including our NEOs, using a number of nationally recognized surveys covering the property and casualty insurance and reinsurance industry as well as general industry surveys. In addition, Farient uses proxy data for the CEO and CFO positions from our Peer Group. Farient compiles data on base salaries, target annual bonus opportunities, target equity-based incentive compensation values and total direct compensation, which is the sum of all three components. The Compensation Committee uses this information as one input, among others, such as individual performance and retention requirements, for making compensation decisions regarding salary increases, target bonus opportunities and equity-based incentive compensation awards each year.
Peer Group. The Compensation Committee asks Farient to review the company’s Peer Group on an annual basis. For 2016, the company’s Peer Group is comprised of 12 insurance and reinsurance companies, selected primarily because they are similar to the company in terms of property and casualty insurance and reinsurance business mix; percentage of U.S. and non-U.S. business written; focus on specialty insurance; high-quality financial strength; and size, as measured by gross premiums written, total revenue and market capitalization. Farient uses the Peer Group for purposes of assessing total direct compensation for the CEO and CFO positions; program design, including measures and goals; pay practices; equity plan burn-rate and share overhang; business performance; an analysis of pay and performance; and Board compensation.
-22-
The 12 Peer Group companies used by the Compensation Committee as inputs for 2016 pay design and pay level decisions are as follows:
| Peer Group |
Arch Capital Group Ltd. |
|
|
|
Markel Corporation |
Argo Group International Holdings, Ltd. |
|
|
The Navigators Group, Inc. |
|
Aspen Insurance Holdings Limited |
| |
| Pro Assurance Corporation |
Axis Capital Holdings Limited |
| | RLI Corp. |
|
Endurance Specialty Holdings Ltd. |
| |
| W. R. Berkley Corporation |
The Hanover Insurance Group, Inc. |
| | XL Group Ltd |
Assessment of Risks Associated with Compensation. The Compensation Committee has evaluated whether our compensation policies and programs encourage excessive risk taking. As part of this evaluation, the Compensation Committee reviewed a detailed compensation risk assessment conducted by Farient. In its assessment, Farient established both quantitative and qualitative criteria for assessing the company’s compensation programs, and evaluated numerous elements of the company’s pay mix, its compensation-related performance measurements, its governance and its processes and procedures that mitigate risk in its compensation programs. In addition to the above assessment, at the Compensation Committee’s request, Farient also conducted a review of the pay programs and risk mitigation policies covering certain executives that have direct responsibility for decisions that impact the company’s risk position. Based on these assessments, Farient concluded and the Compensation Committee concurred that the company’s balanced pay and performance program coupled with its risk mitigation policies effectively prevent excessive risk taking.
Total Compensation Review. Each year, the Compensation Committee reviews a summary report or “tallysheet” prepared by the company for each NEO as well as the other executive officers. The purpose of a tallysheet is to show the aggregate dollar value of each officer’s total annual compensation, including base salary, annual cash bonus, equity-based compensation, perquisites and all other compensation earned over the past two years. The tallysheet also shows amounts payable to each NEO upon termination of his employment under various termination scenarios. Tallysheets are reviewed by our Compensation Committee for informational purposes.
2016 Cash Compensation
2016 Base Salaries. As part of its assessment in late 2016 in preparation for pay actions in early 2017, the Compensation Committee determined that our CEO’s and NEOs’ annual base salaries were at approximately the 50th percentile of the market. In addition, the Compensation Committee determined that Messrs. Bradley, Dupont, D’Orazio and Iglesias continued to be positioned similarly to one another at approximately one-half of the CEO’s salary. The Compensation Committee made this decision in order to (i) achieve its objective of internal equity; (ii) position average salaries between the 50th and 75th percentiles of the market; and (iii) avoid the need to increase salaries annually, unless dictated by significant competitive or internal considerations.
2016 Annual Cash Bonus. The company has established a structured, yet flexible, cash bonus program that has two facets: (1) an overall cash bonus pool that is funded based on the company’s financial and qualitative performance and (2) a process by which the overall cash bonus pool is
-23-
allocated to individuals based on individual target awards and performance. As in prior years, a target bonus percentage was established in February 2016 for each employee, including the NEOs, who were eligible to participate in the plan. The CEO’s target bonus as a percentage of salary was based on the Compensation Committee’s competitive assessment of the market and was set to be commensurate with the market. The target bonus as a percentage of salary for the other NEOs was set with the view that there should be a reasonable separation between the percentages for the CEO and the other NEOs, and that the target bonus percentages for all other NEOs should be the same given the relative importance and impact of each NEO’s role. Target bonus percentages for the NEOs and other senior officers were recommended by the CEO and approved by the Compensation Committee. The CEO’s target bonus percentage was determined solely by the Compensation Committee.
Our NEOs were eligible to receive an annual cash bonus based on a percentage of their annual base salary as follows:
| Name | | 2016 Bonus Target Percentage |
| |||
|---|---|---|---|---|---|---|
Scott A. Carmilani |
|
|
120% |
|
|
|
Thomas A. Bradley |
|
|
100% |
|
|
|
Wesley D. Dupont |
|
|
100% |
|
|
|
Frank N. D’Orazio |
|
|
100% |
|
|
|
Louis P. Iglesias |
|
|
100% |
|
|
|
The methodology used to determine the 2016 annual cash bonus pool from which individual bonuses were paid is shown below:
| | 2016 Annual Cash Bonus Plan |
| ||||||||||||||||||||||||||||||||||||||||
|---|---|---|---|---|---|---|---|---|---|---|---|---|---|---|---|---|---|---|---|---|---|---|---|---|---|---|---|---|---|---|---|---|---|---|---|---|---|---|---|---|---|---|
| | | | | | | | | | | | | | | | | | | | | | | | | | ||||||||||||||||||
| | |
| CIBIT ($ in Millions) |
| CIBIT Goal Range |
| CIBIT Funding Level (% of Target) |
| |
| Adjusted ROE Relative to the Peer Group |
| ROE Funding Level (% of Target) |
| |
| Corporate Scorecard |
| Scorecard Funding Level (% of Target) |
| |
| Total Cash Bonus Funding |
| ||||||||||||||||||
| | | | | | | | | | | | | | | | | | | | | | | | | | ||||||||||||||||||
|
Weight |
|
33.3% |
|
|
|
|
|
|
|
|
|
|
|
33.3% |
|
|
|
|
|
|
|
|
33.3 |
% |
|
|
|
|
|
|
|
|
|
|
|
||||||
|
Maximum |
|
³ $292M |
|
|
200 |
% |
|
|
200 |
% |
|
|
³ 75th Percentile |
|
|
200 |
% |
|
|
|
|
|
|
150 |
% |
|
|
|
|
|
|||||||||||
|
Target |
|
$146M |
|
|
100 |
% |
|
|
100 |
% |
|
|
|
50th Percentile |
|
|
100 |
% |
|
|
|
|
|
|
|
|
100 |
% |
|
|
|
|
|
|
|
||||||
|
Threshold |
|
$73M |
|
|
50 |
% |
|
|
50 |
% |
|
|
30th Percentile |
|
|
20 |
% |
|
|
|
|
|
|
0 |
% |
|
|
|
|
|
|||||||||||
|
Below Threshold |
|
< $73M |
|
|
N/A |
|
|
|
0 |
% |
|
|
|
< 30th Percentile |
|
|
0 |
% |
|
|
|
|
|
|
|
|
0 |
% |
|
|
|
|
|
|
|
||||||
|
Actual |
|
$307.6M |
|
|
210.7 |
% |
|
|
200 |
% |
|
|
42nd Percentile |
|
|
66.4 |
% |
|
|
|
|
|
|
125 |
% |
|
|
|
130.5 |
% |
|
||||||||||
The maximum funding for each formulaic (i.e., financial) metric was 200%, the maximum funding for the non-formulaic (i.e., corporate scorecard) metric was 150% and the aggregate maximum funding for the 2016 annual cash bonus plan was capped at 183%. The objective of this structure was to provide predictability of award outcomes for participants while also permitting the Compensation Committee to take into consideration non-formulaic objectives.
-24-
Why use CIBIT as a financial metric?
The Compensation Committee selected CIBIT as one of the financial metrics for the 2016 fiscal year because it believed it was the most comprehensive and relevant measure of our annual results and also correlated closely with shareholder value. In previous years, the Compensation Committee selected earnings before interest and taxes (“EBIT”) as the financial metric, but changed to CIBIT in 2016 in order to address currency translation adjustments following the completion of the acquisitions in Hong Kong and Singapore in 2015.
How is CIBIT calculated?
CIBIT is calculated by taking the company’s comprehensive income and adding back interest expense and tax expense.
What was the level of CIBIT achievement in 2016?
In 2016, CIBIT was $307.6 million, derived as follows (based on approximate totals): $253.0 million of comprehensive income, plus $63.7 million of interest expense, minus $9.1 million of income tax benefit, equals $307.6 million of CIBIT. Based on the $292 million Maximum Target reflected in the table above, this portion of the cash bonus pool was 200% funded.
How were the CIBIT goals for 2016 determined?
The target for the 2016 annual cash bonus pool was based on budgeted CIBIT for the company. The Compensation Committee determined that this target was a fair yet demanding goal, consistent with its philosophy to reward strong company and individual performance, and recognizing that the company continued to face significant challenges in growing its business at a time of heavy competition, excess capacity in the insurance and reinsurance marketplace, and a low fixed-income rate environment. The threshold and maximum goals were selected based on typical ranges used by the Peer Group to ensure that the company’s cash bonus program remained competitive.
Why use ROE relative to the Peer Group as a financial metric?
The Compensation Committee selected ROE relative to the Peer Group because it believes that it is important to have relative performance measures and because it believes this metric strongly correlates with long-term shareholder value. ROE is also a common measure used in the industry and, as a measurement of return, complements well with the CIBIT metric by emphasizing profitable growth.
How is ROE calculated and defined?
For purposes of the company’s annual cash bonus plan, “ROE” is defined as the one-year average adjusted net income divided by the two-year average shareholders’ equity for the period then ending. Please see “— 2016 Equity-Based Compensation — 2016 Equity Awards — How is ROE calculated and defined?” for the definition of “Adjusted net income.” Based on the company’s ROE relative to the Peer Group, which was in the 42nd percentile, the Threshold Target reflected in the table above was achieved and this portion of the cash bonus pool was 66.4% funded.
How were the relative ROE goals for 2016 determined?
Given the competitive insurance and reinsurance marketplace, the Compensation Committee believed that the target goal would be challenging yet obtainable, and that the goal would neither
-25-
sacrifice management’s discipline in its efforts to grow the business nor promote short-term gain over long-term shareholder returns. The threshold and maximum goals were selected based on typical ranges used by the Peer Group to ensure that the company’s cash bonus program remained competitive.
Why is there a non-formulaic (i.e., corporate scorecard) element to the Annual Bonus Pool funding formula?
The non-formulaic portion of the award is intended to take into account other quantitative and qualitative financial, operational and strategic measures to allow the Compensation Committee to assess the company’s performance in ways that may not manifest in near-term financial performance. In 2016, non-formulaic measures included financial metrics, product innovation, international expansion, staff development and internal efficiency.
For 2016, highlights of some of the non-formulaic objectives and related achievements noted in determining this portion of the annual cash bonus pool funding are that we:
- ·
- Successfully negotiated and signed a merger agreement with Fairfax,
pursuant to which, subject to the terms and conditions set forth therein, we will be acquired by Fairfax in a transaction that would provide our shareholders with merger consideration that
represents:
- ·
- an 18% premium to the company’s unaffected
closing stock price on December 16, 2016 of $45.77, which price was close to the then 52-week high price of $47.11, which also represented the all-time high for the company;
- ·
- a 76% premium to the then 52-week low price of $30.75;
- ·
- a 1.35x multiple of the company’s diluted
book value as of September 30, 2016; and
- ·
- a 1.57x multiple of the company’s diluted
tangible book value as of September 30, 2016;
- ·
- Successfully completed various initiatives to integrate the operations
in Hong Kong and Singapore that had been acquired from Royal & Sun Alliance Insurance plc in 2015;
- ·
- Successfully implemented numerous initiatives to manage expenses and
position the businesses for underwriting profitability;
- ·
- Successfully managed probable maximum losses within prescribed limits
based on our economic capital model and established risk tolerances;
- ·
- Scaled back our operations in underperforming business lines and
maintained disciplined underwriting;
- ·
- Continued to expand our insurance and reinsurance product offerings
across a wide array of specialty coverages and jurisdictions; and
- ·
- Successfully supported our growth initiatives through the continued development of our information technology systems and modeling capabilities.
-26-
Based on these measures and other considerations, the Compensation Committee funded the non-formulaic component of the annual cash bonus pool at 125%, which resulted in the annual cash bonus pool being funded at 130.5% of the Target column. Once the Compensation Committee determined the overall cash bonus pool funding level, awards to individual officers then were made based on the CEO’s assessments of individual performance. The annual cash bonus earned for 2016 by each of the NEOs as a percentage of his salary and as a percentage of target bonus was as follows:
| Name | | Bonus as a Percentage of Base Salary |
| Bonus as a Percentage of Target |
| ||||||
|---|---|---|---|---|---|---|---|---|---|---|---|
Scott A. Carmilani |
| |
160% | | | |
133% | | | ||
Thomas A. Bradley |
| | 131% |
| | | 131% |
| | ||
Wesley D. Dupont |
| |
131% | | | |
131% | | | ||
Frank N. D’Orazio |
| | 131% |
| | | 131% |
| | ||
Louis P. Iglesias |
| |
131% | | | |
131% | | | ||
2016 Equity-Based Compensation
The Compensation Committee believes that a substantial portion of each NEO’s compensation should be in the form of long-term, equity-based awards, the largest portion of which should be “at risk” awards with vesting dependent on the company achieving certain performance targets. Equity-based grants have generally been awarded as a combination of performance-based equity awards and time-vested RSUs. Each year, the Compensation Committee sets a mix between the various equity-based vehicles to ensure that a substantial portion of the awards to each NEO is comprised of performance-based awards. The value of each NEO’s individual awards is based on an assessment of each individual’s performance for the prior year, contribution to the business, experience level and external market information.
Equity-based awards serve to better align the interests of the NEOs and our shareholders. Equity-based awards also help to ensure a strong connection between NEO compensation and our financial performance because the value of the award depends on our future performance and share price. Long-term, equity-based awards, meaning awards that vest over a period of years, also serve as a management retention tool. The Compensation Committee utilizes equity-based awards to accomplish its compensation objectives while recognizing its duty to the company’s shareholders to limit diluting their holdings in the company. Each year, the Compensation Committee reviews analyses from its compensation consultant on relevant factors of its equity compensation program, including the competitiveness of equity awards by position, overall share usage, burn rates and comparisons to the equity compensation programs of the Peer Group.
2016 Equity Awards. In February 2016, the Compensation Committee set the mix among performance-based equity awards and time-vested RSU awards at approximately 75% and 25%, respectively. No stock options were granted to any employees.
The total number of performance-based equity awards available for grant each year is determined by the Board based upon the recommendation of the Compensation Committee. In making its recommendation to the Board, the Compensation Committee may consider the number of available shares remaining under the company’s equity plans, the number of employees who will be eligible to receive such awards, market data from competitors with regard to the percentage of outstanding shares made available for annual grants to employees and the need to retain and motivate key employees.
-27-
Performance-based equity awards were granted to our NEOs in February 2016 under the 2012 Omnibus Plan, of which 80% will be eligible to settle in common shares and 20% will be eligible to settle in cash. Awards issued in 2016 will vest after the fiscal year ending December 31, 2018 in accordance with the terms and performance conditions set forth in the Performance-Based Award Agreement under the 2012 Omnibus Plan and as described in more detail below. These performance-based awards are “at risk,” meaning that, should the company fail to perform at the minimum prescribed level, no performance-based awards will vest and no compensation will be paid to the NEOs from these awards. The Compensation Committee believes that performance-based equity awards serve to promote the company’s growth and profitability over the long term. By having a three-year vesting period, these awards also encourage sustainable performance and employee retention.
The company granted the following performance-based equity awards to the NEOs in 2016:
| Name | | Target Awards
|
| |||
|---|---|---|---|---|---|---|
Scott A. Carmilani |
| |
65,009 | | | |
Thomas A. Bradley |
| | 17,678 |
| | |
Wesley D. Dupont |
| |
17,678 | | | |
Frank N. D’Orazio |
| | 17,678 |
| | |
Louis P. Iglesias |
| |
15,967 | | | |
The methodology by which these grants will be earned is shown in the table below:
|
| | Adjusted Book Value on a CAGR Basis |
| | | | Adjusted ROE Relative to the Peer Group |
| | |||||||||||||||||||
| | | | | | | | | | | | | | | | | ||||||||||||||
| |
| Book Value Growth (%) |
| |
| Number of Shares Earned (% of Target) |
| |
| Percentile |
| |
| Number of Shares Earned (% of Target) |
| ||||||||||||||
|---|---|---|---|---|---|---|---|---|---|---|---|---|---|---|---|---|---|---|---|---|---|---|---|---|---|---|---|---|---|
| | | | | | | | | | | | | | | | | ||||||||||||||
Weight |
| |
| | | 50% | | |
| | | |
| |
| | | 50% | | |
| | | ||||||
Maximum |
| | ³ 15% |
| | | | 150% |
| | | | ³ 75th |
| | | | 150% |
| | |||||||||
Target |
| |
9% | | | | | |
100% | | | |
| |
50th | | | | | |
100% | | | ||||||
Threshold |
| | 3% |
| | | | 50% |
| | | | 25th |
| | | | 20% |
| | |||||||||
Below Threshold |
| |
< 3% | | | | | |
0% | | | |
| |
< 25th | | | | | |
0% | | | ||||||
Why use Book Value as a 2016-2018 financial metric?
Based on consultations with Farient and senior management, the Compensation Committee decided to continue to utilize growth in “book value” as one of the financial metrics for the 2016 grant of performance-based equity awards because this metric strongly correlates with long-term shareholder value and the long-term health of the company. Book value growth of the common shares will be measured on a CAGR basis.
How is Book Value calculated?
For purposes of the performance-based equity awards, “book value” is defined as “total shareholders’ equity” adjusted for (1) any special, one-time dividends declared; and (2) any capital events (such as capital contributions or share repurchases). In addition to the two factors above, the Compensation Committee may consider in its discretion any other extraordinary events that may affect the computation.
-28-
Why use ROE relative to the Peer Group as a 2016-2018 financial metric?
The Compensation Committee also approved using the company’s ROE relative to the Peer Group as another financial metric. ROE relative to the Peer Group was included as a component of the financial metric for the 2016 grant of performance-based equity awards as this metric correlates with long-term shareholder value. ROE is also a common measure used in the industry and, as a measurement of return, complements our growth measure, book value growth, by emphasizing profitable growth.
How is ROE calculated and defined?
For purposes of the performance-based equity awards, “ROE” is defined as the three-year average adjusted net income divided by the four-year average shareholders’ equity for the period then ending. “Adjusted net income” is defined as “net income” adjusted by (1) adding or subtracting unrealized gains or losses on investments, respectively, within “other comprehensive income”; (2) subtracting the portion of other-than-temporary impairment losses on investments recognized within “other comprehensive income”; and (3) adding or subtracting any reclassification adjustment for net realized losses or gains on investments, respectively, included in “net income”, each net of applicable income tax.
How were the Adjusted Book Value Growth and Relative ROE target goals for 2016-2018 determined?
Goals for the 2016-2018 performance-based awards were chosen by the Compensation Committee based on a comprehensive competitive analysis of performance, the company’s long-term plans and a competitive review of the calibration of pay to performance.
2014-2016 Performance-Based Equity Awards. The performance period for the performance-based equity awards issued under the company’s 2012 Omnibus Plan in 2014 ended as of December 31, 2016. These awards vested based on: (1) a book value growth on a CAGR basis of 5.55%, which exceeded the 3% threshold but fell below the 9% target established by the Compensation Committee at the grant date; and (2) ROE relative to the company’s Peer Group in 2014, which reached the 25th percentile threshold but fell below the 50th percentile target established by the Compensation Committee at the grant date. These awards vested at 46% of targeted shares, with 73,043 shares earned in the aggregate by recipients.
2016 Time-Vested RSU Awards. A time-vested RSU gives a holder the right to receive a specified number of common shares at no cost (or, in the company’s sole discretion, an equivalent cash amount) if the holder remains employed at the company through the applicable vesting date. Because time-vested RSUs do not have a performance component (unlike our performance-based equity awards), they will generally have value in the future. We believe these awards encourage employee retention. We have historically settled RSUs in common shares and/or cash equal to the “fair market value” of the common shares on the applicable vesting date. Fair market value is defined as the daily volume-weighted average sales price of the common shares for the five consecutive trading days up to and including the applicable vesting date. While the bulk of the company’s RSU awards to NEOs have historically been made pursuant to our annual grant program, the Compensation Committee retains the discretion to recommend to our Board additional awards at other times. The company also grants RSUs as part of its equity-based compensation package to its employees, including the NEOs.
-29-
The company granted the following RSU awards to the NEOs in 2016:
| Name | | 2016 Time-Vested RSUs |
| |||
|---|---|---|---|---|---|---|
Scott A. Carmilani |
| |
21,669 | | | |
Thomas A. Bradley |
| | 5,892 |
| | |
Wesley D. Dupont |
| |
5,892 | | | |
Frank N. D’Orazio |
| | 5,892 |
| | |
Louis P. Iglesias |
| |
5,322 | | | |
Proposed Acquisition Transaction with Fairfax. Pursuant to the Merger Agreement, a subsidiary of Fairfax will commence an exchange offer to purchase all outstanding shares of the company. Immediately prior to the acceptance time of the exchange offer (the “Acceptance Time”), each outstanding RSU and performance-based equity award will become fully vested and, as of the Acceptance Time, cancelled and converted into the right to receive an amount in cash specified in the Merger Agreement. For more information on the treatment of outstanding equity awards, including options, in light of the proposed acquisition transaction with Fairfax, see our Current Report on Form 8-K filed on December 20, 2016 with the SEC (including the complete text of the Merger Agreement, which is attached as Exhibit 2.1 thereto).
Stock Ownership Policy
In order to promote equity ownership and further align the interests of management with our shareholders, senior executives are expected to own a significant amount of equity interests in the company. Under the company’s stock ownership policy, each employee with a title of senior vice president and above is expected to own within five years after his or her joining us or after a promotion to such title, equity interests in the company, expressed as a multiple of base salary as follows:
| Title | | Multiple of Base Salary |
|---|---|---|
CEO |
| 5 times |
Executive Management of the Company(1) |
| 3 times |
Other Presidents, Executive Vice Presidents or Senior Vice Presidents |
| 2 times |
- (1)
- For 2016, executive management was comprised of the company’s ten most senior officers.
Equity interests in the company include unvested RSUs, performance-based awards and exercisable stock options. Employees are expected not to sell any common shares if they will not be in compliance with this policy. If a covered employee previously achieved compliance under the policy but wishes to sell a certain portion of his or her holdings of common shares at a time when he or she is not in compliance with the policy solely as a result of a significant decrease in the price of common shares, the policy allows the General Counsel of the company to exercise his discretion to allow such sale to occur. All NEOs currently meet or exceed the requirements of the stock ownership policy.
Under the company’s Policy Regarding Insider Trading for all Directors, Officers and Employees and its Code of Conduct and Business Ethics, employees are prohibited from engaging in speculative or “in and out” trading in securities of the company. In addition, the company also prohibits pledging of its securities and hedging and derivative transactions in its securities (other than transactions in the
-30-
company’s employee stock options) and trading in or through margin accounts. These transactions are characterized by short sales, buying or selling publicly traded options, swaps, collars or similar derivative transactions.
Retirement, Health and Welfare Benefits
The company offers a variety of health and welfare programs to all eligible employees. The NEOs are generally eligible for the same benefit programs on the same basis as the rest of the company’s employees. The health and welfare programs are intended to protect employees against catastrophic loss and include medical, pharmacy, dental, vision, life insurance, accidental death and disability, and short- and long-term disability. Senior employees earning over certain salary levels per year contributed to the cost of their medical insurance based upon a sliding scale tied to their salary level. We offer a qualified 401(k) savings and retirement plan for our employees who are U.S. citizens (wherever they may be located) and similar plans for our other employees. All company employees, including the NEOs, are generally eligible for these plans. The company contributes to such employees’ accounts as well in the form of a matching contribution and up to a 2% profit sharing contribution.
We have established the Allied World Assurance Company (U.S.) Inc. Second Amended and Restated Supplemental Executive Retirement Plan (the “SERP”) for our employees who are U.S. citizens and who reside in the United States. We contribute under the SERP up to 10% of a participant’s annual base salary in excess of the then-effective maximum amount of annual compensation that could be taken into account under a qualified plan under the U.S. Internal Revenue Code of 1986 (the “Code”), as established by the IRS from time to time (the “IRS Compensation Limit”), with an annual base salary cap of $600,000. This means that we will start making contributions under the SERP to a participant only after such participant has earned annual base salary in excess of the IRS Compensation Limit ($265,000 in 2016) and will stop making such contributions once a participant has earned $600,000. Under the SERP, an eligible NEO may voluntarily contribute up to 25% of his or her annual base salary up to a maximum of $600,000.
There is a five-year cumulative vesting period for all company contributions so that upon completion of five years of service, a participant will be 100% vested in all prior and future contributions made on his or her behalf by the company or its subsidiaries. The company contributions shall also fully vest upon a participant’s retiring after attaining the age of 65. Executives may defer receipt of part of their cash compensation under the SERP. The program allows U.S. officers to save for retirement in a tax-effective way at minimal cost to the company. The investment alternatives under the SERP are the same choices available to all participants under the 401(k) plan, and the NEOs do not receive preferential treatment on their investments. The SERP is intended to comply with Sections 409A and 457A of the Code. The company believes that contributing to a participant’s retirement and having a five-year cumulative vesting for the company’s contributions on behalf of a participant attracts senior officers who want to remain with the company for the long term and help it achieve its business objectives.
Effective as of January 1, 2016, we amended the SERP so that, subject to shareholder approval as discussed below, certain executives, including the NEOs, will be entitled to receive a one-time contribution (the “Contribution”) from us. The Contribution is in addition to the ordinary contributions made by us under the SERP and is subject to forfeiture in the event the NEO’s employment is terminated prior to January 1, 2020 by us with cause or by the NEO without good reason as follows: 100% was to be forfeited if such termination occurred prior to January 1, 2017, 75% will be forfeited if such termination occurs on or after January 1, 2017 and prior to January 1, 2018, 50% will be forfeited if such termination occurs on or after January 1, 2018 and prior to January 1, 2019 and 25% will be forfeited if such termination occurs on or after January 1, 2019 and prior to January 1, 2020.
-31-
The Contribution was originally scheduled to be subject to shareholder approval in four equal installments at the 2016, 2017, 2018 and 2019 annual shareholder meetings of the company, and at the company’s 2016 Annual Shareholder Meeting, shareholders approved the company’s executive compensation proposal, which included the first installment of the Contribution. However, in connection with the proposed acquisition transaction with Fairfax, the company’s shareholders will be asked to approve the 75% of the Contribution that remains subject to shareholder approval at an extraordinary general meeting of the company’s shareholders to be held after the Acceptance Time. Vesting and pay-out of the Contribution will be unaffected by the proposed acquisition transaction with Fairfax and will be governed by the original terms, including forfeiture conditions, specified in the SERP following the Acceptance Time.
Perquisites
The Compensation Committee and senior management assess the prevalence and costs of each perquisite provided to the NEOs to ensure that any perquisites remain reasonable and in-line with marketplace practices. The company has eliminated or reduced a number of perquisites in recent years.
Financial and Tax Planning. Our NEOs receive financial and tax planning. Because many of the company’s senior officers are subject to complicated tax issues from working abroad on a full-time or part-time basis, the company provides reimbursement or payment of the cost for financial and tax planning to certain of the senior officers. In 2016, the company reimbursed up to $10,000 for financial planning for its NEOs. The company believes this perquisite is important for retention purposes and for helping to ensure the long-term financial security of the NEOs.
-32-
| Summary Compensation Table |
The following table provides information concerning the compensation for services in all capacities earned by the NEOs for fiscal years 2016, 2015 and 2014.
| Name and Principal Position | | Year | | Salary ($) | | Stock Awards ($)(2) |
| Option Awards ($) |
| Non-Equity Incentive Plan Compensation ($)(3) |
| All Other Compensation ($)(4) |
| Total ($) | | |||||||||||||
|---|---|---|---|---|---|---|---|---|---|---|---|---|---|---|---|---|---|---|---|---|---|---|---|---|---|---|---|---|
Scott A. Carmilani(1) |
| 2016 |
|
$ |
1,000,000 |
|
$ |
2,769,362 |
|
|
$ |
— |
|
|
|
$ |
1,600,000 |
|
|
|
$ |
84,050 |
|
|
$ |
5,453,412 |
| |
President, Chief Executive |
| 2015 | | $ | 1,000,000 | | $ | 5,993,064 | | | $ | — | | | | $ | 500,000 | | | | $ | 107,861 | | | $ | 7,600,925 | | |
Officer and Chairman of the Board |
| 2014 | | $ | 1,000,000 | | $ | 5,763,225 | | | $ | — | | | | $ | 1,884,000 | | | | $ | 102,940 | | | $ | 8,750,165 | | |
Thomas A. Bradley |
| 2016 |
| $ |
500,000 |
| $ |
753,062 |
| |
$ |
— |
| | |
$ |
652,800 |
| | |
$ |
556,753 |
| | $ |
2,462,615 |
| |
Executive Vice President and |
| 2015 | | $ | 500,000 | | $ | 1,033,283 | | | $ | — | | | | $ | 210,000 | | | | $ | 52,354 | | | $ | 1,795,637 | | |
Chief Financial Officer |
| 2014 | | $ | 500,000 | | $ | 993,712 | | | $ | — | | | | $ | 855,000 | | | | $ | 53,159 | | | $ | 2,401,871 | | |
Wesley D. Dupont |
| 2016 |
|
$ |
500,000 |
|
$ |
753,062 |
|
|
$ |
— |
|
|
|
$ |
652,800 |
|
|
|
$ |
566,854 |
|
|
$ |
2,472,716 |
| |
Executive Vice President and |
| 2015 | | $ | 500,000 | | $ | 1,033,283 | | | $ | — | | | | $ | 210,000 | | | | $ | 61,205 | | | $ | 1,804,488 | | |
General Counsel |
| 2014 | | $ | 500,000 | | $ | 993,712 | | | $ | — | | | | $ | 855,000 | | | | $ | 56,110 | | | $ | 2,404,822 | | |
Frank N. D’Orazio |
| 2016 |
| $ |
500,000 |
| $ |
753,062 |
| |
$ |
— |
| | |
$ |
652,800 |
| | |
$ |
563,927 |
| | $ |
2,469,789 |
| |
President, Underwriting and |
| 2015 | | $ | 500,000 | | $ | 929,987 | | | $ | — | | | | $ | 210,000 | | | | $ | 99,658 | | | $ | 1,739,645 | | |
Global Risk |
| 2014 | | $ | 500,000 | | $ | 794,969 | | | $ | — | | | | $ | 825,000 | | | | $ | 420,131 | | | $ | 2,540,100 | | |
Louis P. Iglesias |
| 2016 |
|
$ |
525,000 |
|
$ |
680,184 |
|
|
$ |
— |
|
|
|
$ |
686,400 |
|
|
|
$ |
551,973 |
|
|
$ |
2,443,557 |
| |
President, North America Allied |
| 2015 | | $ | 525,000 | | $ | 878,318 | | | $ | — | | | | $ | 210,000 | | | | $ | 52,437 | | | $ | 1,665,755 | | |
World Assurance Company (U.S.) |
| 2014 | | $ | 525,000 | | $ | 844,705 | | | $ | — | | | | $ | 830,000 | | | | $ | 44,105 | | | $ | 2,243,810 | | |
Inc. and Allied World National |
| | | | | | | | | | | | | | ||||||||||||||
Assurance Company |
| | | | | | | | | | | | | | ||||||||||||||
- (1)
- Mr. Carmilani
receives no additional compensation for serving as our Chairman of the Board.
- (2)
- The
amounts shown in the “Stock Awards” column equal the estimate of aggregate compensation cost to be recognized with respect to RSU
and performance-based awards granted in such year determined as of the grant date under FASB ASC Topic 718 and excluding the effect of estimated forfeitures. The following portion of the value shown
in the “Stock Awards” column in 2016 represents the grant date value of performance-based awards ($31.95 per common share, the closing price for the awards issued on
February 22, 2016) based upon the probable outcome of such performance criteria: $2,077,038 for Mr. Carmilani, $564,812 for Mr. Bradley, $564,812 for Mr. Dupont, $564,812
for Mr. D’Orazio and $510,146 for Mr. Iglesias. The remaining amounts reflected in the “Stock Awards” column represent the grant date fair
value of RSU awards that are not subject to performance vesting conditions.
- Assuming
the highest level of performance, the grant date fair value of performance-based awards granted in 2016 would equal $3,115,572 for
Mr. Carmilani, $847,218 for Mr. Bradley, $847,218 for Mr. Dupont, $847,218 for Mr. D’Orazio and $765,234 for Mr. Iglesias. For additional information
on the calculation of compensation expenses, please refer to note 13(b), (c) and (d) of the company’s consolidated financial statements contained in the
Form 10-K for the year ended December 31, 2016, as filed with the SEC.
- (3)
- The amounts shown in the “Non-Equity Incentive Plan Compensation” column represent cash bonuses earned under our 2016, 2015 and 2014 cash bonus plans and were paid in February 2017, February 2016 and February 2015, respectively. For a description of our annual cash bonus plan, see “ — Compensation Discussion and Analysis — 2016 Cash Compensation — 2016 Annual Cash Bonus.”
-33-
- (4)
- The amounts shown in the “All Other Compensation” column are attributable to perquisites and other personal benefits or compensation not reported elsewhere in the Summary Compensation Table. The table below shows certain components of the “All Other Compensation” column.
| Name | | Year
|
| 401(k)/ Company Contributions |
| SERP/ Pension Plan Company Contributions |
| Perquisites(a)
|
| Tax Payments |
| Aggregate “All Other Compensation” |
| ||||||||||||||||
|---|---|---|---|---|---|---|---|---|---|---|---|---|---|---|---|---|---|---|---|---|---|---|---|---|---|---|---|---|---|
Scott A. Carmilani |
| 2016 |
|
|
$ |
21,200 |
|
|
|
$ |
33,499 |
|
|
|
$ |
29,351 |
|
|
|
$ |
— |
|
|
|
$ |
84,050 |
| | |
Thomas A. Bradley |
| 2016 |
| |
$ |
21,200 |
| | |
$ |
523,499 |
| | |
$ |
12,054 |
| | |
$ |
— |
| | |
$ |
556,753 |
| | |
Wesley D. Dupont |
| 2016 |
|
|
$ |
21,200 |
|
|
|
$ |
523,499 |
|
|
|
$ |
22,155 |
|
|
|
$ |
— |
|
|
|
$ |
566,854 |
| | |
Frank N. D’Orazio |
| 2016 |
| |
$ |
21,200 |
| | |
$ |
523,499 |
| | |
$ |
19,228 |
| | |
$ |
— |
| | |
$ |
563,927 |
| | |
Louis P. Iglesias |
| 2016 |
|
|
$ |
21,200 |
|
|
|
$ |
525,997 |
|
|
|
$ |
4,776 |
|
|
|
$ |
— |
|
|
|
$ |
551,973 |
| | |
- (a)
- Perquisites in 2016 for the NEOs include reimbursements for amounts for certain tax preparation, financial planning, and life and executive disability insurance premiums.
-34-
| Grants of Plan-Based Awards |
The following table provides information concerning grants of plan-based awards made to our NEOs in fiscal year 2016.
| |
| |
| |
| |
| |
| |
| |
| |
| |
| All Other Option Awards: Number of Securities Underlying Options (#) |
| |
| |
| |||||||||||||||||||||
|---|---|---|---|---|---|---|---|---|---|---|---|---|---|---|---|---|---|---|---|---|---|---|---|---|---|---|---|---|---|---|---|---|---|---|---|---|---|---|---|---|---|---|---|---|
| |
| |
| |
| |
| |
| |
| |
| |
| All other Stock Awards: Number of Shares of Stock or Units (#)(3) |
| |
| |
| |||||||||||||||||||||||
| |
| |
| Estimated Future Payouts Under Non-Equity Incentive Plan Awards(1) |
| Estimated Future Payouts Under Equity Incentive Plan Awards(2) |
| Exercise or Base Price of Option Awards ($/Sh) |
| Grant Date Fair Value of Stock and Option Awards |
| |||||||||||||||||||||||||||||||||
| Name | | Grant Date |
| Threshold ($) |
| Target ($) |
| Maximum ($) |
| Threshold (#) |
| Target (#) |
| Maximum (#) |
| |||||||||||||||||||||||||||||
Scott A. Carmilani |
| |
|
$ |
276,000 |
|
$ |
1,200,000 |
|
— |
|
|
— |
|
|
— |
|
|
— |
|
|
|
— |
|
|
|
— |
|
|
|
— |
|
|
— |
| |||||||||
|
| 2/22/2016 | | — | | — | | — | | | 22,753 | | | 65,009 | | | 97,514 | | | | — | | | | — | | | | — | | | $ | 2,077,038 | | ||||||||||
|
| 2/22/2016 | | — | | — | | — | | | — | | | — | | | — | | | | 21,669 | | | | — | | | | — | | | $ | 692,325 | | ||||||||||
Thomas A. Bradley |
| | $ |
115,000 |
| $ |
500,000 |
| — |
| | — |
| | — |
| | — |
| | | — |
| | | — |
| | | — |
| | — |
| ||||||||||
|
| 2/22/2016 | | — | | — | | — | | | 6,187 | | | 17,678 | | | 26,517 | | | | — | | | | — | | | | — | | | $ | 564,812 | | ||||||||||
|
| 2/22/2016 | | — | | — | | — | | | — | | | — | | | — | | | | 5,892 | | | | — | | | | — | | | $ | 188,249 | | ||||||||||
Wesley D. Dupont |
| |
|
$ |
115,000 |
|
$ |
500,000 |
|
— |
|
|
— |
|
|
— |
|
|
— |
|
|
|
— |
|
|
|
— |
|
|
|
— |
|
|
— |
| |||||||||
|
| 2/22/2016 | | — | | — | | — | | | 6,187 | | | 17,678 | | | 26,517 | | | | — | | | | — | | | | — | | | $ | 564,812 | | ||||||||||
|
| 2/22/2016 | | — | | — | | — | | | — | | | — | | | — | | | | 5,892 | | | | — | | | | — | | | $ | 188,249 | | ||||||||||
|
|
|
|
|
|
|
|
|
|
|
|
|
|
|
|
|
|
|
|
|
|
|||||||||||||||||||||||
Frank N. D’Orazio |
| | $ | 115,000 | | $ | 500,000 | | — | | | — | | | — | | | — | | | | — | | | | — | | | | — | | | — | | ||||||||||
|
| 2/22/2016 | | — | | — | | — | | | 6,187 | | | 17,678 | | | 26,517 | | | | — | | | | — | | | | — | | | $ | 564,812 | | ||||||||||
|
| 2/22/2016 | | — | | — | | — | | | — | | | — | | | — | | | | 5,892 | | | | — | | | | — | | | $ | 188,249 | | ||||||||||
|
|
|
|
|
|
|
|
|
|
|
|
|
|
|
|
|
|
|
|
|
|
|||||||||||||||||||||||
Louis P. Iglesias |
| | | $ | 120,750 | | $ | 525,000 | | — | | | — | | | — | | | — | | | | — | | | | — | | | | — | | | — | | |||||||||
|
| 2/22/2016 | | — | | — | | — | | | 5,588 | | | 15,967 | | | 23,951 | | | | — | | | | — | | | | — | | | $ | 510,146 | | ||||||||||
|
| 2/22/2016 | | — | | — | | — | | | — | | | — | | | — | | | | 5,322 | | | | — | | | | — | | | $ | 170,038 | | ||||||||||
- (1)
- The company’s 2016 cash bonus plan provided for funding of the pool based on target CIBIT and ROE goals and a non-formulaic portion that is intended to take into account other measurers of performance. The NEOs are eligible for annual cash bonuses as a percentage of their base salaries. For more information on the target CIBIT goals and percentages, see “— Compensation Discussion and Analysis — 2016 Cash Compensation — 2016 Annual Cash Bonus.”
The amounts provided in the “Estimated Future Payouts Under Non-Equity Incentive Plan Awards” columns above assume that the same percentage of funding of the annual cash bonus pool will be applied to each NEO.
Threshold. The amounts provided in the applicable “threshold” column above assume that the annual cash bonus pool will be funded based on the minimum targets, with Mr. Carmilani receiving 27.6% and each other NEO receiving 23% of base salary. The difference in the threshold percentages for Mr. Carmilani and the other NEOs is due to Mr. Carmilani having a target bonus of 120% of his base salary and the other NEOs having a target bonus of 100% of their base salaries. Accordingly, we have reduced by 72.4% for Mr. Carmilani and by 77% for each other NEO the amount he would be eligible to receive based on his target bonus as a percentage of base salary, as reflected below in the “adjusted bonus” column below.
| Name | | Bonus Target as a Percentage of Base Salary |
| Adjusted Bonus Target as a Percentage of Base Salary |
|---|---|---|---|---|
Scott A. Carmilani |
| 120% |
| 27.6% |
Thomas A. Bradley |
| 100% |
| 23% |
Wesley D. Dupont |
| 100% |
| 23% |
Frank N. D’Orazio |
| 100% |
| 23% |
Louis P. Iglesias |
| 100% |
| 23% |
|
| |
- The amounts provided in the applicable “threshold” column above indicate the dollar amount calculated by multiplying the “adjusted bonus target as a percentage of base salary” (as set forth in the table in this footnote) by the NEO’s base salary.
-35-
Target. The amounts provided in the applicable “target” column above assume that the annual cash bonus pool will be 100% funded and that each NEO will receive the full amount of the cash bonus that he or she is eligible to receive. The dollar amount for each NEO is calculated by multiplying the “bonus target as a percentage of base salary” (as set forth in the table in this footnote) by the NEO’s base salary.
Maximum. If we achieve or exceed the “maximum” threshold, the annual cash bonus plan may be 183% funded as described in greater detail in “— Compensation Discussion and Analysis — 2016 Cash Compensation — 2016 Annual Cash Bonus.” However, individual bonuses under the annual cash bonus plan are not capped or subject to any maximums, so long as the aggregate amount of the bonus pool is not exceeded. Accordingly, no information appears in the applicable column above.
- (2)
- Amounts disclosed in these columns represent a target performance-based award granted under the 2012 Omnibus Plan, 80% of which is eligible to settle in our common shares and 20% of which is eligible to settle in cash. The vesting of these performance-based awards is currently based on “book value” growth and “ROE”, as described in greater detail in “— Compensation Discussion and Analysis — 2016 Equity-Based Compensation — 2016 Equity Awards.”
The vested share amounts disclosed in the applicable columns of the “Estimated Future Payouts Under Equity Incentive Plan Awards” assumes as follows: for the “threshold” column, the book value of 3% measured on a CAGR basis and an ROE in the 25th percentile relative to the Peer Group; for the “target” column, a book value of 9% measured on a CAGR basis and an ROE in the 50th percentile relative to the Peer Group; and for the “maximum” column, a book value of 15% measured on a CAGR basis and an ROE in the 75th percentile relative to the Peer Group. The performance-based awards had a grant date fair value equal to the closing price of our common shares on February 22, 2016 ($31.95). In calculating the grant date value, it was assumed that the performance target regarding such awards will be attained.
- (3)
- Represents each NEO’s annual grant of RSUs on February 22, 2016 pursuant to the company’s 2012 Omnibus Plan. In accordance with FASB ASC Topic 718, the grant date fair value included in the table reflects the closing price of our common shares on the grant date ($31.95) multiplied by the number of RSUs granted to the NEO. Of the aggregate amount of such RSUs, 80% will settle in common shares and 20% will settle in cash equal to the fair market value of our common shares on the applicable vesting date. For more information on these grants, please see “— Compensation Discussion and Analysis — Equity-Based Compensation — 2016 Equity Awards — 2016 Time-Vested RSU Awards.”
2012 Omnibus Plan
We maintain the 2012 Omnibus Plan, which was approved by our shareholders on May 3, 2012. Under the 2012 Omnibus Plan, up to 4,500,000 of our common shares may be issued, subject to adjustment as described below. During 2016, we granted 689,042 time-vested RSUs and 200,730 performance-based awards under the 2012 Omnibus Plan that settle in common shares. The 2012 Omnibus Plan provides for the grant of options intended to qualify as incentive stock options (“ISOs”) under Section 422 of the Code nonqualified stock options (“NSOs”), stock appreciation rights (“SARs”), restricted shares, RSUs, deferred share units, cash incentive awards, performance-based compensation awards and other equity-based and equity-related awards. These awards will generally vest pro rata over four years from the date of grant, except for performance-based awards that will generally vest over a three-year period based on the achievement of certain performance conditions. However, the Compensation Committee may determine the terms and conditions under which certain awards are eligible to vest. Awards may be made to any of our directors, officers, employees (including prospective employees), consultants and other individuals who perform services for us, as determined by the Compensation Committee in its discretion. The Compensation Committee may grant ISOs, NSOs
-36-
and SARs to purchase common shares (at the price set forth in the award agreement, but in no event less than 100% of the fair market value of the common shares on the date of grant) subject to the terms and conditions as it may determine. For performance-based awards, performance conditions will be selected by the Compensation Committee or the Board prior to the commencement of an applicable performance period from a list of permissible financial metrics. These awards will be intended to qualify as “qualified performance-based compensation” under Section 162(m) of the Code. While the Board retains the right to terminate the 2012 Omnibus Plan at any time, in any case the 2012 Omnibus Plan will terminate on May 3, 2022.
The shares subject to the 2012 Omnibus Plan are authorized but unissued common shares. If any award is forfeited or is otherwise terminated or canceled without the delivery of common shares, then such shares will again become available under the 2012 Omnibus Plan. Unless otherwise provided in an award agreement or a participant’s employment agreement, in the event of our change of control, (i) any options or SARs outstanding as of a termination of a participant’s employment by the company without “cause” or by the participant for “good reason” (as each term is defined in the 2012 Omnibus Plan), in each case, that occurs within two years following the date the change of control occurs, will automatically vest and become exercisable at the time of such termination; (ii) any performance compensation awards outstanding as of a termination of a participant’s employment by the company without cause or by the participant for good reason, in each case, that occurs within two years following the date the change of control occurs, will automatically vest and be paid out at the time of such termination at the same percentage at which the company is expensing such award for financial reporting purposes immediately prior to such termination; and (iii) all other awards outstanding as of a termination of a participant’s employment by the company without cause or by the participant for good reason, in each case, that occurs within two years following the date the change of control occurs, will automatically vest and become exercisable and all restrictions and forfeiture provisions related thereto will lapse at the time of such termination.
Pursuant to the 2012 Omnibus Plan, if a participant who is subject to Section 16(a) of the Securities Exchange Act of 1934, as amended (the “Exchange Act”) engages in any act of fraud or intentional misconduct that contributes materially to any financial restatement of the company, any portion of an award that previously vested and was paid to such participant will immediately terminate and the participant will be required to repay to the company the difference between any amount paid within the one-year period preceding the financial restatement and the amount that should have been paid with respect to the participant’s award based on the financial restatement.
Our Compensation Committee has the authority to adjust the terms of any outstanding awards, the number of common shares covered by each outstanding award and the number of common shares issuable under the 2012 Omnibus Plan as it deems appropriate for any increase or decrease in the number of issued common shares resulting from a stock dividend, stock split, reverse stock split, recapitalization, reorganization, merger, consolidation, combination, exchange or any other event that the Compensation Committee determines affects our capitalization, other than regular cash dividends. In the event of a merger, amalgamation or consolidation, the sale of a majority of the company’s securities or the reorganization or liquidation of the company, the Compensation Committee will have the discretion to provide, as an alternative to the adjustment described above, for the accelerated vesting of options prior to such an event or the cancellation of options in exchange for a payment based on the per-share consideration being paid in connection with the event.
2008 Employee Share Purchase Plan
On February 28, 2008, the Board adopted the Amended and Restated 2008 Employee Share Purchase Plan (“ESPP”), which was approved by our shareholders on May 8, 2008. The purposes of the ESPP are to provide our employees with an opportunity to purchase common shares, help such
-37-
employees to provide for their future security and encourage such employees to remain in the employment of the company and its subsidiaries. The ESPP is designed to qualify as an “employee share purchase plan” under Section 423 of the Code. A total of 3,000,000 common shares are reserved for issuance under the plan. Of that amount, 2,406,201 common shares remained available for issuance as of December 31, 2016. The ESPP provides for consecutive six-month offering periods (or other periods of not more than 27 months as determined by the Compensation Committee) under which participating employees can elect to have between 1% and 10% of their base salary withheld and applied to the purchase of common shares at the end of the period. Unless otherwise determined by the Compensation Committee before an offering period, the purchase price will be 85% of the fair market value of the common shares at the end of the offering period. Applicable Code limitations specify, in general, that a participant’s right to purchase shares under the plan cannot accumulate at a rate in excess of $25,000 (based on the value at the beginning of the applicable offering periods) per calendar year.
Employment Agreements
On January 1, 2016, we entered into an amended employment agreement with each of our NEOs, which amended and superseded the prior employment agreement between us and each of our NEOs. Each employment agreement is for a three-year term, subject to earlier termination as set forth therein. Each employment agreement provides for base salary, discretionary annual cash bonuses and reimbursement for business expenses. Each NEO is subject to non-interference and non-competition covenants during the term of his employment agreement. Generally, the non-interference covenant prevents the NEO from soliciting or inducing any of our employees or other service providers to reduce or terminate their employment or service with us, from soliciting or inducing any of our customers or other third parties with whom we have a business relationship to reduce or cease their business with us or from otherwise interfering with our business relationships. Generally, the non-competition covenant prevents the NEO from engaging in activities that compete with our business in certain jurisdictions. Each employment agreement also contains standard confidentiality and assignment of inventions provisions. In addition, each employment agreement provides that we would generally indemnify the NEO to the fullest extent permitted, except in certain limited circumstances.
Each employment agreement terminates upon the earliest to occur of (i) the NEO’s death, (ii) a termination by reason of a disability, (iii) a termination by us with cause, (iv) the one-year anniversary of a notice by us for termination without cause, and (v) the one-year anniversary of a notice by the NEO for termination for any reason. During the one-year notice period (the “Notice Period”), we may place the NEO on Garden Leave (i.e., relieve the NEO of his obligation to provide services to us). During the Notice Period, the NEO will be entitled to (i) base salary, (ii) accrued but unpaid obligations, (iii) any unpaid annual bonus with respect to any completed fiscal year determined using the actual annual bonus or the average annual bonus paid in the last two years if the actual annual bonus has not been finalized, (iv) a pro rata annual bonus determined using the average annual bonus paid in the last two years, (v) a full-year annual bonus using the average annual bonus paid in the last two years, (vi) continued participation in health and insurance plans, (vii) continued vesting of equity-based awards and (viii) as of the last day of the Notice Period, vesting in the number of equity-based awards that would otherwise have vested during the two-year period immediately following the Notice Period, subject to the Change in Control Acceleration (as defined below). Upon termination due to the NEO’s death or disability, he (or his estate or beneficiaries) will be entitled to the same benefits described above, except that he (or his estate or beneficiaries) will receive one year, rather than two years, of vesting of equity-based awards and will not be entitled to base salary or continued participation in health and insurance plans. Upon any termination (other than by the company with cause or by the NEO without good reason) within two years following a change in control, all equity-based awards granted to the NEO will vest (the “Change in Control Acceleration”). Please see “Potential Payments Upon a Termination or Change in Control” table further on in this Form 10-K as well as the footnotes thereto for more information.
-38-
| Outstanding Equity Awards at Fiscal Year-End |
The following table summarizes the number of securities underlying awards for each NEO as of December 31, 2016.
| |
| Option Awards | | Stock Awards | | ||||||||||||||||||||||||||||||||||
|---|---|---|---|---|---|---|---|---|---|---|---|---|---|---|---|---|---|---|---|---|---|---|---|---|---|---|---|---|---|---|---|---|---|---|---|---|---|---|---|
| Name | | Number of Securities Underlying Unexercised Options (#) Exercisable(1) |
| Number of Securities Underlying Unexercised Options (#) Unexercisable |
| Option Exercise Price ($) |
| Option Expiration Date |
| Number of Shares or Units of Stock That Have Not Vested (#) |
| Market Value of Shares or Units of Stock That Have Not Vested ($)(6) |
| Equity Incentive Plan Awards: Number of Unearned Shares, Units, or Other Rights That Have Not Vested (#) |
| Equity Incentive Plan Awards: Market or Payout Value of Unearned Shares, Units, or Other Rights That Have Not Vested ($)(6) |
| ||||||||||||||||||||||
Scott A. Carmilani |
| |
134,415 |
|
|
|
— |
|
|
|
$ |
20.50 |
|
|
02/22/2021 |
|
|
12,801 |
(2) |
|
|
$ |
687,542 |
|
|
|
111,700 |
(7) |
|
|
$ |
5,999,407 |
| | |||||
|
| | | | | | | | | | | | | | | | 21,468 | (3) | | | $ | 1,153,046 | | | | 65,009 | (8) | | | $ | 3,491,633 | | | ||||||
|
| | | | | | | | | | | | | | | | 27,925 | (4) | | | $ | 1,499,852 | | | | | | | | | | | |||||||
|
| | | | | | | | | | | | | | | | 21,669 | (5) | | | $ | 1,163,842 | | | | | | | | | | | |||||||
Thomas A. Bradley |
| | — |
| | | — |
| | | — |
| | — |
| | 1,656 |
(2) |
|
|
$ |
88,944 |
| | | 19,258 |
(7) |
|
|
$ |
1,034,347 |
| | ||||||
|
| | | | | | | | | | | | 3,702 | (3 | | | $ | 198,834 | | | | 17,678 | (8) | | | $ | 949,485 | | | ||||||||||
|
| | | | | | | | | | | | 4,815 | (4) | | | $ | 258,614 | | | | | | | | | |||||||||||||
|
| | | | | | | | | | | | 5,892 | (5) | | | $ | 316,459 | | | | | | | | | |||||||||||||
Wesley D. Dupont |
| |
19,530 |
|
|
|
— |
|
|
|
$ |
20.50 |
|
|
02/22/2021 |
|
|
2,208 |
(2) |
|
|
$ |
118,592 |
|
|
|
19,258 |
(7) |
|
|
$ |
1,034,347 |
| | |||||
|
| | | | | | | | | | | | | | | | 3,702 | (3) | | | $ | 198,834 | | | | 17,678 | (8) | | | $ | 949,485 | | | ||||||
|
| | | | | | | | | | | | | | | | 4,815 | (4) | | | $ | 258,614 | | | | | | | | | | | |||||||
|
| | | | | | | | | | | | | | | | 5,892 | (5) | | | $ | 316,459 | | | | | | | | | | | |||||||
Frank N. D’Orazio |
| | 16,065 |
| | | — |
| | |
$ |
20.50 |
| | 02/22/2021 |
| | 1,767 |
(2) |
|
|
$ |
94,906 |
| | | 17,333 |
(7) |
|
|
$ |
930,955 |
| | |||||
|
| | | | | | | | | | | | 2,964 | (3) | | | $ | 159,196 | | | | 17,678 | (8) | | | $ | 949,485 | | | ||||||||||
|
| | | | | | | | | | | | 4,335 | (4) | | | $ | 232,833 | | | | | | | | | |||||||||||||
|
| | | | | | | | | | | | 5,892 | (5) | | | $ | 316,459 | | | | | | | | | |||||||||||||
Louis P. Iglesias |
| |
— |
|
|
|
— |
|
|
|
— |
|
|
— |
|
|
3,312 |
(2) |
|
|
$ |
177,888 |
|
|
|
16,370 |
(7) |
|
|
$ |
879,233 |
| | ||||||
|
| | | | | | | | | | | | | | | | 3,150 | (3) | | | $ | 169,187 | | | | 15,967 | (8) | | | $ | 857,588 | | | ||||||
|
| | | | | | | | | | | | | | | | 4,094 | (4) | | | $ | 219,889 | | | | | | | | | | | |||||||
|
| | | | | | | | | | | | | | | | 5,322 | (5) | | | $ | 285,845 | | | | | | | | | | | |||||||
- (1)
- All
of the stock options listed in the table above have fully vested.
- (2)
- These
RSUs vest on February 19, 2017.
- (3)
- These
RSUs vest pro rata on February 18, 2017 and 2018.
- (4)
- These
RSUs vest pro rata on February 17, 2017, 2018 and 2019.
- (5)
- These
RSUs vest pro rata on February 22, 2017, 2018, 2019 and 2020.
- (6)
- Assumes
a price of $53.71 per common share, the closing price as of December 30, 2016.
- (7)
- These
performance-based equity awards are not eligible to vest until after December 31, 2017. These awards vest upon the achievement of established
performance criteria during an applicable three-year period. The amounts reflected in the table above represent the target performance goals.
- (8)
- These performance-based equity awards are not eligible to vest until after December 31, 2018. These awards vest upon the achievement of established performance criteria during an applicable three-year period. The amounts reflected in the table above represent the target performance goals. For additional information regarding these performance-based awards, see “— Compensation Discussion and Analysis — 2016 Equity-Based Compensation.”
-39-
| Option Exercises and Stock Vested |
The following table summarizes information underlying each exercise of stock options, vesting of RSUs or vesting of performance-based awards for each NEO in 2016.
| |
| Option Awards | | Stock Awards | | ||||||||||||||||
|---|---|---|---|---|---|---|---|---|---|---|---|---|---|---|---|---|---|---|---|---|---|
| Name | | Number of Shares Acquired on Exercise (#) |
| Value Realized on Exercise ($) |
| Number of Shares Acquired on Vesting (#) |
| Value Realized on Vesting ($) |
| ||||||||||||
Scott A. Carmilani |
| |
— |
|
|
|
— |
|
|
|
3,393 |
|
|
|
$ |
108,406 |
(1) |
|
|||
|
| | | | | | | | | | 13,572 | | | | $ | 427,111 | (2) | | |||
|
| | | | | | | | | | 12,801 | | | | $ | 399,647 | (3) | | |||
|
| | | | | | | | | | 5,367 | | | | $ | 170,778 | (4) | | |||
|
| | | | | | | | | | 5,367 | | | | $ | 166,538 | (5) | | |||
|
| | | | | | | | | | 5,585 | | | | $ | 173,358 | (6) | | |||
|
| | | | | | | | | | 3,723 | | | | $ | 115,525 | (7) | | |||
|
| | | | | | | | | | 23,699 | | | | $ | 1,272,873 | (8) | | |||
|
| | | | | | | | | | 35,549 | | | | $ | 1,901,872 | (9) | | |||
Thomas A. Bradley |
| | — |
| | | — |
| | | 1,656 |
| | |
$ |
51.700 |
(3) |
|
|||
|
| | | | | | | | 927 | | | | $ | 29,497 | (4) | | |||||
|
| | | | | | | | 927 | | | | $ | 28,765 | (5) | | |||||
|
| | | | | | | | 963 | | | | $ | 29,892 | (6) | | |||||
|
| | | | | | | | 642 | | | | $ | 19,921 | (7) | | |||||
|
| | | | | | | | 4,087 | | | | $ | 219,513 | (8) | | |||||
|
| | | | | | | | 6,129 | | | | $ | 327,902 | (9) | | |||||
Wesley D. Dupont |
| |
— |
|
|
|
— |
|
|
|
528 |
|
|
|
$ |
16,870 |
(1) |
|
|||
|
| | | | | | | | | | 2,106 | | | | $ | 66,276 | (2) | | |||
|
| | | | | | | | | | 2,208 | | | | $ | 68,934 | (3) | | |||
|
| | | | | | | | | | 927 | | | | $ | 29,497 | (4) | | |||
|
| | | | | | | | | | 927 | | | | $ | 28,765 | (5) | | |||
|
| | | | | | | | | | 963 | | | | $ | 29,892 | (6) | | |||
|
| | | | | | | | | | 642 | | | | $ | 19,921 | (7) | | |||
|
| | | | | | | | | | 4,087 | | | | $ | 219,513 | (8) | | |||
|
| | | | | | | | | | 6,129 | | | | $ | 327,902 | (9) | | |||
Frank N. D’Orazio |
| | — |
| | | — |
| | | 468 |
| | |
$ |
14,953 |
(1) |
|
|||
|
| | | | | | | | 1,872 | | | | $ | 58,912 | (2) | | |||||
|
| | | | | | | | 1,764 | | | | $ | 55,072 | (3) | | |||||
|
| | | | | | | | 741 | | | | $ | 23,579 | (4) | | |||||
|
| | | | | | | | 741 | | | | $ | 22,993 | (5) | | |||||
|
| | | | | | | | 866 | | | | $ | 26,881 | (6) | | |||||
|
| | | | | | | | 577 | | | | $ | 17,904 | (7) | | |||||
|
| | | | | | | | 3,270 | | | | $ | 175,632 | (8) | | |||||
|
| | | | | | | | 4,904 | | | | $ | 262,364 | (9) | | |||||
Louis P. Iglesias |
| |
— |
|
|
|
— |
|
|
|
3,309 |
|
|
|
$ |
103,307 |
(3) |
|
|||
|
| | | | | | | | | | 786 | | | | $ | 25,011 | (4) | | |||
|
| | | | | | | | | | 786 | | | | $ | 24,390 | (5) | | |||
|
| | | | | | | | | | 818 | | | | $ | 25,391 | (6) | | |||
|
| | | | | | | | | | 545 | | | | $ | 16,911 | (7) | | |||
|
| | | | | | | | | | 1,605 | | | | $ | 57,957 | (10) | | |||
|
| | | | | | | | | | 3,474 | | | | $ | 186,589 | (8) | | |||
|
| | | | | | | | | | 5,210 | | | | $ | 278,735 | (9) | | |||
- (1)
- RSUs that settled in common shares. Assumes a price of $31.95 per common share, the closing price on February 22, 2016, the RSU vesting date.
-40-
- (2)
- RSUs
that settled in cash. Assumes a price of $31.47 per common share, which is the daily volume-weighted average sales price of a common share for the five
consecutive trading days up to and including February 22, 2016, the vesting date.
- (3)
- RSUs
that settled in cash. Assumes a price of $31.22 per common share, which is the daily volume-weighted average sales price of a common share for the five
consecutive trading days up to and including February 19, 2016, the vesting date.
- (4)
- RSUs
that settled in common shares. Assumes a price of $31.82 per common share, the closing price on February 18, 2016, the RSU vesting date.
- (5)
- RSUs
that settled in cash. Assumes a price of $31.03 per common share, which is the daily volume-weighted average sales price of a common share for the five
consecutive trading days up to and including February 18, 2016, the vesting date.
- (6)
- RSUs
that settled in common shares. Assumes a price of $31.04 per common share, the closing price on February 17, 2016, the vesting date.
- (7)
- RSUs
that settled in cash. Assumes a price of $31.03 per common share, which is the daily volume-weighted average sales price of a common share for the five
consecutive trading days up to and including February 17, 2016, the vesting date.
- (8)
- Performance-based
awards that settled in common shares. Assumes a price of $53.71 per common share, the closing price on December 30, 2016, the last business
day of 2016, and relates to performance-based awards granted to certain NEOs in 2014. These awards vested at 46% of target.
- (9)
- Performance-based
awards that settled in cash. Assumes a price of $53.50 per common share, which is the daily volume-weighted average sales price of a common share
for the five consecutive trading days up to and including December 30, 2016, the last business day of 2016, and relates to performance-based awards granted to certain NEOs in 2014. These awards
vested at 46% of target.
- (10)
- RSUs that settled in common shares. Assumes a price of $36.11 per common share, the closing price on May 3, 2016, the vesting date.
| Non-Qualified Deferred Compensation |
The following table summarizes information regarding each NEO’s participation in the SERP in 2016.
| Name | | Executive Contributions in Last Fiscal Year ($)(1) |
| Registrant Contributions in Last Fiscal Year ($)(2) |
| Aggregate Earnings (Losses) in Last Fiscal Year ($)(3) |
| Aggregate Withdrawals/ Distributions ($) |
| Aggregate Balance at Last Fiscal Year-End ($) |
| ||||||||||||
|---|---|---|---|---|---|---|---|---|---|---|---|---|---|---|---|---|---|---|---|---|---|---|---|
Scott A. Carmilani |
| |
$ |
— |
|
|
|
$ |
33,499 |
|
|
|
$ |
72,175 |
|
|
$ — |
| |
$ |
840,182 |
| |
Thomas A. Bradley |
| |
$ |
— |
| | |
$ |
523,499 |
| | |
$ |
19,106 |
| | $ — |
| |
$ |
619,272 |
| |
Wesley D. Dupont |
| |
$ |
— |
|
|
|
$ |
523,499 |
|
|
|
$ |
66,522 |
|
|
$ — |
| |
$ |
756,677 |
| |
Frank N. D’Orazio |
| |
$ |
25,000 |
| | |
$ |
523,499 |
| | |
$ |
90,615 |
| | $ — |
| |
$ |
858,433 |
| |
Louis P. Iglesias |
| |
$ |
— |
|
|
|
$ |
525,997 |
|
|
|
$ |
13,768 |
|
|
$ — |
| |
$ |
642,922 |
| |
- (1)
- Reflects amount of base salary voluntarily deferred by the NEO under the SERP in 2016.
-41-
- (2)
- Reflects
amounts contributed by us on behalf of the NEO. All amounts that we contributed on behalf of the NEO under the SERP or cash payments to the NEO in lieu
thereof have also been reported in the Summary Compensation Table.
- (3)
- Represents capital gains (losses) and dividends on and earnings (losses) from the investments made in one or more investment alternatives selected by the NEO.
Investment Alternatives Under the SERP. Under the SERP, each NEO that is eligible to participate has the option to select a variety of investment alternatives. Each NEO is permitted to change, on a monthly basis, his investment choices in which individual and company contributions are to be invested. These investment alternatives are the same as those offered under our 401(k) plan.
Payouts and Withdrawals. Subject to earlier payout required pursuant to Section 457A of the Code described above, each NEO may elect to receive at retirement amounts deferred and contributions credited to his account in either a lump sum or in annual installments over a period of up to ten years. For more information regarding the SERP, please see “ — Compensation Discussion and Analysis — Retirement, Health and Welfare Benefits.”
-42-
| Potential Payments Upon a Termination or Change in Control |
The table below reflects the amount of compensation and benefits payable to each NEO in the event of (i) a termination by the NEO without good reason (a “voluntary termination”), (ii) a termination without cause or with good reason (“involuntary termination”), (iii) a termination (other than by the company for cause or by the NEO without good reason) within two years of a change in control, (iv) a termination due to death and (v) a termination due to disability. As required by the disclosure rules of the SEC, the amounts shown assume that the applicable triggering event occurred on December 30, 2016, the last business day of the year, and therefore are estimates of the amounts that would be paid to the applicable NEO upon the occurrence of such triggering event, assuming a price of $53.18 per share, the closing price as of December 30, 2016.
| Name | | Type of Payment | | Voluntary Termination(1) |
| Involuntary Termination(2) |
| Change in Control(3) |
| Death(4) | | Disability(5) | |||||
|---|---|---|---|---|---|---|---|---|---|---|---|---|---|---|---|---|---|
Scott A. Carmilani |
| Garden Leave Pay: |
|
$ |
3,384,000 |
|
$ |
3,384,000 |
|
$ |
3,384,000 |
|
$ |
1,192,000 |
|
$ |
1,192,000 |
|
| Continued Benefits: | | $ | 26,910 | | $ | 26,910 | | $ | 26,910 | | $ | 1,500,000 | | $ | 155,000 |
|
| Equity Vesting: | | $ | 12,894,314 | | $ | 12,894,314 | | $ | 13,975,011 | | $ | 8,040,091 | | $ | 8,040,091 |
| | | | | | | | | | | | | | |||||
|
| TOTAL: | | $ | 16,305,224 | | $ | 16,305,224 | | $ | 17,385,921 | | $ | 10,732,091 | | $ | 9,259,001 |
Thomas A. Bradley |
| Garden Leave Pay: |
| $ |
1,565,000 |
| $ |
1,565,000 |
| $ |
1,565,000 |
| $ |
532,500 |
| $ |
532,500 |
|
| Continued Benefits(6): | | $ | 27,013 | | $ | 540,092 | | $ | 561,331 | | $ | 1,534,318 | | $ | 689,318 |
|
| Equity Vesting: | | $ | 2,598,760 | | $ | 2,598,760 | | $ | 2,843,042 | | $ | 1,385,457 | | $ | 1,385,457 |
| | | | | | | | | | | | | | |||||
|
| TOTAL: | | $ | 4,190,773 | | $ | 4,703,852 | | $ | 4,969,373 | | $ | 3,452,275 | | $ | 2,607,275 |
Wesley D. Dupont |
| Garden Leave Pay: |
|
$ |
1,565,000 |
|
$ |
1,565,000 |
|
$ |
1,565,000 |
|
$ |
532,500 |
|
$ |
532,500 |
|
| Continued Benefits(6): | | $ | 25,864 | | $ | 590,292 | | $ | 590,292 | | $ | 1,564,428 | | $ | 719,428 |
|
| Equity Vesting: | | $ | 2,628,292 | | $ | 2,628,292 | | $ | 2,872,467 | | $ | 1,414,989 | | $ | 1,414,989 |
| | | | | | | | | | | | | | |||||
|
| TOTAL: | | $ | 4,219,156 | | $ | 4,783,584 | | $ | 5,027,759 | | $ | 3,511,917 | | $ | 2,666,917 |
Frank N. D’Orazio |
| Garden Leave Pay: |
| $ |
1,535,000 |
| $ |
1,535,000 |
| $ |
1,535,000 |
| $ |
517,500 |
| $ |
517,500 |
|
| Continued Benefits(6): | | $ | 25,837 | | $ | 589,664 | | $ | 589,664 | | $ | 1,563,827 | | $ | 822,115 |
|
| Equity Vesting: | | $ | 2,444,747 | | $ | 2,444,747 | | $ | 2,680,450 | | $ | 1,259,966 | | $ | 1,259,966 |
| | | | | | | | | | | | | | |||||
|
| TOTAL: | | $ | 4,005,584 | | $ | 4,569,411 | | $ | 4,805,114 | | $ | 3,341,293 | | $ | 2,599,581 |
Louis P. Iglesias |
| Garden Leave Pay: |
|
$ |
1,565,000 |
|
$ |
1,565,000 |
|
$ |
1,565,000 |
|
$ |
520,000 |
|
$ |
520,000 |
|
| Continued Benefits(6): | | $ | 26,585 | | $ | 528,332 | | $ | 528,332 | | $ | 1,501,747 | | $ | 656,747 |
|
| Equity Vesting: | | $ | 2,369,978 | | $ | 2,369,978 | | $ | 2,586,042 | | $ | 1,283,895 | | $ | 1,283,895 |
| | | | | | | | | | | | | | |||||
|
| TOTAL: | | $ | 3,961,563 | | $ | 4,463,310 | | $ | 4,679,374 | | $ | 3,305,642 | | $ | 2,460,642 |
- (1)
- Under the employment agreement with each NEO, in the case of a voluntary termination, such NEO is required to provide a one-year notice to the company. During the Notice Period, such NEO may be placed on Garden Leave and is entitled to: (i) base salary, (ii) accrued but unpaid obligations, (iii) any unpaid annual bonus with respect to any completed fiscal year determined using the actual annual bonus or the average annual bonus paid in the last two years if the actual annual bonus has not been finalized, (iv) a pro rata annual bonus determined using the average annual bonus paid in the last two years, (v) a full-year annual bonus using the average annual bonus paid in the last two years, (vi) continued participation in health and insurance plans, (vii) continued vesting of equity-based awards and (viii) vesting in the number of equity-based awards that would otherwise have vested during the two-year period immediately following the Notice Period. The amounts included in the “Voluntary Termination” column above under “Garden Leave Pay” represent the NEO’s base salary as of December 30, 2016 plus the sum of annual bonus paid in the last two years. The amounts included under “Continued Benefits” represent participation in the company’s health and insurance plans, based on current health and insurance premiums for the NEO projected over the applicable period. The dollar value included under “Equity Vesting” assumes that equity awards (i) that settle in common shares vested, were exercised and sold as of December 30, 2016 and
-43-
(ii) that settle in cash vested as of December 30, 2016 and were paid to the NEO based on the fair market value of $53.50 per common share, which is the daily volume-weighted average sales price of a common share for the five consecutive trading days up to and including December 30, 2016. Please see “— Employment Agreements” for more information on the employment agreements.
- (2)
- Under
the employment agreement with each NEO, in the case of a termination by the company without cause or by the NEO with good reason (other than within two years
following our change in control, as discussed in footnote (3) below), the company or the NEO is required to provide a one-year notice to the other, as applicable. During the Notice Period, such
NEO may be placed on Garden Leave and is entitled to the same benefits that such NEO is entitled to during a Garden Leave upon a voluntary termination, as discussed in footnote (1) above.
- (3)
- Under
the employment agreement with each NEO, upon any termination (other than by the company for cause or by an NEO without good reason) within two years following
our change in control, such NEO may be placed on Garden Leave and is entitled to the benefits that such NEO is entitled to during a Garden Leave upon a voluntary termination, as discussed in
clauses (i) to (vi) of the footnote (1) above, plus vesting of all equity awards held by the NEO. The dollar value reflected included in the “Qualifying Termination
Following Change in Control” column above under “Equity Vesting” assumes that equity awards (i) that settle in common shares vested, were exercised
and sold as of December 30, 2016; and (ii) that settle in cash vested as of December 30, 2016 and were paid to the NEO based on the fair market value of $53.50 per common share,
which is the daily volume-weighted average sales price of a common share for the five consecutive trading days up to and including December 30, 2016.
Under the 2012 Omnibus Plan, if an employee is terminated without cause by the company or by the employee with good reason within two years of a change of control, all outstanding RSU awards will automatically vest and become exercisable upon such termination and all outstanding performance-based awards will automatically vest and be paid out at the same percentage at which the company is expensing such award for financial reporting purposes immediately prior to such termination.
- (4)
- Under
the employment agreement with each NEO, in the case of a termination as a result of an NEO’s death, his estate or beneficiaries are entitled to
(i) accrued but unpaid obligations, (ii) any unpaid annual bonus with respect to any completed fiscal year determined using the actual annual bonus or the average annual bonus paid in
the last two years, (iii) a pro rata annual bonus determined using the average annual bonus paid in the last two years and (vi) vesting in the number of equity awards that would
otherwise have vested during the one-year period immediately following such termination.
The dollar value included in the “Death” column above under “Equity Vesting” assumes that equity awards (i) that settle in common shares vested, were exercised and sold as of December 30, 2016; and (ii) that settle in cash vested as of December 30, 2016 and were paid to the NEO based on the fair market value of $53.50 per common share, which is the daily volume-weighted average sales price of a common share for the five consecutive trading days up to and including December 30, 2016.
In addition, each employee has life insurance paid by the company or our subsidiaries for the employee’s benefit (or the benefit of his estate or beneficiaries). Assuming the death of each NEO as of December 30, 2016, the estate or beneficiaries of such NEO would be entitled to the amounts included in the “Death” column above for “Continued Benefits” for our NEOs.
- (5)
- Under the employment agreement with each NEO, in the case of a termination as a result of an NEO’s disability, such NEO is entitled to the same benefits described in footnote (4) above. In addition, the company pays on behalf of our employees, including the NEOs, short-term and
-44-
long-term
disability insurance. Under this insurance, if the NEO (other than Mr. D’Orazio) is considered disabled, he will be entitled to $2,500 per week for the first
26 weeks after a disability and thereafter he will be entitled to $15,000 per month until the age of 65. Mr. D’Orazio would be entitled to his full monthly salary for the
first 90 days after a disability and thereafter would be entitled to receive 75% of his monthly salary up to a maximum of $15,000 per month until the age of 65. For our NEOs and other senior
officers resident in the United States, the company has purchased a supplemental long-term disability plan that applies to certain absences extended beyond 180 days. In the event of an extended
disability, the supplemental policy pays up to 60% of the NEO’s monthly salary up to a maximum of $10,000 per month.
The dollar value included in the “Disability” column above under “Equity Vesting” assumes all equity awards (i) that settle in common shares vested at the applicable levels described above, were exercised and sold as of December 30, 2016; and (ii) that settle in cash vested at the applicable levels described above as of December 30, 2016 and were paid to the NEO based on the fair market value of $53.50 per common share, which is the daily volume-weighted average sales price of a common share for the five consecutive trading days up to and including December 30, 2016.
- (6)
- The amounts under “Continued Benefits” include the Contribution amount (including earnings thereon) that would vest and be paid to the NEOs in connection with a termination of employment other than by us with cause or by the NEO without good reason as of December 30, 2016. In addition to the Contribution amounts included in the “Continued Benefits” row, the NEO (or his estate or beneficiaries) would be entitled to the distribution of the vested ordinary contributions we made to the SERP on his behalf, as well as to receive his own ordinary contributions to the SERP, upon an NEO’s retirement at or after age 65, termination of employment (other than with cause), change in control or death or disability of the NEO. All of our NEOs are fully vested in their ordinary SERP account balances, except for Mr. Bradley, for whom the dollar value under “Continued Benefits” in the “Qualifying Termination Following Change in Control,” “Death” and “Disability” columns includes the value of his ordinary SERP account balance (including earnings thereon) for which vesting would be accelerated in connection with a change in control or termination due to death or disability as of December 30, 2016.
Under the employment agreements, if the applicable NEO is terminated for cause, he is entitled only to the prior accrued obligations. Under the employment agreements, the NEO is subject to certain restrictive covenants, including non-compete, non-interference, confidentiality and assignment of inventions provisions. In the case where the NEO is terminated by the company without cause or by the NEO for any reason, should the NEO breach these restrictive covenants, the payments and benefits described above would cease immediately.
Under the RSU Award Agreement to the 2012 Omnibus Plan, each employee agrees that the company may terminate the NEO’s right to any RSU he holds (whether or not vested) upon the occurrence of: (i) any event that constitutes cause, (ii) the NEO’s violating the non-solicitation provision set forth in the RSU Award Agreement or (iii) the NEOs’ interfering with a relationship between the company and one of its clients.
Under the Stock Option Plan, a participant retiring after attaining the age of 65 is entitled to accelerated vesting of all stock options held by him. Under the Stock Incentive Plan, upon a participant attaining the age of 65, the service-based vesting component is waived, and a portion of the RSUs awarded will be settled on an accelerated basis to cover any tax obligations of the participant pursuant to Section 457A of the Code. The remaining portion of the RSUs awarded will vest according to the schedule established on the date of grant. Under the employment agreements, there are no additional compensation provisions for retirement. None of our NEOs was 65 as of December 31, 2016.
-45-
Accordingly, if any of our NEOs had retired as of such date, he would not have been entitled to the acceleration or continued vesting of equity awards or any additional compensation.
Compensation Committee Interlocks and Insider Participation
None of our directors or executive officers has a relationship with us or any other company that the SEC defines as a compensation committee interlock or insider participation that should be disclosed to shareholders. Our Compensation Committee is comprised solely of independent directors.
Compensation Committee Report on Executive Compensation
The following report of the Compensation Committee does not constitute soliciting material and should not be deemed filed or incorporated by reference into any other company filing under the Securities Act of 1933, as amended (the “Securities Act”), or the Exchange Act, except to the extent the company specifically incorporates this report by reference therein.
We have reviewed and discussed with management the Compensation Discussion and Analysis required by Item 402(b) of Regulation S-K. Based on such review and discussion, we recommended to the Board that the Compensation Discussion and Analysis be included in the Form 10-K.
| | Samuel J. Weinhoff (Chair) Barbara T. Alexander Bart Friedman Fiona E. Luck Patrick de Saint-Aignan Eric S. Schwartz |
-46-
Item 12. Security Ownership of Certain Beneficial Owners and Management and Related Stockholder Matters.
Equity Compensation Plan Information
The following table presents information concerning our equity compensation plans as of December 31, 2016.
| Plan Category | | Number of Securities to be Issued Upon Exercise of Outstanding Options, Warrants and Rights(1) |
| Weighted-Average Exercise Price of Outstanding Options, Warrants and Rights(2) |
| Number of Securities Remaining Available for Future Issuance Under Equity Compensation Plans (Excluding Securities Reflected in the First Column) |
| |||||||||
|---|---|---|---|---|---|---|---|---|---|---|---|---|---|---|---|---|
Equity compensation plans approved by Shareholders |
|
|
3,243,113 |
|
|
|
$ |
17.37 |
|
|
|
4,600,746 |
(3) |
|
||
Equity compensation plans not approved by Shareholders |
|
|
— |
|
|
|
— |
|
|
|
— |
|
|
|||
| | | | | | | | | | | | | | | |||
Total |
|
|
3,243,113 |
|
|
|
$ |
17.37 |
|
|
|
4,600,746 |
(3) |
|
||
- (1)
- Represents
1,525,743 stock options granted under the company’s Third Amended and Restated 2001 Employee Stock Option Plan (the “Stock
Option Plan”), which have a weighted average remaining contractual life of 3.3 years, and 1,133,929 RSUs and 583,441 performance-based awards granted under the 2012 Omnibus Plan
and the Third Amended and Restated 2004 Stock Incentive Plan (the “Stock Incentive Plan”).
- (2)
- The
weighted average exercise price reported in the column does not take into account RSUs or performance-based awards.
- (3)
- Includes 2,194,545 common shares available for issuance under the 2012 Omnibus Plan and 2,406,201 common shares available for purchase under the ESPP.
Principal Shareholders
The table below sets forth information as of April 19, 2017 regarding the beneficial ownership of our common shares by:
| | · |
| each person known by us to beneficially own more than 5% of our outstanding common shares, |
| | · |
| each of our directors, |
| | · |
| our NEOs, and |
| | · |
| all of our directors and executive officers as a group. |
-47-
Name and Address of Beneficial Owner |
| Beneficial Owner of Common Shares(1) |
|||||
| | | | | | |||
| |
| Number of Common Shares |
| Percentage of Common Shares |
|||
|---|---|---|---|---|---|---|---|
| | | | | | |||
Champlain Investment Partners, LLC(2) |
| | 4,713,355 |
| | 5.4% |
|
FMR LLC(3) |
|
|
6,216,016 |
|
|
7.1% |
|
The Vanguard Group, Inc.(4) |
| | 6,543,683 |
| | 7.5% |
|
Barbara T. Alexander |
| |
25,547 |
(5) |
|
* |
|
Scott A. Carmilani |
| | 1,544,559 |
(6) |
|
1.8% |
|
Bart Friedman |
| |
43,727 |
|
|
* |
|
Patricia L. Guinn |
| | 2,303 |
| | * |
|
Fiona E. Luck |
| |
2,143 |
|
|
* |
|
Patrick de Saint-Aignan |
| | 28,742 |
| | * |
|
Eric S. Schwartz |
| |
111,192 |
(7) |
|
* |
|
Samuel J. Weinhoff |
| | 41,621 |
| | * |
|
Thomas A. Bradley |
| |
18,485 |
|
|
* |
|
Wesley D. Dupont |
| | 234,324 |
(8) |
|
* |
|
Frank N. D’Orazio |
| |
228,353 |
(9) |
|
* |
|
Louis P. Iglesias |
| | 11,112 |
| | * |
|
All directors and executive officers as a group (17 persons) |
| |
2,782,525 |
(10) |
|
3.2% |
|
- *
- Less
than 1%.
- (1)
- Pursuant
to the regulations promulgated by the SEC, our common shares are deemed to be “beneficially owned” by a person if such person
directly or indirectly has or shares the power to vote or dispose of our common shares, whether or not such person has any pecuniary interest in our common shares, or the right to acquire the power to
vote or dispose of our common shares within 60 days of April 19, 2017, including any right to acquire through the exercise of any option, warrant or right. As of April 19, 2017,
we had 87,484,665 common shares issued and outstanding. All amounts listed represent sole voting and dispositive power unless otherwise indicated.
- (2)
- Based
on information reported on Schedule 13G, as filed by Champlain Investment Partners, LLC (“Champlain”) with the SEC
on February 14, 2017, Champlain has the following powers with respect to the common shares: (a) sole voting power: 3,737,465; (b) shared voting power: 0; (c) sole
dispositive power: 4,713,355; and (d) shared dispositive power: 0.
- (3)
- Based
on information reported on Schedule 13G/A, as filed by FMR LLC (“FMR”) and Abigail P. Johnson with the SEC on
February 14, 2017, FMR and Ms. Johnson are the beneficial owners of 6,216,016 of our common shares. According to this Schedule 13G/A, FMR has sole voting power over 46,522 common
shares and sole dispositive power over 6,216,016 of our common shares and has no shared voting power and no shared dispositive power over any of these shares.
- (4)
- Based on information reported on Schedule 13G/A, as filed by The Vanguard Group, Inc. (“Vanguard”) with the SEC on February 9, 2017, Vanguard has the following powers with respect to
-48-
the common shares: (a) sole voting power: 51,915; (b) shared voting power: 10,106; (c) sole dispositive power: 6,486,133; and (d) shared dispositive power: 57,550.
- (5)
- Includes
17,358 common shares held by Ms. Alexander as a co-trustee for the Stiles Family Trust dated November 20, 2007.
- (6)
- Includes
stock options exercisable to purchase 134,415 common shares and 139,000 common shares held by an irrevocable trust for the benefit of
Mr. Carmilani’s spouse and children.
- (7)
- Includes
105,000 common shares held by 76 West Holdings LLC, in which Mr. Schwartz has 100% ownership.
- (8)
- Includes
stock options exercisable to purchase 19,530 common shares and 9,260 common shares held by the Dupont Family Charitable Trust.
- (9)
- Includes
stock options exercisable to purchase 16,065 common shares.
- (10)
- Includes stock options exercisable to purchase 229,845 common shares.
Item 13. Certain Relationships and Related Transactions, and Director Independence.
The company has no related-party transactions to report. See “Director Independence” under Item 10 of this Form 10-K.
Review, Approval or Ratification of Transactions with Related Persons
Pursuant to our Audit Committee charter, the Audit Committee reviews and approves the related-party transactions we enter into. We do not have formal written standards in connection with the review and approval of related-party transactions as we believe each transaction should be analyzed on its own merits. In making its decision, the Audit Committee will review, among other things, the relevant agreement, analyze the specific facts and circumstances and speak with, or receive a memorandum from, management that outlines the background and terms of the transaction. As insurance and reinsurance companies enter into various transactions in the ordinary course of business, the Audit Committee does not review these types of transactions to the extent they are open-market transactions that happen to involve related parties.
-49-
Item 14. Principal Accountant Fees and Services.
The following table shows information about fees billed to us by Deloitte & Touche LLP and Deloitte AG and their affiliates for services rendered for the fiscal years ended December 31, 2016 and 2015.
| |
| 2016
|
| 2015
|
| ||
|---|---|---|---|---|---|---|---|
| Audit Fees | | $ | 4,940,640 | | $ | 5,249,102 | |
| Audit-Related Fees(1) | | $ | 421,675 | | $ | 405,000 | |
| Tax Fees | | $ | — | | $ | — | |
| All Other Fees | | $ | — | | $ | — | |
- (1)
- Audit-Related Fees are fees for assurance and related services that are reasonably related to the performance of the audit or review of our financial statements and are not reported under the Audit Fees category.
The Audit Committee has a policy to pre-approve all audit and non-audit services to be provided by the independent auditors and the estimates therefor. The Audit Committee pre-approved all audit services and non-audit services and the estimates therefor provided to the company by the independent auditors in 2016 and 2015.
-50-
The exhibits listed in the accompanying exhibit index starting on page E-1 are filed as part of this Form 10-K.
Pursuant to the requirements of Section 13 or 15(d) of the Securities Exchange Act of 1934, the registrant has duly caused this report to be signed on its behalf by the undersigned, thereunto duly authorized, on April 27, 2017.
|
ALLIED WORLD ASSURANCE COMPANY HOLDINGS, AG |
|||
|
By: |
|
/s/ SCOTT A. CARMILANI |
|
| | Name: | | Scott A. Carmilani | |
| | Title: | | President and Chief Executive Officer | |
-51-
| Exhibit Number |
| Description
|
|||
|---|---|---|---|---|---|
| | 2.1 | (1) | | Sale of Business Agreement, dated as of August 22, 2014, by and between Royal & Sun Alliance Insurance plc and Allied World Assurance Company, Ltd related to Hong Kong operations | |
| | | | |||
| | 2.2 | (2) | | Sale of Business Agreement, dated as of August 22, 2014, by and between Royal & Sun Alliance Insurance plc and Allied World Assurance Company, Ltd related to Singapore operations | |
| | | | |||
| | 2.3 | (3) | | Deed of Amendment, dated as of March 31, 2015, by and between Royal & Sun Alliance Insurance plc and Allied World Assurance Company, Ltd related to Hong Kong operations | |
| | | | |||
| | 2.4 | (4) | | Deed of Amendment, dated as of March 31, 2015, by and between Royal & Sun Alliance Insurance plc and Allied World Assurance Company, Ltd related to Singapore operations | |
| | | | |||
| | 2.5 | (5) | | Agreement and Plan of Merger, dated as of December 18, 2016, by and between Allied World Assurance Company Holdings, AG and Fairfax Financial Holdings Limited | |
| | | | |||
| | 3.1 | (6) | | Articles of Association of Allied World Assurance Company Holdings, AG, as amended and restated | |
| | | | |||
| | 3.2 | (7) | | Organizational Regulations of Allied World Assurance Company Holdings, AG, as amended and restated | |
| | | | |||
| | 4.1 | (8) | | Specimen Common Share Certificate | |
| | | | |||
| | 4.2 | (9) | | Indenture, dated as of July 26, 2006, by and between Allied World Assurance Company Holdings, Ltd, as issuer, and The Bank of New York, as trustee, with regard to Allied World Assurance Company Holdings, Ltd’s outstanding 7.50% Senior Notes due 2016 | |
| | | | |||
| | 4.3 | (9) | | First Supplemental Indenture, dated as of July 26, 2006, by and between Allied World Assurance Company, Ltd, as issuer, and The Bank of New York, as trustee, with regard to Allied World Assurance Company Holdings, Ltd’s outstanding 7.50% Senior Notes due 2016 | |
| | | | |||
| | 4.4 | (10) | | Second Supplemental Indenture, dated as of December 30, 2010, by and among Allied World Assurance Company Holdings, AG, Allied World Assurance Company Holdings, Ltd and The Bank of New York Mellon, as trustee, with regard to Allied World Assurance Company Holdings, Ltd’s outstanding 7.50% Senior Notes due 2016 | |
| | | | |||
| | 4.5 | (9) | | Form of 7.50% Senior Note (Included as part of Exhibit 4.3) | |
| | | | |||
| | 4.6 | (11) | | Senior Indenture, dated as of November 15, 2010, by and between Allied World Assurance Company Holdings, Ltd, as issuer, and The Bank of New York Mellon, as trustee, with regard to Allied World Assurance Company Holdings, Ltd’s outstanding 5.50% Senior Notes due 2020 | |
| | | | |||
| | 4.7 | (11) | | First Supplemental Indenture, dated as of November 15, 2010, by and between Allied World Assurance Company Holdings, Ltd, as issuer, and The Bank of New York Mellon, as trustee, with regard to Allied World Assurance Company Holdings, Ltd’s outstanding 5.50% Senior Notes due 2020 | |
| | | | |||
E-1
| Exhibit Number |
| Description
|
|||
|---|---|---|---|---|---|
| | 4.8 | (10) | | Second Supplemental Indenture, dated as of December 30, 2010, by and among Allied World Assurance Company Holdings, AG, Allied World Assurance Company Holdings, Ltd and The Bank of New York Mellon, as Trustee, with regard to Allied World Assurance Company Holdings, Ltd’s outstanding 5.50% Senior Notes due 2020 | |
| | | | |||
| | 4.9 | (11) | | Form of 5.50% Senior Note (Included as part of Exhibit 4.7) | |
| | | | |||
| | 4.10 | (12) | | Senior Indenture, dated as of October 29, 2015, by and among Allied World Assurance Company Holdings, AG, as guarantor, Allied World Assurance Company Holdings, Ltd, as issuer, and The Bank of New York Mellon, as trustee, with regard to Allied World Assurance Company Holdings, Ltd’s outstanding 4.35% Senior Notes due 2025 | |
| | | | |||
| | 4.11 | (12) | | First Supplemental Indenture, dated as of October 29, 2015, by and among Allied World Assurance Company Holdings, AG, as guarantor, Allied World Assurance Company Holdings, Ltd, as issuer, and The Bank of New York Mellon, as trustee, with regard to Allied World Assurance Company Holdings, Ltd’s outstanding 4.35% Senior Notes due 2025 | |
| | | | |||
| | 4.12 | (12) | | Senior Debt Securities Guarantee Agreement, dated as of October 29, 2015, by and between Allied World Assurance Company Holdings, AG, as guarantor, and The Bank of New York Mellon, as guarantee trustee, with regard to Allied World Assurance Company Holdings, Ltd’s outstanding 4.35% Senior Notes due 2025 | |
| | | | |||
| | 4.13 | (12) | | Form of 4.35% Senior Note (Included as part of Exhibit 4.11) | |
| | | | |||
| | 10.1 | (13) | | Insurance Letters of Credit — Master Agreement, dated February 28, 2007, by and among Allied World Assurance Company, Ltd, Citibank N.A. and Citibank Europe plc | |
| | | | |||
| | 10.2 | (13) | | Pledge Agreement, dated as of February 28, 2007, by and between Allied World Assurance Company, Ltd and Citibank Europe plc | |
| | | | |||
| | 10.3 | (13) | | Account Control Agreement, dated March 5, 2007, by and among Citibank Europe plc, as secured party, Allied World Assurance Company, Ltd, as pledgor, and Mellon Bank, N.A. | |
| | | | |||
| | 10.4 | (14) | | Letter Agreement, dated December 30, 2008, by and among Allied World Assurance Company, Ltd, Citibank Europe plc and The Bank of New York Mellon, with respect to the types of securities that may be pledged under the letter of credit facility with Citibank Europe plc | |
| | | | |||
| | 10.5 | (15) | | Letter and Summary of Terms, dated December 7, 2012, from Citibank Europe plc to Allied World Assurance Company, Ltd, with respect to the letter of credit facility with Citibank Europe plc | |
| | | | |||
| | 10.6 | (16) | | Amended and Restated Credit Agreement, dated as of June 7, 2012, by and among Allied World Assurance Company Holdings, AG, Allied World Assurance Company Holdings, Ltd, Allied World Assurance Company, Ltd, the lenders a party thereto, Citibank, N.A., as syndication agent, and Wells Fargo Bank, National Association, as administrative agent, fronting bank and letter of credit agent | |
| | | | |||
| | 10.7 | (16) | | Amended and Restated Pledge and Security Agreement, dated as of June 7, 2012, by and between Allied World Assurance Company, Ltd, as pledgor, and Wells Fargo Bank, National Association, as administrative agent | |
| | | | |||
E-2
| Exhibit Number |
| Description
|
|||
|---|---|---|---|---|---|
| | 10.8 | (16) | | Pledge and Security Agreement, dated as of June 7, 2012, by and between Allied World Assurance Company Holdings, Ltd, as pledgor, and Wells Fargo Bank, National Association, as administrative agent | |
| | | | |||
| | 10.9 | (16) | | Amended and Restated Account Control Agreement, dated as of June 7, 2012, by and among Allied World Assurance Company, Ltd, as pledgor, The Bank of New York Mellon, as custodian, and Wells Fargo Bank, National Association, as administrative agent | |
| | | | |||
| | 10.10 | (16) | | Account Control Agreement, dated as of June 7, 2012, by and among Allied World Assurance Company Holdings, Ltd, as pledgor, The Bank of New York Mellon, as custodian, and Wells Fargo Bank, National Association, as administrative agent | |
| | | | |||
| | 10.11 | (17) | | Credit Agreement, dated as of June 13, 2016, by and among Allied World Assurance Company Holdings, AG; Allied World Assurance Company Holdings, Ltd; Allied World Assurance Company, Ltd; the lenders party thereto; Wells Fargo Bank, National Association, as administrative agent and swingline lender; and Citibank, N.A., as syndication agent | |
| | | | |||
| | 10.12 | (18) | | Repurchase Agreement, dated as of May 6, 2015, by and between Allied World Assurance Company Holdings, AG and Exor S.A. | |
| | | | |||
| | 10.13 | (19) | | Benefit Plan Assumption and General Amendment Agreement, dated as of December 1, 2010, by and among Allied World Assurance Company Holdings, Ltd, Allied World Assurance Company, Ltd, Newmarket Administrative Services, Inc. (n/k/a AWAC Services Company) and Allied World Assurance Company Holdings, AG | |
| | | | |||
| | 10.14 | (19) | | Form of Indemnification Agreement for directors and executive officers of Allied World Assurance Company Holdings, AG | |
| | | | |||
| | 10.15 | (20)† | | Employment/Consulting Agreement, dated as of January 16, 2014, by and between Allied World National Assurance Company and W. Gordon Knight | |
| | | | |||
| | 10.16 | (21)† | | Form of Amended Employment Agreement, dated as of January 1, 2016, for certain officers of Allied World Assurance Company Holdings, AG | |
| | | | |||
| | 10.17 | (22)† | | Allied World Assurance Company Holdings, AG Third Amended and Restated 2001 Employee Stock Option Plan | |
| | | | |||
| | 10.18 | (23)† | | Form of Option Grant Notice and Option Agreement under Allied World Assurance Company Holdings, AG Third Amended and Restated 2001 Employee Stock Option Plan | |
| | | | |||
| | 10.19 | (24)† | | Form of Option Grant Notice and Option Agreement under Allied World Assurance Company Holdings, AG Third Amended and Restated 2001 Employee Stock Option Plan, as amended in August 2011 | |
| | | | |||
| | 10.20 | (25)† | | Form of Performance-Based Equity Award Agreement | |
| | | | |||
| | 10.21 | (26)† | | Allied World Assurance Company Holdings, AG 2012 Omnibus Incentive Compensation Plan | |
| | | | |||
| | 10.22 | (26)† | | Form of RSU Award Agreement under the Allied World Assurance Company Holdings, AG 2012 Omnibus Incentive Compensation Plan | |
| | | | |||
| | 10.23 | (26)† | | Form of Performance-Based Compensation Award Agreement under the Allied World Assurance Company Holdings, AG 2012 Omnibus Incentive Compensation Plan | |
| | | | |||
E-3
| Exhibit Number |
| Description
|
|||
|---|---|---|---|---|---|
| | 10.24 | (27)† | | Form of RSU Award Agreement for non-employee directors under the Allied World Assurance Company Holdings, AG 2012 Omnibus Incentive Compensation Plan | |
| | | | |||
| | 10.25 | (28)† | | Allied World Assurance Company Holdings, AG Amended and Restated 2008 Employee Share Purchase Plan | |
| | | | |||
| | 10.26 | (29)† | | Allied World Assurance Company (U.S.) Inc. Second Amended and Restated Supplemental Executive Retirement Plan | |
| | | | |||
| | 10.27 | (30)† | | Amendment to the Allied World Assurance Company (U.S.) Inc. Second Amended and Restated Supplemental Executive Retirement Plan, effective as of January 1, 2016 | |
| | | | |||
| | 10.28 | (31)† | | Parent Shareholder Voting Agreement, dated as of December 18, 2016, by and among Allied World Assurance Company Holdings, AG, V. Prem Watsa and The Sixty Two Investment Company Limited | |
| | | | |||
| | 21.1 | (32) | | Subsidiaries of the Registrant | |
| | | | |||
| | 23.1 | (32) | | Consent of Deloitte & Touche LLP, an independent registered public accounting firm | |
| | | | |||
| | 31.1 | | | Certification by Chief Executive Officer, as required by Section 302 of the Sarbanes-Oxley Act of 2002 | |
| | | | |||
| | 31.2 | | | Certification by Chief Financial Officer, as required by Section 302 of the Sarbanes-Oxley Act of 2002 | |
| | | | |||
| | 32.1 | * | | Certification by Chief Executive Officer, as required by Section 906 of the Sarbanes-Oxley Act of 2002 | |
| | | | |||
| | 32.2 | * | | Certification by Chief Financial Officer, as required by Section 906 of the Sarbanes-Oxley Act of 2002 | |
| | | | |||
| | 101.1 | (32) | | Interactive data files pursuant to Rule 405 of Regulation S-T: (i) the Consolidated Balance Sheets as of December 31, 2016 and 2015, (ii) the Consolidated Statements of Operations and Comprehensive Income for the years ended December 31, 2016, 2015 and 2014, (iii) the Consolidated Statements of Shareholders’ Equity for the years ended December 31, 2016, 2015 and 2014, (iv) the Consolidated Statements of Cash Flows for the years ended December 31, 2016, 2015 and 2014, (v) the Notes to the Consolidated Financial Statements and (vi) Schedules III and IV | |
- (1)
- Incorporated
herein by reference to Exhibit 2.1 to the Current Report on Form 8-K of Allied World Assurance Company Holdings, AG filed with the SEC on
August 25, 2014.
- (2)
- Incorporated
herein by reference to Exhibit 2.2 to the Current Report on Form 8-K of Allied World Assurance Company Holdings, AG filed with the SEC on
August 25, 2014.
- (3)
- Incorporated
herein by reference to Exhibit 2.1 to the Current Report on Form 8-K of Allied World Assurance Company Holdings, AG filed with the SEC on
March 31, 2015.
- (4)
- Incorporated
herein by reference to Exhibit 2.2 to the Current Report on Form 8-K of Allied World Assurance Company Holdings, AG filed with the SEC on
March 31, 2015.
- (5)
- Incorporated
herein by reference to Exhibit 2.1 to the Current Report on Form 8-K of Allied World Assurance Company Holdings, AG filed with the SEC on
December 20, 2016.
- (6)
- Incorporated herein by reference to Exhibit 3.1 to the Current Report on Form 8-K of Allied World Assurance Company Holdings, AG filed with the SEC on August 2, 2016.
E-4
- (7)
- Incorporated
herein by reference to Exhibit 3.1 to the Current Report on Form 8-K of Allied World Assurance Company Holdings, AG filed with the SEC on
February 20, 2015.
- (8)
- Incorporated
herein by reference to the Annual Report on Form 10-K of Allied World Assurance Company Holdings, AG filed with the SEC on March 1, 2011.
- (9)
- Incorporated
herein by reference to the Current Report on Form 8-K of Allied World Assurance Company Holdings, AG filed with the SEC on August 1, 2006.
- (10)
- Incorporated
herein by reference to the Current Report on Form 8-K of Allied World Assurance Company Holdings, AG filed with the SEC on January 5,
2011.
- (11)
- Incorporated
herein by reference to the Current Report on Form 8-K of Allied World Assurance Company Holdings, AG filed with the SEC on November 15,
2010.
- (12)
- Incorporated
herein by reference to the Current Report on Form 8-K of Allied World Assurance Company Holdings, AG filed with the SEC on October 30,
2015.
- (13)
- Incorporated
herein by reference to the Current Report on Form 8-K of Allied World Assurance Company Holdings, AG filed with the SEC on March 6, 2007.
- (14)
- Incorporated
herein by reference to Exhibit 10.1 to the Current Report on Form 8-K of Allied World Assurance Company Holdings, AG filed with the SEC
on January 5, 2009.
- (15)
- Incorporated
herein by reference to Exhibit 10.5 to the Annual Report on Form 10-K of Allied World Assurance Company Holdings, AG filed with the SEC
on February 26, 2013.
- (16)
- Incorporated
herein by reference to the Current Report on Form 8-K of Allied World Assurance Company Holdings, AG filed with the SEC on June 13, 2012.
- (17)
- Incorporated
herein by reference to Exhibit 10.1 to the Current Report on Form 8-K of Allied World Assurance Company Holdings, AG filed with the SEC
on June 16, 2016.
- (18)
- Incorporated
herein by reference to Exhibit 10.1 to the Current Report on Form 8-K of Allied World Assurance Company Holdings, AG filed with the SEC
on May 11, 2015.
- (19)
- Incorporated
herein by reference to the Current Report on Form 8-K of Allied World Assurance Company Holdings, AG filed with the SEC on December 1,
2010.
- (20)
- Incorporated
herein by reference to Exhibit 10.1 to the Current Report on Form 8-K of Allied World Assurance Company Holdings, AG filed with the SEC
on January 16, 2014.
- (21)
- Incorporated
herein by reference to Exhibit 10.1 to the Current Report on Form 8-K of Allied World Assurance Company Holdings, AG filed with the SEC
on January 7, 2016.
- (22)
- Incorporated
herein by reference to the Post-Effective Amendment No. 1 to the Registration Statement on Form S-8 (Registration No. 333-136420)
of Allied World Assurance Company Holdings, AG filed with the SEC on December 1, 2010.
- (23)
- Incorporated
herein by reference to Exhibit 10.4 to the Quarterly Report on Form 10-Q of Allied World Assurance Company Holdings, AG filed with the
SEC on May 9, 2008.
- (24)
- Incorporated
herein by reference to the Quarterly Report on Form 10-Q of Allied World Assurance Company Holdings, AG filed with the SEC on August 9,
2011.
- (25)
- Incorporated
by reference to Exhibit 10.1 to the Current Report on Form 8-K of Allied World Assurance Company Holdings, AG filed with the SEC on
September 18, 2009.
- (26)
- Incorporated herein by reference to the Quarterly Report on Form 10-Q of Allied World Assurance Company Holdings, AG filed with the SEC on May 9, 2012.
E-5
- (27)
- Incorporated
herein by reference to Exhibit 10.1 to the Quarterly Report on Form 10-Q of Allied World Assurance Company Holdings, AG, filed with the
SEC on May 3, 2013.
- (28)
- Incorporated
herein by reference to Exhibit 4.2 to the Post-Effective Amendment No. 1 to the Registration Statement on Form S-8 (Registration
No. 333-151298) of Allied World Assurance Company Holdings, AG filed with the SEC on December 1, 2010.
- (29)
- Incorporated
herein by reference to Exhibit 10.30 to the Annual Report on Form 10-K of Allied World Assurance Company Holdings, AG filed on
March 1, 2010.
- (30)
- Incorporated
herein by reference to Exhibit 10.1 to the Current Report on Form 8-K of Allied World Assurance Company Holdings, AG filed with the SEC
on April 25, 2016.
- (31)
- Incorporated
herein by reference to Exhibit 10.1 to the Current Report on Form 8-K of Allied World Assurance Company Holdings, AG filed with the SEC
on December 20, 2016.
- (32)
- Filed
with the Original Form 10-K.
- †
- Management
contract or compensatory plan, contract or arrangement.
- *
- These certifications are being furnished solely pursuant to Section 906 of the Sarbanes-Oxley Act of 2002 (subsections (a) and (b) of Section 1350, chapter 63 of title 18 United States Code) and are not being filed as part of this report.
E-6