Attached files
| file | filename |
|---|---|
| EX-23.1 - EX-23.1 - NCS Multistage Holdings, Inc. | d296949dex231.htm |
Table of Contents
As filed with the Securities and Exchange Commission on April 26, 2017
Registration No. 333-216580
UNITED STATES
SECURITIES AND EXCHANGE COMMISSION
Washington, D.C. 20549
Amendment No. 2
To
FORM S-1
REGISTRATION STATEMENT
UNDER
THE SECURITIES ACT OF 1933
NCS Multistage Holdings, Inc.
(Exact name of registrant as specified in its charter)
| Delaware | 1389 | 46-1527455 | ||
| (State or Other Jurisdiction of Incorporation or Organization) |
(Primary Standard Industrial Classification Code Number) |
(I.R.S. Employer Identification Number) |
NCS Multistage Holdings, Inc.
19450 State Highway 249, Suite 200
Houston, TX 77070
(281) 453-2222
(Address, Including Zip Code, and Telephone Number, Including Area Code, of Registrant’s Principal Executive Offices)
P. Kevin Trautner
Executive Vice President, General Counsel and Secretary
19450 State Highway 249, Suite 200
Houston, TX 77070
(281) 453-2222
(Name, Address, Including Zip Code, and Telephone Number, Including Area Code, of Agent For Service)
Copies to:
| Alexander D. Lynch, Esq. Weil, Gotshal & Manges LLP 767 Fifth Avenue New York, New York 10153 (212) 310-8000 (Phone) (212) 310-8007 (Fax) |
J. David Kirkland Jr., Esq. James B. Marshall, Esq. Baker Botts L.L.P. 910 Louisiana Street Houston, Texas 77002 (713) 229-1234 (Phone) (713) 229-1522 (Fax) |
Approximate date of commencement of proposed sale to the public: As soon as practicable after the effective date of this Registration Statement.
If any of the securities being registered on this Form are to be offered on a delayed or continuous basis pursuant to Rule 415 under the Securities Act of 1933, check the following box. ☐
If this Form is filed to register additional securities for an offering pursuant to Rule 462(b) under the Securities Act, please check the following box and list the Securities Act registration statement number of the earlier effective registration statement for the same offering. ☐
If this Form is a post-effective amendment filed pursuant to Rule 462(c) under the Securities Act, check the following box and list the Securities Act registration statement number of the earlier effective registration statement for the same offering. ☐
If this Form is a post-effective amendment filed pursuant to Rule 462(d) under the Securities Act, check the following box and list the Securities Act registration statement number of the earlier effective registration statement for the same offering. ☐
Indicate by check mark whether the registrant is a large accelerated filer, an accelerated filer, a non-accelerated filer, smaller reporting company or an emerging growth company. See the definitions of “large accelerated filer,” “accelerated filer,” “smaller reporting company” and “emerging growth company” in Rule 12b-2 of the Exchange Act.
Large accelerated filer ☐ Accelerated filer ☐ Non-accelerated filer ☒ Smaller reporting company ☐ Emerging growth company ☒
If an emerging growth company, indicate by check mark if the registrant has elected not to use the extended transition period for complying with any new or revised financial accounting standards provided pursuant to Section 7(a)(2)(B) of the Securities Act. ☐
The Registrant hereby amends this Registration Statement on such date or dates as may be necessary to delay its effective date until the Registrant shall file a further amendment which specifically states that this Registration Statement shall thereafter become effective in accordance with Section 8(a) of the Securities Act of 1933, as amended, or until the Registration Statement shall become effective on such date as the Commission, acting pursuant to said Section 8(a), may determine.
Table of Contents
The information in this preliminary prospectus is not complete and may be changed. Neither we nor the selling stockholders may sell these securities until the registration statement filed with the Securities and Exchange Commission is effective. This preliminary prospectus is not an offer to sell these securities and it is not soliciting an offer to buy these securities in any state where the offer or sale is not permitted.
Subject to Completion, Dated April 26, 2017
PRELIMINARY PROSPECTUS
9,500,000 Shares

NCS Multistage Holdings, Inc.
Common Stock
This is an initial public offering of common stock by NCS Multistage Holdings, Inc. We are offering 9,500,000 shares of our common stock.
Prior to this offering, there has been no public market for our common stock. It is currently estimated that the initial public offering price per share will be between $15.00 and $18.00. We have applied to have our common stock listed on the NASDAQ Global Select Market (“NASDAQ”) under the symbol “NCSM.”
We are an “emerging growth company” as defined under the federal securities laws and, as such, have elected to comply with certain reduced public company reporting requirements. See “Prospectus Summary—Implications of Being an Emerging Growth Company.”
Investing in our common stock involves risks. See “Risk Factors” beginning on page 20.
| Price to Public |
Underwriting |
Proceeds to |
||||||||||
| Per Share |
$ | |||||||||||
| Total |
||||||||||||
| (1) | We refer you to “Underwriting (Conflicts of Interest),” beginning on page 130 of this prospectus, for additional information regarding total underwriter compensation. |
Neither the Securities and Exchange Commission nor any state securities commission has approved or disapproved of these securities or determined if this prospectus is truthful or complete. Any representation to the contrary is a criminal offense.
The underwriters have an option to purchase up to an additional 1,425,000 shares from the selling stockholders identified in this prospectus at the initial public offering price less the underwriting discount. We will not receive any proceeds from the sale of shares by the selling stockholders.
The underwriters expect to deliver the shares against payment in New York, New York on , 2017.
| Credit Suisse | Citigroup | Wells Fargo Securities | ||
| J.P. Morgan | Simmons & Company International Energy Specialists of Piper Jaffray | |||
| Raymond James |
RBC Capital Markets | Tudor, Pickering, Holt & Co. | ||
Prospectus dated , 2017.
Table of Contents
| Page | ||||
| 1 | ||||
| 20 | ||||
| 44 | ||||
| 46 | ||||
| 47 | ||||
| 48 | ||||
| 50 | ||||
| 52 | ||||
| MANAGEMENT’S DISCUSSION AND ANALYSIS OF FINANCIAL CONDITION AND RESULTS OF OPERATIONS |
54 | |||
| 72 | ||||
| 78 | ||||
| 92 | ||||
| 100 | ||||
| 110 | ||||
| 113 | ||||
| 116 | ||||
| 122 | ||||
| 125 | ||||
| MATERIAL U.S. FEDERAL INCOME AND ESTATE TAX CONSIDERATIONS FOR NON-U.S. HOLDERS |
127 | |||
| 130 | ||||
| 138 | ||||
| 138 | ||||
| 138 | ||||
Neither we, nor the selling stockholders, nor the underwriters (or any of our or their respective affiliates) have authorized anyone to provide any information other than that contained in this prospectus or in any free writing prospectus prepared by or on behalf of us or to which we have referred you. Neither we, nor the selling stockholders, nor the underwriters (or any of our or their respective affiliates) take any responsibility for, and can provide no assurance as to the reliability of, any other information that others may give you. We, the selling stockholders and the underwriters (or any of our or their respective affiliates) are not making an offer to sell these securities in any jurisdiction where the offer or sale is not permitted. You should assume that the information appearing in this prospectus or any free-writing prospectus is only accurate as of its date, regardless of its time of delivery or the time of any sale of shares of our common stock. Our business, financial condition, results of operations and prospects may have changed since that date.
Dealer Prospectus Delivery Obligation
Until , 2017 (25 days after the date of this prospectus), all dealers that buy, sell or trade in shares of these securities, whether or not participating in this offering, may be required to deliver a prospectus. This is in addition to the dealers’ obligation to deliver a prospectus when acting as underwriters and with respect to their unsold allotments or subscriptions.
Trademarks and Trade Names
We own or have the rights to use various trademarks, service marks and trade names referred to in this prospectus, including, among others, AirLock, GripShift, Mongoose, MultiCycle, Multistage Unlimited, ATRS, Vector Max, Vector-1 and NCS and their respective logos. Solely for convenience, we refer to trademarks, service marks and trade names in this prospectus without the TM, SM and ® symbols. Such references are not intended to indicate, in any way, that we will not assert, to the fullest extent permitted by law, our rights to our trademarks, service marks and trade names. Other trademarks, service marks or trade names appearing in this prospectus are the property of their respective owners.
i
Table of Contents
Market and Industry Information
Unless otherwise indicated, market data and industry information used throughout this prospectus is based on management’s knowledge of the industry and the good faith estimates of management. We also relied upon management’s review of independent industry surveys and publications, to the extent available, as well as other publicly available information prepared by a number of sources, including Spears & Associates, BP p.l.c. and the U.S. Energy Information Administration. All of the market data and industry information used in this prospectus involves a number of assumptions and limitations and you are cautioned not to give undue weight to such estimates. Although we believe that these sources are reliable, neither we nor the underwriters can guarantee the accuracy or completeness of this information and neither we nor the underwriters have independently verified this information. While we believe the estimated market position, market opportunity and market size information included in this prospectus is generally reliable, such information, which is derived in part from management’s estimates and beliefs, is inherently uncertain and imprecise. Projections, assumptions and estimates of our future performance and the future performance of the industry in which we operate are necessarily subject to a high degree of uncertainty and risk due to a variety of factors, including those described in “Risk Factors,” “Cautionary Note Regarding Forward-Looking Statements” and elsewhere in this prospectus. These and other factors could cause results to differ materially from those expressed in our estimates and beliefs and in the estimates prepared by independent parties.
ii
Table of Contents
This summary highlights information appearing elsewhere in this prospectus. This summary is not complete and does not contain all of the information that you should consider before making a decision to participate in the offering. You should carefully read the entire prospectus before making an investment decision, including the information presented under “Risk Factors,” “Cautionary Note Regarding Forward-Looking Statements,” “Management’s Discussion and Analysis of Financial Condition and Results of Operations” and the consolidated financial statements and notes related thereto included elsewhere in this prospectus. Unless the context requires otherwise, references to “our company,” “we,” “us,” “our” and “NCS” refer to NCS Multistage Holdings, Inc. and its direct and indirect subsidiaries on a consolidated basis. References in this prospectus to “selling stockholders” refer to those entities identified as selling stockholders in “Principal and Selling Stockholders.” All dollar amounts refer to United States dollars unless otherwise indicated.
Overview
We are a leading provider of highly engineered products and support services that facilitate the optimization of oil and natural gas well completions and field development strategies. We provide our products and services primarily to exploration and production (“E&P”) companies for use in onshore wells, predominantly wells that have been drilled with horizontal laterals in unconventional oil and natural gas formations. Our products and services are utilized in oil and natural gas basins throughout North America and in selected international markets, including Argentina, China and Russia. We have provided our products and services to over 140 customers in 2016, including leading large independent oil and natural gas companies and major oil companies.
Our primary offering is our Multistage Unlimited family of completion products and services, which enable efficient pinpoint stimulation: the process of individually stimulating each entry point into a formation targeted by an oil or natural gas well. Our Multistage Unlimited products and services are typically utilized in cemented wellbores and enable our customers to precisely place stimulation treatments in a more controlled and repeatable manner as compared with traditional completion techniques. Our Multistage Unlimited products and services operate in conjunction with third-party providers of pressure pumping, coiled tubing and other services.
We began providing pinpoint stimulation products and services in 2006, and since then our technology has been used in the completion of more than 7,600 wells comprising over 155,000 individual frac stages. Our initial focus on the Canadian market has resulted in our products and services being used in 26% of all horizontal wells drilled in Canada in 2016. We began our efforts to increase our penetration of the U.S. market in 2013, and the United States accounted for approximately 23% of our revenue in 2016. We are focused on increasing our market share in the United States, particularly in the Permian Basin. Sales of our products and services in the Permian Basin contributed 56% and 43% of our revenue in the United States in 2016 and 2015, respectively.
Multistage Unlimited includes our casing-installed sliding sleeves and downhole frac isolation assembly. Customers typically purchase our casing-installed sliding sleeves, a consumable product that is cemented at intervals into the casing of the wellbore, and can also utilize services associated with our downhole frac isolation assembly. Our downhole frac isolation assembly is comprised of numerous subcomponents, including a resettable bridge plug for stage isolation, a sleeve locator to efficiently locate our sliding sleeves in the wellbore, an abrasive perforating sub that can perforate the casing where our sliding sleeves are not installed and gauge packages that can measure and record downhole data. Our personnel supervise the use of the downhole frac isolation assembly during completion operations. In addition, our downhole frac isolation assembly provides valuable downhole data, including recorded downhole temperatures and pressures, which can be analyzed and used in designing future completion strategies. Further, because our downhole frac isolation assembly is deployed on coiled tubing, our customers have access to real-time downhole pressure measurements which can be used to adjust strategies during a well completion. We offer two primary models of sliding sleeves: our
1
Table of Contents
GripShift sliding sleeves, which open one time, and our MultiCycle sliding sleeves, which can be opened and closed multiple times giving our customers the benefit of additional completion options and the ability to better optimize a well’s production phase. We hold 23 patents related to our technology and received the World Oil Best Completions Technology Award in 2014 and 2015 for our Multistage Unlimited products and services and MultiCycle sliding sleeves, respectively.
We complement our proprietary products and services with our in-house expertise in completions engineering, reservoir engineering and geology. These capabilities allow us to engage with our customers on well completion design and well spacing decisions, thereby supporting our customers’ completion optimization strategies and building lasting relationships. In addition, our extensive research and development efforts are influenced and driven by the needs of our customers, allowing us to introduce innovative and commercial solutions that improve customer efficiency and profitability.
Our revenue for the years ended December 31, 2016 and 2015, was $98.5 million and $114.0 million, respectively. Our net income (loss) for the years ended December 31, 2016 and 2015, was $(17.9) million and $28.0 million, respectively. Our Adjusted EBITDA for the years ended December 31, 2016 and 2015 was $13.9 million and $26.2 million, respectively. For the definition of Adjusted EBITDA and a reconciliation to its most directly comparable financial measure calculated and presented in accordance with Generally Accepted Accounting Principles (“GAAP”), please read “Summary Historical Consolidated Financial and Other Data.”
Our Industry
Over the past decade, E&P companies have increasingly focused on exploiting the vast hydrocarbon reserves contained in North America’s unconventional oil and natural gas reservoirs by utilizing horizontal drilling and hydraulic fracturing. According to Spears & Associates (“Spears”), in 2016, over 55% of all onshore wells drilled in the United States and over 80% of all onshore wells drilled in Canada included horizontal well sections, or laterals, an increase from 30% and 62%, respectively, in 2011. According to Spears, horizontal wells accounted for 79% of total onshore drilling and completion spending in the United States and 95% of total onshore drilling and completion spending in Canada in 2016.
The most commonly used completion technique for unconventional wells is plug and perforate, or “plug and perf.” The plug and perf technique uses a tool called a perf gun to create clusters of holes, or perforations, in the casing of the wellbore. After the perf gun has been removed from the well, the formation is hydraulically fractured through the newly created clusters of perforations, connecting the wellbore to the surrounding reservoir. After the frac stage is completed, the well is temporarily plugged just above the recently stimulated section and the perforation and hydraulic fracturing process is repeated until the number of desired frac stages have been placed. This technique is most commonly applied in wells in which the well’s casing or lining has been cemented in place.
“Ball drop” is another technique commonly used in open hole, or uncemented, well configurations. This technique utilizes a series of sliding sleeves pre-installed in the well’s casing or lining during well construction. Rather than using a perf gun to create openings, a specially sized ball is dropped into the well prior to each stage being hydraulically fractured. The size of the ball allows it to pass through to a matching “seat” profile on a sleeve in the well, where it acts both to enable the shifting of the sleeve, exposing ports to the formation, and to plug the bottom of the wellbore, providing isolation. Ball drop systems typically rely on different ball sizes to activate the sleeves and, as a result, the wellbore will increasingly narrow toward the “toe,” or furthest point in the well, and the number of sleeves and stages that can be fractured can be limited by available ball sizes.
E&P companies have increasingly adopted techniques and equipment that drive more effective resource recovery, including longer-length well laterals, closer spacing of hydraulic fracturing stages, a higher number of
2
Table of Contents
stages per well and more volume of fluid and proppant used per well and per foot of lateral. Additionally, as E&P companies have begun to move toward infill and development drilling, the spacing between wells has decreased, and is expected to continue to decrease, increasing the need for more precise drilling and completion techniques.
While plug and perf and ball drop techniques have traditionally been used in unconventional well completions, these techniques have several drawbacks that limit their ability to optimize completions and maximize hydrocarbon recovery. Limitations associated with traditional well completion techniques include:
| • | inconsistent and uncontrollable placement of fractures that cannot be reliably repeated from stage to stage due to variable breakdown pressures, leading to under-stimulation of wells; |
| • | inability to monitor downhole pressure or measure pressures and temperatures during stimulation, limiting control and making optimization more challenging; |
| • | inability to close and reopen perforations and sleeves, limiting options following the initial completion; and |
| • | completion designs that result in under-stimulation of wells to reduce the likelihood of an operational issue referred to as a “screenout,” and the associated costly recovery process. |
To reduce the amount of under-stimulated reservoir area that can occur when using these traditional techniques, many E&P companies are reducing the spacing between stages, thereby increasing the number of stages per well. However, increasing stage counts with traditional completion techniques can result in other operational inefficiencies, such as increased time and expense in the case of plug and perf completions, or, in the case of ball drop completions, the inability to place the desired number of stages due to the limited number of ball and seat sizes available.
Competitive Strengths
We believe we are well positioned to achieve our business objectives based on the following competitive strengths:
| • | Patented and differentiated completions technology. Our value proposition is built on a foundation of patent-protected technology and industry leading technical capabilities. Our Multistage Unlimited products and services are designed to provide our customers with an enhanced degree of precision for more predictable, repeatable and verifiable well completions, in order to maximize reservoir connectivity while minimizing the impact of the completion on the productivity of offsetting wells. Our technology also provides E&P companies access to accurate real-time and recorded downhole information which can enhance completion and well spacing optimization strategies. This information is typically not available with traditional completion techniques. We believe that the benefits provided by our proprietary technology and our operating experience and know-how differentiate us from providers of traditional completion technologies, including plug and perf and ball drop, and from other pinpoint stimulation competitors. |
| • | Proven record of successfully introducing new technologies that drive completion and production optimization. Our research and development efforts are targeted to solve customer challenges and provide solutions that improve customer efficiency and profitability. Our in-house and field engineering teams are responsible for developing new technology to expand our product and service offerings and enhance the performance of our existing products. During the recent commodity price downturn, we accelerated our investment in these efforts, adding to our pipeline for future product and service introductions. We believe we are a leader in the development of new completions technology, which is reflected in our extensive and growing suite of patent-protected products and methods. We hold 9 U.S. patents and 14 related international patents and have 40 U.S. patent applications pending and 51 related international |
3
Table of Contents
| patents pending. We received the World Oil Best Completions Technology Award in 2014 and 2015 for our Multistage Unlimited products and services and MultiCycle sliding sleeves, respectively. We believe our engineering expertise, combined with our focus on completions technology, gives us a competitive advantage in designing and commercializing new completions technology. For example, we introduced our AirLock casing buoyancy system in late 2013 and this system has been utilized in over 1,650 wells since its introduction. The AirLock continues to increase its market penetration, with 50% more AirLocks sold during 2016 as compared to 2015, a time period in which the total number of horizontal wells drilled in the U.S. and Canada declined on a year-over-year basis. |
| • | Market leader in pinpoint stimulation. We believe we are a global leader in pinpoint stimulation products and services, based on the number of wells completed using our technology and the number of stages in the wells completed using our technology. Since our founding, our products and services have been utilized by our customers for the pinpoint completion of over 7,600 wells, resulting in the placement of over 155,000 frac stages. Our experience as a leader in pinpoint stimulation has given us the opportunity to gain valuable operational insights into the use of this stimulation technique. We have used these insights to continually improve upon our existing products and to develop new products. Our products and services have been utilized in all major unconventional oil and natural gas basins in North America and in selected global markets. Our leadership in pinpoint stimulation has led to the use of our products and services in a number of wells that include what we believe to be the highest number of stages in the following basins: 147 stages in a well in the Permian Basin, 116 stages in a well in the Marcellus shale, 134 stages in a well in the Montney, 123 stages in a well in the Duvernay, 106 stages in a well in the Cardium, 60 stages in a well in the Vaca Muerta region in Argentina and 30 stages in a well in the Khantos region in Russia. |
| • | Asset-light business model and strong balance sheet provide significant flexibility. Throughout the commodity price downturn, we have maintained attractive margins, which we believe validates our value proposition to our customers and reflects our ability to quickly adjust our cost structure. Our Adjusted EBITDA as a percentage of revenue was 14%, 23%, 43% and 46% for the years ended December 31, 2016, 2015, 2014 and 2013, respectively. Because our business is not capital intensive, we are able to generate significant free cash flow through business cycles, with free cash flow as a percentage of revenue of 9%, 3%, 18% and 8% for the years ended December 31, 2016, 2015, 2014 and 2013, respectively. However, we had a net loss of approximately $17.9 million for the year ended December 31, 2016, which was primarily due to the effects of the commodity price downturn. By focusing on downhole completion equipment and services, and not high-cost assets deployed on the surface, such as coiled tubing or pressure pumping units, our net property and equipment (“P&E”) at December 31, 2016 was $9.8 million. Sales of our products, which are consumable items, represented approximately 74% and 70% of our revenue for the years ended December 31, 2016 and 2015, respectively. We believe we have a strong balance sheet and ample liquidity to pursue our growth initiatives. At the closing of this offering, we expect to have no or minimal debt outstanding and $72.3 million in liquidity from cash on hand and $50.0 million of available borrowing capacity under our New Senior Secured Credit Facility (as defined below) that we expect to enter into concurrently with the closing of this offering. |
| • | Trusted advisor to a leading customer base. We have leveraged our extensive experience and differentiated products and services to establish strong relationships with our customers. For the last eight years, we have been the preferred completion technology provider to Crescent Point Energy (“Crescent Point”), our largest customer and one of Canada’s largest independent E&P companies. Our technology has been vetted and chosen by some of the largest, most sophisticated energy companies in the world, resulting in a customer base that includes more than 140 customers globally, including national, major and large independent oil companies, such as Apache Corporation, Crescent Point Energy Corp., Devon Energy Corporation, Gazprom Neft PJSC, Range Resources Corporation and Royal Dutch Shell plc. We established Anderson Thompson Reservoir Strategies (“ATRS”), a team of engineering consultants, in |
4
Table of Contents
| 2015 as a complement to our products and services to provide in-house expertise to assist our customers in optimizing their completion designs and development plans and to evaluate well performance. We believe our ATRS group has deepened our relationships with existing customers, helped us add new customers and effectively demonstrated the value proposition of our pinpoint stimulation offerings. In addition, several of our customers have worked with us to develop new completion technology for specific applications, highlighting their trust in our product development capabilities and adding to our pipeline of technologies available to all of our customers. |
| • | Experienced, entrepreneurial management team with strong culture of innovation. Our management team, led by co-founders, CEO, Robert Nipper, and President, Marty Stromquist, provides disciplined strategic direction and insight gained from multi-decade careers in the energy technology and oilfield service industries. Our founders, pioneers in pinpoint stimulation, led our company through a period of exceptional growth and provide the keystone for our culture. Our culture is defined by “The Promise,” a document that guides our relationships with our employees, customers, vendors and other stakeholders and affirms our commitment to quality and safety. We maintain our culture through the ongoing coaching of our employees and continuously measure ourselves to identify areas for improvement. Together, Mr. Nipper and Mr. Stromquist, have assembled a management team with extensive backgrounds in research and development, manufacturing, operations and finance, with an average of over 25 years of industry and otherwise relevant experience. |
Our Business Strategy
Our primary business objectives are to increase the adoption of our products and services in all geographies, continue to be an innovator of technology and create value for our stockholders. We intend to achieve these objectives through the execution of the following strategies:
| • | Focus on expansion in the United States while pursuing disciplined organic growth globally. We plan to continue to grow our business in all geographies in which we operate, with our current emphasis on profitably expanding our presence in the United States. We increased our efforts to target the U.S. market in 2013 and believe we can increase our share in all basins in the United States as our customers focus on optimizing completion designs in an effort to increase overall hydrocarbon recovery and improve financial returns from their assets. In 2016 the United States accounted for approximately 23% of our revenue. We continue to focus on growing our presence in the Permian Basin, the most active basin in the United States, which accounted for 56% of our revenue in the United States during the year ended December 31, 2016. During 2016, we expanded into a larger operational facility in Midland, Texas and directed additional sales efforts to customers operating in the Permian Basin. Outside of the United States, we plan to increase our market position in several deep basin plays in Canada, including the Montney formation, where we currently have lower, but growing, market shares relative to other regions in Canada. We also plan to increase our market position in Argentina, China, and Russia, regions where we have successful operations and which have significant unconventional resource development potential. |
| • | Develop and introduce innovative technologies that are aligned with customer needs. Our team of over 30 engineers and engineering technicians works closely with our technical services organization and our customers to identify specific product and service needs, develop business cases and bring new technology to market on an expedited basis. Collaborating with our customers allows us to identify unaddressed industry-wide needs and to develop new technologies, of which we have several under development. By introducing new technologies, we expand our product and service portfolio, grow our customer base and leverage our current customer relationships to generate additional revenue. We believe we have established strong working relationships with our customers, and we are collaborating with several of our customers on solutions for specific onshore and offshore completions needs, with NCS retaining the rights to the intellectual property derived from these projects. We expect to continue to work with our customers on specific solutions to supplement our in-house technology development efforts. |
5
Table of Contents
| • | Leverage technology leadership to grow market share. Our extensive experience, differentiated offerings and focus on responding to evolving customer needs has allowed us to establish strong relationships with our customers. Over the years we have added in-house capabilities that provide additional value-added expertise and services to our customers, including completions engineering and ATRS. We believe that by focusing on customer service, while continuing to introduce innovative completions solutions, we can strengthen our relationships with existing customers, grow our customer base and increase our revenues. We believe the benefits provided by our technology and our expertise position us to continue to increase our penetration of large independent and major oil companies. We believe these customers are typically more consistent in their capital budgeting, operate in multiple geographies and in many cases are focused on evaluating and deploying technology that can improve well performance. We believe that our ability to pair our in-house expertise, together with the data that is available through our Multistage Unlimited products and services have been key factors enabling us to increase our business with these customers, which represented 45% of our revenue for the year ended December 31, 2016, as compared with 47% and 37% for the years ended December 31, 2015 and 2014, respectively. |
| • | Maintain financial strength and flexibility. We expect to continue to employ a disciplined financial policy that maintains our financial strength and flexibility. We have maintained our financial flexibility by taking actions designed to preserve positive cash flows, minimize capital expenditures and reduce debt levels. We believe our resulting financial strength and flexibility provides us with the ability to execute our strategy through industry volatility and commodity price cycles, as evidenced by our performance throughout the recent commodity price downturn. For example, during the downturn we were able to leverage our supply chain through initiatives to reduce the number of vendors in our manufacturing operations, as well as reduce our manufacturing costs for certain products by over 30%, which has supported our gross margin. We believe that our cash on hand, expected borrowing capacity and ability to access debt and equity capital markets after this offering, combined with our ability to generate free cash flow, will provide the financial flexibility required to execute our growth strategies. |
| • | Selectively pursue complementary acquisitions and joint ventures. We believe there is an opportunity to enhance our existing product and service capabilities and geographic scope by selectively pursuing acquisitions and joint ventures. We intend to target strategic acquisitions that will enhance our market position and provide opportunities for synergies. We believe that being a public company will allow us to target a broader range of acquisition candidates. |
Our Products and Services
We provide products and services that enable pinpoint stimulation: the process of individually stimulating each entry point into a formation targeted by an oil or natural gas well. We believe that our products and services improve on traditional completion techniques. Our solutions and refined field processes are designed to enable efficient, controlled, verifiable and repeatable completions. We complement our multistage completion products and services with other efficiency-enhancing completions technologies and our multi-disciplinary engineering capabilities. Our key products and services include:
| • | Multistage Unlimited. Our Multistage Unlimited family of products and services encompasses our technology developed to enable efficient pinpoint stimulation and re-stimulation strategies. This suite of products is comprised of our casing-installed sliding sleeves and our downhole frac isolation assemblies, which are deployed using coiled tubing. Our services include advising customers on optimizing completion designs and operating the downhole frac isolation assemblies. |
| • | Casing-installed sliding sleeves. Our casing-installed sliding sleeves are a consumable product, sold to our customers and cemented in place in a well’s casing. Over 112,000 of our casing-installed sliding sleeves have been installed, including over 30,000 of our MultiCycle sliding sleeves. We produce two primary models of sliding sleeves: our GripShift sliding sleeves, which can be opened only once, and |
6
Table of Contents
| our MultiCycle sliding sleeves, introduced in late 2013, which can be opened and closed multiple times throughout the life of a well. The image below illustrates one of our MultiCycle sliding sleeves. During completion operations, the downhole frac isolation assembly is placed in the sleeve and the inner barrel of the sleeve is shifted down, exposing the frac ports to the formation, allowing the completion of that stage to begin. |
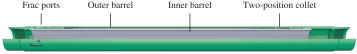
Key features of both primary models of our sliding sleeves include:
| • | no practical limitation on the number of stages in a well; |
| • | a full-drift inner-diameter that is the same as the wellbore’s casing, with no plugs or ball seats to mill or drill out; |
| • | designed for use in cemented or open-hole wellbores; and |
| • | a cumulative sleeve shifting success rate of over 99%. |
Additionally, our MultiCycle sliding sleeves provide the ability to:
| • | close the sleeves immediately following the completion of a stage to mitigate proppant flowback, enhancing conductivity and reducing the need for post-completion well cleanouts; |
| • | close off zones producing high levels of water or unwanted natural gas; |
| • | execute high rate, pinpoint refracturing strategies; and |
| • | support the conversion of a producing well to an injector well for enhanced oil recovery (“EOR”) strategies, including floods and pressure maintenance. |
| • | Downhole frac isolation assembly. Our proprietary downhole frac isolation assembly is comprised of several subcomponents. The assembly is primarily used to locate our sliding sleeves, to establish wellbore isolation and to shift our sliding sleeves open or closed. We typically own the assemblies and utilize them in our service to our customers. Our personnel operate the assemblies during completion operations in coordination with other on-site service providers. The image below illustrates a downhole frac isolation assembly designed for use with our MultiCycle sliding sleeves. |
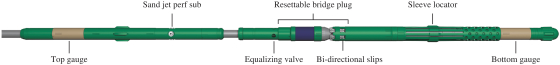
Key features of our downhole frac isolation assembly include:
| • | a resettable bridge plug enabling the completion of all stages in a well without having to remove the assembly from the wellbore; |
| • | an abrasive perforating subassembly, which can be utilized to add stages to a well with sliding sleeves installed or as the method to establish formation access in wells not utilizing our sleeves; |
| • | gauge packages located above and below the resettable bridge plug that record pressure and temperature data; |
7
Table of Contents
| • | benefits associated with having coiled tubing in the wellbore, including real-time bottom-hole pressure measurements, the ability to circulate fluids to the stage being completed and the ability to mitigate screenouts; and |
| • | a range of configurations allowing a variety of pinpoint stimulation and refracturing strategies. |
| • | Anderson Thompson Reservoir Strategies. Our specialized team of engineering consultants advises customers on optimized completion designs and field development strategies and evaluates well performance. ATRS helps us strengthen our relationships with our customers and has been effective at demonstrating the benefits of our Multistage Unlimited products and services as compared to traditional completion techniques. |
| • | AirLock casing buoyancy system. Our AirLock casing buoyancy system facilitates landing casing strings in horizontal wells without altering a customer’s preferred casing and cementing operations. The AirLock, which is installed with a well’s casing, allows the vertical casing section to be filled with fluid, while the lateral section remains air-filled and buoyant. The enhanced buoyancy significantly reduces sliding friction, while the enhanced weight of the vertical section provides the force needed to push the casing to the toe of the well, ensuring the casing reaches the desired depth and reducing casing running time and cost. |
| • | Liner hanger systems. Introduced in late 2014, our proprietary Vector Max and Vector-1 liner hanger systems are specifically designed to perform in complex horizontal wells and are fully compatible with our Multistage Unlimited products. The liner hanger is used to distribute the loads and weight of the liner to the supporting casing. |
Implications of Being an Emerging Growth Company
As a company with less than $1.0 billion in gross revenue during our last fiscal year, we qualify as an “emerging growth company” as defined in the Jumpstart Our Business Startups Act of 2012 (the “JOBS Act”). An emerging growth company may take advantage of specified reduced reporting and other regulatory requirements for up to five years that are otherwise applicable generally to public companies. These provisions include, among other matters:
| • | requirement to present only two years of audited financial statements and only two years of related Management’s Discussion and Analysis of Financial Condition and Results of Operations in a Registration Statement on Form S-1; |
| • | exemption from the auditor attestation requirement on the effectiveness of our system of internal control over financial reporting; |
| • | exemption from the adoption of new or revised financial accounting standards until they would apply to private companies; |
| • | exemption from compliance with any new requirements adopted by the Public Company Accounting Oversight Board requiring mandatory audit firm rotation or a supplement to the auditor’s report in which the auditor would be required to provide additional information about the audit and the financial statements of the issuer; |
| • | exemption from the requirement to seek non-binding advisory votes on executive compensation and golden parachute arrangements; and |
| • | reduced disclosure about executive compensation arrangements. |
We will remain an emerging growth company until the end of the fiscal year following the fifth anniversary of this offering unless, prior to that time, we have more than $1.0 billion in annual gross revenue, have a market
8
Table of Contents
value for our common stock held by non-affiliates of more than $700 million as of the last day of our second fiscal quarter of the fiscal year and a determination is made that we are deemed to be a “large accelerated filer,” as defined in Rule 12b-2 promulgated under the Securities Exchange Act of 1934, as amended (the “Exchange Act”), or issue more than $1.0 billion of non-convertible debt over a three-year period, whether or not issued in a registered offering.
We have availed ourselves of the reduced reporting obligations with respect to audited financial statements and related Management’s Discussion and Analysis of Financial Condition and Results of Operations and executive compensation disclosure in this prospectus and expect to continue to avail ourselves of the reduced reporting obligations available to emerging growth companies in future filings. We plan to comply with new and revised accounting standards on the relevant dates on which adoption of those standards is required for non-emerging growth companies. Our decision to opt out of the extended transition period for complying with new or revised accounting standards is irrevocable.
As a result of our decision to avail ourselves of certain provisions of the JOBS Act, the information that we provide may be different than what you may receive from other public companies in which you hold an equity interest. In addition, it is possible that some investors will find our common stock less attractive as a result of our elections, which may cause a less active trading market for our common stock and more volatility in our stock price.
Risks Associated With Our Business
Investing in our common stock involves a number of risks. These risks represent challenges to the successful implementation of our strategy and the growth of our business, which could cause a decrease in the price of our common stock and a loss of all or part of your investment. Some of these risks are:
| • | Our business depends on the oil and natural gas industry and particularly on the level of exploration and production activity within Canada and the United States, and the ongoing decline in prices for oil and natural gas have had, and may continue to have, a material adverse effect on our business, financial condition and results of operations. |
| • | A single customer constituted approximately 26% and 31% of our revenue for the years ended December 31, 2016 and 2015, respectively and the loss of that customer or any other of our significant customers, or their failure to pay the amounts they owe us, could cause our revenue to decline substantially. |
| • | Advancements in drilling and well completion technologies could have a material adverse effect on our business, financial condition, results of operations and cash flows. |
| • | We often have long sales cycles, which can result in significant time between initial contact with a prospective customer and sales of our products and services to that customer, making it difficult to project when, if at all, we will obtain new customers and when we will generate revenue from those customers. |
| • | Our success depends on our ability to develop and implement new technologies, products and services. |
| • | Our products are used in operations that are subject to potential hazards inherent in the oil and natural gas industry and, as a result, we are exposed to potential liabilities that may affect our financial condition and reputation. |
| • | We may be adversely affected by disputes regarding intellectual property rights and the value of our intellectual property rights is uncertain. |
| • | The adoption of climate change legislation or regulations restricting emissions of greenhouse gases (“GHGs”) could result in increased operating costs and reduced demand for oil and natural gas. |
9
Table of Contents
| • | We are controlled by funds (the “Advent Funds”), managed by Advent International Corporation (“Advent”), whose interests may differ from those of our public stockholders. |
For a discussion of these and other risks you should consider before making an investment in our common stock, see the section entitled “Risk Factors.”
Our Private Equity Sponsor
Founded in 1984, Advent has invested in more than 320 private equity transactions in 40 countries and as of December 31, 2016, had $41.2 billion in assets under management. Advent’s current portfolio is comprised of investments across five sectors—Retail, Consumer & Leisure; Financial and Business Services; Industrial; Technology, Media & Telecoms; and Healthcare. The Advent team includes more than 190 investment professionals across Europe, North America, Latin America and Asia.
Following the closing of this offering, the Advent Funds are expected to own approximately 68.3% of our outstanding common stock, or 65.3%, if the underwriters’ option to purchase additional shares is fully exercised. As a result, Advent will be able to exercise significant voting influence over fundamental and significant corporate matters and transactions. We are also a party to certain other agreements with the Advent Funds and certain of their affiliates. See “Risk Factors—Risks Relating to This Offering and Ownership of Our Common Stock,” “Principal and Selling Stockholders” and “Certain Relationships and Related Party Transactions.”
Corporate Information
We were incorporated in Delaware on November 28, 2012, under the name “Pioneer Super Holdings, Inc.” On December 13, 2016, we changed our name to “NCS Multistage Holdings, Inc.” Our principal executive offices are located at 19450 State Highway 249, Suite 200, Houston, TX 77070, and our telephone number is (281) 453-2222. Our corporate website address is www.ncsmultistage.com. Our website and the information contained on, or that can be accessed through, the website is not deemed to be incorporated by reference in, and is not considered part of, this prospectus.
10
Table of Contents
Our Corporate Structure
The following chart illustrates our ownership structure after this offering:
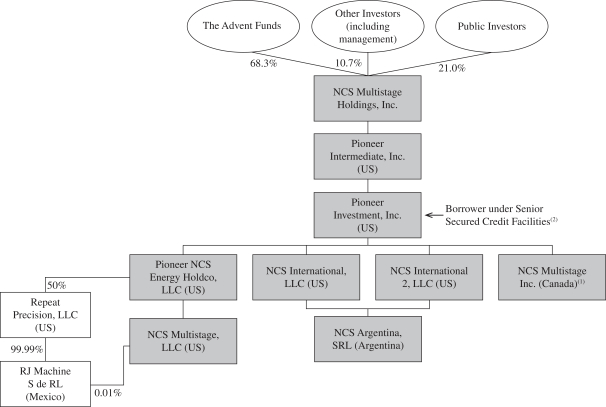
| (1) | Certain holders of equity in NCS Multistage Inc. (Canada) hold an exchange right to convert 1,819,247 shares of common stock of NCS Multistage Inc. (Canada) for 1,819,247 shares of our common stock. |
| (2) | In connection with this offering, we intend to enter into a New Senior Secured Credit Facility (as defined below), NCS Multistage Holdings, Inc. and Pioneer Intermediate, Inc. will both be parent guarantors under the New Senior Secured Credit Facility and Pioneer Investment, Inc. and NCS Multistage Inc. will be borrowers under the New Senior Secured Credit Facility. |
Preliminary Estimate of Selected First Quarter 2017 Financial Results
Although our results of operations for the three months ended March 31, 2017 are not yet final, the following unaudited information reflects our preliminary estimates of selected results based on information currently available to management.
We have prepared these estimates on a materially consistent basis with the financial information presented elsewhere in this prospectus and in good faith based upon our current internal reporting as of and for the three months ended March 31, 2017. These estimated ranges are preliminary and unaudited and are thus inherently uncertain and subject to change as we complete our financial results as of and for the three months ended March 31, 2017. We are in the process of completing our customary quarterly close and review procedures as of and for the three months ended March 31, 2017, and there can be no assurance that our final results for this period will not differ from these estimates. During the preparation of our consolidated financial statements and
11
Table of Contents
related notes as of and for the three months ended March 31, 2017, we may identify items that cause our final reported results to be materially different from the preliminary financial estimates presented herein as a result of various factors, including those that are set forth under the headings “Risk Factors” and “Cautionary Note Regarding Forward-Looking Statements.”
These estimates should not be viewed as a substitute for full interim financial statements prepared in accordance with GAAP. In addition, these estimates for the three months ended March 31, 2017 are not necessarily indicative of the results to be achieved for the remainder of 2017 or any future period. Our consolidated financial statements and related notes as of and for the three months ended March 31, 2017 are not expected to be filed with the SEC until after this offering is completed. The preliminary financial data included in this registration statement has been prepared by, and is the responsibility of, our management. PricewaterhouseCoopers LLP has not audited, reviewed, compiled, or performed any procedures with respect to the preliminary financial data. Accordingly, PricewaterhouseCoopers LLP does not express an opinion or any other form of assurance with respect thereto.
Based on currently available information, we estimate, on a preliminary basis, that revenue will be within a range of $57.0 million to $59.0 million for the three months ended March 31, 2017, as compared to $23.1 million for the same period in 2016. This increase was primarily attributable to an increase in the sale of our completions products and services due to higher drilling and well completion activity as a result of an improved commodity price environment in the first quarter of 2017 as compared to the first quarter of 2016.
Based on currently available information, we sold more than 17,000 sleeves during the three months ended March 31, 2017, as compared to 7,117 sleeves for the same period in 2016 and we were involved in the completion of more than 450 customer wells during the three months ended March 31, 2017 as compared to 259 customer wells for the same period in 2016.
Based on currently available information, we also estimate, on a preliminary basis, that net income will be within a range of $5.7 million to $7.7 million for the three months ended March 31, 2017, as compared to a net loss of $8.1 million for the same period in 2016. The improved results were primarily attributable to the factors discussed above.
In addition, based on currently available information, we estimate, on a preliminary basis, that Adjusted EBITDA will be within a range of $17.8 million to $19.8 million for the three months ended March 31, 2017, as compared to $2.7 million for the same period in 2016. The increase primarily related to increases in revenues during the first quarter of 2017 as compared to the first quarter of 2016, as discussed above, partially offset by increases in our cost of revenue and operating expense.
EBITDA and Adjusted EBITDA are not financial measures presented in accordance with GAAP. We define EBITDA as net income (loss) before interest expense, net, income tax expense (benefit) and depreciation and amortization. We define Adjusted EBITDA as EBITDA adjusted to exclude certain items which we believe are not reflective of ongoing performance, including (i) non-cash items, such as share-based compensation expense, the amortization of intangible assets recorded as a result of the Advent Transaction, described in more detail in the section titled “Management’s Discussion and Analysis of Financial Condition and Results of Operations,” and realized and unrealized gains associated with fluctuations in foreign currency exchange rates and (ii) charges that do not relate to our operations, such as interest expense, and income tax provision. We believe that presenting Adjusted EBITDA enables investors to assess our performance from period to period using the same metric utilized by management and to evaluate our performance relative to other companies that are not subject to such factors. Adjusted EBITDA is also calculated in a manner consistent with the terms of the instruments governing our Senior Secured Credit Facilities (and the anticipated terms of our New Senior Secured Credit Facility).
12
Table of Contents
EBITDA and Adjusted EBITDA are not defined under GAAP, are not measures of net income, income from operations or any other performance measure derived in accordance with GAAP, and are subject to important limitations. Our use of the terms EBITDA and Adjusted EBITDA may not be comparable to similarly titled measures of other companies in our industry and are not measures of performance calculated in accordance with GAAP. EBITDA and Adjusted EBITDA have important limitations as analytical tools and you should not consider them in isolation or as substitutes for analysis of our financial performance as reported under GAAP and they should not be considered as alternatives to net income (loss) or any other performance measures derived in accordance with GAAP as measures of operating performance or as alternatives to cash flow from operating activities as measures of our liquidity. For example, EBITDA and Adjusted EBITDA, among other things:
| • | exclude certain tax payments that may represent a reduction in cash available to us; |
| • | do not reflect any cash capital expenditure requirements for the assets being depreciated and amortized that may have to be replaced in the future; |
| • | do not reflect changes in, or cash requirements for, our working capital needs; and |
| • | do not reflect the significant interest expense, or the cash requirements necessary to service interest or principal payments, on our debt. |
Because of these limitations, EBITDA and Adjusted EBITDA should not be considered as measures of discretionary cash available to us to invest in the growth of our business. We compensate for these limitations by relying primarily on our GAAP results and using EBITDA and Adjusted EBITDA only for supplemental purposes.
The following table presents a reconciliation of EBITDA and Adjusted EBITDA to the GAAP financial measure of net income (loss) for the three months ended March 31, 2017 (estimated) and 2016 (actual):
| Quarter Ended March 31, | ||||||||||||
| 2017 | 2016 | |||||||||||
| Low | High | Actual | ||||||||||
| (in thousands) | ||||||||||||
| Net income (loss) |
$ | 5,738 | $ | 7,738 | $ | (8,126 | ) | |||||
| Income tax expense (benefit) (a) |
1,685 | 1,685 | (3,458 | ) | ||||||||
| Interest expense |
1,509 | 1,509 | 1,466 | |||||||||
| Depreciation |
563 | 563 | 452 | |||||||||
| Amortization |
6,022 | 6,022 | 5,771 | |||||||||
|
|
|
|
|
|
|
|||||||
| EBITDA |
15,517 | 17,517 | (3,895 | ) | ||||||||
| Share based compensation (b) |
337 | 337 | 331 | |||||||||
| Restructuring charges (c) |
— | — | 103 | |||||||||
| Board fees and expenses (d) |
265 | 265 | 125 | |||||||||
| Professional fees (e) |
1,791 | 1,791 | 76 | |||||||||
| Unrealized foreign currency loss (f) |
79 | 79 | 5,904 | |||||||||
| Realized foreign currency loss (gain) (g) |
698 | 698 | (26 | ) | ||||||||
| Other (h) |
(855 | ) | (855 | ) | 72 | |||||||
|
|
|
|
|
|
|
|||||||
| Adjusted EBITDA |
$ | 17,832 | $ | 19,832 | $ | 2,690 | ||||||
|
|
|
|
|
|
|
|||||||
| (a) | Represents estimated income tax expense at mid-point of range. |
| (b) | Represents non-cash compensation charges related to share-based compensation granted to our officers, employees and directors. |
| (c) | Represents severance and other expenses associated with headcount reductions and other cost savings initiated as part of our restructuring initiatives. |
| (d) | Represents Board fees and travel expenses paid to members of our Board, which is an adjustment permitted by the terms of our Senior Secured Credit Facilities. |
13
Table of Contents
| (e) | Represents costs of professional services incurred in connection with our initial public offering, refinancings and the evaluation of proposed acquisitions. |
| (f) | Represents unrealized foreign currency translation gains and losses primarily in respect of our indebtedness. |
| (g) | Represents realized foreign currency translation gains and losses with respect to principal and interest payments related to our indebtedness. |
| (h) | Represents the impact of a research and development subsidy that is included in income tax benefit in accordance with GAAP, fees incurred in connection with refinancing our credit facilities, arbitration awards and other charges and credits. |
Concurrent Refinancing
Concurrently with the closing of this offering, we and certain of our subsidiaries intend to enter into an Amended and Restated Credit Agreement (the “Credit Agreement”) with the lenders party thereto, Wells Fargo Bank, National Association and Wells Fargo Bank, National Association, Canadian Branch, as administrative agents and the other parties thereto (the facilities provided thereunder, the “New Senior Secured Credit Facility”). The New Senior Secured Credit Facility consists of revolving credit facilities in aggregate principal amount of $50.0 million. The closing of this offering is not conditioned on consummation of the concurrent refinancing of our credit facilities. We cannot assure you that the refinancing will be completed or, if completed, on what terms it will be completed. See “Description of Material Indebtedness—New Senior Secured Credit Facility.”
14
Table of Contents
THE OFFERING
| Issuer |
NCS Multistage Holdings, Inc. |
| Common stock offered by us |
9,500,000 shares of common stock. |
| Common stock to be outstanding after this offering |
45,325,225 shares of common stock. |
| Option to purchase additional shares of common stock |
The underwriters have an option to purchase an additional 1,425,000 shares of common stock from the selling stockholders. The underwriters can exercise this option at any time within 30 days from the date of this prospectus. |
| Use of proceeds |
We estimate that the net proceeds from the sale of our common stock in this offering, after deducting the underwriting discount and estimated offering expenses payable by us, will be approximately $144.8 million based on an assumed initial public offering price of $16.50 per share (the midpoint of the price range set forth on the cover of this prospectus). We will not receive any proceeds from the sale of shares by the selling stockholders. |
| We intend to use these net proceeds to repay indebtedness under our Senior Secured Credit Facilities and use the remainder for general corporate purposes. See “Use of Proceeds.” |
| Conflicts of interest |
Because a repayment of the outstanding borrowings under our Senior Secured Credit Facilities could result in at least 5% of the net proceeds of this offering being paid to an affiliate of an underwriter who is a lender under our Senior Secured Credit Facilities, this offering is being made in compliance with the requirements of Rule 5121 of the Financial Industry Regulatory Authority, Inc. (“FINRA”), which requires a “qualified independent underwriter,” as defined by the FINRA rules, to participate in the preparation of the registration statement and the prospectus and exercise the usual standards of due diligence in respect thereto, and Credit Suisse Securities (USA) LLC has served in that capacity and will not receive any additional fees for serving as qualified independent underwriter in connection with this offering. We have agreed to indemnify Credit Suisse Securities (USA) LLC against liabilities incurred in connection with acting as a qualified independent underwriter, including liabilities under the Securities Act. To comply with FINRA Rule 5121, Citigroup Global Markets Inc., Wells Fargo Securities, LLC and J.P. Morgan Securities LLC will not confirm sales to any account over which they exercise discretionary authority without the specific written approval of the transaction of the account holder. For more information, see “Underwriting (Conflicts of Interest).” |
15
Table of Contents
| Dividend policy |
We do not anticipate paying any dividends on our common stock for the foreseeable future; however, we may change this policy in the future. See “Dividend Policy.” |
| Directed share program |
At our request, the underwriters have reserved for sale, at the initial public offering price, up to 475,000 shares of common stock, or approximately 5% of the shares offered by us in this prospectus, for sale to our directors and directors of our joint venture with one of our suppliers. If these individuals purchase reserved shares of common stock, this will reduce the number of shares of common stock available for sale to the public. Any reserved shares of common stock that are not so purchased will be offered by the underwriters to the public on the same terms as the other shares of common stock offered by this prospectus. For further information regarding our directed share program, see “Underwriting (Conflicts of Interest)—Directed Share Program.” |
| Risk factors |
Investing in our common stock involves a high degree of risk. See the “Risk Factors” section of this prospectus beginning on page 19 for a discussion of factors you should carefully consider before investing in our common stock. |
| Listing |
We have applied to have our common stock listed on NASDAQ under the symbol “NCSM.” |
Except as otherwise indicated, the number of shares of our common stock outstanding after this offering:
| • | excludes 3,112,548 shares of our common stock issuable upon the exercise of outstanding stock options at a weighted average exercise price of $5.10 per share; |
| • | excludes an aggregate of 4,532,523 shares of our common stock that will be available for future equity awards under our 2017 Equity Incentive Plan (the “2017 Plan”); |
| • | gives effect to a 3.00 for 1.00 stock split of our common stock that was effected on April 13, 2017; |
| • | gives effect to the exchange of 1,819,247 shares of common stock of NCS Multistage, Inc. (Canada) that were offered as consideration in connection with Advent’s acquisition of NCS Energy Holdings, LLC (“HoldCo”) in 2012 for 1,819,247 shares of our common stock. See “Certain Relationships and Related Party Transactions—Cemblend Transactions”; |
| • | gives effect to our amended and restated certificate of incorporation and our amended and restated bylaws, which will be in effect prior to the consummation of this offering; and |
| • | assumes the underwriters do not exercise their option to purchase additional shares from the selling stockholders. |
Unless otherwise indicated, this prospectus assumes an initial public offering price of $16.50 per share (the midpoint of the price range set forth on the cover of this prospectus).
16
Table of Contents
SUMMARY HISTORICAL CONSOLIDATED FINANCIAL AND OTHER DATA
The following tables set forth our summary historical consolidated financial and other data for the periods and as of the dates indicated. We derived the summary consolidated statement of operations data and the consolidated statement of cash flows data for the years ended December 31, 2016 and 2015 from the audited consolidated financial statements and related notes thereto included elsewhere in this prospectus. We derived the consolidated balance sheet data as of December 31, 2016 from the audited consolidated financial statements and related notes thereto included elsewhere in this prospectus. We derived the summary consolidated statement of operations data and consolidated statement of cash flows data for the years ended December 31, 2014 and 2013 from our audited consolidated financial statements and related notes thereto not included in this prospectus.
Our historical results are not necessarily indicative of future operating results. You should read the information set forth below together with “Selected Historical Consolidated Financial Data,” “Management’s Discussion and Analysis of Financial Condition and Results of Operations,” “Capitalization” and our consolidated financial statements and the related notes thereto included elsewhere in this prospectus.
| Year Ended December 31, | ||||||||||||||||
| 2016 | 2015 | 2014 | 2013 | |||||||||||||
| (in thousands, except share and per share amounts and operating data) |
||||||||||||||||
| Consolidated Statement of Operations Data: |
||||||||||||||||
| Revenues: |
||||||||||||||||
| Product sales |
$ | 73,220 | $ | 80,079 | $ | 162,728 | $ | 92,194 | ||||||||
| Services |
25,259 | 33,926 | 57,278 | 40,456 | ||||||||||||
|
|
|
|
|
|
|
|
|
|||||||||
| Total revenues |
98,479 | 114,005 | 220,006 | 132,650 | ||||||||||||
|
|
|
|
|
|
|
|
|
|||||||||
| Cost of sales: |
||||||||||||||||
| Cost of product sales, exclusive of depreciation and amortization expense shown below |
40,511 | 40,160 | 61,863 | 31,327 | ||||||||||||
| Cost of services, exclusive of depreciation and amortization expense shown below |
13,322 | 14,553 | 20,785 | 16,133 | ||||||||||||
|
|
|
|
|
|
|
|
|
|||||||||
| Total cost of sales, exclusive of depreciation and amortization expense shown below |
53,833 | 54,713 | 82,648 | 47,460 | ||||||||||||
|
|
|
|
|
|
|
|
|
|||||||||
| Selling, general and administrative expenses |
37,061 | 37,804 | 50,088 | 26,239 | ||||||||||||
| Depreciation |
1,766 | 2,695 | 1,969 | 1,417 | ||||||||||||
| Amortization |
23,801 | 24,576 | 27,922 | 29,726 | ||||||||||||
|
|
|
|
|
|
|
|
|
|||||||||
| (Loss) income from operations |
(17,982 | ) | (5,783 | ) | 57,379 | 27,808 | ||||||||||
|
|
|
|
|
|
|
|
|
|||||||||
| Other income (expenses) |
||||||||||||||||
| Interest expense, net |
(6,286 | ) | (8,064 | ) | (7,420 | ) | (6,021 | ) | ||||||||
| Prepayment penalty on debt extinguishments |
— | — | — | (2,500 | ) | |||||||||||
| Other income (expense), net |
45 | (131 | ) | (361 | ) | 396 | ||||||||||
| Foreign currency exchange (loss) gain |
(2,522 | ) | 25,779 | 8,981 | (226 | ) | ||||||||||
|
|
|
|
|
|
|
|
|
|||||||||
| Total other (expense) income |
(8,763 | ) | 17,584 | 1,200 | (8,351 | ) | ||||||||||
|
|
|
|
|
|
|
|
|
|||||||||
| (Loss) income before income tax |
(26,745 | ) | 11,801 | 58,579 | 19,457 | |||||||||||
| Income tax expense (benefit) |
(8,818 | ) | (16,224 | ) | 50,931 | 11,475 | ||||||||||
|
|
|
|
|
|
|
|
|
|||||||||
| Net (loss) income |
$ | (17,927 | ) | $ | 28,025 | $ | 7,648 | $ | 7,982 | |||||||
| Net (loss) income per share: |
||||||||||||||||
| Basic |
$ | (0.53 | ) | $ | 0.88 | $ | 0.24 | $ | 0.25 | |||||||
| Diluted(1) |
$ | (0.53 | ) | $ | 0.86 | $ | 0.24 | $ | 0.25 | |||||||
| Weighted average shares outstanding: |
||||||||||||||||
| Basic |
34,007,505 | 29,965,946 | 29,804,608 | 29,783,294 | ||||||||||||
| Diluted(1) |
34,007,505 | 32,432,919 | 32,194,309 | 32,069,691 | ||||||||||||
17
Table of Contents
| Year Ended December 31, | ||||||||||||||||
| 2016 | 2015 | 2014 | 2013 | |||||||||||||
| (in thousands, except operating data) | ||||||||||||||||
| Consolidated Statement of Cash Flows Data: |
||||||||||||||||
| Net cash provided by (used in): |
||||||||||||||||
| Operating activities |
$ | 10,684 | $ | 4,369 | $ | 51,452 | $ | 16,261 | ||||||||
| Investing activities |
(1,840 | ) | (1,221 | ) | (12,917 | ) | (5,854 | ) | ||||||||
| Financing activities |
(315 | ) | (12,766 | ) | (24,216 | ) | (4,754 | ) | ||||||||
| Other Data: |
||||||||||||||||
| Adjusted EBITDA(2) |
$ | 13,880 | $ | 26,219 | $ | 95,569 | $ | 60,711 | ||||||||
| Free Cash Flow(3) |
$ | 8,844 | $ | 3,148 | $ | 38,535 | $ | 10,407 | ||||||||
| Number of wells completed |
892 | 1,135 | 1,807 | 1,274 | ||||||||||||
| Number of sleeves sold |
25,816 | 24,395 | 37,610 | 21,851 | ||||||||||||
| As of December 31, 2016 | ||||||||
| Actual | As Adjusted(4) | |||||||
| (in thousands) | ||||||||
| Consolidated Balance Sheet Data: |
||||||||
| Cash and cash equivalents |
$ | 18,275 | $ | 72,250 | ||||
| Totals assets |
326,827 | 380,802 | ||||||
| Total debt, net |
89,166 | — | ||||||
| Total liabilities |
149,349 | 60,183 | ||||||
| Total stockholders’ equity |
177,478 | 320,619 | ||||||
| (1) | The diluted weighted average shares outstanding amount excludes the impact of options which would be anti-dilutive. |
| (2) | We report our financial results in accordance with GAAP. To supplement this information, we have included supplemental non-GAAP financial measures in this prospectus, including EBITDA and Adjusted EBITDA. |
EBITDA is defined as net income (loss) before interest expense, net, income tax expense (benefit) and depreciation and amortization.
Adjusted EBITDA is defined as EBITDA adjusted to exclude certain items which we believe are not reflective of ongoing performance or which, in the case of share-based compensation, are non-cash in nature. We were purchased in a leveraged buyout. Given the debt included in our capital structure, and the application of purchase price accounting which resulted in the recognition of our assets at fair value, including substantial amounts of amortizable intangible assets, we recognize high levels of interest expense and non-cash amortization charges on an ongoing basis. We believe that Adjusted EBITDA is an important measure that excludes many of the costs associated with our existing capital structure and excludes costs that management believes do not reflect our ongoing operating performance. Accordingly, Adjusted EBITDA is a key metric that management uses to assess the period-to-period performance of our core business operations. Adjusted EBITDA helps to identify trends in the performance of our core on going operations by excluding the effects related to (i) non-cash items, such as share-based compensation expense, the amortization of intangible assets recorded as a result of the Advent Transaction, described in more detail in the section titled “Management’s Discussion and Analysis of Financial Condition and Results of Operations” and realized and unrealized gains associated with fluctuations in foreign currency exchange rates and (ii) charges that do not relate to our operations, such as interest expense, and income tax provision. We believe that presenting Adjusted EBITDA enables investors to assess our performance from period to period using the same metric utilized by management and to evaluate our performance relative to other companies that are not subject to such factors. Adjusted EBITDA is also calculated in a manner consistent with the terms of the instruments governing our Senior Secured Credit Facilities (and the anticipated terms of our New Senior Secured Credit Facility).
EBITDA and Adjusted EBITDA are not defined under GAAP, are not measures of net income, income from operations or any other performance measure derived in accordance with GAAP, and are subject to important limitations. Our use of the terms EBITDA and Adjusted EBITDA may not be comparable to similarly titled measures of other companies in our industry and are not measures of performance calculated in accordance with GAAP. EBITDA and Adjusted EBITDA have important limitations as analytical tools and you should not consider them in isolation or as substitutes for analysis of our financial performance as reported under GAAP and they should not be considered as alternatives to net (loss) income or any other performance measures derived in accordance with GAAP as measures of operating performance or as alternatives to cash flow from operating activities as measures of our liquidity. For example, EBITDA and Adjusted EBITDA, among other things:
| • | exclude certain tax payments that may represent a reduction in cash available to us; |
| • | do not reflect any cash capital expenditure requirements for the assets being depreciated and amortized that may have to be replaced in the future; |
| • | do not reflect changes in, or cash requirements for, our working capital needs; and |
| • | do not reflect the significant interest expense, or the cash requirements necessary to service interest or principal payments, on our debt. |
18
Table of Contents
Because of these limitations, EBITDA and Adjusted EBITDA should not be considered as measures of discretionary cash available to us to invest in the growth of our business. We compensate for these limitations by relying primarily on our GAAP results and using EBITDA and Adjusted EBITDA only for supplemental purposes.
A reconciliation of net income (loss), the most directly comparable GAAP measure, to EBITDA and from EBITDA to Adjusted EBITDA on a consolidated basis for the periods indicated is as follows:
| Year Ended December 31, | ||||||||||||||||
| 2016 | 2015 | 2014 | 2013 | |||||||||||||
| (in thousands) | ||||||||||||||||
| Net (loss) income |
$ | (17,927 | ) | $ | 28,025 | $ | 7,648 | $ | 7,982 | |||||||
| Income tax expense (benefit) |
(8,818 | ) | (16,224 | ) | 50,931 | 11,475 | ||||||||||
| Interest expense |
6,286 | 8,064 | 7,420 | 6,021 | ||||||||||||
| Depreciation |
1,766 | 2,695 | 1,969 | 1,417 | ||||||||||||
| Amortization |
23,801 | 24,576 | 27,922 | 29,726 | ||||||||||||
|
|
|
|
|
|
|
|
|
|||||||||
| EBITDA |
5,108 | 47,136 | 95,890 | 56,621 | ||||||||||||
| Share based compensation(a) |
1,354 | 1,313 | 1,293 | 1,335 | ||||||||||||
| Restructuring charges(b) |
277 | 430 | — | — | ||||||||||||
| Board fees and expenses(c) |
541 | 520 | 515 | 512 | ||||||||||||
| Professional Fees(d) |
3,079 | 306 | 704 | 1,108 | ||||||||||||
| Dividends treated as compensation(e) |
— | — | 3,036 | — | ||||||||||||
| Unrealized foreign currency (gain) loss(f) |
2,612 | (12,787 | ) | (8,690 | ) | — | ||||||||||
| Realized foreign currency (gain) loss(g) |
(89 | ) | (12,992 | ) | (291 | ) | 226 | |||||||||
| Other(h) |
998 | 2,293 | 3,112 | 909 | ||||||||||||
|
|
|
|
|
|
|
|
|
|||||||||
| Adjusted EBITDA |
$ | 13,880 | $ | 26,219 | $ | 95,569 | $ | 60,711 | ||||||||
|
|
|
|
|
|
|
|
|
|||||||||
| (a) | Represents non-cash compensation charges related to share-based compensation granted to our officers, employees and directors. |
| (b) | Represents severance and other expenses associated with headcount reductions and other cost savings initiated as part of our restructuring initiatives. |
| (c) | Represents Board fees and travel expenses paid to members of our Board, which is an adjustment permitted by the terms of our Senior Secured Credit Facilities. |
| (d) | Represents costs of professional services incurred in connection with our initial public offering, refinancings and the evaluation of proposed acquisitions. |
| (e) | Represents cash payments made to certain holders of (i) options to purchase our common stock and (ii) holders of shares of Exchangeco (as defined below). The cash payment was a result of a dividend paid to our stockholders in August 2014 as described under “Certain Relationships and Related Party Transactions—Dividend.” |
| (f) | Represents unrealized foreign currency translation gains and losses primarily in respect of our indebtedness. |
| (g) | Represents realized foreign currency translation gains and losses with respect to principal and interest payments related to our indebtedness. |
| (h) | Represents the impact of a research and development subsidy that is included in income tax benefit in accordance with GAAP, fees incurred in connection with refinancing our credit facilities, miscellaneous asset writeoffs and other charges and credits. |
| (3) | We define free cash as net cash provided by (used in) operating activities less net cash provided by (used in) investing activities. A reconciliation of net cash provided by (used in) operating activities, the most directly comparable GAAP measure, to free cash flow for the periods indicated is as follows: |
| Year ended December 31, | ||||||||||||||||
| 2016 | 2015 | 2014 | 2013 | |||||||||||||
| (in thousands) | ||||||||||||||||
| Net cash provided by operating activities |
$ | 10,684 | $ | 4,369 | $ | 51,452 | $ | 16,261 | ||||||||
| Net cash (used in) investing activities |
(1,840 | ) | (1,221 | ) | (12,917 | ) | (5,854 | ) | ||||||||
| Free Cash Flow |
$ | 8,844 | $ | 3,148 | $ | 38,535 | $ | 10,407 | ||||||||
| (4) | We present certain information on an as adjusted basis to give effect to the sale by us of 9,500,000 shares of common stock in this offering at an initial public offering price of $16.50 per share, the midpoint of the price range set forth on the cover of this prospectus, less estimated underwriting discounts and commissions and estimated expenses and the application of the net proceeds to be received by us from this offering. |
19
Table of Contents
Investing in our common stock involves a high degree of risk. You should consider carefully the following risks and all of the information in this prospectus, including our historical financial statements and related notes thereto, included elsewhere in this prospectus, before purchasing our common stock. If any of the following risks actually occur, our business, financial condition and results of operations could be materially adversely affected. In that case, the trading price of our common stock could decline, perhaps significantly and you may lose all or part of your investment.
Risks Related to Our Business and the Oil and Natural Gas Industry
Our business depends on the oil and natural gas industry and particularly on the level of exploration and production activity within Canada and the United States, and the ongoing decline in prices for oil and natural gas have had, and may continue to have, a material adverse effect on our business, financial condition and results of operations.
Demand for our products and services depends substantially on the level of expenditures by companies in the oil and natural gas industry. The significant decline in oil and natural gas prices during 2015 has continued during the first part of 2016. The low commodity price environment has caused a reduction in the drilling, completion and other production activities of most of our customers and their spending on our products and services. Although the prices for oil have recently improved, this overall trend with respect to our customers’ activities and spending continued in 2016. The reduction in demand from our customers has reduced the prices we can charge our customers for our products and services. These conditions have had and may continue to have a material adverse effect on our business, financial condition and results of operations, and it is difficult to predict how long the current low commodity price environment will continue.
Many factors over which we have no control affect the supply of and demand for, and our customers’ willingness to explore, develop and produce oil and natural gas, and therefore, influence demand levels and prices for our products and services, including:
| • | the domestic and foreign supply of and demand for oil and natural gas; |
| • | the level of prices, and expectations about future prices, of oil and natural gas; |
| • | the level of global oil and natural gas exploration and production; |
| • | the cost of exploring for, developing, producing and delivering oil and natural gas; |
| • | the expected decline rates of current production; |
| • | the price and quantity of foreign imports; |
| • | political and economic conditions in oil producing countries, including the Middle East, Africa, South America and Russia; |
| • | the ability of members of the Organization of Petroleum Exporting Countries to agree to and maintain oil price and production controls; |
| • | speculative trading in crude oil and natural gas derivative contracts; |
| • | the level of consumer product demand; |
| • | the discovery rates of new oil and natural gas reserves; |
| • | contractions in the credit market; |
| • | the strength or weakness of the U.S. dollar; |
| • | available pipeline and other transportation capacity; |
| • | the levels of oil and natural gas storage; |
20
Table of Contents
| • | weather conditions and other natural disasters; |
| • | political instability in oil and natural gas producing countries; |
| • | domestic and foreign tax policy; |
| • | domestic and foreign governmental approvals and regulatory requirements and conditions; |
| • | the continued threat of terrorism and the impact of military and other action, including military action in the Middle East; |
| • | technical advances affecting energy demand, generation and consumption; |
| • | the proximity and capacity of oil and natural gas pipelines and other transportation facilities; |
| • | alternative fuel requirements or technological advances and the demand and availability of alternative fuel sources; |
| • | fuel conservation measures; |
| • | the ability of oil and natural gas producers to raise equity capital and debt financing; |
| • | merger and divestiture activity among oil and natural gas producers; and |
| • | overall domestic and global economic conditions. |
These factors and the volatility of the energy markets make it difficult to predict future oil and natural gas price movements with any certainty or how long the current low commodity price environment will continue. Any of the above factors could impact the level of oil and natural gas exploration and production activity and could have a material adverse effect on our business, financial condition and results of operations. Further, should the low commodity price environment continue or worsen, we could encounter difficulties such as an inability to access needed capital on attractive terms or at all, the incurrence of asset impairment charges, an inability to meet the financial ratios contained in our debt agreements, a need to reduce our capital spending and other similar impacts any of which could have a material adverse effect on our business, financial condition and results of operations.
The cyclicality of the oil and natural gas industry may cause our results of operations to fluctuate.
We derive our revenues from companies in the oil and natural gas exploration and production industry, a historically cyclical industry with levels of activity that are significantly affected by the levels and volatility of oil and natural gas prices. Prices for oil and natural gas historically have been extremely volatile and are expected to continue to be volatile. During the past six years, the posted WTI price for oil has ranged from a low of $26.21 per barrel, or Bbl, in February 2016 to a high of $113.93 per Bbl in April 2011. Over the same period, the Henry Hub spot market price of natural gas has ranged from a low of $1.49 per MMBtu in March 2016 to a high of $7.92 per MMBtu in March 2014. During 2016, WTI prices ranged from $26.21 to $54.06 per Bbl and the Henry Hub spot market price of natural gas ranged from $1.49 to $3.80 per MMBtu. On February 11, 2016, the WTI posted price for crude oil was $26.21 per Bbl and the Henry Hub spot market price of natural gas was $2.12 per MMBtu, representing decreases of approximately 57% and 36%, respectively, from the high of $61.43 per Bbl of oil and $3.29 per MMBtu for natural gas during 2015. We have, and may in the future, experience significant fluctuations in operating results as a result of the reactions of our customers to changes in oil and natural gas prices. For example, prolonged low commodity prices experienced by the oil and natural gas industry during 2015 and 2016, combined with adverse changes in the capital and credit markets, caused many E&P companies to reduce their capital budgets and drilling activity. This resulted in a significant decline in demand for oilfield services and adversely impacted the prices oilfield services companies could charge for their services. We have master services agreements (“MSAs”) with most of our customers which have no minimum purchase requirements. As a result, most of our customers are not obligated to buy our products or utilize our services for an extended period or at all.
21
Table of Contents
The recent low commodity price environment has negatively impacted oil and natural gas E&P companies and, in some cases, impaired their ability to timely pay for products or services provided or resulted in their insolvency or bankruptcy, any of which exposes us to credit risk of our oil and natural gas exploration and production customers.
In weak economic and commodity price environments, we may experience increased difficulties, delays or failures in collecting outstanding receivables from our customers, due to, among other reasons, a reduction in their cash flow from operations, their inability to access the credit markets and, in certain cases, their insolvencies. Such increases in collection issues could have a material adverse effect on our business, financial condition and results of operations.
To the extent one or more of our key customers commences bankruptcy proceedings, our contracts with these customers may be subject to rejection under applicable provisions of the United States Bankruptcy Code, or may be renegotiated. Further, during any such bankruptcy proceeding, prior to assumption, rejection or renegotiation of such contracts, the bankruptcy court may temporarily authorize the payment of value for our services less than contractually required, which could also have a material adverse effect on our business, financial condition and results of operations.
A single customer constituted 26% of our revenues in 2016 and 31% of our revenues in 2015 and the loss of that customer or any other of our significant customers, or their failure to pay the amounts they owe us, could cause our revenue to decline substantially.
Our largest customer is Crescent Point which accounted for approximately 26% and 31% of our revenue for the years ended December 31, 2016 and 2015, respectively. Additionally, our top five customers accounted for approximately 49% and 44% of our revenue for the years ended December 31, 2016 and 2015, respectively. It is likely that we will continue to derive a significant portion of our revenue from these customers in the near future. If any of these customers decided not to continue to use our products and services, our revenue would decline, which could have a material adverse effect on our business, financial condition and results of operations. In addition, we are subject to credit risk due to the concentration of our customer base. Any nonperformance by these customers, including their failure to pay the amounts they owe us, either as a result of changes in general financial and economic conditions, conditions in the oil and natural gas industry or otherwise, could have a material adverse effect on our business, financial condition and results of operations.
We may not be able to successfully implement our strategy of increasing sales of our products and services for use in basins located in the United States.
A key component of our growth strategy is to increase our market share in the United States. Our products and services enable pinpoint stimulation of an oil or natural gas well. Currently, most E&P companies in the United States rely on traditional well completion techniques and do not utilize pinpoint stimulation. We may not be successful in convincing potential customers of the benefits of our technologies relative to traditional well completion techniques. If we are unable to convince potential customers in the United States of the benefits of our pinpoint stimulation, we will not be able to execute on our strategy to increase the level of sales of our products and services in the United States, which could harm our growth prospects. Additionally, the sales of our products and services depend in large part on the perception of pinpoint stimulation in the oil and natural gas industry. Events that would harm the perception of pinpoint stimulation, including unfavorable industry reports or poor well performance for wells that were completed using pinpoint stimulation could impact our ability to grow our U.S. sales, which could harm our growth prospects.
Competition within our industry may adversely affect our ability to market our services.
The markets in which we operate are generally highly competitive. The principal competitive factors in our market are technology, service quality, safety track record and price. We compete with large national and multi-national companies that have substantially longer operating histories, greater financial, technical and other resources and greater name recognition than we do. Several of our competitors provide a broader array of
22
Table of Contents
services and have a stronger presence in more geographic markets. In addition, we compete with several smaller companies capable of competing effectively on a regional or local basis. Our competitors may be able to respond more quickly to new or emerging technologies, products and services and changes in customer requirements. In certain circumstances, work is awarded on a bid basis, which further increases competition based on price. Pricing is often the primary factor in determining which qualified contractor is awarded the work. The competitive environment may be further intensified by mergers and acquisitions among oil and natural gas companies or other events that have the effect of reducing the number of available customers. As a result of competition, we may lose market share or be unable to maintain or increase prices for our present services or to acquire additional business opportunities, which could have a material adverse effect on our business, financial condition and results of operations.
Advancements in drilling and well completion technologies could have a material adverse effect on our business, financial condition, results of operations and cash flows.
Our industry is characterized by rapid and significant technological advancements and introductions of new products and services using new technologies. As new well completion technologies develop, we may be placed at a competitive disadvantage, and competitive pressure may force us to implement new technologies at a substantial cost. We may not be able to successfully acquire or use new technologies. New technologies, services or standards, including improvements to existing competing technologies, could render our technologies, products or services obsolete, which could have a material adverse effect on our business, financial condition and results of operations. In addition, the development of new processes to replace hydraulic fracturing altogether or that replace our technologies, could cause a decline in the demand for the products and services that we provide and could result in a material adverse effect on our business, financial condition and results of operations.
We often have long sales cycles, which can result in significant time between initial contact with a prospective customer and sales of our products and services to that customer, making it difficult to project when, if at all, we will obtain new customers and when we will generate revenue from those customers.
Our sales cycle, from initial contact to sales of our products and services to a customer can take significant time. Our sales efforts involve educating our customers about the use, technical capabilities and benefits of our completion technologies. Some of our customers undertake an evaluation process that frequently involves not only our technology but also the offerings of our competitors. As a result, it is difficult to predict when we will obtain new customers and begin generating revenue from these new customers. As a result, we may not be able to add customers, or generate revenue, as quickly as we may expect, which could harm our growth prospects.
Our success depends on our ability to develop and implement new technologies, products and services.
Our success depends on the ongoing development and implementation of new product designs and improvements, and on our ability to protect and maintain critical intellectual property assets related to these developments. If we are not able to obtain patent or other intellectual property protection of our technology, we may not be able to recoup development costs or fully exploit systems, services and technologies in a manner that allows us to meet evolving industry requirements at prices acceptable to our customers. In addition, some of our competitors are large national and multinational companies that may be able to devote greater financial, technical, manufacturing and marketing resources to research and development of new systems, services and technologies than we are able to do.
Investments in new technologies involve uncertainties and risk. Commercial success depends on many factors, including the levels of innovation, the development costs and the availability of capital resources to fund those costs, the levels of competition from others developing similar or other competing technologies, our ability to obtain or maintain government permits or certifications, the effectiveness of production, distribution and marketing efforts, and the costs to customers to deploy and provide support for the new technologies. We may not achieve significant revenues from new product and service investments for a number of years, if at all, which could have a material adverse effect on our business, financial condition and results of operations.
23
Table of Contents
Most of our revenue generated is denominated in the Canadian dollar and could be negatively impacted by currency fluctuations.
Because approximately 71% of our revenue for the year ended December 31, 2016 was generated in Canada, we could be materially affected by currency fluctuations. Changes in currency exchange rates, particularly with respect to the Canadian dollar, could have a material adverse effect on our results of operations or financial position. As we have a trade accounts receivable balance in Canadian dollars (“CAD”) of $26.9 million CAD as of December 31, 2016 a 10% increase in the strength of the Canadian dollar versus the U.S. dollar would result in an increase in pre-tax income of approximately $2.0 million. Conversely, a corresponding decrease in the strength of the Canadian dollar would have resulted in a comparable decrease in pre-tax income. We have not hedged our exposure to changes in foreign currency exchange rates and, as a result, could incur significant and unanticipated translation gains and losses.
Our operations may be limited or disrupted in certain parts of the continental United States and Canada during severe weather conditions, which could have a material adverse effect on our business, financial condition and results of operations.
We provide products and services to E&P companies that operate in basins throughout the continental United States and Canada. We serve these markets through our facilities and service centers located in Texas and Alberta, Canada. A substantial portion of our revenue is generated from our operations in geographies where weather conditions may be severe, particularly during winter and spring months. Repercussions of severe weather conditions may include:
| • | curtailment of drilling and completion activity; |
| • | weather-related damage to equipment resulting in suspension of operations; |
| • | weather-related damage to our facilities; |
| • | inability to deliver equipment and materials to jobsites in accordance with contract schedules; and |
| • | loss of productivity. |
Many municipalities impose bans or other restrictions on the use of roads and highways, which include weight restrictions on the paved roads that lead to our jobsites due to the muddy conditions caused by spring thaws. This can limit our access to these jobsites and our ability to service wells in these areas. These constraints and the resulting shortages or high costs could delay our operations and materially increase our operating and capital costs in those regions. Weather conditions may also affect the price of crude oil and natural gas, and related demand for our services. Any of these factors could have a material adverse effect on our business, financial condition and results of operations.
Hydraulic fracturing is substantially dependent on the availability of water. Restrictions on the ability of our customers to obtain water may have a material adverse effect on our business, financial condition and results of operations.
Water is an essential component of deep shale oil and natural gas production during both the drilling and hydraulic fracturing processes. Over the past several years, certain of the areas in which we sell our products and services have experienced extreme drought conditions and competition for water in such shales is growing. As a result of this severe drought, some local water districts have begun restricting the use of water subject to their jurisdiction for hydraulic fracturing to protect local water supply. The inability of our customers to obtain water to use in their operations from local sources or to effectively utilize flowback water could impact demand for our products and services, which could have a material adverse effect on our business, financial condition and results of operations.
24
Table of Contents
The growth of our business through acquisitions or strategic partnerships exposes us to various risks, including identifying suitable opportunities and integrating businesses, assets and personnel.
We expect to pursue future acquisitions in order to expand and diversify our business. We may also form strategic partnerships with third parties that we believe will complement or augment our existing business. We may not be able to identify any potential acquisition or strategic partnership candidates, consummate any acquisitions or enter into any strategic partnerships and any future acquisitions or strategic partnerships may not be successfully integrated or may not be advantageous to us. In addition, we may not have or be able to obtain sufficient capital resources to complete any acquisitions. Entities we acquire may not achieve the revenue and earnings we anticipate or their liabilities may exceed our expectations. We could face integration issues pertaining to the internal controls and operational functions of the acquired companies and we also could fail to realize cost efficiencies or synergies that we anticipated when selecting our acquisition candidates. Client dissatisfaction or performance problems with a particular acquired entity or resulting from a strategic partnership could have a material adverse effect on our reputation as a whole. We may be unable to profitably manage any acquired entities, or we may fail to integrate them successfully without incurring substantial expenses, delays or other problems. We may not achieve the anticipated benefits from our acquisitions or any of the strategic partnerships we form. In addition, business acquisitions and strategic partnerships involve a number of risks that could affect our business, financial condition and results of operations, including but not limited to:
| • | our ability to integrate operational, accounting and technology policies, processes and systems and the implementation of those policies and procedures; |
| • | our ability to integrate personnel and human resources systems as well as the cultures of each of the acquired businesses; |
| • | our ability to implement our business plan for the acquired business; |
| • | transition of operations, users and clients to our existing platforms or the integration of data, systems and technology platforms with ours; |
| • | compliance with regulatory requirements and avoiding potential conflicts of interest in markets that we serve; |
| • | diversion of management’s attention and other resources; |
| • | our ability to retain or replace key personnel; |
| • | our ability to maintain relationships with the customers of the acquired business or a strategic partner and further develop the acquired business or the business of our strategic partner; |
| • | our ability to cross-sell our products and services of the acquired businesses or strategic partners to our respective clients; |
| • | entry into unfamiliar markets; |
| • | assumption of unanticipated legal or financial liabilities and/or negative publicity related to prior acts by the acquired entity; |
| • | litigation or other claims in connection with the acquired company, including claims from terminated employees, clients, former stockholders or third parties; |
| • | misuse of intellectual property by our strategic partners; |
| • | disagreements with strategic partners or a misalignment of incentives within any strategic partnership; |
| • | becoming subject to increased regulation or a result of an acquisition; |
| • | becoming significantly leveraged as a result of incurring debt to finance an acquisition; |
| • | unanticipated operating, accounting or management difficulties in connection with the acquired entities; and |
25
Table of Contents
| • | impairment of acquired intangible assets, including goodwill, and dilution to our earnings per share. |
If we fail to successfully integrate the businesses that we acquire or strategic partnerships that we enter into, we may not realize any of the benefits we anticipate in connection with the acquisitions or partnerships, which could have a material adverse effect on our business, financial condition and results of operations.
If we are unable to accurately predict customer demand or if customers cancel their orders on short notice, we may hold excess or obsolete inventory, which would reduce gross margins. Conversely, insufficient inventory would result in lost revenue opportunities and potentially in loss of market share and damaged customer relationships.
Customers can generally cancel or defer purchase orders on short notice without incurring a significant penalty. As a result, we cannot accurately predict what or how many products such customers will need in the future. Anticipating demand is difficult because our customers face unpredictable demand for their own products and are increasingly focused on cash preservation and tighter inventory management.
Orders are placed with our suppliers based on forecasts of customer demand and, in some instances, we may establish buffer inventories to accommodate anticipated demand. Our forecasts of customer demand are based on multiple assumptions, each of which may introduce errors into the estimates. If we overestimate customer demand, we may allocate resources to the purchase of material or manufactured products that we may not be able to sell when we expect to, if at all. As a result, we would hold excess or obsolete inventory, which would reduce gross margin and adversely affect financial results. Conversely, if we underestimate customer demand or if insufficient manufacturing capacity is available, we would miss revenue opportunities and potentially lose market share and damage our customer relationships. In addition, any future significant cancellations or deferrals of product orders or the return of previously sold products could materially and adversely affect profit margins, increase product obsolescence and restrict our ability to fund our operations.
Our products are used in operations that are subject to potential hazards inherent in the oil and natural gas industry, including claims for personal injury and property damage, and, as a result, we are exposed to potential liabilities that may affect our financial condition and reputation.
Our products are used in potentially hazardous drilling, completion and production applications in the oil and natural gas industry where an accident or a failure of a product can potentially have catastrophic consequences. Risks inherent to these applications, such as equipment malfunctions and failures, equipment misuse and defects, explosions, blowouts and uncontrollable flows of oil, natural gas or well fluids and natural disasters can cause personal injury, loss of life, suspension of operations, damage to formations, damage to facilities, business interruption and damage to or destruction of property, surface water and drinking water resources, equipment and the environment. If our products or services fail to meet specifications or are involved in accidents or failures, we could face warranty, contract or other litigation claims, which could expose us to substantial liability for personal injury, wrongful death, property damage, pollution and other environmental damages. We operate with most of our customers under MSAs. We endeavor to allocate potential liabilities and risks between the parties in the MSAs. Generally, under our MSAs, we assume responsibility for, including control and removal of, pollution or contamination which originates above surface and originates from our equipment or services. Our customer assumes responsibility for, including control and removal of, all other pollution or contamination which may occur during operations, including that which may result from seepage or any other uncontrolled flow of drilling fluids. We may have liability in such cases if we are negligent or commit willful acts.
Generally, our customers also agree to indemnify us against claims arising from their employees’ personal injury or death to the extent that, in the case of our hydraulic fracturing operations, their employees are injured or their properties are damaged by such operations, unless resulting from our gross negligence or willful misconduct. Similarly, we generally agree to indemnify our customers for liabilities arising from personal injury
26
Table of Contents
to or death of any of our employees, unless resulting from gross negligence or willful misconduct of the customer. In addition, our customers generally agree to indemnify us for loss or destruction of customer-owned property or equipment and in turn, we agree to indemnify our customers for loss or destruction of property or equipment we own. Losses due to catastrophic events, such as blowouts, are generally the responsibility of the customer. However, despite this general allocation of risk, we might not succeed in enforcing such contractual allocation, might incur an unforeseen liability falling outside the scope of such allocation or may be required to enter into an MSA with terms that vary from the above allocations of risk. As a result, we may incur substantial losses which could have a material adverse effect on our business, financial condition and results of operations.
In addition, the frequency and severity of such incidents will affect operating costs, insurability and relationships with customers, employees and regulators. In particular, our customers may elect not to purchase our services if they view our safety record as unacceptable, which could cause us to lose customers and substantial revenues. In addition, these risks may be greater for us because we may acquire companies that have not allocated significant resources and management focus to safety and have a poor safety record requiring rehabilitative efforts during the integration process and we may incur liabilities for losses before such rehabilitation occurs.
Losses and liabilities from uninsured or underinsured drilling and operating activities could have a material adverse effect on our financial condition and operations.
Our insurance policies may not be adequate to cover all liabilities. Further, insurance may not be generally available in the future or, if available, insurance premiums may make such insurance commercially unjustifiable. Moreover, even if we are successful in defending a claim, it could be time-consuming and costly to defend. The operational insurance coverage we maintain for our business may not fully insure us against all risks, either because insurance is not available or because of the high premium costs relative to perceived risk. Further, any insurance obtained by us may not be adequate to cover any losses or liabilities and this insurance may not continue to be available at all or on terms which are acceptable to us. Insurance rates have in the past been subject to wide fluctuation and changes in coverage could result in less coverage, increases in cost or higher deductibles and retentions. Liabilities for which we are not insured, or which exceed the policy limits of our applicable insurance, could have a material adverse effect on our business, financial condition and results of operations.
Our competitors may infringe upon, misappropriate, violate or challenge the validity or enforceability of our intellectual property and we may not be able to adequately protect or enforce our intellectual property rights in the future.
We currently hold multiple U.S. and international patents and have multiple pending patent applications for products and processes. Patent rights give the owner of a patent the right to exclude third parties from making, using, selling, and offering for sale the inventions claimed in the patents in the applicable country. Patent rights do not necessarily grant the owner of a patent the right to practice the invention claimed in a patent, but merely the right to exclude others from practicing the invention claimed in the patent. It may be possible for a third-party to design around our patents. Furthermore, patent rights have strict territorial limits. We may not be able to enforce our patents against infringement occurring in “non-covered” territories. Also, we do not have patents in every jurisdiction in which we conduct business and our patent portfolio will not protect all aspects of our business and may relate to obsolete or unusual methods, which would not prevent third parties from entering the same market.
In addition, by customarily entering into employment, confidentiality and/or license agreements with our employees, customers and potential customers and suppliers, we attempt to limit access to and distribution of our technology. Our rights in our confidential information, trade secrets, and confidential know-how will not prevent third parties from independently developing similar information. Publicly available information (e.g. information in expired issued patents, published patent applications, and scientific literature) can also be used by third parties to independently develop technology. This independently developed technology may be equivalent or superior to our proprietary technology.
27
Table of Contents
Confidential information shared with employees, customers and potential customers and suppliers may be used by those parties in a manner inconsistent with their employment, confidentiality and/or license agreements and we may not be able to adequately protect against or stop such behavior. We may not be able to determine if competitive technology offered by third parties was independently developed or resulted from breach of our agreements. When we do become aware of breaches, we may become involved in legal proceedings from time to time to protect our legal interests and enforce such agreements.
We may be adversely affected by disputes regarding intellectual property rights and the value of our intellectual property rights is uncertain.
As discussed above, we may become involved in legal proceedings from time to time to protect and enforce our intellectual property rights. Third parties from time to time may initiate litigation against us by asserting that the conduct of our business infringes, misappropriates or otherwise violates intellectual property rights. We may not prevail in any such legal proceedings related to such claims, and our products and services may be found to infringe, impair, misappropriate, dilute or otherwise violate the intellectual property rights of others. If we are sued for infringement and lose, we could be required to pay substantial damages and/or be enjoined from using or selling the infringing products or technology. Any legal proceeding concerning intellectual property could be protracted and costly and is inherently unpredictable and could have a material adverse effect on our business, financial condition and results of operation, regardless of its outcome.
Further, our intellectual property rights may not have the value that management believes them to have and such value may change over time as we and others develop new product designs and improvements.
The adoption of climate change legislation or regulations restricting emissions of GHGs could result in increased operating costs and reduced demand for oil and natural gas.
In recent years, federal, state and local governments have taken steps to reduce emissions of GHGs. The Environmental Protection Agency (“EPA”) has finalized a series of GHG monitoring, reporting and emissions control rules for the oil and natural gas industry. For example, in October 2015, the EPA finalized rules adding new sources to the scope of the GHG monitoring and reporting rule. These new sources include gathering and boosting facilities as well as completions and workovers of hydraulically fractured wells. More recently, in June 2016, the EPA published final rules establishing new and more stringent methane and volatile organic compounds (“VOCs”) emissions control requirements for oil and natural gas development and production operations.
While Congress has from time to time considered legislation to reduce emissions of GHGs, there has not been significant activity in the form of adopted legislation to reduce GHG emissions at the federal level in recent years. In the absence of federal climate legislation, a number of state and regional efforts have emerged that are aimed at tracking or reducing GHG emissions by means of cap and trade programs. In addition, in December 2015, the United States joined the international community at the 21st Conference of the Parties of the United Nations Framework Convention on Climate Change in Paris, France. The resulting Paris Agreement calls for the parties to undertake “ambitious efforts” to limit the average global temperature, and to conserve and enhance sinks and reservoirs of GHGs. The Paris Agreement, which entered into force on November 4, 2016, establishes a framework for the parties to cooperate and report actions to reduce GHG emissions.
Restrictions on emissions of methane or carbon dioxide that may be imposed could adversely affect the oil and natural gas industry by reducing demand for hydrocarbons and by making it more expensive to develop and produce hydrocarbons, either of which could have a material adverse effect on future demand for our products and services. At this time, it is not possible to accurately estimate how potential future laws or regulations addressing GHG emissions would impact our or our customers’ business.
In addition, claims have been made against certain energy companies alleging that GHG emissions from oil and natural gas operations constitute a public nuisance under federal and/or state common law. As a result,
28
Table of Contents
private individuals may seek to enforce environmental laws and regulations against certain energy companies and could allege personal injury or property damages. While our business is not a party to any such litigation, we could be named in actions making similar allegations. An unfavorable ruling in any such case could significantly impact our or our customers’ operations and could have a material adverse effect on our business, financial condition and results of operations.
Moreover, climate change may cause more extreme weather conditions such as more intense hurricanes, thunderstorms, tornadoes and snow or ice storms, as well as rising sea levels and increased volatility in seasonal temperatures. Extreme weather conditions can interfere with our or our customers’ operations and increase our costs, and damage resulting from extreme weather may not be fully insured. However, at this time, we are unable to determine the extent to which climate change may lead to increased storm or weather hazards affecting our operations.
Federal and state legislative and regulatory initiatives relating to hydraulic fracturing could result in increased costs and additional operating restrictions or delays on our customers which could in turn decrease the demand for our products and services.
Our business is dependent on the ability of our customers to conduct hydraulic fracturing and horizontal drilling activities. Hydraulic fracturing is an important common practice that is used to stimulate production of hydrocarbons, particularly natural gas, from tight formations, including shales. The process, which involves the injection of water, sand and other proppants under pressure into formations to fracture the surrounding rock and stimulate production, is typically regulated by state oil and natural gas commissions. However, federal agencies have asserted regulatory authority over certain aspects of the process. In March 2015, the Bureau of Land Management (the “BLM”) published a final rule that established new or more stringent standards relating to hydraulic fracturing on federal and American Indian lands. A Wyoming federal judge struck down this final rule in June 2016, finding that the BLM lacked authority to promulgate the rule. That decision is currently being appealed by the federal government.
There are certain governmental reviews either completed, underway, or being proposed that focus on the environmental aspects of hydraulic fracturing practices. These completed, ongoing, or proposed studies, depending on their degree of pursuit and whether any meaningful results are obtained, could spur initiatives to further regulate hydraulic fracturing. For example, in December 2016, the EPA released a final report assessing the potential impacts of hydraulic fracturing on drinking water resources. In this report, the EPA found scientific evidence that hydraulic fracturing activities can impact drinking water resources under some circumstances. Other governmental agencies, including the U.S. Department of Energy, the U.S. Geological Survey and the U.S. Government Accountability Office, have evaluated or are evaluating various other aspects of hydraulic fracturing. State and federal regulatory agencies recently have focused on a possible connection between the operation of injection wells used for oil and natural gas waste disposal and seismic activity. Similar concerns have been raised that hydraulic fracturing may also contribute to seismic activity. When caused by human activity, such events are called induced seismicity. Regulatory agencies at all levels are continuing to study the possible linkage between oil and natural gas activity and induced seismicity. These ongoing or proposed studies could spur initiatives to further regulate hydraulic fracturing, and could ultimately make it more difficult or costly to perform fracturing and increase the costs of compliance and doing business for our customers. In addition, in response to concerns regarding induced seismicity, regulators in some states have from time to time, developed and implemented plans directing certain wells where seismic incidents have occurred to restrict or suspend disposal well operations. Such actions to restrict or suspend disposal well operations could make it more difficult or costly for our customers to perform fracturing.
Various state and local-level initiatives in regions with substantial shale resources have been or may be proposed or implemented to further regulate hydraulic fracturing practices, limit water withdrawals and water use, require disclosure of fracturing fluid constituents, restrict which additives may be used, or implement temporary or permanent bans on hydraulic fracturing. For instance, the State of New York elected in 2015 to
29
Table of Contents
prohibit high volume hydraulic fracturing altogether. Any increased regulation of hydraulic fracturing could reduce our customers’ demand for our products and services and have a material adverse effect on our business, financial condition and results of operations.
At this time, it is not possible to estimate the impact on our business of newly enacted or potential federal, state or local laws governing hydraulic fracturing.
Our operations and our customers’ operations are subject to a variety of governmental laws and regulations that may increase our costs, limit the demand for our products and services or restrict our operations.
Our business and our customers’ businesses may be significantly affected by:
| • | federal, state and local and non-U.S. laws and other regulations relating to oilfield operations, worker safety and protection of the environment; |
| • | changes in these laws and regulations; and |
| • | the level of enforcement of these laws and regulations. |
If we fail to comply with safety regulations or maintain an acceptable level of safety at our facilities we may incur fines, penalties or other liabilities, or may be held criminally liable. We may incur additional costs to upgrade equipment or conduct additional training, or otherwise incur costs in connection with compliance with safety regulations. Failure to maintain safe operations or achieve certain safety performance metrics could disqualify us from doing business with certain customers, particularly major oil companies.
In addition, we depend on the demand for our products and services from the oil and natural gas industry. This demand is affected by changing taxes, price controls and other laws and regulations relating to the oil and natural gas industry in general. For example, the adoption of laws and regulations curtailing exploration and development drilling for oil and natural gas for economic or other policy reasons could adversely affect our operations by limiting demand for our products. In addition, some non-U.S. countries may adopt regulations or practices that give advantage to indigenous oil companies in bidding for oil leases, or require indigenous companies to perform oilfield services currently supplied by international service companies. To the extent that such companies are not our customers, or we are unable to develop relationships with them, our business may suffer. We cannot determine the extent to which our future operations and earnings may be affected by new legislation, new regulations or changes in existing regulations.
Because of our non-U.S. operations and sales, we are subject to changes in regional, political or economic conditions, and non-U.S. laws and policies, including taxes, trade protection measures, and changes in regulatory requirements governing the operations of companies in non-U.S. countries. We are also subject to changes in non-U.S. laws and regulations that may encourage or require hiring of local contractors or require non-U.S. contractors to employ citizens of, or purchase supplies from, a particular jurisdiction. If we fail to comply with any applicable law or regulation, it could have a material adverse affect on our business, financial condition and results of operations.
Loss of our information and computer systems could adversely affect our business.
We are heavily dependent on our information systems and computer based programs, including our engineering information and accounting data. If any of such programs or systems were to fail or create erroneous information in our hardware or software network infrastructure, whether due to cyber-attack or otherwise, possible consequences include our loss of communication links and inability to automatically process commercial transactions or engage in similar automated or computerized business activities. Any such consequence could have a material adverse effect on our business, financial condition and results of operations.
30
Table of Contents
We are subject to cyber security risks. A cyber incident could occur and result in information theft, data corruption, operational disruption and/or financial loss.
The oil and natural gas industry has become increasingly dependent on digital technologies to conduct certain processing activities. For example, we depend on digital technologies to perform many of our services and process and record financial and operating data. At the same time, cyber incidents, including deliberate attacks or unintentional events, have increased. The United States government has issued public warnings that indicate that energy assets might be specific targets of cyber security threats. Our technologies, systems and networks, and those of our customers, vendors, suppliers and other business partners, may become the target of cyberattacks or information security breaches that could result in the unauthorized release, gathering, monitoring, misuse, loss or destruction of proprietary and other information, or other disruption of its business operations. In addition, certain cyber incidents, such as surveillance, may remain undetected for an extended period. Our systems and insurance coverage for protecting against cyber security risks may not be sufficient. As cyber incidents continue to evolve, we may be required to expend additional resources to continue to modify or enhance our protective measures or to investigate and remediate any vulnerability to cyber incidents. Our insurance coverage for cyberattacks may not be sufficient to cover all the losses we may experience as a result of such cyberattacks.
Our business operations in countries outside of the United States are subject to a number of U.S. federal laws and regulations, including restrictions imposed by the Foreign Corrupt Practices Act as well as trade sanctions administered by the Office of Foreign Assets Control (“OFAC”) and the Commerce Department.
Local laws and customs in many countries differ significantly from those in the United States. In many countries, particularly in those with developing economies, it is common to engage in business practices that are prohibited by U.S. regulations applicable to us. The United States Foreign Corrupt Practices Act (“FCPA”) and similar anti-bribery laws in other jurisdictions, including the UK Bribery Act 2010, prohibit corporations and individuals, including us and our employees, from engaging in certain activities to obtain or retain business or to influence a person working in an official capacity. We are responsible for any violations by our employees, contractors and agents, whether based within or outside of the United States, for violations of the FCPA. We may also be held responsible for any violations by an acquired company that occur prior to an acquisition, or subsequent to the acquisition but before we are able to institute our compliance procedures. In addition, our non-U.S. competitors that are not subject to the FCPA or similar laws may be able to secure business or other preferential treatment in such countries by means that such laws prohibit with respect to us. A violation of any of these laws, even if prohibited by our policies, could have a material adverse effect on our business, financial condition or results of operation. Actual or alleged violations could damage our reputation, be expensive to defend, and impair our ability to do business.
Compliance with U.S. regulations on trade sanctions and embargoes administered by OFAC also poses a risk to us. We cannot provide products or services to certain countries subject to U.S. trade sanctions. Furthermore, the laws and regulations concerning import activity, export recordkeeping and reporting, export control and economic sanctions are complex and constantly changing. Any failure to comply with applicable legal and regulatory trading obligations could result in criminal and civil penalties and sanctions, such as fines, imprisonment, debarment from governmental contracts, seizure of shipments and loss of import and export privileges.
We may have difficulty managing growth in our business, which could have a material adverse effect on our business, financial condition and results of operations.
Any significant growth, if achieved, could place a significant strain on our financial, technical, operational and management resources. As we expand the scope of our activities and our geographic coverage through organic growth, acquisitions and strategic partnerships, there will be additional demands on our financial, technical, operational and management resources. The failure to continue to upgrade our technical, administrative, operating and financial control systems or the occurrences of unexpected expansion difficulties,
31
Table of Contents
including the failure to recruit and retain experienced managers, engineers and other professionals, could have a material adverse effect on our business, financial condition and results of operations.
Our success may depend on the continued service and availability of key personnel.
Our success and future growth is dependent upon the ability of our executive officers, senior managers and other key personnel to operate and manage our business and execute on our growth strategies successfully. We may be unable to continue to attract and retain our executive officers, senior managers or other key personnel. We may incur increased expenses in connection with the hiring, promotion, retention or replacement of any of these individuals. The loss of the services of any of our key personnel could have a material adverse effect our business, financial condition and results of operations.
We may be unable to attract and retain skilled and technically knowledgeable employees, which could adversely affect our business.
Our success and future growth is dependent upon attracting and retaining highly skilled professionals and other technical personnel. A number of our employees are highly skilled engineers, geologists and highly trained technicians, and our failure to continue to attract and retain such individuals could adversely affect our ability to compete in the oilfield services industry. We may confront significant and potentially adverse competition for these skilled and technically knowledgeable personnel, particularly during periods of increased demand for oil and natural gas. Additionally, at times there may be a shortage of skilled and technical personnel available in the market, potentially compounding the difficulty of attracting and retaining these employees. If we are unable to recruit or retain sufficient skilled and technical personnel it could have a material adverse effect on our business, financial condition and results of operations.
Unionization efforts could increase our costs or limit our flexibility.
Presently, none of our employees work under collective bargaining agreements. Unionization efforts have been made from time to time within our industry, to varying degrees of success. Any such unionization could increase our costs or limit our flexibility, which could have a material adverse effect on our business, financial condition and results of operations.
Restrictions on drilling activities intended to protect certain species of wildlife may adversely affect the ability of our customers to conduct drilling activities in some of the areas where we operate.
Oil and natural gas operations in our operating areas can be adversely affected by seasonal or permanent restrictions on drilling activities designed to protect various wildlife, which may limit the ability of our customers to operate in protected areas. Permanent restrictions imposed to protect endangered species could prohibit drilling in certain areas or require the implementation of expensive mitigation measures. Additionally, the designation of previously unprotected species as threatened or endangered in areas where we operate could result in increased costs arising from species protection measures. Restrictions on the oil and natural gas operations of our customers to protect wildlife could reduce demand for our products and services, which could have a material adverse effect on our business, financial condition and results of operations.
We are subject to the risk of supplier concentration.
Certain of our product lines depend on a limited number of third-party suppliers and vendors. As a result of this concentration in some of our supply chains, our business and operations could be negatively affected if our key suppliers were to experience significant disruptions affecting the price, quality, availability or timely delivery of their products. The partial or complete loss of any one of our key suppliers, or a significant adverse change in the relationship with any of these suppliers, through consolidation or otherwise, may limit our ability to manufacture and sell certain of our products.
32
Table of Contents
We may not be able to satisfy technical requirements, testing requirements, code requirements or other specifications under contracts and contract tenders.
Many of our products could be used in harsh environments and severe service applications. Our contracts with customers and customer requests for bids may set forth detailed specifications or technical requirements (including that they meet certain industrial code requirements, such as API, ASME or similar codes, or that our processes and facilities maintain ISO or similar certifications) for our products and services, which may also include extensive testing requirements. We anticipate that such code testing requirements will become more common in our contracts. We cannot assure you that our products or facilities will be able to satisfy the specifications or requirements, or that we will be able to perform the full-scale testing necessary to prove that the product specifications are satisfied in future contract bids or under existing contracts, or that the costs of modifications to our products or facilities to satisfy the specifications and testing will not adversely affect our results of operations. If our products or facilities are unable to satisfy such requirements, or we are unable to perform or satisfy any scale testing, our customers may cancel their contracts and/or seek new suppliers, and could have a material adverse effect on our business, financial conditions and results of operations.
Risks Relating to Our Indebtedness
We are a holding company and rely on dividends, distributions and other payments, advances and transfers of funds from our subsidiaries to meet our obligations.
We are a holding company that does not conduct any business operations of our own. As a result, we are largely dependent upon cash dividends and distributions and other transfers from our subsidiaries to meet our obligations. The agreements governing the indebtedness of our subsidiaries impose restrictions on our subsidiaries’ ability to pay dividends or other distributions to us. The deterioration of the earnings from, or other available assets of, our subsidiaries for any reason also could limit or impair their ability to pay dividends or other distributions to us.
Our outstanding indebtedness could adversely affect our financial condition and our ability to operate our business, and we may not be able to generate sufficient cash flows to meet our debt service obligations.
As of December 31, 2016, our total outstanding indebtedness was $90.8 million under our Senior Secured Credit Facilities. We intend to use a portion of the proceeds of this offering to repay our Term Loan (as defined below) under our Senior Secured Credit Facilities; however we anticipate we will have the ability to draw on our New Senior Secured Credit Facility and could incur substantial indebtedness in the future. Our outstanding indebtedness and any additional indebtedness we incur may have important consequences for us, including, without limitation, that:
| • | we may be required to use a substantial portion of our cash flow to pay the principal of and interest on our indebtedness; |
| • | our indebtedness and leverage may increase our vulnerability to adverse changes in general economic and industry conditions, as well as to competitive pressures; |
| • | our ability to obtain additional financing for working capital, capital expenditures, acquisitions and for general corporate and other purposes may be limited; |
| • | expose us to the risk of increased interest rates because our borrowings are at variable rates of interest; |
| • | prevent us from taking advantage of business opportunities as they arise or successfully carrying out our plans to expand our business; and |
| • | our flexibility in planning for, or reacting to, changes in our business and our industry may be limited. |
Under the terms of the credit agreements governing our Senior Secured Credit Facilities and New Senior Secured Credit Facility, we are required to comply with specified financial and operating covenants, which may
33
Table of Contents
limit our ability to operate our business as we otherwise might operate it. The obligations under our Senior Secured Credit Facilities and New Senior Secured Credit Facility may be accelerated upon the occurrence of an event of default, which includes customary events of default including, without limitation, payment defaults, cross-defaults to certain material indebtedness, covenant defaults, material inaccuracy of representations and warranties, bankruptcy events, material judgments, certain ERISA-related events, material defects with respect to guarantees and collateral, invalidity of subordination provisions and change of control. If not cured, an event of default could result in any amounts outstanding, including any accrued interest and unpaid fees, becoming immediately due and payable, which would require us to, among other things: seek additional financing in the debt or equity markets, refinance or restructure all or a portion of our indebtedness, sell selected assets and/or reduce or delay planned capital or operating expenditures. Such measures might not be sufficient to enable us to service our debt and any such financing or refinancing might not be available on economically favorable terms or at all. If we are not able to generate sufficient cash flows to meet our debt service obligations or are forced to take additional measures to be able to service our indebtedness, it could have a material adverse effect on our business, financial condition and results of operations.
We and our subsidiaries may be able to incur substantial indebtedness.
We may incur substantial additional indebtedness in the future. Although the terms of the agreements governing our Senior Secured Credit Facilities and New Senior Second Credit Facility contain restrictions on our ability to incur additional indebtedness these restrictions are subject to a number of important exceptions, and indebtedness incurred in compliance with these restrictions could be substantial. If we and our subsidiaries incur significant additional indebtedness, the related risks to our financial condition could increase.
Restrictive covenants in the agreements governing our Senior Secured Credit Facilities and New Senior Second Credit Facility may restrict our ability to pursue our business strategies.
The agreements governing our Senior Secured Credit Facilities and New Senior Second Credit Facility contain a number of restrictive covenants that impose significant operating and financial restrictions on us and may limit our ability to engage in acts that may be in our long-term best interests. These include covenants restricting, among other things, our ability to:
| • | incur additional indebtedness; |
| • | grant liens; |
| • | enter into burdensome agreements with negative pledge clauses or restrictions on subsidiary distributions; |
| • | make certain investments; |
| • | pay dividends; |
| • | make payments in respect of junior lien or subordinated debt; |
| • | make acquisitions; |
| • | consolidate, amalgamate, merge, liquidate or dissolve; |
| • | sell, transfer or otherwise dispose of assets; |
| • | make certain organizational changes (including with respect to organizational documents and changes in fiscal year); |
| • | engage in sale-leaseback transactions; |
| • | engage in transactions with affiliates; |
| • | enter into operating leases; |
| • | enter into hedging arrangements; |
34
Table of Contents
| • | enter into certain leasehold arrangements and arrangements with respect to inventory and equipment; |
| • | materially alter our business; and |
| • | incur capital expenditures. |
Our Senior Secured Credit Facilities contain financial covenants that requires (i) commencing with the fiscal quarter ended March 31, 2019, compliance with a leverage ratio test set at 3.00 to 1.00 as of the last day of each fiscal quarter, (ii) commencing with the fiscal quarter ended March 31, 2019, compliance with a fixed charge coverage ratio test set at 1.25 to 1.00 as of the last day of each fiscal quarter and (iii) commencing with the fiscal quarter ended December 31, 2015, compliance with an interest coverage ratio set at (x) 1.50 to 1.00 as of the last day of each fiscal quarter through and including the fiscal quarter ended December 31, 2017 and (y) 1.75 to 1.00 as of the last day of the fiscal quarter ended March 31, 2018 through and including the fiscal quarter ending December 31, 2018. We expect that our New Senior Secured Credit Facility will require compliance with certain leverage ratios, asset coverage ratios and interest coverage ratios. See “Description of Material Indebtedness.” Our ability to meet these financial ratios can be affected by events beyond our control and we cannot assure you that we will be able to meet these ratios. A breach of any covenant or restriction contained in the agreements governing our Senior Secured Credit Facilities and New Senior Secured Credit Facility could result in a default under this agreement. If any such default occurs, the lenders under such facilities, may elect (after the expiration of any applicable notice or grace periods) to declare all outstanding borrowings, together with accrued and unpaid interest and other amounts payable thereunder, to be immediately due and payable. The lenders under our Senior Secured Credit Facilities, also have the right upon an event of default thereunder to terminate any commitments they have to provide further borrowings. Further, following an event of default under the agreement governing our Senior Secured Credit Facilities and New Senior Secured Credit Facility, the lenders under such facilities will have the right to proceed against the collateral granted to them to secure that debt. If the debt under our Senior Secured Credit Facilities or New Senior Secured Credit Facility was to be accelerated, our assets may not be sufficient to repay in full that debt or any other debt that may become due as a result of that acceleration.
Volatility and weakness in bank and capital markets may adversely affect credit availability and related financing costs for us.
Bank and capital markets can experience periods of volatility and disruption. If the disruption in these markets is prolonged, our ability to refinance, and the related cost of refinancing, some or all of our debt could be adversely affected. Additionally, during periods of volatile credit markets, there is a risk that lenders, even those with strong balance sheets and sound lending practices, could fail or refuse to honor their legal commitments and obligations under existing credit commitments, including our Revolving Credit Facility and New Senior Secured Credit Facility. Although we currently can access the bank and capital markets, there is no assurance that such markets will continue to be a reliable source of financing for us. These factors, including the tightening of credit markets, could adversely affect our ability to obtain cost-effective financing. Increased volatility and disruptions in the financial markets also could make it more difficult and more expensive for us to refinance outstanding indebtedness and obtain financing. In addition, the adoption of new statutes and regulations, the implementation of recently enacted laws or new interpretations or the enforcement of older laws and regulations applicable to the financial markets or the financial services industry could result in a reduction in the amount of available credit or an increase in the cost of credit. Disruptions in the financial markets can also adversely affect our lenders, insurers, customers and other counterparties. Any of these results could results in a material adverse effect to our business, financial condition and results of operations.
Risks Relating to This Offering and Ownership of Our Common Stock
There is no existing market for our common stock and an active, liquid trading market for our common stock may not develop.
Prior to this offering, there has been no public market for our common stock. We cannot predict the extent to which investor interest in our company will lead to the development of an active trading market or how liquid
35
Table of Contents
that market may become. If an active trading market does not develop, you may have difficulty selling any of our shares that you purchase. The initial public offering price of our common stock will be determined by negotiation between us and the underwriters and may not be indicative of prices that will prevail after the completion of this offering. The market price of our common stock may decline below the initial public offering price, and you may not be able to resell your shares at, or above, the initial public offering price.
The price of our common stock may be volatile and you could lose all or part of your investment.
Securities markets worldwide have experienced in the past, and are likely to experience in the future, significant price and volume fluctuations. Specifically, the oilfield services sector has recently experienced significant market volatility. This market volatility, as well as general economic, market or political conditions could reduce the market price of our common stock regardless of our results of operations. The trading price of our common stock is likely to be highly volatile and could be subject to wide price fluctuations in response to various factors, including, among other things, the risk factors described herein and other factors beyond our control. Factors affecting the trading price of our common stock could include:
| • | market conditions in the broader stock market; |
| • | actual or anticipated variations in our quarterly financial and operating results; |
| • | developments in the oil and natural gas industry in general or in the oil and natural gas services market in particular; |
| • | variations in operating results of similar companies; |
| • | introduction of new services by us, our competitors or our customers; |
| • | issuance of new, negative or changed securities analysts’ reports or recommendations or estimates; |
| • | investor perceptions of us and the industries in which we or our customers operate; |
| • | sales, or anticipated sales, of our stock, including sales by our officers, directors and significant stockholders; |
| • | additions or departures of key personnel; |
| • | regulatory or political developments; |
| • | the public’s response to press releases or other public announcements by us or third parties, including our filings with the SEC; |
| • | announcements media reports or other public forum comments related to litigation, claims or reputational charges against us; |
| • | guidance, if any, that we provide to the public, any changes in this guidance or our failure to meet this guidance; |
| • | the development and sustainability of an active trading market for our common stock; |
| • | investor perceptions of the investment opportunity associated with our common stock relative to other investment alternatives; |
| • | other events or factors, including those resulting from system failures and disruptions, earthquakes, hurricanes, war, acts of terrorism, other natural disasters or responses to these events; |
| • | changes in accounting principles; |
| • | share-based compensation expense under applicable accounting standards; |
| • | litigation and governmental investigations; and |
| • | changing economic conditions. |
36
Table of Contents
These and other factors may cause the market price and demand for shares of our common stock to fluctuate substantially, which may limit or prevent investors from readily selling their shares of common stock and may otherwise negatively affect the liquidity of our common stock. In addition, in the past, when the market price of a stock has been volatile, holders of that stock sometimes have instituted securities class action litigation against the company that issued the stock. Securities litigation against us, regardless of the merits or outcome, could result in substantial costs and divert the time and attention of our management from our business, which could significantly harm our business, profitability and reputation.
We are controlled by the Advent Funds, whose interests may differ from those of our public stockholders.
We are controlled by the Advent Funds and after this offering will continue to be controlled by the Advent Funds. After the completion of this offering, the Advent Funds will beneficially own in the aggregate 68.3% of the combined voting power of our common stock (or 65.3% if the underwriters exercise their option to purchase additional shares in full). As a result of this ownership, Advent will have effective control over the outcome of votes on all matters requiring approval by our stockholders, including the election of directors, the adoption of amendments to our charter and bylaws and other significant corporate transactions.
In addition, persons associated with Advent currently serve on our board of directors (our “Board”). Following this offering, the interests of Advent may not always coincide with the interests of our other stockholders, and the concentration of effective control in Advent will limit other stockholders’ ability to influence corporate matters. The concentration of ownership and voting power of Advent also may delay, defer or even prevent an acquisition by a third-party or other change of control and may make some transactions more difficult or impossible without their support, even if such events are in the best interests of our other stockholders.
Further, Advent may have an interest in having us pursue acquisitions, divestitures, financing or other transactions, including, but not limited to, the issuance of additional debt or equity and the declaration and payment of dividends, that, in its judgment, could enhance Advent’s equity investments, even though such transactions may involve risk to us or to our creditors. Additionally, the Advent Funds may make investments in businesses that directly or indirectly compete with us, or may pursue acquisition opportunities that may be complementary to our business and, as a result, those acquisition opportunities may not be available to us.
Advent may take actions that our other stockholders do not view as beneficial, which may adversely affect our business, financial condition and results of operations and cause the value of your investment to decline.
Our directors or stockholders, including the Advent Funds, with certain exceptions, do not have obligations to present business opportunities to us and may compete with us.
Our amended and restated certificate of incorporation provides that our directors and stockholders, including the Advent Funds, do not have any obligation to offer us an opportunity to participate in business opportunities presented to them even if the opportunity is one that we might reasonably have pursued (and therefore may be free to compete with us in the same business or similar businesses), and that, to the extent permitted by law, such directors and stockholders, including the Advent Funds, will not be liable to us or our stockholders for breach of any duty by reason of any such activities.
As a result, our stockholders, including the Advent Funds, and directors and their respective affiliates will not be prohibited from investing in competing businesses or doing business with our clients. Therefore, we may be in competition with our stockholders, including the Advent Funds, and directors or their respective affiliates, and we may not have knowledge of, or be able to pursue, transactions that could potentially be beneficial to us. Accordingly, we may lose certain corporate opportunities or suffer competitive harm, which could have a material adverse effect on our business, financial condition, results of operation or prospects.
37
Table of Contents
Future sales of our common stock, or the perception in the public markets that these sales may occur, could cause the market price for our common stock to decline.
Upon consummation of this offering, there will be 45,325,225 shares of our common stock outstanding. All shares of common stock sold in this offering will be freely transferable without restriction or further registration under the Securities Act. At the time of this offering, we will also have registered 7,645,071 shares of common stock reserved for issuance under our equity incentive plans of which options to purchase 3,112,548 shares of common stock are outstanding, which shares may be issued upon issuance and once vested, subject to any applicable lock-up restrictions then in effect. We cannot predict the effect, if any, that market sales of shares of our common stock or the availability of shares of our common stock for sale will have on the market price of our common stock prevailing from time to time. Sales of substantial amounts of shares of our common stock in the public market, or the perception that those sales will occur, could cause the market price of our common stock to decline. Of the remaining shares of common stock outstanding, 35,825,225 will be restricted securities within the meaning of Rule 144 under the Securities Act and subject to certain restrictions on resale following the consummation of this offering. Restricted securities may be sold in the public market only if they are registered under the Securities Act or are sold pursuant to an exemption from registration such as Rule 144 or Rule 701, as described in “Shares Eligible for Future Sale.” Upon consummation of this offering, certain holders of our common stock will have registration rights with respect to 35,169,218 of these restricted securities. See “Certain Relationships and Related Party Transactions—Registration Rights Agreement.”
We, each of our executive officers and directors, the Advent Funds and certain other existing stockholders have agreed that (subject to certain exceptions), for a period of 180 days from the date of this prospectus, we and they will not, without the prior written consent of the representatives of the underwriters, dispose of or hedge any shares or any securities convertible into or exchangeable for our common stock. The representatives of the underwriters, in their sole discretion may release any of the securities subject to these lock-up agreements at any time, which, in the case of executive officers and directors, shall be with notice. See “Underwriting (Conflicts of Interest).” Following the expiration of the applicable lock-up period, all of the issued and outstanding shares of our common stock will be eligible for future sale, subject to the applicable volume, manner of sale, holding period and other limitations of Rule 144. See “Shares Eligible for Future Sale” for a discussion of the shares of common stock that may be sold into the public market in the future.
If you purchase shares of common stock sold in this offering, you will incur immediate and substantial dilution.
The initial public offering price per share is substantially higher than the pro forma net tangible book value per share immediately after this offering. As a result, you will pay a price per share that substantially exceeds the book value of our assets after subtracting the book value of our liabilities. Based on our net tangible book value as of December 31, 2016 and assuming an offering price of $16.50 per share, the midpoint of the range set forth on the cover page of this prospectus, you will incur immediate and substantial dilution in the amount of $14.74 per share. See “Dilution.”
We have elected to take advantage of the “controlled company” exemption to the corporate governance rules for publicly-listed companies, which could make our common stock less attractive to some investors or otherwise harm our stock price.
Because we qualify as a “controlled company” under the corporate governance rules for publicly-listed companies on NASDAQ, we are not required to have a majority of our Board be independent, nor are we required to have a compensation committee or a Board committee performing the Board nominating function. In light of our status as a controlled company, we may choose to change our Board composition, or the composition of the compensation, nominating and corporate governance committee. Accordingly, should the interests of the Advent Funds differ from those of other stockholders, the other stockholders may not have the same protections afforded to stockholders of companies that are subject to all of the corporate governance rules for publicly-listed
38
Table of Contents
companies. Our status as a controlled company could make our common stock less attractive to some investors or otherwise harm our stock price.
Anti-takeover protections in our amended and restated certificate of incorporation, our amended and restated bylaws or our contractual obligations may discourage or prevent a takeover of our company, even if an acquisition would be beneficial to our stockholders.
Provisions contained in our amended and restated certificate of incorporation and amended and restated bylaws, as amended, as well as provisions of the Delaware General Corporation Law (the “DGCL”), could delay or make it more difficult to remove incumbent directors or could impede a merger, takeover or other business combination involving us or the replacement of our management or discourage a potential investor from making a tender offer for our common stock, which, under certain circumstances, could reduce the market value of our common stock, even if it would benefit our stockholders.
In addition, our Board has the authority to cause us to issue, without any further vote or action by the stockholders, up to 10,000,000 shares of preferred stock, par value $0.01 per share, in one or more series, to designate the number of shares constituting any series, and to fix the rights, preferences, privileges and restrictions thereof, including dividend rights, voting rights, rights and terms of redemption, redemption price or prices and liquidation preferences of such series. The issuance of shares of preferred stock or the adoption of a stockholder rights plan may have the effect of delaying, deferring or preventing a change in control of our company without further action by the stockholders, even where stockholders are offered a premium for their shares. See “Description of Capital Stock—Anti-takeover Provisions.”
In addition, under the agreements governing our Senior Secured Credit Facilities and New Senior Secured Credit Facility, a change of control would cause us to be in default and the lenders under such facilities would have the right to accelerate their loans, and if so accelerated, we would be required to repay all of our outstanding obligations under such facilities. In addition, from time to time we may enter into contracts that contain change of control provisions that limit the value of, or even terminate, the contract upon a change of control. These change of control provisions may discourage a takeover of our company, even if an acquisition would be beneficial to our stockholders.
The requirements of being a public company, including compliance with the reporting requirements of the Exchange Act, and the requirements of the Sarbanes-Oxley Act, may strain our resources, increase our costs and distract management, and we may be unable to comply with these requirements in a timely or cost-effective manner.
As a publicly traded company, and particularly after we cease to be an emerging growth company (to the extent that we take advantage of certain exceptions from reporting requirements that are available under the JOBS Act as an emerging growth company), we will incur additional legal, accounting and other expenses that we were not required to incur in the past. After this offering, we will be required to file with the SEC annual and quarterly information and other reports that are specified in Section 13 of the Exchange Act. We also will become subject to other reporting and corporate governance requirements, including the requirements of NASDAQ and certain provisions of the Sarbanes-Oxley Act and the regulations promulgated thereunder, which will impose additional compliance obligations upon us. As a public company, we will, among other things:
| • | prepare and distribute periodic public reports and other stockholder communications in compliance with our obligations under the federal securities laws and applicable NASDAQ rules; |
| • | create or expand the roles and duties of our Board and committees of the Board; |
| • | institute more comprehensive financial reporting and disclosure compliance functions; |
| • | enhance our investor relations function; and |
| • | involve and retain to a greater degree outside counsel and accountants in the activities listed above. |
39
Table of Contents
These changes will require a commitment of additional resources and many of our competitors already comply with these obligations. We may not be successful in implementing these requirements and the commitment of resources required for implementing them could adversely affect our business, financial condition and results of operations.
The changes necessitated by becoming a public company require a significant commitment of resources and management oversight that has increased and may continue to increase our costs and might place a strain on our systems and resources. As a result, our management’s attention might be diverted from other business concerns. If we are unable to offset these costs through other savings then it could have a material adverse effect on our business, financial condition and results of operations.
In addition, we expect that being a public company subject to these rules and regulations may make it more difficult and more expensive for us to obtain director and officer liability insurance and we may be required to accept reduced policy limits and coverage or incur substantially higher costs to obtain the same or similar coverage. As a result, it may be more difficult for us to attract and retain qualified individuals to serve on our Board or as executive officers. We are currently evaluating these rules, and we cannot predict or estimate the amount of additional costs we may incur or the timing of such costs.
We are an “emerging growth company” and may elect to comply with reduced reporting requirements applicable to emerging growth companies, which could make our common stock less attractive to investors.
We are an emerging growth company and we may take advantage of certain exemptions from various reporting requirements that are applicable to other public companies that are not emerging growth companies, including, but not limited to, not being required to comply with the auditor attestation requirements of Section 404 of Sarbanes-Oxley, reduced disclosure obligations regarding executive compensation in our periodic reports and proxy statements and exemptions from the requirements of holding a nonbinding advisory vote on executive compensation and shareholder approval of any golden parachute payments not previously approved. In addition, even if we comply with the greater obligations of public companies that are not emerging growth companies immediately after the initial public offering, we may avail ourselves of the reduced requirements applicable to emerging growth companies from time to time in the future. We cannot predict if investors will find our common stock less attractive if we choose to rely on these exemptions. If some investors find our common stock less attractive as a result, there may be a less active trading market for our common stock and our stock price may be more volatile.
We will remain an emerging growth company until the end of the fiscal year following the fifth anniversary of this offering, or until the earliest of (i) the last day of the first fiscal year in which our annual gross revenues exceed $1 billion, (ii) the date that we become a “large accelerated filer” as defined in Rule 12b-2 under the Exchange Act, which would occur if the market value of our common stock that is held by non-affiliates exceeds $700 million as of the last business day of our most recently completed second fiscal quarter, or (iii) the date on which we have issued more than $1 billion in non-convertible debt during the preceding three-year period, whether or not issued in a registered offering.
We have identified material weaknesses in our internal control over financial reporting and may identify additional material weaknesses in the future or otherwise fail to maintain an effective system of internal controls, which may result in material misstatements of our financial statements or cause to us to fail to meet our reporting obligations or fail to prevent fraud; which would harm our business and could negatively impact the price of our common stock.
Effective internal controls are necessary for us to provide reliable financial reports and prevent fraud. If we fail to maintain an effective system of internal controls, we might not be able to report on our financial results accurately or prevent fraud; which would harm our business and could negatively impact the price of our common stock. Prior to this offering, we were a private company and had limited accounting and financial
40
Table of Contents
reporting personnel and other resources with which to address our internal controls and procedures. In connection with the audit of our financial statements for the years ended December 31, 2015 and December 31, 2016, we and our independent registered public accounting firm identified material weaknesses in our internal control over financial reporting. A material weakness is defined as a deficiency, or a combination of deficiencies, in internal control over financial reporting, such that there is a reasonable possibility that a material misstatement of our financial statements will not be prevented or detected on a timely basis.
We determined that we did not design or maintain an effective control environment with a sufficient number of trained professionals with the appropriate level of accounting knowledge and experience to properly analyze, record and disclose accounting matters commensurate with our financial reporting requirements. This material weakness contributed to the following material weaknesses in our internal control over financial reporting:
| • | We did not design and maintain sufficient formal accounting policies and controls over income taxes. Specifically, we did not have controls designed to address the accuracy of income tax expense (benefit) and related consolidated balance sheet accounts, including deferred income taxes, as well as adequate procedures and controls to review the work of external experts engaged to assist in income tax matters related to our tax structure or to monitor the presentation and disclosure of income taxes. |
| • | We did not design and maintain sufficient formal accounting policies and controls over the presentation of the statement of cash flows. Specifically, we did not have controls designed to properly classify cash flows related to our foreign exchange gains (losses) associated with our foreign denominated debt and deferred financing costs related to our extinguishment of debt. |
| • | We did not design and maintain adequate controls to address segregation of duties related to journal entries and account reconciliations as certain accounting personnel have the ability to prepare and post journal entries, as well as reconcile accounts, without an independent review by someone other than the preparer. Specifically, our internal controls were not designed or operating effectively to evidence that journal entries were appropriately recorded or were properly reviewed for validity, accuracy and completeness. |
These material weaknesses resulted in the need to correct material misstatements in our consolidated financial statements for the years ended December 31, 2014 and 2015 prior to their issuance. Each of the material weaknesses described above or any newly identified material weakness could result in a misstatement of our accounts or disclosures that would result in a material misstatement of our annual or interim consolidated financial statements that would not be prevented or detected.
We have begun to remediate and plan to further remediate these material weaknesses primarily by implementing additional review procedures within the accounting and finance department, hiring additional staff and, if appropriate, engaging external accounting experts with the appropriate knowledge to supplement our internal resources in our computation and review processes. These actions and planned actions are subject to ongoing management review and the oversight of our Board. We cannot assure you that the measures we have taken to date, or any measures we may take in the future, will be sufficient to remediate the control deficiencies that led to our material weaknesses in our internal control over financial reporting or to avoid potential future material weaknesses. In addition, neither our management nor an independent registered public accounting firm has ever performed an evaluation of our internal control over financial reporting in accordance with the provisions of the Sarbanes-Oxley Act because no such evaluation has been required. Had we or our independent registered public accounting firm performed an evaluation of our internal control over financial reporting in accordance with the provisions of the Sarbanes-Oxley Act, additional material weaknesses may have been identified. If we are unable to successfully remediate our existing or any future material weakness in our internal control over financial reporting, or identify any additional material weaknesses that may exist, the accuracy and timing of our financial reporting may be adversely affected, we may be unable to maintain compliance with securities law requirements regarding timely filing of periodic reports in addition to applicable stock exchange listing requirements, we may be unable to prevent fraud, investors may lose confidence in our financial reporting,
41
Table of Contents
and our stock price may decline as a result. Additionally, our reporting obligations as a public company will place a significant strain on our management, operational and financial resources and systems for the foreseeable future and may cause us to fail to timely achieve and maintain the adequacy of our internal control over financial reporting.
Because we do not intend to pay cash dividends in the foreseeable future, you may not receive any return on investment unless you are able to sell your common stock for a price greater than your purchase price.
We do not intend in the foreseeable future to pay any dividends to holders of our common stock. We currently intend to retain our future earnings, if any, for the foreseeable future, to repay indebtedness and to support our general corporate purposes. Therefore, you are not likely to receive any dividends on your common stock for the foreseeable future and the success of an investment in shares of our common stock will depend upon any future appreciation in their value. There is no guarantee that shares of our common stock will appreciate in value or even maintain the price at which investors have purchased their shares. However, the payment of future dividends will be at the discretion of our Board, subject to applicable law, and will depend on, among other things, our earnings, financial condition, capital requirements, level of indebtedness, statutory and contractual restrictions that apply to the payment of dividends and other considerations that our Board deems relevant. The agreements governing our Senior Secured Credit Facilities and New Senior Second Credit Facilities limit the amounts available to us to pay cash dividends, and, to the extent that we require additional funding, financing sources may prohibit the payment of a dividend. See “Dividend Policy.” As a consequence of these limitations and restrictions, we may not be able to make the payment of dividends on our common stock.
If securities or industry analysts publish unfavorable research, about our business, the price of our common stock and our trading volume could decline.
The trading market for our common stock will depend in part on the research and reports that securities or industry analysts publish about us or our business. Securities and industry analysts do not currently publish research on our company. Once securities or industry analysts initiate coverage, if one or more of the analysts who cover us downgrade our common stock or publish unfavorable research about our business, the price of our common stock likely would decline. If one or more of these analysts cease coverage of our company or fail to publish reports on us regularly, demand for our common stock could decrease, which might cause the price of our common stock and trading volume to decline.
Claims for indemnification by our directors and officers may reduce our available funds to satisfy successful third-party claims against us and may reduce the amount of money available to us.
Our amended and restated certificate of incorporation and bylaws that will be in effect prior to the completion of this offering provide that we will indemnify our directors and officers, in each case, to the fullest extent permitted by Delaware law. Pursuant to our charter, our directors will not be liable to the company or any stockholders for monetary damages for any breach of fiduciary duty, except (i) acts that breach his or her duty of loyalty to the company or its stockholders, (ii) acts or omissions without good faith or involving intentional misconduct or knowing violation of the law, (iii) pursuant to Section 174 of the DGCL or (iv) for any transaction from which the director derived an improper personal benefit. The bylaws also require us, if so requested, to advance expenses that such director or officer incurred in defending or investigating a threatened or pending action, suit or proceeding, provided that such person will return any such advance if it is ultimately determined that such person is not entitled to indemnification by us. Any claims for indemnification by our directors and officers may reduce our available funds to satisfy successful third party claims against us and may reduce the amount of money available to us.
42
Table of Contents
Our amended and restated certificate of incorporation will provide, subject to certain exceptions, that the Court of Chancery of the State of Delaware will be the sole and exclusive forum for certain stockholder litigation matters, which could limit our stockholders’ ability to obtain a favorable judicial forum for disputes with us or our directors, officers, employees or stockholders.
Our amended and restated certificate of incorporation will provide, subject to limited exceptions, that the Court of Chancery of the State of Delaware will, to the fullest extent permitted by law, be the sole and exclusive forum for (i) any derivative action or proceeding brought on our behalf; (ii) any action asserting a claim of breach of a fiduciary duty owed by any of our directors, officers or other employees to us or our stockholders; (iii) any action asserting a claim against us, any director or our officers or employees arising pursuant to any provision of the DGCL, our certificate or our amended and restated by-laws; or (iv) any action asserting a claim against us, any director or our officers or employees that is governed by the internal affairs doctrine. Any person or entity purchasing or otherwise acquiring any interest in shares of our capital stock shall be deemed to have notice of and to have consented to the provisions of our certificate described above. This choice of forum provision may limit a stockholder’s ability to bring a claim in a judicial forum that it finds favorable for disputes with us or any of our directors, officers, other employees or stockholders which may discourage lawsuits with respect to such claims. Alternatively, if a court were to find the choice of forum provision that will be contained in our certificate to be inapplicable or unenforceable in an action, we may incur additional costs associated with resolving such action in other jurisdictions, which could have a material adverse effect on our business, financial condition and results of operations.
43
Table of Contents
CAUTIONARY NOTE REGARDING FORWARD-LOOKING STATEMENTS
This prospectus contains forward-looking statements. Forward-looking statements can be identified by words such as “anticipates,” “intends,” “plans,” “seeks,” “believes,” “estimates,” “expects” and similar references to future periods, or by the inclusion of forecasts or projections. Examples of forward-looking statements include, but are not limited to, statements we make regarding the outlook for our future business and financial performance, such as those contained in “Management’s Discussion and Analysis of Financial Condition and Results of Operations.”
Forward-looking statements are based on our current expectations and assumptions regarding our business, the economy and other future conditions. Because forward-looking statements relate to the future, by their nature, they are subject to inherent uncertainties, risks and changes in circumstances that are difficult to predict. As a result, our actual results may differ materially from those contemplated by the forward-looking statements. Important factors that could cause our actual results to differ materially from those in the forward-looking statements include regional, national or global political, economic, business, competitive, market and regulatory conditions and the following:
| • | declines in the level of oil and natural gas exploration and production activity within Canada and the United States; |
| • | oil and natural gas price fluctuations; |
| • | loss of significant customers; |
| • | inability to successfully implement our strategy of increasing sales of products and services into the United States; |
| • | significant competition for our products and services; |
| • | our inability to successfully develop and implement new technologies, products and services; |
| • | our inability to protect and maintain critical intellectual property assets; |
| • | currency exchange rate fluctuations; |
| • | impact of severe weather conditions; |
| • | restrictions on the availability of our customers to obtain water essential to the drilling and hydraulic fracturing processes; |
| • | our failure to identify and consummate potential acquisitions; |
| • | our inability to accurately predict customer demand; |
| • | losses and liabilities from uninsured or underinsured drilling and operating activities; |
| • | changes in legislation or regulation governing the oil and natural gas industry, including restrictions on emissions of GHGs; |
| • | failure to comply with federal, state and local and non-U.S. laws and other regulations; |
| • | loss of our information and computer systems; |
| • | system interruptions or failures, including cyber-security breaches, identity theft or other disruptions that could compromise our information; |
| • | our failure to establish and maintain effective internal control over financial reporting; |
| • | our success in attracting and retaining qualified employees and key personnel; and |
| • | our inability to satisfy technical requirements and other specifications under contracts and contract tenders. |
44
Table of Contents
See “Risk Factors” for a further description of these and other factors that could cause actual results to differ materially from those in the forward-looking statements. For the reasons described above, we caution you against relying on any forward-looking statements, which should also be read in conjunction with the other cautionary statements that are included elsewhere in this prospectus. Any forward-looking statement made by us in this prospectus speaks only as of the date on which we make it. Factors or events that could cause our actual results to differ may emerge from time to time, and it is not possible for us to predict all of them. We undertake no obligation to publicly update or revise any forward-looking statement, whether as a result of new information, future developments or otherwise, except as may be required by law.
45
Table of Contents
We estimate that the net proceeds to us from our sale of 9,500,000 shares of common stock in this offering will be approximately $144.8 million, after deducting underwriting discounts and commissions and estimated expenses payable by us in connection with this offering. This assumes a public offering price of $16.50 per share, which is the midpoint of the price range set forth on the cover of this prospectus. The underwriters also have an option to purchase up to an additional 1,425,000 shares of common stock from the selling stockholders. We will not receive any proceeds from the sale of shares of common stock by the selling stockholders.
We intend to use the net proceeds from this offering to repay indebtedness under our Senior Secured Credit Facilities and use the remainder for general corporate purposes. As of December 31, 2016, we had $90.8 million outstanding under the Term Loan of our Senior Secured Credit Facilities. Our Senior Secured Credit Facilities bear interest at a rate per annum equal to an applicable margin plus a base rate determined by reference to the highest of either: (a) in the case of loans denominated in U.S. dollars, (i) the federal funds rate plus 0.5%, (ii) one-month LIBOR plus 1.00% and (iii) the prime commercial lending rate of the administrative agent as in effect on the relevant day or (b) in the case of loans denominated in Canadian dollars, (i) the prime commercial lending rate of the administrative agent as in effect on the relevant day for determining interest rates on Canadian dollar denominated commercial loans made in Canada and (ii) CDOR plus 1.0%. Our Senior Secured Credit Facilities mature on August 7, 2019. See “Description of Material Indebtedness.”
After the repayment of indebtedness under our Senior Secured Credit Facilities, we currently intend to use the remaining net proceeds from this offering for general corporate purposes, which may include the payment of costs and expenses associated with the implementation of our business strategy, although we have no current specific plans for the use of the remaining net proceeds at this time. The principal reasons for this offering are to repay indebtedness under our Senior Secured Credit Facilities, increase our capitalization and financial flexibility, create a public market for our common stock and facilitate our access to the capital markets in the future.
Assuming, a $1.00 increase (decrease) in the assumed initial public offering price of $16.50 per share (the midpoint of the price range set forth on the cover of this prospectus) would increase (decrease) the net proceeds to us from this offering by $8.9 million, assuming the number of shares offered by us, as set forth on the cover of this prospectus, remains the same and after deducting underwriting discounts and commissions and estimated expenses payable by us.
A repayment of the outstanding borrowings under our Senior Secured Credit Facilities could result in at least 5% of the net proceeds of this offering being paid to an affiliate of an underwriter who is a lender under our Senior Secured Credit Facilities. Accordingly, this offering is being made in compliance with the requirements of Rule 5121 of the FINRA rules. For more information, see “Underwriting (Conflicts of Interest).”
The foregoing represents our current intentions with respect to the use and allocation of the net proceeds of this offering based upon our present plans and business conditions, but our management will have significant flexibility and discretion in applying the net proceeds. The occurrence of unforeseen events or changed business conditions could results in application of the net proceeds of this offering in a manner other than as described in the prospectus.
46
Table of Contents
We do not intend to pay cash dividends on our common stock in the foreseeable future. However, in the future, subject to the factors described below and our future liquidity and capitalization, we may change this policy and choose to pay dividends.
We are a holding company that does not conduct any business operations of our own. As a result, our ability to pay cash dividends on our common stock is dependent upon cash dividends and distributions and other transfers from our subsidiaries. The ability of our subsidiaries to pay dividends is currently restricted by the terms of our Senior Secured Credit Facilities and may be further restricted by the New Senior Secured Credit Facility or any future indebtedness we or they incur.
In addition, under Delaware law, our Board may declare dividends only to the extent of our surplus (which is defined as total assets at fair market value minus total liabilities, minus statutory capital) or, if there is no surplus, out of our net profits for the then current and/or immediately preceding fiscal year.
Any future determination to pay dividends will be at the discretion of our Board and will take into account:
| • | restrictions in our debt instruments, including our secured credit facilities; |
| • | general economic business conditions; |
| • | our net income, financial condition and results of operations; |
| • | our capital requirements; |
| • | our prospects; |
| • | the ability of our operating subsidiaries to pay dividends and make distributions to us; |
| • | legal restrictions; and |
| • | such other factors as our Board may deem relevant. |
See “Risk Factors—Risks Relating to This Offering and Ownership of Our Common Stock—Because we do not intend to pay cash dividends in the foreseeable future, you may not receive any return on investment unless you are able to sell your common stock for a price greater than your purchase price.” and “Management’s Discussion and Analysis of Financial Condition and Results of Operations—Liquidity and Capital Resources.”
47
Table of Contents
The following table sets forth our unaudited cash and cash equivalents and our capitalization as of December 31, 2016:
| • | on an actual basis giving effect to the 3.00 for 1.00 stock split that occurred on April 13, 2017; and |
| • | on an as adjusted basis to give effect to (i) our amended and restated certificate of incorporation and amended and restated bylaws as they will be in effect upon the consummation of this offering and (ii) the sale of 9,500,000 shares of our common stock in this offering at an assumed public offering price of $16.50 per share, which is the midpoint of the estimated offering price range set forth on the cover of this prospectus, and the application of the net proceeds received by us from this offering as described under “Use of Proceeds.” |
This table should be read in conjunction with “Use of Proceeds,” “Selected Historical Consolidated Financial Data,” “Management’s Discussion and Analysis of Financial Condition and Results of Operations,” “Description of Capital Stock” and the consolidated financial statements and notes thereto appearing elsewhere in this prospectus.
| As of December 31, 2016 | ||||||||
| Actual | As Adjusted(1) | |||||||
| (in thousands, except share and per share amounts) |
||||||||
| Cash and cash equivalents |
$ | 18,275 | $ | 72,250 | ||||
|
|
|
|
|
|||||
| Debt: |
||||||||
| Senior Secured Credit Facilities, net(2) |
$ | 89,166 | $ | — | ||||
|
|
|
|
|
|||||
| Total debt, net |
$ | 89,166 | $ | — | ||||
|
|
|
|
|
|||||
| Stockholders’ equity: |
||||||||
| Common stock, $0.01 par value per share, 54,000,000 shares authorized, actual, 225,000,000 shares authorized, as adjusted, 34,024,326 shares issued and 34,005,978 shares outstanding, actual, and 43,524,326 shares issued and 43,505,978 shares outstanding, as adjusted(3) |
340 | 435 | ||||||
| Preferred stock, $0.01 par value per share, 1 share authorized, actual, 10,000,000 shares authorized, as adjusted, 1 share issued and outstanding, actual, 1 share issued and outstanding, as adjusted |
— | — | ||||||
| Additional paid-in capital |
237,566 | 383,145 | ||||||
| Accumulated other comprehensive loss |
(82,015 | ) | (82,015 | ) | ||||
| Retained earnings |
21,762 | 19,229 | ||||||
| Treasury stock, at cost (18,348 shares actual and 18,348 shares as adjusted) |
(175 | ) | (175 | ) | ||||
|
|
|
|
|
|||||
| Total stockholders’ equity |
177,478 | 320,619 | ||||||
|
|
|
|
|
|||||
| Total capitalization |
$ | 266,644 | $ | 320,619 | ||||
|
|
|
|
|
|||||
| (1) | Each $1.00 increase or decrease in the public offering price per share would increase or decrease, as applicable, our net proceeds, after deducting the underwriting discount and estimated offering expenses payable by us, by $8.9 million (assuming no exercise of the underwriters’ option to purchase additional shares). Similarly, an increase or decrease of one million shares of common stock sold in this offering by us would increase or decrease, as applicable, our net proceeds, after deducting the underwriting discount and estimated offering expenses payable by us, by $15.5 million, based on an assumed initial public offering price of $16.50 per share, which is the midpoint of the price range set forth on the cover of this prospectus. |
| (2) | For a description of our Senior Secured Credit Facilities, see “Description of Material Indebtedness—Senior Secured Credit Facilities.” As of December 31, 2016, we had $90.8 million outstanding principal amount |
48
Table of Contents
| under our Term Loan (less $1.7 million of debt issuance costs), no debt outstanding under our Revolving Credit Facility and availability of $20.0 million under our Revolving Credit Facility. |
| (3) | The number of shares of common stock issued and outstanding does not give effect to the exchange of 1,819,247 shares of common stock of NCS Multistage, Inc. (Canada) that were offered as consideration in connection with Advent’s acquisition of HoldCo in 2012 for 1,819,247 shares of our common stock. See “Certain Relationships and Related Party Transactions—Cemblend Transactions.” |
49
Table of Contents
If you invest in our common stock, your interest will be diluted to the extent of the difference between the initial public offering price per share of our common stock and the net tangible book value per share of our common stock upon the consummation of this offering. Dilution results from the fact that the per share offering price of our common stock is in excess of the book value per share attributable to new investors.
Our net tangible book value as of December 31, 2016, was $(63.3) million, or $(1.77) per share of common stock. Net tangible book value represents the amount of total tangible assets less total liabilities, and net tangible book value per share represents net tangible book value divided by the number of shares of common stock outstanding, in each case, after giving effect to the 3.00 for 1.00 stock split of common stock that occurred on April 13, 2017.
After giving effect to (i) the sale of 9,500,000 shares of common stock in this offering at the assumed initial public offering price of $16.50 per share (the midpoint of the price range set forth on the cover of this prospectus) and (ii) the application of the net proceeds from this offering, our as adjusted net tangible book value as of December 31, 2016, would have been $79.8 million, or $1.76 per share. This represents an immediate increase in as adjusted net tangible book value of $3.53 per share to our existing investors and an immediate dilution in as adjusted net tangible book value of $14.74 per share to new investors.
The following table illustrates this dilution on a per share of common stock basis:
| Assumed initial public offering price per share |
$ | 16.50 | ||||||
| Net tangible book value per share as of December 31, 2016 |
(1.77 | ) | ||||||
| Increase in net tangible book value per share attributable to new investors |
$ | 3.53 | ||||||
|
|
|
|||||||
| As adjusted net tangible book value per share after this offering |
1.76 | |||||||
|
|
|
|||||||
| Dilution in net tangible book value per share to new investors in this offering |
$ | 14.74 | ||||||
|
|
|
The following table summarizes, on an as adjusted basis as of December 31, 2016, after giving effect to this offering, the total number of shares of common stock owned by existing stockholders and to be owned by new investors, the total cash consideration paid, or to be paid, and the average price per share paid, or to be paid, by new investors purchasing shares in this offering, at an assumed initial public offering price of $16.50 per share, which is the midpoint of the range set forth on the cover of this prospectus, before deducting the estimated underwriting discounts and commissions:
| Shares Purchased | Total Consideration | Average Price Per Share |
||||||||||||||||||
| Number | Percent | Amount | Percent | |||||||||||||||||
| Existing stockholders |
35,825,225 | 79.0 | % | $ | 372,746,298 | 70.4 | % | $ | 10.40 | |||||||||||
| New investors |
9,500,000 | 21.0 | 156,750,000 | 29.6 | 16.50 | |||||||||||||||
|
|
|
|
|
|
|
|
|
|
|
|||||||||||
| Total |
45,325,225 | 100.0 | % | $ | 529,496,298 | 100.0 | % | $ | 11.68 | |||||||||||
|
|
|
|
|
|
|
|
|
|
|
|||||||||||
A $1.00 increase (decrease) in the assumed initial public offering price of $16.50 per share would increase (decrease) our as adjusted net tangible book value by $8.9 million, the as adjusted net tangible book value per share after this offering by $0.20 and the dilution per share to new investors by $(0.80) assuming the number of shares offered by us, as set forth on the cover of this prospectus, remains the same, and after deducting the estimated underwriting discounts and commissions and estimated offering expenses payable by us.
After our initial public offering, the number of shares of common stock held by existing stockholders will be 35,825,225, or approximately 79% of the total shares of common stock outstanding after our initial public
50
Table of Contents
offering, and the number of shares held by new investors will be 9,500,000, or approximately 21% of the total shares of common stock outstanding after our initial public offering.
If the underwriters were to fully exercise their option to purchase 1,425,000 additional shares of our common stock, the percentage of shares of our common stock held by existing investors would be 76%, and the percentage of shares of our common stock held by new investors would be 24%.
The above discussion and tables are based on the number of shares outstanding at December 31, 2016. In addition, we may choose to raise additional capital due to market conditions or strategic considerations even if we believe we have sufficient funds for our current or future operating plans. To the extent that additional capital is raised through the sale of equity or convertible debt securities, the issuance of such securities could result in further dilution to our stockholders.
51
Table of Contents
SELECTED HISTORICAL CONSOLIDATED FINANCIAL DATA
The following tables set forth our selected historical consolidated financial data for the periods and as of the dates indicated. We derived the consolidated statements of operations data and the consolidated statements of cash flows data for the years ended December 31, 2016 and 2015 and the consolidated balance sheet data as of December 31, 2016 and 2015 from our audited consolidated financial statements and related notes thereto included elsewhere in this prospectus.
Our historical results are not necessarily indicative of future operating results. You should read the information set forth below together with “Prospectus Summary—Summary Historical Consolidated Financial and Other Data,” “Management’s Discussion and Analysis of Financial Condition and Results of Operations,” “Capitalization” and our consolidated financial statements and the related notes thereto included elsewhere in this prospectus.
| Year Ended December 31, | ||||||||
| 2016 | 2015 | |||||||
| (in thousands, except share and per share amounts) |
||||||||
| Consolidated Statement of Operations Data: |
||||||||
| Revenues: |
||||||||
| Product sales |
$ | 73,220 | $ | 80,079 | ||||
| Services |
25,259 | 33,926 | ||||||
|
|
|
|
|
|||||
| Total revenues |
98,479 | 114,005 | ||||||
| Cost of sales: |
||||||||
| Cost of product sales, exclusive of depreciation and amortization expense below |
40,511 | 40,160 | ||||||
| Cost of services, exclusive of depreciation and amortization expense shown below |
13,322 | 14,553 | ||||||
|
|
|
|
|
|||||
| Total cost of sales, exclusive of depreciation and amortization expense shown below |
53,833 | 54,713 | ||||||
| Selling, general and administrative expenses |
37,061 | 37,804 | ||||||
| Depreciation |
1,766 | 2,695 | ||||||
| Amortization |
23,801 | 24,576 | ||||||
|
|
|
|
|
|||||
| (Loss) from operations |
(17,982 | ) | (5,783 | ) | ||||
|
|
|
|
|
|||||
| Other income (expenses) |
||||||||
| Interest (expense), net |
(6,286 | ) | (8,064 | ) | ||||
| Other income (expense), net |
45 | (131 | ) | |||||
| Foreign currency exchange (loss) gain |
(2,522 | ) | 25,779 | |||||
|
|
|
|
|
|||||
| Total other (expense) income |
(8,763 | ) | 17,584 | |||||
|
|
|
|
|
|||||
| (Loss) income before income tax expense |
(26,745 | ) | 11,801 | |||||
| Income tax (benefit) |
(8,818 | ) | (16,224 | ) | ||||
|
|
|
|
|
|||||
| Net (loss) income |
$ | (17,927 | ) | $ | 28,025 | |||
|
|
|
|
|
|||||
| Net (loss) income per share: |
||||||||
| Basic |
$ | (0.53 | ) | $ | 0.88 | |||
| Diluted |
$ | (0.53 | ) | $ | 0.86 | |||
| Weighted average shares outstanding: |
||||||||
| Basic |
34,007,505 | 29,965,946 | ||||||
| Diluted(1) |
34,007,505 | 32,432,919 | ||||||
| Consolidated Statement of Cash Flows Data: |
||||||||
| Net cash provided by (used in): |
||||||||
| Operating activities |
$ | 10,684 | $ | 4,369 | ||||
52
Table of Contents
| Year Ended December 31, | ||||||||
| 2016 | 2015 | |||||||
| (in thousands, except share and per share amounts) |
||||||||
| Investing activities |
(1,840 | ) | (1,221 | ) | ||||
| Financing activities |
(315 | ) | (12,766 | ) | ||||
| (1) | The diluted weighted average shares outstanding amount excludes the impact of options that would be anti-dilutive. |
| As of December 31, | ||||||||
| 2016 | 2015 | |||||||
| (in thousands) |
||||||||
| Consolidated Balance Sheet Data: |
||||||||
| Cash and cash equivalents |
$ | 18,275 | $ | 9,545 | ||||
| Total assets |
326,827 | 332,537 | ||||||
| Total debt, net |
89,166 | 85,856 | ||||||
| Total liabilities |
149,349 | 145,068 | ||||||
| Total stockholders’ equity |
177,478 | 187,469 | ||||||
53
Table of Contents
MANAGEMENT’S DISCUSSION AND ANALYSIS OF FINANCIAL CONDITION AND RESULTS OF OPERATIONS
The following is a discussion and analysis of our financial condition and results of operations as of, and for, the periods presented. You should read the following discussion and analysis of our financial condition and results of operations together with the sections entitled “Prospectus Summary—Summary Historical Consolidated Financial and Other Data,” “Risk Factors,” “Cautionary Note Regarding Forward-Looking Statements,” “Selected Historical Consolidated Financial Data” and our consolidated financial statements and related notes thereto included elsewhere in this prospectus. This discussion and analysis contains forward-looking statements regarding the industry outlook, our expectations, estimates and assumptions concerning events and financial and industry trends that may affect our future results of operations or financial condition. These forward-looking statements are subject to numerous risks and uncertainties, including but not limited to the risks and uncertainties described in “Risk Factors” and “Cautionary Note Regarding Forward-Looking Statements.” Our actual results may differ materially from those contained in or implied by these forward-looking statements.
Overview
We are a leading provider of highly engineered products and support services that facilitate the optimization of oil and natural gas well completions and field development strategies. We provide our products and services primarily to E&P companies for use in onshore wells, predominantly wells that have been drilled with horizontal laterals in unconventional oil and natural gas formations. Our products and services are utilized in oil and natural gas basins throughout North America and in selected international markets, including Argentina, China and Russia. We have provided our products and services to over 140 customers in 2016, including leading large independent oil and natural gas companies and major oil companies.
Our primary offering is our Multistage Unlimited family of completion products and services, which enable efficient pinpoint stimulation: the process of individually stimulating each entry point into a formation targeted by an oil or natural gas well. Our Multistage Unlimited products and services are typically utilized in cemented wellbores and enable our customers to precisely place stimulation treatments in a more controlled and repeatable manner as compared with traditional completion techniques. Our Multistage Unlimited products and services operate in conjunction with third-party providers of pressure pumping, coiled tubing and other services.
We began providing pinpoint stimulation products and services in 2006, and since then our technology has been used in the completion of more than 7,600 wells comprising over 155,000 individual frac stages. Our initial focus on the Canadian market has resulted in our products and services being used in 26% of all horizontal wells drilled in Canada in 2016. We began our efforts to increase our penetration of the U.S. market in 2013, and the United States accounted for approximately 23% of our revenue in 2016. We are focused on increasing our market share in the United States, particularly in the Permian Basin. Sales of our products and services in the Permian Basin contributed 56% and 43% of our revenue in the United States in 2016 and 2015, respectively.
Our History
Since our inception in 2006, we have focused on developing highly engineered products and support services that facilitate the optimization of oil and natural gas well completions and field development strategies. Outlined below are selected milestones in our development:
| • | In 2006, we developed our first downhole frac isolation assembly that is designed to run on coiled tubing. This downhole frac isolation assembly was primarily used in multistage stimulation of vertical coalbed methane wells in the Raton Basin in Colorado and New Mexico. We have improved our downhole frac isolation assembly over time. |
| • | In 2007 and 2008, we developed, field trialed and introduced the Mongoose Frac Assembly (“Mongoose”), a coiled tubing deployed downhole frac isolation assembly that incorporates a sand jet |
54
Table of Contents
| perforating sub and is capable of isolating, cutting tunnels into a formation and stimulating multiple frac stages in a single operation without removing the tool from the wellbore. We launched this product in Canada, where we had identified customers for trial wells, in 2008 for use in vertical and horizontal wells. In connection with the launch of Mongoose, we established our Canadian operations. |
| • | In 2010, we developed the GripShift sliding sleeve. The GripShift sliding sleeve is a frac sleeve that works in conjunction with our further modified downhole frac isolation assembly, a derivation of the Mongoose, which was enhanced to further streamline multistage completions by eliminating the need for sand jet perforating. We also began marketing the proprietary GripShift sliding sleeve and the downhole frac isolation assembly under our Multistage Unlimited brand. Our Multistage Unlimited products and services enable customers to design completions with no practical limits on the number and placement of stages. |
| • | From 2010 to 2012, we continued to grow our business in Canada while we developed new technology within our Multistage Unlimited brand suited for the higher pressures, higher temperatures and higher stage counts associated with unconventional resource development in the United States. Following the successful introduction of the technology, we increased our focus on the U.S. market beginning in late 2012. |
| • | In 2013, we introduced our MultiCycle sliding sleeve technology. Our MultiCycle sliding sleeve can be opened and closed multiple times. A variation of our downhole frac isolation assembly was developed to enable a sequence we call “Shift-Frac-Close.” This sequence allowed us to close a sleeve immediately after the stage has been completed, sealing the proppant in the formation to significantly reduce proppant flowback and to enhance near-wellbore conductivity with the sleeves subsequently opened for production. Our MultiCycle sliding sleeves can be utilized during production to shut off unwanted water or natural gas production, for high pressure, pinpoint refracturing operations and for use as an injector in enhanced oil recovery programs, including waterflood operations. |
| • | In 2013, we also introduced our AirLock casing buoyancy system, an added offering that can be utilized in conjunction with our Multistage Unlimited products and services. Our AirLock casing buoyancy system facilitates landing casing strings in horizontal wells without altering casing and cementing operations. The AirLock reduces the time needed to land casing in horizontal wells, saving time in casing running operations. |
| • | In 2014, we introduced our Vector Max and Vector-1 liner hanger systems. The Vector Max and Vector-1 liner hangers were specifically designed to perform in complex horizontal wells and were fully compatible with our Multistage Unlimited products and services. |
| • | In early 2015, we introduced ATRS, our specialized team of engineering consultants. ATRS works with customers to optimize completion designs and field development strategies and to evaluate well performance. |
| • | During 2015 and 2016, we increased our focus on attracting and retaining major oil companies and large, independent E&P companies as customers. In addition, we increased our focus on the deep basins in Canada and in the Permian Basin in the U.S. |
| • | In early 2017, we entered into a joint venture with one of our suppliers. We believe this will ensure that we have access to low-cost, high-quality machine shop services as we grow both in existing and new product lines. |
We have a history of innovation. Since our inception in 2006, we have been granted 9 U.S. patents and 14 related international patents and have 40 U.S. patent applications pending and 51 related international patents pending. In 2014 and 2015, we received the World Oil Best Completions Technology Award for our Multistage Unlimited products and services and MultiCycle sliding sleeves, respectively.
In late 2012, the Advent Funds made a majority ownership investment in the company (the “Advent Transaction”). As part of that recapitalization, a $50.0 million subordinated note from Advent was utilized to
55
Table of Contents
fund a portion of their investment. In April 2013, the subordinated note was repaid in connection with the incurrence of a $58.3 million term loan. In August 2014, we prepaid the remaining balance of the $58.3 million term loan and declared and paid a $150.0 million cash dividend which includes two components, (i) $146.9 million related to declared dividends and (ii) $3.1 million related to dividends treated as compensation, funded in part by cash generated from operations and in part by the incurrence of a new $180.0 million term loan under our Senior Secured Credit Facilities, which was borrowed in Canadian dollars ($197.6 million CAD). In late 2015, the Advent Funds and certain other of our stockholders made a $40.0 million equity investment in the company, with the proceeds utilized to prepay upcoming principal payments required by the Term Loan under our Senior Secured Credit Facilities. Due to a decline in the value of the Canadian dollar relative to the U.S. dollar from the funding of the $180.0 million Term Loan under our Senior Secured Credit Facilities until the prepayment date, we realized a gain of $10.8 million upon retirement of the debt as a result of the prepayment.
In April 2017, the Company’s Board and stockholders approved an amendment to the amended and restated certificate of incorporation effecting a 3.00 for 1.00 stock split of the Company’s issued and outstanding shares of common stock. The stock split was implemented on April 13, 2017. The par value of the common and preferred stock was not adjusted as a result of the stock split. All issued and outstanding share and per share amounts included in the accompanying financial statements have been adjusted to reflect this stock split for all periods presented.
Industry Trends Affecting our Results of Operations
Oil and Natural Gas Drilling and Completion Activity
Our products and services are primarily sold to North American E&P companies and sales of our products and services depend upon oil and natural gas drilling and production activity in North America. Oil and natural gas drilling and production activity is directly related to oil and natural gas prices. Oil and natural gas prices declined in 2014 and remained relatively low throughout 2015 and into 2016. While demand for our products and services has declined since late 2014 in connection with the commodity price decline, we believe that the demand for our products and services will increase over the medium and long-term as oil and natural gas prices rise from lows reached in mid-2016. According to Baker Hughes, the U.S. horizontal rig count averaged 587 in 2017 (through March 3, 2017) as compared to an average of 400 for the full year 2016. The average rig count in Canada in 2017 (through March 3, 2017) was 322, compared to 203 over the same period in 2016. According to Spears, the number of horizontal wells drilled in the United States is estimated to increase from 8,520 in 2016 to 16,834 in 2018, an increase of 98% and over the same period, the number of horizontal wells drilled in Canada is projected by Spears to increase by 73%.
Increasing Adoption of Pinpoint Stimulation
Traditional well completion techniques, including plug and perf and ball drop, currently account for the majority of unconventional well completions in North America. We believe that pinpoint stimulation provides substantial benefits compared to these traditional well completion techniques and that pinpoint stimulation has become increasingly utilized by operators in North America, particularly in Canada. Our ability to grow our market share, as evidenced by the percentage of horizontal wells in North America completed using our products and services, will depend in large part on the industry’s continued adoption of pinpoint stimulation to complete wells.
Increasing Well Complexity and Focus on Completion Optimization
In recent years, E&P companies have drilled longer horizontal wells and completed more hydraulic fracturing stages per well to maximize the volume of hydrocarbon recoveries per well. This trend towards more complex wells has resulted in us selling more sleeves per well on average, which increases our revenue opportunity per well completion. Additionally, E&P companies have become increasingly focused on well
56
Table of Contents
productivity through optimization of completion designs and we believe this trend will further the adoption of pinpoint stimulation, and in turn, increase the sale of our products and services if the operational benefits and long-term production results are observed by our customers.
How We Generate Revenues
We derived 93% and 95% of our revenues for the twelve months ended December 31, 2016 and 2015, respectively, from the sale of our Multistage Unlimited products and the provision of related services. The remainder of our revenues are generated from sales of our AirLock casing buoyancy system, our liner hanger systems and services provided by ATRS.
Product sales represented approximately 74% and 70% of our revenue for the twelve months ended December 31, 2016 and 2015, respectively. We have two primary models of sliding sleeves: our MultiCycle sliding sleeves and our GripShift sliding sleeves. Our MultiCycle sliding sleeves are sold at a higher price per sleeve as compared to our GripShift sliding sleeves, reflecting the additional features they incorporate. Most of our sales are on a just-in-time basis, as specified in individual purchase orders, with a fixed price for our sliding sleeves. We occasionally supply our customers with large orders that may be filled on negotiated terms. Tool charges and related services (which are classified together as “services” in our financial results) represented 26% and 30% of our revenues for the twelve months ended December 31, 2016 and 2015, respectively. Tool charges and related services relate to agreed rates we charge to our customers for the provision of our downhole frac isolation assembly and our personnel.
During periods of low drilling and well completion activity we will, in certain instances, lower the prices of our products and services. Our revenues are also impacted by well complexity, with wells with more stages resulting in longer jobs and increased revenue attributable to selling more sliding sleeves and the provision of our services.
For the twelve months ended December 31, 2016 and 2015, approximately 71% and 66%, respectively, of our revenues were derived from sales in Canada and were denominated in Canadian dollars. Because our Canadian contracts are typically invoiced in Canadian dollars, the effects of foreign currency fluctuations are regularly monitored. Foreign currency fluctuations had a negative $3.7 million impact on revenues for the twelve months ended December 31, 2016 as compared to the twelve months ended December 31, 2015, as the Canadian dollar weakened by 5% as compared to the U.S. dollar between these periods.
Although most of our sales are to North American E&P companies, we do have limited sales to customers outside of North America and expect sales to international customers to increase over time. These international sales are typically made to our local operating partners on a free on board basis with a point of sale in the United States. Some of the locations in which we have operating partners or sales representatives include Argentina, China, Russia and the Middle East. Our operating partners and representatives do not have authority to contractually bind our company, but market our products in their respective territories as part of their product or service offering.
Costs of Conducting our Business
Our cost of sales is comprised of expenses relating to the manufacture of our products in addition to the costs of our support services. Manufacturing cost of sales includes payments made to our suppliers for raw materials and payments made to machine shops for the manufacturing of components used in our products and costs related to our employees that perform quality control analysis, assemble and test our products. We recently entered into a joint venture which we believe will allow us to reduce our costs for certain product categories. Cost of sales for support services includes compensation and benefit-related expenses for employees who provide direct revenue generating services to customers in addition to the costs incurred by these employees for travel and subsistence while on site. Other cost of sales includes other variable manufacturing costs, such as shrinkage, obsolescence and revaluation or scrap related to our existing inventory. Approximately half of our cost of
57
Table of Contents
revenues in Canada are denominated in Canadian dollars and, as a result, the impact of foreign currency exchange rates resulted in a $0.9 million decrease in cost of sales for the year ended December 31, 2016 as compared to 2015.
Our selling, general and administrative (“SG&A”) expenses are comprised of compensation expense, which includes compensation and benefit-related expenses for our employees who are not directly involved in revenue generating activities, including those involved in our research and development activities, as well as all of our general operating costs. These general operating costs include, but are not limited to: rent and occupancy for our facilities, information technology infrastructure, software licensing, advertising and marketing, third party research and development, risk insurance and professional service fees for audit, legal and other consulting services. In 2015 and 2016, in response to decreased demand for our products and services resulting from the decline in E&P activity in our markets, we reduced our headcount and took certain other actions which resulted in restructuring charges, primarily severance expense. After the consummation of this offering, we expect to incur significant additional legal, accounting and other expenses associated with being a public company, including costs associated with our compliance with the Sarbanes-Oxley Act. Historically, approximately 40% of our SG&A expenses have been incurred in Canadian dollars.
Depreciation and amortization expense primarily consists of amortization of intangible assets, including assets related to our developed technology and in-process research and development, associated with the Advent Transaction. Depreciation and amortization expense also includes depreciation related to our tangible assets, which include investments in property and equipment. We expect to make capital expenditures to enhance the in-house R&D capabilities of our owned facility in Canada and expect depreciation and amortization expense to increase as a result of these capital expenditures in future periods.
We are subject to income taxes in both the United States and foreign jurisdictions in which we operate. Our historical effective tax rate differs from the applicable statutory tax rate primarily due to differences in the tax rate on our earnings in our foreign operations. The differences in our effective tax rate are due to changes in pre-tax income, certain book expenses not deductible for tax, as well as foreign deemed dividends and foreign tax credits included in the U.S. federal tax accrual. Starting in 2015, we were no longer able to utilize all of our foreign tax credits in our U.S. federal income tax return. The amount of foreign tax credit carryforwards as of December 31, 2016 and 2015 was approximately $0.9 million and $0.4 million, respectively.
Interest expense consists of accrued interest on our outstanding long-term debt, fees associated with the unused portion of our Revolving Credit Facility and amortization of debt issuance costs. We expect to repay all of our outstanding debt using the net proceeds of this offering, which will reduce our annual interest expense by $5.3 million. After we repay our outstanding debt using a portion of the net proceeds from this offering, the remaining balance of debt issuance costs will be approximately $1.7 million as of December 31, 2016. See “Use of Proceeds” and “Description of Material Indebtedness.”
Foreign currency exchange (gain) loss, net consists primarily of gains and losses on foreign currency transactions, the majority of which is related to payments made on our outstanding debt, which is denominated in Canadian dollars. The foreign exchange rate used when we first entered into our Senior Secured Credit Facilities was approximately 0.91 U.S. dollars per Canadian dollar. Recently, foreign exchange rates between the Canadian dollar and the U.S. dollar have been between 0.73 and 0.80 U.S. dollars per Canadian dollar, which has resulted in us currently having a large unrealized gain on foreign currency exchange.
How We Evaluate our Results of Operations
Our management uses a variety of financial and operating metrics to analyze our performance. These metrics are significant factors in assessing our results of operations and profitability and include:
58
Table of Contents
Revenues
We primarily sell our products and services under purchase orders with pricing negotiated on a one-off basis with each customer. Our revenues are generated primarily from the sales of our completion products and from services related to the utilization of our downhole frac isolation assembly.
Adjusted EBITDA
We believe Adjusted EBITDA (a non-GAAP measure) is useful to investors as a supplemental measure to evaluate our overall operating performance. Management uses Adjusted EBITDA as a measurement to compare our operating performance to our peers and competitors. We define Adjusted EBITDA as net income (loss) before interest expense, net, income tax expense (benefit) and depreciation and amortization further adjusted to exclude certain items which we believe are not reflective of our ongoing performance or which, in the case of share-based compensation, are non-cash in nature. We believe that Adjusted EBITDA is an important measure that excludes many of the costs associated with our existing capital structure and excludes costs that management believes do not reflect our ongoing operating performance. Accordingly, Adjusted EBITDA is a key metric that management uses to assess the period-to-period performance of our core business operations. Adjusted EBITDA helps to identify trends in the performance of our core ongoing operations by excluding the effects related to (i) non-cash items, such as share-based compensation expense, the amortization of intangible assets recorded as a result of the Advent Transaction, and realized and unrealized gains associated with fluctuations in foreign currency exchange rates and (ii) charges that do not relate to our operations, such as interest expense and income tax benefits. We believe that presenting Adjusted EBITDA enables investors to assess our performance from period to period using the same metric utilized by management and to evaluate our performance relative to other companies that are not subject to such factors. Adjusted EBITDA is also calculated in a manner consistent with the terms of the instruments governing our Senior Secured Credit Facilities (and the anticipated terms of our New Senior Secured Credit Facility). For a reconciliation of Adjusted EBITDA to net income (loss), the most directly comparable GAAP measure, see “Prospectus Summary—Summary Historical Consolidated Financial and Other Data.”
Free Cash Flow
We also utilize free cash flow to evaluate the cash generated by our operations and results of operations. We define “free cash flow” as net cash provided by operating activities less net cash used in investing activities, as presented in our Consolidated Statement of Cash Flows. Management believes free cash flow is useful because it provides information to investors regarding the cash that was available in the period that was in excess of our needs to fund our capital expenditures and other investment needs. Free cash flow does not represent our residual cash flow available for discretionary expenditures, as we have non-discretionary expenditures, including, but not limited to, interest and principal payments required under the terms of our Senior Secured Credit Facilities, that are not deducted in calculating free cash flow.
Total Sleeves Sold and Total Wells Completed
We also evaluate our performance using certain key operating data relating to levels of activity in our business, including, the number of wells completed using our technology, and the number of sleeves we sold to our customers. We use the operating metrics described above as measures of performance. Our management also evaluates and manages the performance of our business by comparing our current actual results against industry trends.
59
Table of Contents
Results of Operations
The following table summarizes our revenues and expenses for the periods indicated.
| Year Ended | ||||||||
| December 31, | ||||||||
| 2016 | 2015 | |||||||
| (in thousands) | ||||||||
| Revenues: |
||||||||
| Product sales |
$ | 73,220 | $ | 80,079 | ||||
| Services |
25,259 | 33,926 | ||||||
|
|
|
|
|
|||||
| Total revenues |
98,479 | 114,005 | ||||||
|
|
|
|
|
|||||
| Cost of sales: |
||||||||
| Cost of product sales, exclusive of depreciation and amortization expense shown below |
40,511 | 40,160 | ||||||
| Cost of services, exclusive of depreciation and amortization expense shown below |
13,322 | 14,553 | ||||||
|
|
|
|
|
|||||
| Total cost of sales, exclusive of depreciation and amortization expense shown below |
53,833 | 54,713 | ||||||
| Selling, general and administrative expenses |
37,061 | 37,804 | ||||||
| Depreciation |
1,766 | 2,695 | ||||||
| Amortization |
23,801 | 24,576 | ||||||
|
|
|
|
|
|||||
| (Loss) from operations |
(17,982 | ) | (5,783 | ) | ||||
|
|
|
|
|
|||||
| Other (expense) income: |
||||||||
| Interest (expense), net |
(6,286 | ) | (8,064 | ) | ||||
| Other income (expense), net |
45 | (131 | ) | |||||
| Foreign currency exchange (loss) gain |
(2,522 | ) | 25,779 | |||||
|
|
|
|
|
|||||
| Total other (expense) income |
(8,763 | ) | 17,584 | |||||
|
|
|
|
|
|||||
| (Loss) income before income tax expense |
(26,745 | ) | 11,801 | |||||
| Income tax (benefit) |
(8,818 | ) | (16,224 | ) | ||||
|
|
|
|
|
|||||
| Net (loss) income |
$ | (17,927 | ) | $ | 28,025 | |||
|
|
|
|
|
|||||
Year Ended December 31, 2016 compared to Year Ended December 31, 2015
Revenues
Revenues were $98.5 million for the twelve months ended December 31, 2016 as compared to $114.0 million for the twelve months ended December 31, 2015. The decrease was a direct result of a decline in the sales of our completions products and services resulting from lower drilling and well completion activity in North America driven by declines in commodity pricing. Product sales for the twelve months ended December 31, 2016 were $73.2 million, as compared to $80.1 million for the twelve months ended December 31, 2015. We sold 25,816 sliding sleeves in 2016 as compared to 24,395 during 2015. The decreased revenue as compared to the increased sleeve quantity reflects pricing declines per sleeve and a shift in mix to lower-priced sleeve models during the period. Our service revenue was $25.3 million for the twelve months ended December 31, 2016 as compared to $33.9 million for the twelve months ended December 31, 2015. Our services were utilized in the completion of 892 wells during the twelve months ended December 31, 2016 as compared to 1,135 wells during the twelve months ended December 31, 2015.
Cost of sales
Cost of sales was $53.8 million, or 54.7% of revenues, for the twelve months ended December 31, 2016 as compared to $54.7 million, or 48.0% of revenues, for the twelve months ended December 31, 2015. The decrease
60
Table of Contents
in cost of sales was primarily a result of a decline in the number of wells completed, partially offset by the higher volume of product sales. The higher percentage of revenues is related to the realized pricing concessions on all product lines in addition to the specific lower pricing related to excess inventory sales made at discounted prices. We believe we have reduced our excess inventory and the impact from any discounted sales will be less significant going forward. Offsetting some of these negative effects was improved pricing in conjunction with our strategic decision to manufacture products with a new international vendor in Mexico to produce certain products at a significantly lower cost, which began in the second quarter of 2016.
Selling, general and administrative expenses
SG&A expenses were $37.1 million for the twelve months ended December 31, 2016 as compared to $37.8 million for the twelve months ended December 31, 2015. The decrease was the direct result of headcount reductions in all functional areas, with the exception of engineering. In addition, discretionary spending was reduced to improve profitability during the prolonged market downturn. Offsetting these operating expense reductions were significant additional expenses incurred related to the initial public offering process.
Depreciation
Depreciation was $1.8 million for the twelve months ended December 31, 2016 as compared to $2.7 million for the twelve months ended December 31, 2015. The decrease is attributable to the reduction in the company’s fleet of trucks along with a portion of our service tools becoming fully depreciated at the end of 2015.
Amortization
Amortization was $23.8 million for the twelve months ended December 31, 2016 as compared to $24.6 million for the twelve months ended December 31, 2015. The majority of the decrease in amortization was due to the decrease in the exchange rate between the Canadian dollar and the U.S. dollar from an average of 0.795 U.S. dollars per Canadian dollar for the twelve months ended December 31, 2015 to an average of 0.755 U.S. dollars per Canadian dollar for the twelve months ended December 31, 2016.
Interest (expense), net
Interest expense was $6.3 million for the twelve months ended December 31, 2016 as compared to $8.1 million for the twelve months ended December 31, 2015. The decrease was due to lower average debt outstanding for the twelve months ended December 31, 2016 as a result of a prepayment made on our Term Loan in December 2015 of $40.0 million in addition to a small favorable foreign exchange effect due to the weakening of the Canadian dollar of $0.2 million.
Other income (expense) net
Other expense, net was $0.05 million for the twelve months ended December 31, 2016 as compared to other income, net of ($0.1) million for the twelve months ended December 31, 2015.
Foreign currency exchange (loss) gain
Foreign currency exchange loss was ($2.5) million for the twelve months ended December 31, 2016 as compared to a gain of $25.8 million for the twelve months ended December 31, 2015. The decrease was directly due to the change in foreign currency exchange rates between the periods and the effect that the change had on the outstanding balance of debt on our Senior Secured Credit Facilities, which is denominated in Canadian dollars, within each respective period. Foreign exchange rates between the U.S. dollar and the Canadian dollar increased from 0.723 U.S. dollars per Canadian dollar to 0.744 U.S. dollars per Canadian dollar, or 2.9%, over the period from January 1, 2016 to December 31, 2016. The rate during the same period in 2015 dropped 16.1% from a beginning rate of 0.862 U.S. dollars per Canadian dollar to 0.723 U.S. dollars per Canadian dollar.
61
Table of Contents
Income tax expense (benefit)
Income tax benefit was ($8.8) million for the twelve months ended December 31, 2016 as compared to a benefit of ($16.2) million for the twelve months ended December 31, 2015. For the twelve months ended December 31, 2016 and 2015 our effective income tax rates were approximately 33.0% and (137.5%), respectively. The difference in the effective income tax rate for the twelve months ended December 31, 2016 and for the twelve months ended December 31, 2015 was due to a tax planning strategy implemented in 2015 and the effect of our outside basis book and tax differences in our Canadian subsidiary. The tax planning strategy was a change to the foreign company’s year end to conform to United States income tax reporting.
Quarterly Results of Operations
The following table sets forth statement of operations data for each of the quarters presented during the year ended December 31, 2016. We have prepared the quarterly statement of operations data on a basis consistent with the audited consolidated financial statements included elsewhere in this prospectus. In the opinion of management, the financial information reflects all adjustments, consisting of normal recurring adjustments, which we consider necessary for a fair presentation of this data. This information should be read in conjunction with the audited consolidated financial statements and related notes included elsewhere in this prospectus. The results of historical periods are not necessarily indicative of the results for any future period.
| Three months ended, | ||||||||||||||||
| March 31, 2016 |
June 30, 2016 |
September 30, 2016 |
December 31, 2016 |
|||||||||||||
| (unaudited) | ||||||||||||||||
| (in thousands, except share and per share amounts) | ||||||||||||||||
| Product sales and services revenue |
$ | 23,107 | $ | 11,281 | $ | 28,650 | $ | 35,441 | ||||||||
| Cost of product sales and services (exclusive of depreciation and amortization expense shown below) |
12,695 | 6,489 | 14,713 | 19,936 | ||||||||||||
| Selling, general and administrative expenses |
8,455 | 8,417 | 8,491 | 11,698 | ||||||||||||
| Depreciation and amortization |
6,223 | 6,542 | 6,463 | 6,339 | ||||||||||||
|
|
|
|
|
|
|
|
|
|||||||||
| (Loss) from operations |
(4,266 | ) | (10,167 | ) | (1,017 | ) | (2,532 | ) | ||||||||
| Interest (expense) |
(1,466 | ) | (1,590 | ) | (1,682 | ) | (1,548 | ) | ||||||||
| Other income (expense), net |
26 | (37 | ) | (18 | ) | 74 | ||||||||||
| Foreign currency exchange (loss) gain |
(5,878 | ) | (451 | ) | 1,615 | 2,192 | ||||||||||
|
|
|
|
|
|
|
|
|
|||||||||
| (Loss) income before income tax expense |
(11,584 | ) | (12,245 | ) | (1,102 | ) | (1,814 | ) | ||||||||
| Income tax (benefit) |
(3,458 | ) | (3,655 | ) | (822 | ) | (883 | ) | ||||||||
|
|
|
|
|
|
|
|
|
|||||||||
| Net (loss) |
$ | (8,126 | ) | $ | (8,590 | ) | $ | (280 | ) | $ | (931 | ) | ||||
|
|
|
|
|
|
|
|
|
|||||||||
| Per share information: |
||||||||||||||||
| Basic net (loss) per share |
$ | (0.24 | ) | $ | (0.25 | ) | $ | (0.01 | ) | $ | (0.03 | ) | ||||
|
|
|
|
|
|
|
|
|
|||||||||
| Diluted net (loss) per share |
$ | (0.24 | ) | $ | (0.25 | ) | $ | (0.01 | ) | $ | (0.03 | ) | ||||
|
|
|
|
|
|
|
|
|
|||||||||
| Weighted average common shares outstanding: |
||||||||||||||||
| Basic |
34,018,926 | 34,000,578 | 34,004,569 | 34,005,978 | ||||||||||||
|
|
|
|
|
|
|
|
|
|||||||||
| Diluted |
34,018,926 | 34,000,578 | 34,004,569 | 34,005,978 | ||||||||||||
|
|
|
|
|
|
|
|
|
|||||||||
Seasonality
A substantial portion of our business is subject to quarterly variability. In Canada, we typically experience higher activity levels in the first quarter and fourth quarter of each year, as our customers take advantage of the winter freeze to gain access to remote drilling and production areas. In the past, our revenue in Canada has declined during the second quarter due to warming weather conditions that result in thawing, softer ground, difficulty accessing drill sites and road bans that curtail drilling and completion activity. Access to well sites
62
Table of Contents
typically improves throughout the third quarter in Canada, leading to activity levels that are higher than in the second quarter, but lower than activity in the first and fourth quarters. Our business can also be impacted by a reduction in customer activity during the winter holidays in late December and early January.
Liquidity and Capital Resources
Our primary sources of liquidity are, and after the completion of this offering are expected to continue to be, our existing cash and cash equivalents, cash provided by operating activities, borrowings under our Senior Secured Credit Facilities, proceeds from sales of our equity securities and proceeds from this offering. As of December 31, 2016, we had cash and cash equivalents of $18.3 million and availability under the Revolving Credit Facility of $20.0 million. Our total indebtedness was $90.8 million as of December 31, 2016. See “Description of Material Indebtedness.” After giving effect to the application of the estimated net proceeds from this offering, we expect to have no indebtedness. See “Use of Proceeds.” Additionally, concurrently with the closing of this offering, we and certain of our subsidiaries intend to enter into the New Senior Secured Credit Facility. The New Senior Secured Credit Facility consists of revolving credit facilities in aggregate principal amount of $50.0 million. See “Description of Material Indebtedness—New Senior Secured Credit Facility.”
Our principal liquidity needs have been, and are expected to continue to be, capital expenditures, working capital, debt service and potential mergers and acquisitions. On February 1, 2017, we contributed $5.4 million in exchange for a 50% interest in a joint venture, which was funded from available cash. Concurrent with entering into the joint venture, we made a $3.0 million Term Loan prepayment, also funded from available cash, and the previous owner of the 50% interest repaid in full a $1.0 million promissory note to us. Historically capital expenditures have been relatively modest, but future planned capital expenditures include investing in our owned facility in Canada to create a research and development facility for product development as well as to more fully demonstrate the capabilities and benefits of our products to our customers. We plan to incur approximately $5.0 million to $8.0 million in capital expenditures in 2017.
We believe that our cash flow from operations, availability under our credit facilities and available cash and cash equivalents will be sufficient to meet our liquidity needs for at least the foreseeable future. We anticipate that to the extent that we require additional liquidity, it will be funded through the incurrence of additional indebtedness, the proceeds of equity issuances, or a combination thereof. We cannot assure you that we will be able to obtain this additional liquidity on reasonable terms, or at all. Our liquidity and our ability to meet our obligations and fund our capital requirements are also dependent on our future financial performance, which is subject to general economic, financial and other factors that are beyond our control. Accordingly, we cannot assure you that our business will generate sufficient cash flow from operations or that funds will be available from additional indebtedness, the capital markets or otherwise to meet our liquidity needs. Although we have no current plans to do so, if we decide to pursue one or more significant acquisitions, we may incur additional debt or sell additional equity to finance such acquisitions, which would result in additional expenses or dilution.
Cash Flows
The following table provides a summary of cash flows from operating, investing and financing activities for the periods presented:
| Years Ended December 31, |
||||||||
| 2016 | 2015 | |||||||
| (in thousands) | ||||||||
| Net cash provided by operating activities |
$ | 10,684 | $ | 4,369 | ||||
| Net cash (used in) investing activities |
(1,840 | ) | (1,221 | ) | ||||
| Net cash (used in) financing activities |
(315 | ) | (12,766 | ) | ||||
| Effect of exchange rate changes on cash and cash equivalents |
201 | (1,008 | ) | |||||
|
|
|
|
|
|||||
| Net change in cash and cash equivalents |
$ | 8,730 | $ | (10,626 | ) | |||
|
|
|
|
|
|||||
63
Table of Contents
Operating Activities
Net cash provided by operating activities was $10.7 million and $4.4 million for the twelve months ended December 31, 2016 and 2015, respectively. The increase in 2016 was primarily related to an increase in business activity in the fourth quarter that resulted in accounts payable, accrued expenses and taxes payable all being higher, along with lower inventory. Offsetting these increases were higher accounts receivables and lower net income for the year.
Investing Activities
Net cash used in investing activities was $1.8 million and $1.2 million for the twelve months ended December 31, 2016 and 2015, respectively. The increase in cash used in investing activities during the twelve months ended December 31, 2016 as compared to the twelve months ended December 31, 2015 primarily was due to the funding of a $1.0 million short term loan to a supply chain partner to support expenditures required for our business activity.
Financing Activities
The net cash used in financing activities was $0.3 million and $12.8 million for the twelve months ended December 31, 2016 and 2015, respectively. The cash used in financing activities for twelve months ended December 31, 2015 primarily related to amortization payments of the Term Loan under our Senior Secured Credit Facilities.
Senior Secured Credit Facilities
On August 7, 2014, Pioneer Investment, Inc. and Pioneer Intermediate, Inc., each wholly owned subsidiaries of the company along with certain of their subsidiaries entered into our Senior Secured Credit Facilities. As of December 31, 2016, we had $90.8 million outstanding under the Term Loan under our Senior Secured Credit Facilities and no debt outstanding under the Revolving Credit Facility. Availability under the Revolving Credit Facility was $20.0 million at December 31, 2016.
Our Senior Secured Credit Facilities were amended on April 15, 2015 to, among other things, amend certain financial covenants contained therein. Our Senior Secured Credit Facilities were further amended on December 22, 2015 to, among other things, further amend the financial covenants, to evidence the prepayment of the Term Loan in an amount of $55,784,000 CAD and the reduction of the commitments under our Revolving Credit Facility from $38,430,000 CAD to $27,800,000 CAD and to reduce the amount available for swingline loans under our Revolving Credit Facility from $10,000,000 CAD to $5,000,000 CAD.
Borrowings under our Senior Secured Credit Facilities bear interest at a rate per annum equal to the applicable margin plus a base rate determined by reference to the highest of either: (a) in the case of loans denominated in U.S. dollars, at our election, either (i) (A) the federal funds rate plus 0.5%, (B) one-month LIBOR plus 1.00% and (C) the prime commercial lending rate of the administrative agent as in effect on the relevant day or (ii) the LIBOR rate determined by reference to the applicable Reuters screen two business days prior to the commencement of the interest period relevant to the subject borrowing or (b) in the case of loans denominated in Canadian dollars, at our election, either (i)(A) the prime commercial lending rate of the administrative agent as in effect on the relevant day for determining interest rates on Canadian dollar denominated commercial loans made in Canada and (B) CDOR plus 1.0% or (ii) the CDOR rate determined by reference to the applicable Reuters screen page for a term equal to the interest period or contract period relevant to the subject borrowing. The applicable margin is determined based upon the leverage ratio of the company. See “Description of Material Indebtedness.”
The credit agreement governing our Senior Secured Credit Facilities requires us to comply with certain affirmative and negative covenants. As of December 31, 2016 and 2015, we were in compliance with all such
64
Table of Contents
covenants. The obligations under our Senior Secured Credit Facilities are secured by first priority security interests in substantially all of the assets of the Company and the guarantors.
Contractual Obligations
The following table presents our contractual obligations and other commitments as of December 31, 2016.
| Total | Less than 1 year |
1-3 years | 3-5 years | More than 5 years |
||||||||||||||||
| (in thousands) | ||||||||||||||||||||
| Equipment lease obligations |
$ | 454 | $ | 246 | $ | 196 | $ | 12 | $ | — | ||||||||||
| Senior Secured Credit Facilities |
90,836 | 772 | 90,064 | — | — | |||||||||||||||
| Interest on long-term debt |
12,259 | 5,441 | 6,818 | — | — | |||||||||||||||
| Equipment and office operating leases |
4,090 | 1,499 | 2,168 | 392 | 31 | |||||||||||||||
|
|
|
|
|
|
|
|
|
|
|
|||||||||||
| $ | 107,639 | $ | 7,958 | $ | 99,246 | $ | 404 | $ | 31 | |||||||||||
|
|
|
|
|
|
|
|
|
|
|
|||||||||||
Off-Balance Sheet Arrangements
We have no off-balance sheet financing arrangements.
Critical Accounting Policies
Our discussion and analysis of our financial condition and results of operations is based upon our consolidated financial statements, which have been prepared in accordance with GAAP. The preparation of these consolidated financial statements requires us to make estimates and judgments that affect the reported amounts of assets, liabilities, revenue and expenses. Certain of our accounting policies require the application of significant judgment by management in selecting the appropriate assumptions for calculating financial estimates. By their nature, these judgments are subject to an inherent degree of uncertainty. Our actual results may differ from these estimates. The accounting policies that we believe to be the most critical to an understanding of our financial condition and results of operations and that require the most complex and subjective management judgments are discussed below.
Revenue Recognition
We recognize revenue when it is determined that the following criteria are met: (i) persuasive evidence of an arrangement exists; (ii) delivery has occurred or services have been rendered; (iii) the fee is fixed or determinable; and (iv) collectability is reasonably assured. Proceeds from customers for the cost of oilfield service equipment that is damaged or lost-in-hole are reflected as revenues. For the twelve months ended December 31, 2016, the company recognized revenue from its largest customer totaling approximately $25.5 million, or 26%. Amounts due from this customer included in trade accounts receivable was approximately $7.8 million, or 24% of trade accounts receivable, as of December 31, 2016. No other customer individually accounted for 10% or more of our consolidated revenue during 2016 or trade receivable accounts balance as of December 31, 2016. For the twelve months ended December 31, 2015 the same customer accounted for $35.1 million, or approximately 31% of total revenue, and as of December 31, 2015, $4.4 million in trade accounts receivable were due from this customer, or 17% of trade accounts receivable.
We recognize revenue based upon a purchase order, contract or other persuasive evidence of an arrangement with the customer that includes a fixed or determinable price, provided that collectability is reasonably assured, but it does not include right of return or other similar provisions or other significant post-delivery obligations. Revenue is recognized for products generally upon installation and when the customer assumes the risks and rewards of ownership. In cases where services are being performed, we generally do not recognize revenue until a job has been completed, which includes a customer signature or acknowledgement and that there are no
65
Table of Contents
additional services or future performance obligations required by us. Rates for services are typically priced on a per day, per man-hour or similar basis that include both the cost of the downhole frac isolation assembly and our personnel required to supervise the operation of the assembly. Proceeds from customers for the cost of oilfield equipment that is damaged or lost-in-hole are reflected as revenues when payment is received.
Historically, we have not experienced significant customer complaints regarding our products or services and therefore we have elected not to implement separate warranty provisions, and instead record any such instances on an actual basis as they occur.
Allowance for Doubtful Accounts
We maintain an allowance for doubtful accounts for estimated losses that may result from the inability of our customers to make required payments. Earnings are charged with a provision for doubtful accounts based on a current review of the collectability of customer accounts by management. Such allowances are based upon several factors including, but not limited to, credit approval practices, industry and customer historical experience as well as the current and projected financial condition of the specific customer. Accounts deemed uncollectible are applied against the allowance for doubtful accounts. We have recorded approximately $70,000 and $445,000 in provisions for doubtful accounts as of December 31, 2016 and 2015, respectively.
Inventories
Inventories consist primarily of raw material, sliding sleeve components, assembled sliding sleeves and certain components used to construct our frac isolation assemblies. Inventories are stated at the lower of cost or estimated net realizable value. Cost is determined at standard costs approximating the first-in first-out basis. We continuously evaluate inventories, based on an analysis of inventory levels, historical sales experience and future sales forecasts, to determine obsolete, slow-moving and excess inventory. Adjustments to reduce such inventory to its estimated recoverable value have been recorded by management as an adjustment to cost of sales.
Property and Equipment
Property and equipment are stated at cost less accumulated depreciation. Equipment held under capital leases are stated at the present value of minimum lease payments. Expenditures for property and equipment and for items which substantially increase the useful lives of existing assets are capitalized at cost and depreciated over their estimated useful life utilizing the straight-line method. Routine expenditures for repairs and maintenance are expensed as incurred. Depreciation is calculated over the estimated useful lives of the related assets using the straight-line method. Leasehold improvements and property under capital leases are amortized over the shorter of the remaining lease term or useful life of the related asset. Depreciation expense includes amortization of assets under capital leases. The cost and related accumulated depreciation of assets retired or otherwise disposed of are eliminated from the accounts, and any resulting gains or losses are recognized in other (expense) income, net in the year of disposal.
Depreciation on property and equipment, including assets held under capital leases, is calculated using the straight-line method over the following useful service lives or lease term (which includes reasonably assured renewal periods):
| Years | ||||
| Buildings |
30 | |||
| Building equipment |
5-15 | |||
| Machinery and equipment |
12 | |||
| Furniture and fixtures |
3-5 | |||
| Computers and software |
3-5 | |||
| Vehicles and service equipment |
3-4 | |||
| Leasehold improvements |
Lease term (1-4 | ) | ||
66
Table of Contents
We periodically assess potential impairment of our property and equipment, when events or changes in circumstances occur that indicate the carrying value of the asset or asset group may not be recoverable. The assessment of possible impairment is based on our overall valuation calculation using forward looking as well as historical computations to measure the value of the company. If the overall valuation results are less than the carrying value of such assets, an impairment loss with respect to property and equipment is recognized for the difference between estimated fair value and carrying value. No impairment loss has been recognized for the years ended December 31, 2016 and 2015.
Goodwill and Intangible Assets
For goodwill, an assessment for impairment is performed annually or when there is an indication an impairment may have occurred. We complete our annual impairment test for goodwill using an assessment date in the fourth quarter of each fiscal year. Goodwill is reviewed for impairment by comparing the carrying value of the reporting unit’s net assets (including allocated goodwill) to the fair value of the reporting unit. The fair value of the reporting unit is determined using a discounted cash flow approach. Determining the fair value of a reporting unit requires the use of estimates and assumptions. The principal estimates and assumptions that we use include revenue growth rates, operating margins, weighted average costs of capital, a terminal growth rate, and future market conditions. We believe that the estimates and assumptions used in impairment assessments are reasonable. If the reporting unit’s carrying value is greater than its fair value, a second step is performed whereby the implied fair value of goodwill is estimated by allocating the fair value of the reporting unit in a hypothetical purchase price allocation analysis. We recognize a goodwill impairment charge for the amount by which the carrying value of goodwill exceeds its fair value. Any impairment losses are reflected in operating income. We concluded that there was no impairment of goodwill in 2016 or 2015, based on our annual impairment analysis.
All identifiable intangibles are amortized on a straight-line basis over the estimated useful life or term of related agreements as indicated above. Deferred loan costs are amortized to interest expense using the effective interest method. These assets are tested for impairment whenever events or changes in circumstances indicate that their carrying amount may not be recoverable. We concluded there was no impairment of identifiable intangibles in 2016 or 2015.
Income Taxes
NCS Multistage Holdings, Inc. is taxed as a corporation as defined under the Internal Revenue Code. The liability method is used in accounting for deferred income taxes. Under this method, deferred tax assets and liabilities are determined based on the difference between the financial reporting and tax bases of assets and liabilities and are measured using the enacted tax rates and laws that will be in effect when these differences are expected to reverse. The realizability of deferred tax assets is evaluated annually and a valuation allowance is provided if it is more likely than not that the deferred tax assets will not give rise to future benefits. We recognize tax benefits from uncertain tax positions only if it is more likely than not that the tax position will be sustained, based upon technical merits, upon examination by the taxing authorities. If the income tax position is expected to meet the more likely than not criteria, the benefit recorded in the consolidated financial statements equals the largest amount that is greater than 50% likely to be realized upon its ultimate settlement. A valuation allowance to reduce deferred tax assets is established when it is more likely than not that some portion or all the deferred tax assets will not be realized. As of December 31, 2016 and 2015, the valuation allowance was approximately $63,000 and $63,000, respectively. We recognize accrued interest and penalties related to uncertain tax positions in other income (expense). During the twelve months ended December 31, 2016 and 2015, we recognized approximately $129,000 and $82,000, respectively, in interest and penalties. We had approximately $411,000 and $664,000 in interest and penalties accrued at December 31, 2016 and 2015, respectively.
Our Canadian subsidiary guaranteed the credit facilities of our U.S. entities. Under U.S. federal income tax rules, this guarantee results in all of the earnings and profits of our Canadian subsidiary being subject to current U.S. tax. As a result, we have recognized a U.S. deferred tax liability related to a portion of our outside basis differences in our Canadian subsidiary for which we are unable to assert indefinite reinvestment. No U.S. deferred taxes have been recognized on the portion of our outside basis differences that we continue to
67
Table of Contents
indefinitely reinvest. Upon reversal of these outside basis differences through dividends or otherwise, we may be subject to U.S. income taxes (subject to adjustment for foreign tax credits) and foreign withholding taxes. It is not practical, however, to estimate the amount of taxes that may be payable on the eventual remittance of these temporary differences after consideration of available foreign tax credits.
We completed our analysis of our tax positions and believe there are no material uncertain tax positions that would require derecognition in the consolidated financial statements as of December 31, 2016 and 2015. We believe that there are no tax positions taken or expected to be taken that would significantly increase or decrease unrecognized tax benefits within the next twelve months following the balance sheet date. As of December 31, 2016 and 2015, there were no material amounts that had been accrued with respect to uncertain tax positions.
We file income tax returns in the United States and in various state and foreign jurisdictions. Our U.S. income tax returns for 2011 and subsequent years remain open for examination. The Internal Revenue Service (“IRS”) commenced an examination of our United States income tax return for 2011 through 2012 in the first quarter of 2014 which was completed in 2015. No tax adjustments were proposed. Additionally, subsequent to December 31, 2015, the IRS commenced an examination of our United States income tax return for 2014 in the second quarter of 2016. No tax adjustments have been proposed.
Share-Based Compensation
We recognize compensation cost for all share-based payment transactions with employees, including compensation cost associated with the grant of options for our common stock using the fair value method. Expense is recognized over the requisite service period based upon the number of options or shares expected to ultimately vest.
The following table presents the timing of time vested options granted, number of underlying shares and related exercise prices of stock options granted between January 1, 2015 and December 31, 2016, along with the fair value per share of common stock utilized to calculate share-based compensation expense.
| Grant Timing |
Shares Underlying Options |
Common Stock Fair Value Per Share as of Grant Date |
Exercise Price Per Option |
|||||||||
| 2015: |
||||||||||||
| First Quarter |
— | $ | — | $ | — | |||||||
| Second Quarter |
13,605 | $ | 4.84 | $ | 11.82 | |||||||
| Third Quarter |
— | $ | — | $ | — | |||||||
| Fourth Quarter |
8,289 | $ | 9.55 | $ | 0.003 | |||||||
| 2016: |
||||||||||||
| First Quarter |
— | $ | — | $ | — | |||||||
| Second Quarter |
11,796 | $ | 4.24-4.47 | $ | 8.96-9.55 | |||||||
| Third Quarter |
12,552 | $ | 4.40-5.45 | $ | 9.55-9.81 | |||||||
| Fourth Quarter |
— | $ | — | $ | — | |||||||
Determining fair market value
Determining the appropriate fair value model and calculating the fair value of options requires the input of highly subjective assumptions, including the expected volatility of the price of our stock, the risk-free rate, the expected term of the options and the expected dividend yield of our common stock. These estimates involve inherent uncertainties and the application of management’s judgment. If factors change and different assumptions are used, our share-based compensation expense could be materially different in the future. We estimate the fair value of each option grant using the Black-Scholes option-pricing model. The Black-Scholes option pricing model requires estimates of key assumptions based on both historical information and management judgment regarding market factors and trends.
68
Table of Contents
Expected volatility—We developed our expected volatility by using the historical volatilities of the our peer group of public companies for a period equal to the expected life of the option by taking the median of the annualized weekly ten year standard deviation of their stock prices.
Risk-free interest rate—The risk-free interest rates for options granted are based on the ten year constant maturity Treasury bond rates whose term is consistent with the expected life of an option from the date of grant.
Expected term—As we do not have sufficient historical experience for determining the expected term of the stock option awards granted, we based our expected term for awards issued to employees on the “simplified” method under the provisions of ASC Topic 718-10, Compensation-Stock Compensation. The expected term is based on the midpoint between the vesting date and contractual term of an option. The expected term represents the period that our stock-based awards are expected to be outstanding.
Expected dividend yield—We do not anticipate paying cash dividends on our shares of common stock; therefore, the expected dividend yield is assumed to be zero.
The fair value of each option granted in 2015 and 2016 was estimated on the date of grant using the Black-Scholes- Merton method, with the following weighted average assumptions being used:
| Years Ended December 31, |
||||||||
| 2016 | 2015 | |||||||
| Expected volatility |
42-44.7 | % | 43 | % | ||||
| Average risk free interest rate |
1.69 | % | 2.29 | % | ||||
| Expected term (in years) |
6.5 | 6.5 | ||||||
| Expected dividends |
— | — | ||||||
In conjunction with the stock options issued above, we also issued “Liquidity Awards.” These Liquidity Awards will become 100% vested on the effective date of a change in control of the company. Accordingly, no value has been reflected in the consolidated financial statements for the Liquidity Awards as the stock options will not vest until the occurrence of a change in control event. The completion of this offering will not constitute a change in control event. In connection with this offering, the Liquidity Awards shall be amended to provide that such awards shall vest over three years, with 33% vesting each year beginning on the first anniversary of the consummation of this offering, subject to accelerated vesting upon a Company Sale (as defined in our 2012 Equity Incentive Plan), provided that on each applicable vesting date the award holder is still employed by us.
Qualitative and Quantitative Disclosures About Market Risk
Commodity Price Risk
The market for our products and services is indirectly exposed to fluctuations in the prices of crude oil and natural gas to the extent such fluctuations impact drilling and completion activity levels and thus impact the activity levels of our customers in the exploration and production industries. Additionally, because we do not sell our products under long-term contracts, we believe we are particularly exposed to short-term fluctuations in the prices of crude oil and natural gas. We do not currently intend to hedge our indirect exposure to commodity price risk.
Foreign Currency Exchange Rate Risk
A substantial amount of our revenues are derived in Canada and, accordingly, our competitiveness and financial results are subject to foreign currency fluctuations where revenues and costs are denominated in Canadian dollars rather than U.S. dollars. During the twelve months ended December 31, 2016 and 2015, approximately 71% and 66%, respectively, of our revenues were attributable to our operations in Canada. We have indirectly hedged our exposure to adverse changes in foreign currency exchange rates by having our Senior Secured Credit Facilities denominated in Canadian dollars, which allows us to have a significant amount of our fixed costs related to interest and principal payments on our Senior Secured Credit Facilities denominated in Canadian dollars. In connection with this offering we intend to repay the Term Loan under our Senior Secured
69
Table of Contents
Credit Facilities in full and may use foreign currency forward exchange contracts to hedge our future exposure to the Canadian dollar.
Interest Rate Risk
We are primarily exposed to interest rate risk through our Revolving Credit Facility and the Term Loan under our Senior Secured Credit Facilities. As of December 31, 2016, we had $90.8 million, in variable rate long-term debt outstanding under our Term Loan, which bears interest at a rate per annum equal to the applicable margin, plus a base rate determined by reference to the highest of either: (a) in the case of loans denominated in U.S. dollars, at our election, either (i) (A) the federal funds rate plus 0.5%, (B) one-month LIBOR plus 1.00% and (C) the prime commercial lending rate of the administrative agent as in effect on the relevant day or (ii) the LIBOR rate determined by reference to the applicable Reuters screen two business days prior to the commencement of the interest period relevant to the subject borrowing or (b) in the case of loans denominated in Canadian dollars, at our election, either (i)(A) the prime commercial lending rate of the administrative agent as in effect on the relevant day for determining interest rates on Canadian dollar denominated commercial loans made in Canada and (B) CDOR plus 1.0% or (ii) the CDOR rate determined by reference to the applicable Reuters screen page for a term equal to the interest period or contract period relevant to the subject borrowing.
As of December 31, 2016, we had no borrowings outstanding under our Revolving Credit Facility. We expect to repay our Term Loan with the net proceeds of this offering. We also expect to terminate our Senior Secured Credit Facilities following the closing of this offering and enter into a new revolving credit facility at or shortly after the closing of this offering. See “Description of Material Indebtedness—New Senior Secured Credit Facility.”
Credit Risk
Our customers are E&P companies and other oilfield services companies. This concentration of counterparties operating in a single industry may increase our overall exposure to credit risk, in that the counterparties may be similarly affected by changes in economic, regulatory or other conditions. We manage credit risk by analyzing the counterparties’ financial condition prior to accepting new customers and prior to adjusting existing credit limits.
Effects of Inflation
We do not believe that the effects of inflation have had a material effect on our business, financial condition or results of operations. However, if our costs become subject to significant inflationary pressures, we may not be able to offset such increased costs through price increases. Our inability or failure to offset any such cost increases in the future could have a material adverse effect on our business, financial condition and results of operations.
Recently Issued Accounting Pronouncements
In February 2016, the FASB issued Accounting Standards Update (“ASU”) No. 2016-02, Leases (ASC 842), which replaces the existing guidance in ASC 840, Leases. ASC 842 requires lessees to recognize most leases on their balance sheets as lease liabilities with corresponding right-of-use assets. The new lease standard does not substantially change lessor accounting. The new standard is effective for interim and annual reporting periods beginning after December 15, 2018, with early adoption permitted. We are currently evaluating the impact of the adoption of this guidance.
In November 2015, the FASB issued ASU No. 2015-17, Balance Sheet Classification of Deferred Taxes. This standard requires all deferred taxes, along with any related valuation allowance, to be presented as a noncurrent deferred asset or liability. The guidance is effective for fiscal years beginning after December 15, 2016, and includes interim periods within those fiscal years. Early adoption is permitted and the guidance may be applied either prospectively, for all deferred tax assets and liabilities, or retrospectively by reclassifying the comparative balance sheet. We do not expect this ASU to have a material impact on our financial statements.
In July 2015, the FASB issued ASU No. 2015-11, Simplifying the Measurement of Inventory, which requires companies to measure inventory at the lower of cost or net realizable value rather than at the lower of cost or
70
Table of Contents
market. Net realizable value is the estimated selling price in the ordinary course of business, less reasonably predictable costs of completion, disposal and transportation. The new standard is effective for the Company for the fiscal year beginning after December 15, 2016 and interim periods within those fiscal years. The Company has early adopted the guidance of as January 1, 2016 and there was no material impact on our financial statements.
In August 2014, the FASB issued ASU No. 2014-15, Presentation of Financial Statements—Going Concern. The new standard requires management to evaluate whether there are conditions and events that raise substantial doubt about an entity’s ability to continue as a going concern for both annual and interim reporting periods. The guidance is effective for the Company for the annual period ending after December 15, 2016 and interim periods thereafter. Management performed an evaluation of the Company’s ability to fund operations and to continue as a going concern according to ASC Topic 205-40, Presentation of Financial Statements – Going Concern. The guidance did not have a material impact on our financial statements.
In May 2014, the FASB issued ASU No. 2014-09, Revenue from Contracts with Customers (Topic 606). The new standard is effective for annual reporting periods beginning after December 15, 2017 and early adoption is permitted, however, not before fiscal years beginning after December 15, 2016. Subsequent to ASU 2014-09’s issuance, Topic 606 was amended for FASB updates that changed the effective date as well as addressing certain aspects regarding new revenue standards. The comprehensive new standard will supersede existing revenue recognition guidance and require revenue to be recognized when promised goods or services are transferred to customers in amounts that reflect the consideration to which the company expects to be entitled in exchange for those goods or services. Adoption of the new rules could affect the timing of revenue recognition for certain transactions. The guidance permits two implementation approaches, one requiring retrospective application of the new standard with restatement of prior years and one requiring prospective application of the new standard with disclosure of results under old standards. We are currently evaluating this standard in order to select a transition method and effective date. We have not determined the effect of this standard on our financial statements and related disclosures.
71
Table of Contents
As a provider of multistage completion equipment and services, we participate in the market for completion equipment and services, which is estimated by Spears to be an $8.6 billion global market, 60% of which is generated in North America. The completion equipment and services sector includes large and international companies (including Halliburton Company, Schlumberger Limited, Baker Hughes Incorporated and Weatherford International Ltd.) as well as smaller, independent companies, including ourselves, that may operate in specific product or service categories within the overall market, or that operate primarily on a regional basis.
We believe that customers of completion equipment and services select providers based on a number of factors, including technology, service quality, safety track record and price. We believe that we are well-positioned to compete in all of these dimensions.
Over the past decade, E&P companies have increasingly focused on exploiting the vast hydrocarbon reserves contained in North America’s unconventional oil and natural gas reservoirs by utilizing horizontal drilling and hydraulic fracturing. According to Spears, in 2016, over 55% of all onshore wells drilled in the United States and over 80% of all onshore wells in Canada included horizontal well sections, or laterals, an increase from 30% and 62%, respectively in, 2011. According to Spears, horizontal wells accounted for 79% of total onshore drilling and completion spending in the United States and 95% of total onshore drilling and completion spending in Canada in 2016.
Hydraulic fracturing is a well stimulation technique in which rock is fractured by a pressurized fluid. The process involves the high-pressure injection of fluids and proppants into a wellbore to create cracks in the deep-rock formations. When the hydraulic pressure is removed from the well, proppants hold the fractures open, creating a conductive channel through which the hydrocarbons can flow more freely from the formation to the wellbore and then to the surface.
Multistage completion equipment and services provide entry points into the deep-rock formations to enable stimulation and provide the isolation between stages that allow for stimulation treatments to be more effective. Multistage completions in horizontal wells typically begin with a stage at the end of the lateral farthest away from the vertical section of the wellbore, often referred to as the “toe.” As an oil or natural gas well is completed, each subsequent stage is completed in succession moving from the toe to the section of the horizontal wellbore closest to the vertical section, often referred to as the “heel.” As the well is completed, each stage is isolated from the stages that have been completed before it. The process is similar in vertical wells, with the first stage completed being the one at the greatest vertical depth, and the last stage at the shallowest depth.
The most commonly used completion technique for unconventional wells is plug and perforate, or “plug and perf.” The plug and perf technique uses a tool called a perf gun to create clusters of holes, or perforations, in a section of the casing of the wellbore. After the perf gun has been removed from the well, the formation is hydraulically fractured through the newly created clusters of perforations, connecting the wellbore to the surrounding reservoir. After the frac stage is completed, the well is temporarily plugged just above the recently stimulated section and the perforation and hydraulic fracturing process is repeated until the number of desired frac stages have been placed. This technique is most commonly applied in wells in which the well’s casing or lining has been cemented in place.
“Ball drop” is another technique commonly used in open hole, or uncemented, well configurations. This technique utilizes a series of sliding sleeves pre-installed in the well’s casing or lining during well construction. Rather than using a perf gun to create openings, a specially sized ball is dropped into the well prior to each stage being hydraulically fractured. The size of the ball allows it to pass through to a matching “seat” profile on a sleeve in the well, where it acts both to enable the shifting of the sleeve, exposing ports to the formation, and to plug the wellbore below, providing isolation. Ball drop systems typically rely on different ball sizes to activate the sleeves and, as a result, the wellbore will increasingly narrow toward the “toe” and the number of sleeves and stages that can be fractured can be limited by available ball sizes.
72
Table of Contents
E&P companies have increasingly adopted techniques and equipment that drive more effective resource recovery, including longer-length well laterals, closer spacing of hydraulic fracturing stages, a higher number of stages per well and more volume of fluid and proppant used per well and per foot of lateral. Additionally, as E&P companies have begun to move toward infill and development drilling, the spacing between wells has decreased, and is expected to continue to decrease, highlighting the need for more precise drilling and completion techniques.
While plug and perf and ball drop techniques have traditionally been used in unconventional well completions, these techniques have several drawbacks that limit their ability to optimize completions and maximize hydrocarbon recovery. Limitations associated with traditional well completion techniques include:
| • | inconsistent and uncontrollable placement of fractures that cannot be reliably repeated from stage to stage due to variable breakdown pressures and leading to under-stimulation of wells; |
| • | inability to monitor downhole pressure or measure pressures and temperatures during stimulation, limiting control and making optimization more challenging; |
| • | inability to close and reopen perforations and sleeves, limiting options for customers following the initial completion; and |
| • | completion designs resulting in under-stimulation of wells to reduce the likelihood of an operational issue referred to as a “screenout” which can result in a costly recovery process. |
To reduce the amount of under-stimulated reservoir area that can occur when using these traditional techniques, many E&P companies are reducing the spacing between stages, thereby increasing the number of stages per well. However, increasing stage counts with traditional completion techniques can result in other operational inefficiencies such as increased time and expense in the case of plug and perf completions, or, in the case of ball drop completions, the inability to place the desired number of stages due to the limited number of ball and seat sizes available. We believe there is significant opportunity for growth and expansion for providers that introduce innovative technology that allows customers to efficiently increase stage counts, have more control during the well stimulation process and better measure their well completions results.
Industry Trends
The oil and natural gas industry has traditionally been volatile and is influenced by a combination of long-term, short-term and cyclical trends, including the domestic and international supply and demand for oil and natural gas, current and expected future prices for oil and natural gas and the perceived stability and sustainability of those prices, production depletion rates and the resultant levels of cash flows generated and capital allocated by exploration and production companies to their budgets for drilling, completion and production activities. The oil and natural gas industry is also impacted by general domestic and international economic conditions, political instability in oil producing countries, government regulations (both in the United States and elsewhere), levels of customer demand, the availability of pipeline capacity and other conditions and factors that are beyond our control.
Demand for our products and services depends substantially on the level of expenditures by companies in the oil and natural gas industry. The significant decline in oil and natural gas prices beginning in late 2014 continued into the first part of 2016. This low commodity price environment has caused a reduction in the drilling, completion and other production activities of most of our customers and their spending on our products and services.
The reduction in demand resulted in declining prices for our products and services, a trend that continued in the first six months of 2016. As oil and natural gas prices began to recover in mid-2016, we have experienced an increase in demand for our products and services. If near term commodity prices stabilize at or increase from current levels, we expect to experience a further increase in demand for our equipment and services.
73
Table of Contents
Although volatility is likely to persist in the industry, we believe that the following trends will positively impact the completions equipment and services market, and providers of multistage completions products and services in particular, in the coming years:
| • | Increasing global demand for crude oil and natural gas. We believe the oilfield services industry will benefit from continued increases in the demand for hydrocarbons over time, primarily resulting from increased demand from industrializing nations, including China, India, other Asian countries and the Middle East. Demand growth from these regions is projected to more than offset decreasing demand from Organization for Economic Cooperation and Development nations. In its 2016 Energy Outlook, BP p.l.c. (“BP Energy Outlook”) estimates that total oil demand will increase from approximately 92 million barrels of oil per day (“Mb/d”) in 2014 to 112 Mb/d by 2035. Over the same period, the U.S. Energy Information Administration estimates that the total demand for natural gas will increase by 1.8% per year, from approximately 128 billion Mcf (calculated in thousand cubic feet per day (“Mcf”)) to approximately 192 billion Mcf. The following charts illustrate the projected increases in demand for oil and natural gas from 2014 to 2035: |
| Global Oil Demand by Region | Global Natural Gas Demand by Sector | |
|
| ||
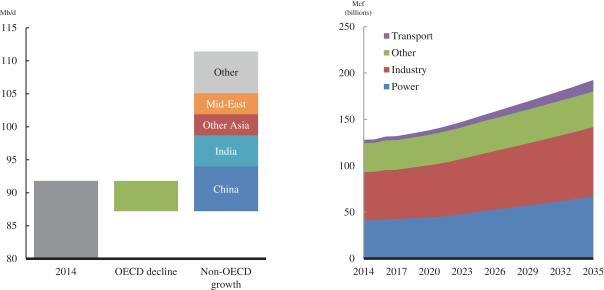
| Source: BP Energy Outlook |
Source: International Energy Outlook 2016, U.S. Energy Information Administration |
74
Table of Contents
| • | Unconventional formations are becoming a larger part of the overall hydrocarbon production mix. Increases in efficiency and the continued development and implementation of new technology have led to significant improvements in the economics of the production of unconventional formations. According to BP Energy Outlook, since 2005, tight oil has increased from less than 1% of overall global oil production to nearly 5% of overall oil production in 2014 and tight oil production growth is projected to outpace growth from all other sources, reaching nearly 10% of all oil production by 2035. The BP Energy Outlook estimates that shale gas production increased from approximately 1% of total global natural gas production in 2005 to nearly 10% of total global natural gas production in 2014 and that shale gas production is projected to continue to grow at 5.6% per year through 2035, and is projected to reach 24% of total natural gas production by 2035. The following charts illustrate the projected increases in production of global tight oil and shale gas from 2014 to 2035: |
| Global Tight Oil Production and Share | Global Shale Gas Production and Share |
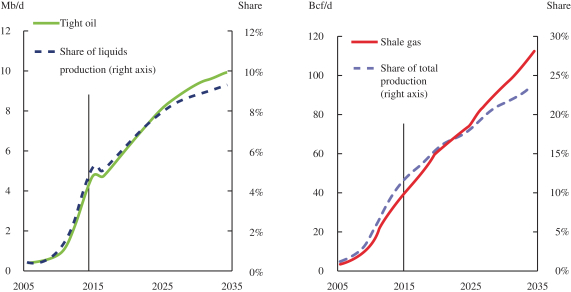
| Source: BP Energy Outlook |
Source: BP Energy Outlook |
| • | Significant new well completions are required to offset naturally-declining oil and natural gas production. Oil and natural gas production from an individual well will generally exhibit its highest production level in the months following its completion, and production will decline over time thereafter. As a result, significant drilling and completion activity is required to offset the production declines from the existing producing well base, with such declines for global oil production estimated at 6% per year by the International Energy Agency in its 2013 World Energy Outlook. Additional drilling above the level needed to offset declines is required to provide the production growth required to meet increasing global demand. Tight oil and shale gas wells typically experience faster production declines during their first few years of production than conventional wells. As a result, as tight oil and shale gas becomes a higher percentage of the global production mix, average decline rates will rise, increasing the amount of drilling and completion activity required to sustain production levels. Spears projects that the number of horizontal wells drilled in North America will increase from 11,702 in 2016 to over 25,600 in 2019, a compound annual growth rate of 29.8%. |
75
Table of Contents
| U.S. Horizontal Wells by Year | Canadian Horizontal Wells by Year | |
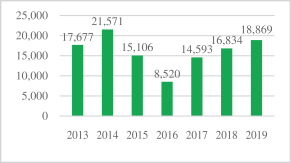
|
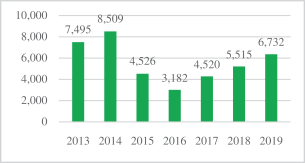
| |
| Source: Spears |
Source: Spears |
| • | Increasing completion equipment and services requirements per horizontal well. Oil and natural gas producers continue to evolve the designs in their completions of horizontal wells targeting unconventional formations. On average, horizontal laterals in wells targeting unconventional formations have been trending longer, the number of completion stages per well has been trending higher and the spacing between stages in a horizontal lateral has been decreasing. In addition, many oil and natural gas producers have been increasing the amount of proppant they are placing into their wellbores on both an aggregate basis and when measured in the amount placed per foot of the horizontal lateral. Based on estimates from the U.S. Energy Information Administration Energy, the average number of stages per horizontal well increased every year from 2006 to 2015 from fewer than 10 in 2006 to approximately 25 in 2015, and we believe this trend will continue. We expect to benefit from this trend, as the number of frac sleeves we sell is likely to increase, corresponding with increases in the average number of stages per well. |
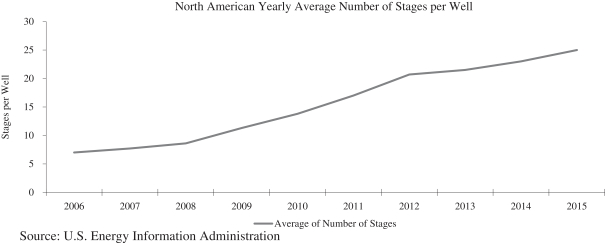
| • | Tighter well spacing and completion of multiple zones within a single productive horizon. Oil and natural gas producers have been undertaking well spacing studies to optimize the number of wells they drill and complete on their acreage. In many cases, this results in tighter well spacing. In a similar fashion, oil and natural gas companies are testing well placement strategies in which they can complete wells landed at different vertical depths targeting the same hydrocarbon-bearing formation. Tighter well spacing and placing multiple wells in the same formation can have the result of increasing the inventory of potential wells that can be drilled, completed and brought on production. As individual wellbores are placed in closer proximity to one another, we believe it is important to control the growth of hydraulic fractures to maximize production from each individual well and to minimize the risk of negatively impacting production from the surrounding wells. |
76
Table of Contents
| • | Secondary recovery strategies for horizontal wells. Wells drilled targeting unconventional formations are estimated to recover a much lower percentage of the original hydrocarbons in place than conventional sources of oil and natural gas. The U.S. Energy Information Administration estimated tight oil recovery factors to range from 3% to 7% on average and shale gas recovery factors to range from 20% to 30%. Oil and natural gas producers are evaluating and implementing strategies to increase the recovery from their existing wells, including through refracturing, waterflood and natural gas flood operations. We believe that our MultiCycle sliding sleeves provide our customers with increased long-term flexibility in pursuing secondary recovery strategies. |
77
Table of Contents
Overview
We are a leading provider of highly engineered products and support services that facilitate the optimization of oil and natural gas well completions and field development strategies. We provide our products and services primarily to E&P companies for use in onshore wells, predominantly wells that have been drilled with horizontal laterals in unconventional oil and natural gas formations. Our products and services are utilized in oil and natural gas basins throughout North America and in selected international markets, including Argentina, China and Russia. We have provided our products and services to over 140 customers in 2016, including leading large independent oil and natural gas companies and major oil companies.
Our primary offering is our Multistage Unlimited family of completion products and services, which enable efficient pinpoint stimulation: the process of individually stimulating each entry point into a formation targeted by an oil or natural gas well. Our Multistage Unlimited products and services are typically utilized in cemented wellbores and enable our customers to precisely place stimulation treatments in a more controlled and repeatable manner as compared with traditional completion techniques. Our Multistage Unlimited products and services operate in conjunction with third-party providers of pressure pumping, coiled tubing and other services.
We began providing pinpoint stimulation products and services in 2006, and since then our technology has been used in the completion of more than 7,600 wells comprising over 155,000 individual frac stages. Our initial focus on the Canadian market has resulted in our products and services being used in 26% of all horizontal wells drilled in Canada in 2016. We began our efforts to increase our penetration of the U.S. market in 2013, and the United States accounted for approximately 23% of our revenue in 2016. We are focused on increasing our market share in the United States, particularly in the Permian Basin. Sales of our products and services in the Permian Basin contributed 56% and 43% of our revenue in the United States in 2016 and 2015, respectively.
Multistage Unlimited includes our casing-installed sliding sleeves and downhole frac isolation assembly. Customers typically purchase our casing-installed sliding sleeves, a consumable product that is cemented at intervals into the casing of the wellbore, and can also utilize services associated with our downhole frac isolation assembly. Our downhole frac isolation assembly is comprised of numerous subcomponents, including a resettable bridge plug for stage isolation, a sleeve locator to efficiently locate our sliding sleeves in the wellbore, an abrasive perforating sub that can perforate the casing where our sliding sleeves are not installed and gauge packages that can measure and record downhole data. Our personnel supervise the use of the downhole frac isolation assembly during completion operations. In addition, our downhole frac isolation assembly provides valuable downhole data, including recorded downhole temperatures and pressures, which can be analyzed and used in designing future completion strategies. Further, because our downhole frac isolation assembly is deployed on coiled tubing, our customers have access to real-time downhole pressure measurements which can be used to adjust strategies during a well completion. We offer two primary models of sliding sleeves: our GripShift sliding sleeves, which open one time, and our MultiCycle sliding sleeves, which can be opened and closed multiple times giving our customers the benefit of additional completion options and the ability to better optimize a well’s production phase. We hold 23 patents related to our technology and received the World Oil Best Completions Technology Award in 2014 and 2015 for our Multistage Unlimited products and services and MultiCycle sliding sleeves, respectively.
We complement our proprietary products and services with our in-house expertise in completions engineering, reservoir engineering and geology. These capabilities allow us to engage with our customers on well completion design and well spacing decisions, thereby supporting our customers’ completion optimization strategies and building lasting relationships. In addition, our extensive research and development efforts are influenced and driven by the needs of our customers, allowing us to introduce innovative and commercial solutions that improve customer efficiency and profitability.
Our revenue for the years ended December 31, 2016 and 2015, was $98.5 million and $114.0 million, respectively. Our net income (loss) for the years ended December 31, 2016 and 2015, was $(17.9) million and
78
Table of Contents
$28.0 million, respectively. Our Adjusted EBITDA for the years ended December 31, 2016 and 2015 was $13.9 million and $26.2 million, respectively. For the definition of Adjusted EBITDA and a reconciliation to its most directly comparable financial measure calculated and presented in accordance with GAAP, please read “Summary Historical Consolidated Financial and Other Data.”
Competitive Strengths
We believe we are well positioned to achieve our business objectives based on the following competitive strengths:
| • | Patented and differentiated completions technology. Our value proposition is built on a foundation of patent-protected technology and industry leading technical capabilities. Our Multistage Unlimited products and services are designed to provide our customers with an enhanced degree of precision for more predictable, repeatable and verifiable well completions, in order to maximize reservoir connectivity while minimizing the impact of the completion on the productivity of offsetting wells. Our technology also provides E&P companies access to accurate real-time and recorded downhole information which can enhance completion and well spacing optimization strategies. This information is typically not available with traditional completion techniques. We believe that the benefits provided by our proprietary technology and our operating experience and know-how differentiate us from providers of traditional completion technologies, including plug and perf and ball drop, and from other pinpoint stimulation competitors. |
| • | Proven record of successfully introducing new technologies that drive completion and production optimization. Our research and development efforts are targeted to solve customer challenges and provide solutions that improve customer efficiency and profitability. Our in-house and field engineering teams are responsible for developing new technology to expand our product and service offerings and enhance the performance of our existing products. During the recent commodity price downturn, we accelerated our investment in these efforts, adding to our pipeline for future product and service introductions. We believe we are a leader in the development of new completions technology, which is reflected in our extensive and growing suite of patent-protected products and methods. We hold 9 U.S. patents and 14 related international patents and have 40 U.S. patent applications pending and 51 related international patents pending. We received the World Oil Best Completions Technology Award in 2014 and 2015 for our Multistage Unlimited products and services and MultiCycle sliding sleeves, respectively. We believe our engineering expertise, combined with our focus on completions technology, gives us a competitive advantage in designing and commercializing new completions technology. For example, we introduced our AirLock casing buoyancy system in late 2013 and this system has been utilized in over 1,650 wells since its introduction. The AirLock continues to increase its market penetration, with 50% more AirLocks sold in 2016 as compared to 2015, a time period in which the total number of horizontal wells drilled in the U.S. and Canada declined on a year-over-year basis. |
| • | Market leader in pinpoint stimulation. We believe we are a global leader in pinpoint stimulation products and services, based on the number of wells completed using our technology and the number of stages in the wells completed using our technology. Since our founding, our products and services have been utilized by our customers for the pinpoint completion of over 7,600 wells, resulting in the placement of over 155,000 frac stages. Our experience as a leader in pinpoint stimulation has given us the opportunity to gain valuable operational insights into the use of this stimulation technique. We have used these insights to continually improve upon our existing products and to develop new products. Our products and services have been utilized in all major unconventional oil and natural gas basins in North America and in selected global markets. Our leadership in pinpoint stimulation has led to the use of our products and services in a number of wells that include what we believe to be the highest number of stages in the following basins: 147 stages in a well in the Permian Basin, 116 stages in a well in the Marcellus shale, 134 stages in a well in the Montney, 123 stages in a well in the Duvernay, 106 stages in a well in the Cardium, 60 stages in a well in the Vaca Muerta region in Argentina and 30 stages in a well in the Khantos region in Russia. |
79
Table of Contents
| • | Asset-light business model and strong balance sheet provide significant flexibility. Throughout the commodity price downturn, we have maintained attractive margins, which we believe validates our value proposition to our customers and reflects our ability to quickly adjust our cost structure. Our Adjusted EBITDA as a percentage of revenue was 14%, 23%, 43% and 46% for the years ended December 31, 2016, 2015, 2014 and 2013, respectively. Because our business is not capital intensive, we are able to generate significant free cash flow through business cycles, with free cash flow as a percentage of revenue of 9%, 3%, 18% and 8% for the years ended December 31, 2016, 2015, 2014 and 2013, respectively. However, we had a net loss of approximately $17.9 million for the year ended December 31, 2016, which was primarily due to the effects of the commodity price downturn. By focusing on downhole completion equipment and services, and not high-cost assets deployed on the surface, such as coiled tubing or pressure pumping, our net P&E as of December 31, 2016 was $9.8 million. Sales of our products, which are consumable items, represented approximately 74% and 70% of our revenue for the years ended December 31, 2016 and 2015, respectively. We believe we have a strong balance sheet and ample liquidity to pursue our growth initiatives. At the closing of this offering, we expect to have no or minimal debt outstanding and $72.3 million in liquidity from cash on hand and $50.0 million of available borrowing capacity under our New Senior Secured Credit Facility that we expect to enter into concurrently with the closing of this offering. |
| • | Trusted advisor to a leading customer base. We have leveraged our extensive experience and differentiated products and services to establish strong relationships with our customers. For the last eight years, we have been the preferred completion technology provider to Crescent Point, our largest customer and one of Canada’s largest independent E&P companies. Our technology has been vetted and chosen by some of the largest, most sophisticated energy companies in the world, resulting in a customer base that includes more than 140 customers globally, including national, major and large independent oil companies, such as Apache Corporation, Crescent Point Energy Corp., Devon Energy Corporation, Gazprom Neft PJSC, Range Resources Corporation and Royal Dutch Shell plc. We established ATRS, a team of engineering consultants, in 2015 as a complement to our products and services to provide in-house expertise to assist our customers in optimizing their completion designs and development plans and to evaluate well performance. We believe our ATRS group has deepened our relationships with existing customers, helped us add new customers and effectively demonstrated the value proposition of our pinpoint stimulation offerings. In addition, several of our customers have worked with us to develop new completion technology for specific applications, highlighting their trust in our product development capabilities and adding to our pipeline of technologies available to all of our customers. |
| • | Experienced, entrepreneurial management team with strong culture of innovation. Our management team, led by co-founders, CEO, Robert Nipper, and President, Marty Stromquist, provides disciplined strategic direction and insight gained from multi-decade careers in the energy technology and oilfield service industries. Our founders, pioneers in pinpoint stimulation, led our company through a period of exceptional growth and provide the keystone for our culture. Our culture is defined by “The Promise,” a document that guides our relationships with our employees, customers, vendors and other stakeholders and affirms our commitment to quality and safety. We maintain our culture through the ongoing coaching of our employees and continuously measure ourselves to identify areas for improvement. Together, Mr. Nipper and Mr. Stromquist, have assembled a management team with extensive backgrounds in research and development, manufacturing, operations and finance, with an average of over 25 years of industry and otherwise relevant experience. |
Our Business Strategy
Our primary business objectives are to increase the adoption of our products and services in all geographies, continue to be an innovator of technology and create value for our stockholders. We intend to achieve these objectives through the execution of the following strategies:
| • | Focus on expansion in the United States while pursuing disciplined organic growth globally. We plan to continue to grow our business in all geographies in which we operate, with our current emphasis on |
80
Table of Contents
| profitably expanding our presence in the United States. We increased our efforts to target the U.S. market in 2013 and believe we can increase our share in all basins in the United States as our customers focus on optimizing completion designs in an effort to increase overall hydrocarbon recovery and improve financial returns from their assets. In 2016 the United States accounted for approximately 23% of our revenue. We continue to focus on growing our presence in the Permian Basin, the most active basin in the United States, which accounted for 56% of our revenue in the United States during the year ended December 31, 2016. During 2016, we expanded into a larger operational facility in Midland, Texas and directed additional sales efforts to customers operating in the Permian Basin. Outside of the United States, we plan to increase our market position in several deep basin plays in Canada, including the Montney formation, where we currently have lower, but growing, market shares relative to other regions in Canada. We also plan to increase our market position in Argentina, China, and Russia, regions where we have successful operations and which have significant unconventional resource development potential. |
| • | Develop and introduce innovative technologies that are aligned with customer needs. Our team of over 30 engineers and engineering technicians works closely with our technical services organization and our customers to identify specific product and service needs, develop business cases and bring new technology to market on an expedited basis. Collaborating with our customers allows us to identify unaddressed industry-wide needs and to develop new technologies, of which we have several under development. By introducing new technologies, we expand our product and service portfolio, grow our customer base and leverage our current customer relationships to generate additional revenue. We believe we have established strong working relationships with our customers, and we are collaborating with several of our customers on solutions for specific onshore and offshore completions needs, with NCS retaining the rights to the intellectual property derived from these projects. We expect to continue to work with our customers on specific solutions to supplement our in-house technology development efforts. |
| • | Leverage technology leadership to grow market share. Our extensive experience, differentiated offerings and focus on responding to evolving customer needs has allowed us to establish strong relationships with our customers. Over the years we have added in-house capabilities that provide additional value-added expertise and services to our customers, including completions engineering and ATRS. We believe that by focusing on customer service, while continuing to introduce innovative completions solutions, we can strengthen our relationships with existing customers, grow our customer base and increase our revenues. We believe the benefits provided by our technology and our expertise position us to continue to increase our penetration of large independent and major oil companies. We believe these customers are typically more consistent in their capital budgeting, operate in multiple geographies and in many cases are focused on evaluating and deploying technology that can improve well performance. We believe that our ability to pair our in-house expertise, together with the data that is available through our Multistage Unlimited products and services have been key factors enabling us to increase our business with these customers, which represented 45% of our revenue for the year ended December 31, 2016, as compared with 47% and 37% for the years ended December 31, 2015 and 2014, respectively. |
| • | Maintain financial strength and flexibility. We expect to continue to employ a disciplined financial policy that maintains our financial strength and flexibility. We have maintained our financial flexibility by taking actions designed to preserve positive cash flows, minimize capital expenditures and reduce debt levels. We believe our resulting financial strength and flexibility provides us with the ability to execute our strategy through industry volatility and commodity price cycles, as evidenced by our performance throughout the recent commodity price downturn. For example, during the downturn we were able to leverage our supply chain through initiatives to reduce the number of vendors in our manufacturing operations, as well as reduce our manufacturing costs for certain products by over 30%, which has supported our gross margin. We believe that our cash on hand, expected borrowing capacity and ability to access debt and equity capital markets after this offering, combined with our ability to generate free cash flow, will provide the financial flexibility required to execute our growth strategies. |
81
Table of Contents
| • | Selectively pursue complementary acquisitions and joint ventures. We believe there is an opportunity to enhance our existing product and service capabilities and geographic scope by selectively pursuing acquisitions and joint ventures. We intend to target strategic acquisitions that will enhance our market position and provide opportunities for synergies. We believe that being a public company will allow us to target a broader range of acquisition candidates. |
Our Products and Services
We provide products and services that enable pinpoint stimulation: the process of individually stimulating each entry point into a formation targeted by an oil or natural gas well. We believe that our products and services improve on traditional completion techniques. Our solutions and refined field processes are designed to enable efficient, controlled, verifiable and repeatable completions. We complement our multistage completion products and services with other efficiency-enhancing completions technologies and our multi-disciplinary engineering capabilities. Our key products and services include:
| • | Multistage Unlimited. Our Multistage Unlimited family of products and services encompasses our technology developed to enable efficient pinpoint stimulation and re-stimulation strategies. This suite of products is comprised of our casing-installed sliding sleeves and our downhole frac isolation assemblies, which are deployed using coiled tubing. Our services include advising customers on optimizing completion designs and operating the downhole frac isolation assemblies. |
| • | Casing-installed sliding sleeves. Our casing-installed sliding sleeves are a consumable product, sold to our customers and cemented in place in a well’s casing. Over 112,000 of our casing-installed sliding sleeves have been installed, including over 30,000 of our MultiCycle sliding sleeves. We produce two primary models of sliding sleeves: our GripShift sliding sleeves, which can be opened only once, and our MultiCycle sliding sleeves, introduced in late 2013, which can be opened and closed multiple times throughout the life of a well. The image below illustrates one of our MultiCycle sliding sleeves. During completion operations, the downhole frac isolation assembly is placed in the sleeve and the inner barrel of the sleeve is shifted down, exposing the frac ports to the formation, allowing the completion of that stage to begin. |
Key features of both primary models of our sliding sleeves include:
| • | no practical limitation on the number of stages in a well; |
| • | a full-drift inner-diameter that is the same as the wellbore’s casing, with no plugs or ball seats to mill or drill out; |
| • | designed for use in cemented or open-hole wellbores; and |
| • | a cumulative sleeve shifting success rate of over 99%. |
Additionally, our MultiCycle sliding sleeves provide the ability to:
| • | close the sleeves immediately following the completion of a stage to mitigate proppant flowback, enhancing conductivity and reducing the need for post-completion well cleanouts; |
| • | close off zones producing high levels of water or unwanted natural gas; |
| • | execute high rate, pinpoint refracturing strategies; and |
| • | support the conversion of a producing well to an injector well for EOR strategies, including floods and pressure maintenance. |
82
Table of Contents
| • | Downhole frac isolation assembly. Our proprietary downhole frac isolation assembly is comprised of several subcomponents. The assembly is primarily used to locate our sliding sleeves, to establish wellbore isolation and to shift our sliding sleeves open or closed. We typically own the assemblies and utilize them in our service to our customers. Our personnel operate the assemblies during completion operations in coordination with other on-site service providers. The image below illustrates a downhole frac isolation assembly designed for use with our MultiCycle sliding sleeves. |
Key features of our downhole frac isolation assembly include:
| • | a resettable bridge plug enabling the completion of all stages in a well without having to remove the assembly from the wellbore; |
| • | an abrasive perforating subassembly, which can be utilized to add stages to a well with sliding sleeves installed or as the method to establish formation access in wells not utilizing our sleeves; |
| • | gauge packages located above and below the resettable bridge plug that record pressure and temperature data; |
| • | benefits associated with having coiled tubing in the wellbore, including real-time bottom-hole pressure measurements, the ability to circulate fluids to the stage being completed and the ability to mitigate screenouts; and |
| • | a range of configurations allowing a variety of pinpoint stimulation and refracturing strategies. |
| • | Sand jet perforating. Our sand jet perforating technology uses a variation of the downhole frac isolation assembly utilized for shifting sleeves. Sand jet perforating is typically used with cemented wellbores. To cut access points into the formation, sand-laden fluid is pumped down the coiled tubing and through tungsten-carbide nozzles. The high-velocity slurry cuts through the casing and cement and into the formation. The tunnels created through this process serve as initiation points for stimulation. Stimulation treatments are pumped down the annulus between the coiled tubing and the casing. Although the sand jet perforating process requires more time per stage than using Multistage Unlimited sliding-sleeves, it provides a practical option for pinpoint stimulation in wells that are already cased, as in the case of drilled, but uncompleted wells (“DUCs”). |
| • | SpotFrac system. Our SpotFrac system provides a means to straddle and mechanically isolate producing zones for targeted refracturing applications. The system includes an sand jet perforating assembly, enabling additional stages to be added if desired, and can perforate, isolate and stimulate multiple stages in a single trip. |
| • | BallShift sleeves. Our BallShift sliding sleeves can be cemented in place and are activated by pumping a ball from surface that lands on seats in the sleeves, providing pinpoint stimulation. In some instances the BallShift sleeves will be utilized together with our coiled-tubing deployed technology in a hybrid application to increase the amount of stages that can be run in extended reach applications, with the BallShift sleeves installed at the toe of such wells. |
Multistage Unlimited Operations Overview—Well with Casing-Installed Sliding Sleeves
When it is time to complete a well using our downhole frac isolation assembly, one of our field service supervisors at the wellsite coordinates operations with the customer and the other service providers, including the coiled tubing, pressure pumping and flowback providers. After a flow path is initiated at the toe of the well, our downhole frac isolation assembly is run to the toe of the well on coiled tubing and then is slowly pulled upwards.
83
Table of Contents
When the sleeve locator assembly latches into the frac sleeve, a force signal is detected at the surface, indicating that the assembly is positioned in the sleeve. The downhole assembly is then cycled to engage its slips onto the inner barrel of the sleeve and to compress the resettable bridge plug to provide isolation. Once isolation is established, a combination of force applied from surface on the coiled tubing and hydraulic force applied to the bridge plug from fluid being pumped into the wellbore create sufficient force to shift the sleeve into the open position, locking it in place and exposing the frac ports, enabling access to the formation. The stimulation process is then initiated. At the end of the stage, the coiled tubing unit is engaged to activate the equalizing valve, which in turn decompresses the resettable bridge plug and disengages the slips. The downhole frac isolation assembly is then pulled upward until the next sleeve is located and the process is repeated until the last stage has been completed, at which point the downhole frac isolation assembly is pulled out of the hole. In most cases, the fluid and proppant used for stimulation are pumped down the annulus between the casing and the coiled tubing that is in the wellbore. When pumping at lower rates or in areas where control of the frac dimensions is essential, the stimulation in treatment is pumped through the coiled tubing itself. The gauges installed above and below the resettable bridge plug on our downhole frac isolation assembly record pressure and temperature throughout the completion operation.
Our frac engineers, technical services team, salespeople, field service supervisors and, in some instances, ATRS are involved throughout the planning, execution and evaluation of each completion utilizing our Multistage Unlimited technology. The table below illustrates the role we can play at each stage of a typical well completion:
| Pre-Job | • Collaborate with customer on well objectives and key performance indicators
• Review completion program with customer to optimize design
- Torque and drag models
- Coiled tubing force analysis
- Economic modelling of stage spacing, sleeve placement and completion design | |
| Installation | • Supervise casing-running to confirm specifications are followed | |
| Job Execution | • Prepare job procedures for the completion
• Lead pre-job meeting with customer and other services providers (pressure pumping, coiled tubing, flowback, others)
- Discuss location layout, logistics, communication protocol, screen-out procedures and contingency processes
• On-site pre-job meeting to confirm all service providers are coordinated and understand roles and responsibilities
• Confirm all pre-job procedures are completed
• Assemble and test assemblies and gauges on surface, run tools into the well
- Correlate depths with coiled tubing and drilling tally
- Test assembly and wellbore integrity
• Locate first sleeve at toe of the well
- Establish isolation, shift sleeve and pump stage
- Unset and move to the next stage; repeat
- Pressure test assembly and wellbore at each stage
• Pull out of hole, inspect assemblies and download gauge data | |
84
Table of Contents
| Post-Job Review | • Collect data from pressure pumping and coiled tubing service providers to pair with NCS gauge data
• Post-job meeting
- Review performance relative to key performance indicators
- Detailed review of gauge, coil and other data
- Provide recommendations for optimization of operations and/or job design for future wells (frac design, fluid design, cementing practices and sleeve placement)
• After three months or more of production, ATRS can review well production and pressure data to perform rate transient analysis and economic modelling
• Further input on potential impacts of changes to completion design, sleeve placement, stage spacing and well spacing |
Additional Products and Services
In addition to our Multistage Unlimited family of multistage completion products and services, we offer several other products and services that can be used on their own or in conjunction with our system.
| • | Anderson Thompson Reservoir Strategies (ATRS). Our specialized team of engineering consultants advises customers on optimized completion designs and field development strategies and evaluates well performance. ATRS helps us strengthen our relationships with our customers and has been effective at demonstrating the benefits of our Multistage Unlimited system as compared to traditional completion techniques. |
| • | AirLock casing buoyancy system. Our AirLock casing buoyancy system facilitates landing casing strings in horizontal wells without altering a customer’s preferred casing and cementing operations. The AirLock, which is installed with a well’s casing, allows the vertical casing section to be filled with fluid, while the lateral section remains air-filled and buoyant. The enhanced buoyancy significantly reduces sliding friction, while the enhanced weight of the vertical section provides the force needed to push the casing to the toe of the well, ensuring the casing reaches the desired depth and reducing casing running time and cost. Our AirLock system consists of two components that are made up in the casing string during run-in: a debris-trap and a seal collar. The debris-trap is installed in a casing connection just above the float shoe and the seal collar is installed at the bottom-most point of the vertical portion of the wellbore. The seal collar contains a breakable seal that locks air in the lower section of casing while the upper section is run and filled with fluid. After the casing is landed, surface pressure is increased to fragment the seal at a predetermined pressure, leaving an unrestricted casing bore, while seal fragments are collected by the debris trap, facilitating cementing operations. |
| • | Liner hanger systems. Introduced in late 2014, our proprietary Vector Max and Vector-1 liner hanger systems are specifically designed to perform in complex horizontal wells and are fully compatible with our Multistage Unlimited products. The liner hanger is used to distribute the loads and weight of the liner to the supporting casing. |
Intellectual Property and Patent Protection
We have dedicated resources toward the development of new technology and products designed to enhance the safety and efficiency of well completions processes. Our sales and earnings are influenced by our ability to successfully introduce new or improved products to the market. Our MultiCycle sliding sleeves, downhole frac isolation assembly and other equipment involve a high degree of proprietary technology developed over several years, some of which is protected by patents.
85
Table of Contents
We hold 9 U.S. patents and 14 related international patents that relate to the design features of our casing-installed sliding sleeves and frac isolation assembly and the methods utilized in the provision of our services. Our U.S. patents expire between 2030 and 2033. Our international patents expire between 2024 and 2032.
We have 40 U.S. patent applications pending and 51 related international patents pending. A portion of the patent applications cover our existing multistage completions products and services, our AirLock technology and equipment and methods which are currently in development. The applications are in various stages of the patent prosecution process and patents may not issue on such applications in any jurisdiction for some time, if they issue at all.
We believe that our patents have historically been important in enabling us to compete in the market to supply our customers with our products and services. We intend to enforce, and have in the past vigorously enforced, our patents. We may from time to time in the future be involved in litigation to determine the enforceability, scope and validity of our patent rights. In addition to patent rights, we use a significant amount of trade secrets, or “know-how,” and other proprietary information and technology. None of this “know-how” and technology is licensed from third parties.
Although in the aggregate our patents are very important to us, we do not regard any single patent or group of related patents as critical or essential to our business as a whole. In general, we depend on our operational capabilities and the application of know-how together with our patented technology in the conduct of our operations. We also consider the quality and timely delivery of our products, the services we provide to our customers and the technical knowledge and skill of our personnel to be highly important to our ability to compete.
Research and Development
We are engaged in research and development activities focused on the design, development, trialing and commercialization of innovative completions technologies and the improvement of existing products and services. For the years ended December 31, 2016 and 2015, we incurred approximately $3.3 million and $3.0 million, respectively, of research and development expense. In 2016, research and development expense was approximately 3.4% of consolidated revenue and 8.9% of our total selling, general and administrative expense. We expect that our 2017 research and development investment will increase in anticipation of the growth of our business.
Customers
Our customer base primarily consists of oil and natural gas producers in North America and in certain international markets as well as oilfield service companies.
For the years ended December 31, 2016 and 2015, we had over 140 and 150 customers, respectively. Our top five customers accounted for approximately 49% and 44% of our revenue for the years ended December 31, 2016 and 2015, respectively. Crescent Point accounted for 26% and 31% of our revenue during the years ended December 31, 2016 and 2015, respectively. No other customer accounted for more than 10% of our revenue in either period.
Although we believe we have a broad customer base and wide geographic coverage of operations, the loss of one or more of our significant customers could have a material adverse effect on our results of operations.
Sales and Marketing
Our sales and marketing activities are performed through a technically-trained direct sales force, which consisted of 21 employees as of December 31, 2016. We recognize the importance of a technical marketing
86
Table of Contents
program in demonstrating the advantages of new technologies that offer benefits relative to established industry methodologies. Our technical sales force advises customers on the benefits of pinpoint stimulation, MultiCycle sliding sleeves and our technical engineering resources.
Most of our sales are on a just-in-time basis, as specified in individual purchase orders, with a fixed price for our sleeves and agreed rates for the onsite services we provide. We occasionally supply our customers with large orders that may be filled on negotiated terms appropriate to the order. Although we do not typically maintain supply or service contracts with our customers, a significant portion of our sales represent repeat business.
International sales are typically made to our local operating partners on a free on board basis with a point of sale in the United States. Some of the locations in which we have operating partners or sales representatives include Argentina, China, Russia and the Middle East. Our operating partners and representatives do not have do not have authority to contractually bind our company, but market our products in their respective territories as part of their product or service offering.
Sales of our Multistage Unlimited products and services and ATRS services are made directly to E&P companies. Our customers also hire the coiled tubing companies and pressure pumping services companies that work alongside us during the completion of a well. We provide our AirLock and liner hanger products directly to E&P companies as well as to oilfield services companies that act as distributors for that product line.
The primary factors influencing a customer’s decision to purchase our products and services are technology, service quality, safety track record and price.
We provide extensive support services and have developed proprietary methodologies for assessing and reporting the information that is collected on our downhole gauges. In addition, ATRS works with customers to evaluate post-completion well performance and on a pre-job basis to simulate the production and economic outcomes from pinpoint stimulation strategies relative to traditional completion techniques. We also provide technical education to the coiled tubing services companies and pressure pumping services companies, explaining the benefits of utilizing our technology for their operations and our customers.
In addition to the technical marketing effort, we occasionally engage in field trials to demonstrate the economic benefits of our products and services. Periodically, we will provide ATRS services to E&P companies on a discounted basis, in exchange for their agreement to provide production data for direct comparison of the results of pinpoint stimulation to traditional completion techniques.
We operate with most of our customers under MSAs. We endeavor to allocate potential liabilities and risks between the parties in the MSAs. Generally, under our MSAs, we assume responsibility for, including control and removal of, pollution or contamination which originates above surface and originates from our equipment or services. Our customer assumes responsibility for, including control and removal of, all other pollution or contamination which may occur during operations, including that which may result from seepage or any other uncontrolled flow of drilling fluids.
Seasonality
A substantial portion of our business is subject to quarterly variability. In Canada, we typically experience higher activity levels in the first quarter and fourth quarter of each year, as our customers take advantage of the winter freeze to gain access to remote drilling and production areas. In the past, our revenue in Canada has declined during the second quarter due to warming weather conditions that result in thawing, softer ground, difficulty accessing drill sites and road bans that curtail drilling and completion activity. Access to well sites typically improves throughout the third quarter in Canada, leading to activity levels that are higher than in the second quarter, but lower than activity in the first and fourth quarters. Our business can also be impacted by a reduction in customer activity during the winter holidays in late December and early January.
87
Table of Contents
Suppliers and Raw Materials
We acquire component parts and raw materials from suppliers, including machine shops. The prices we pay for our raw materials may be affected by, among other things, energy, steel and other commodity prices, tariffs and duties on imported materials and foreign currency exchange rates. Most of the raw materials we use in our manufacturing operations, such as steel in various forms, electronic components and elastomers, are available from many sources.
We generally try to purchase our raw materials from multiple suppliers so we are not dependent on any one supplier. We will generally utilize multiple machine shops for the manufacturing of our component parts so that we are not dependent on any one machine shop. Our suppliers are also active in multiple regions which allows us to react to changes in foreign currency exchange rates. In recent months, we have added suppliers to increase third-party component part supply in order to meet expected demand growth. In addition, we recently entered into a joint venture which we believe will allow us to reduce our costs for certain product categories.
Properties
Our corporate headquarters are located at 19450 State Highway 249, Suite 200, Houston, Texas 77070. We currently own one property, located in Calgary, Alberta, which is used for our engineering and research and development activities. In addition to our property in Calgary, Alberta, we also lease 15 properties that are used for our corporate headquarters, sales offices, manufacturing, engineering, district operations, warehousing and storage yards. All of these properties are leased from third parties. We believe that these facilities are adequate for our current operations and that none of our leases are individually material to our business.
Operating Risks and Insurance
We currently carry a variety of insurance for our operations. Although we believe we currently maintain insurance coverage adequate for the risks involved, there is a risk our insurance may not be sufficient to cover any particular loss or that our insurance may not cover all losses.
Competition
The markets in which we operate are highly competitive. To be successful, we must provide services and products that meet the specific needs of E&P companies at competitive prices. We compete in all areas of our operations with a number of companies, some of which have financial and other resources greater than or comparable to ours.
We believe that we compete not only against other providers of pinpoint stimulation equipment and services, but also with companies that support the other primary means of hydraulically fracturing a horizontal well, including plug and perf and ball drop completions.
Our major competitors for our completion products and services include Schlumberger Limited, Halliburton Company, Baker Hughes Incorporated, Weatherford International Ltd, Packers Plus Energy Services, Nine Energy Service Inc., and Superior Energy Services Inc. as well as a number of smaller or regional competitors.
We believe that the most significant factors influencing our customer’s decision to utilize our equipment and services are technology, service quality, safety track record and price. While we must be competitive in our pricing, we believe our customers select our products and services based on the technical attributes of our products and equipment, the level of technical and operational service we provide before, during and after the job, and the know-how derived from our extensive operational track record. We believe that our technology and technical capabilities have enabled us to increase the overall market penetration for pinpoint stimulation solutions.
88
Table of Contents
Environmental and Occupational Health and Safety Matters
We are subject to stringent and complex federal, state, provincial and local laws and regulations governing the discharge of materials into the environment or otherwise relating to protection of worker health, safety and the environment. Compliance with these laws and regulations may require the acquisition of permits to conduct regulated activities, capital expenditures to prevent, limit or address emissions and discharges, and stringent practices to handle, recycle and dispose of certain wastes. Failure to comply with these laws and regulations may result in the assessment of administrative, civil and criminal penalties, the imposition of remedial or corrective obligations, and the issuance of injunctive relief.
We believe that we are in substantial compliance with applicable environmental, health and safety laws and regulations. Further, we do not anticipate that compliance with existing environmental, health and safety laws and regulations will have a material effect on our consolidated financial statements. However, laws and regulations protecting the environment generally have become more stringent in recent years and are expected to continue to do so. It is possible, that substantial costs for compliance with applicable environmental, health and safety laws and regulations may be incurred in the future. Moreover, it is possible that other developments, such as the adoption of stricter environmental laws, regulations, and enforcement policies, could result in additional costs or liabilities that we cannot currently quantify.
While we do not anticipate that compliance with existing environmental, health and safety laws and regulations will have a direct adverse effect on our operations, our customers are subject to a wide range of such laws and regulations, which could materially and adversely affect their businesses and indirectly, through reduced demand for our products and services, have a material adverse effect on our business, financial condition and results of operations, including with respect to the following:
| • | Air Emissions. The Federal Clean Air Act (the “CAA”) and comparable state laws regulate emissions of various air pollutants through air emissions permitting programs and the imposition of other emission control requirements. In addition, the EPA has developed, and continues to develop, stringent regulations governing emissions of toxic air pollutants at specified sources. Non-compliance with air permits or other requirements of the CAA and associated state laws and regulations can result in the imposition of administrative, civil and criminal penalties, as well as the issuance of orders or injunctions limiting or prohibiting non-compliant operations. |
| • | Water discharges. The federal Clean Water Act (“CWA”), and analogous state laws impose restrictions and strict controls with respect to the discharge of pollutants, including spills and leaks of oil and other substances, into state waters or waters of the United States. The discharge of pollutants into regulated waters is prohibited, except in accordance with the terms of a permit issued by the EPA or an analogous state agency. Federal and state regulatory agencies can impose administrative, civil and criminal penalties as well as other enforcement mechanisms for non-compliance with discharge permits or other requirements of the CWA and analogous state laws and regulations. |
| • | Climate Change. Our customers are or may become subject to statutes or regulations aiming to reduce emissions of GHGs. In December 2009, the EPA determined that emissions of carbon dioxide, methane and other GHGs present an endangerment to public health and the environment because emissions of such gases are, according to the EPA, contributing to warming of the earth’s atmosphere and other climatic changes. Based on these findings, the EPA has begun adopting and implementing regulations to restrict emissions of GHGs under existing provisions of the CAA. For example, in June 2016, the U.S. EPA published final rules under the CAA that establish new and more stringent emission control standards for methane and VOCs released from new and modified oil and natural gas development and production operations. These rules currently are being challenged in court by a number of states, and depending on the outcome of such litigation, the rules could have an adverse effect on our customers and result in an indirect material adverse effect on our business. In addition, the United States and Canada are among almost 200 nations that, in December 2015, agreed to the Paris Agreement, an international climate change agreement that calls for countries to set their own GHG emissions targets and be transparent about |
89
Table of Contents
| the measures each country will use to achieve its GHG emissions targets. The agreement entered into force on November 4, 2016. Although it is not possible at this time to predict how any legal requirements imposed following the implementation of the Paris Agreement that may be adopted or issued to address GHG emissions would impact our business or that of our customers, any such future laws, regulations or legal requirements imposing reporting or permitting obligations on, or limiting emissions of GHGs from, oil and natural gas exploration activities could require our customers to incur costs to reduce emissions of GHGs associated with their operations. In addition, substantial limitations on GHG emissions could adversely affect demand for the oil and natural gas our customers produce. |
| • | Non-Hazardous and Hazardous Wastes. The Resource Conservation and Recovery Act (“RCRA”) and comparable state laws control the management and disposal of hazardous and non-hazardous waste. These laws and regulations govern the generation, storage, treatment, transfer and disposal of wastes that our customers generate. Drilling fluids, produced waters, and most of the other wastes associated with the exploration, development, and production of oil or natural gas, if properly handled, are currently exempt from regulation as hazardous waste under RCRA and, instead, are regulated under RCRA’s less stringent non-hazardous waste provisions, state laws or other federal laws. It is possible, however, that certain oil and natural gas drilling and production wastes now classified as non-hazardous could be classified as hazardous wastes in the future. For example, in May 2016, several non-governmental environmental groups filed suit against the EPA in the U.S. District Court for the District of Columbia for failing to timely assess its RCRA Subtitle D criteria regulations for oil and natural gas wastes, asserting that the agency is required to review its Subtitle D regulations every three years but has not conducted an assessment on those oil and natural gas waste regulations since July 1988. A loss of the RCRA exclusion for drilling fluids, produced waters and related wastes could result in an increase in our customers’ costs to manage and dispose of generated wastes and a corresponding decrease in their drilling operations, which developments could have a material adverse effect on our business. |
The Comprehensive Environmental Response, Compensation, and Liability Act, and comparable state laws, impose joint and several liability, without regard to fault or legality of conduct, on classes of persons who are considered to be responsible for the release of a hazardous substance into the environment. These persons include the owner or operator of the site where the release occurred, and anyone who disposed or arranged for the disposal of a hazardous substance released at the site. In addition, it is not uncommon for neighboring landowners and other third-parties to file claims for personal injury and property damage allegedly caused by hazardous substances released into the environment.
The oil and natural gas industry is extensively regulated by numerous federal, state and local authorities. Legislation affecting the oil and natural gas industry is under constant review for amendment or expansion, frequently increasing the regulatory burden. Also, numerous departments and agencies, at the federal, state and local level, are authorized to issue rules and regulations that are binding on the oil and natural gas industry and its individual members, some of which carry substantial penalties for failure to comply. Although changes to the regulatory burden on the oil and natural gas industry could affect the demand for our services, we would not expect to be affected any differently or to any greater or lesser extent than other companies in the industry with similar operations.
Our customers’ operations are subject to various types of regulation at the federal, state and local level. These types of regulation include requiring permits for the drilling of wells, drilling bonds and reports concerning operations. The effect of these regulations may be to limit or increase the cost of oil and natural gas exploration and production, which could have a material adverse effect on our customers and indirectly materially and adversely affect our business.
We supply equipment and services to customers in the oil and natural gas industry conducting hydraulic fracturing operations. Although we do not directly engage in hydraulic fracturing activities, our customers purchase our products and services for use in their hydraulic fracturing activities. Hydraulic fracturing is
90
Table of Contents
typically regulated by state oil and natural gas commissions and similar agencies. Some states have adopted, and other states are considering adopting, regulations that could impose new or more stringent permitting, disclosure or well construction requirements on hydraulic fracturing operations. States could also elect to prohibit high volume hydraulic fracturing altogether, following the approach taken by the State of New York in 2015. Aside from state laws, local land use restrictions may restrict drilling in general or hydraulic fracturing in particular. Municipalities may adopt local ordinances attempting to prohibit hydraulic fracturing altogether or, at a minimum, allow such fracturing processes within their jurisdictions to proceed but regulating the time, place and manner of those processes. In addition, federal agencies have asserted regulatory authority over the process. For instance, the BLM published a final rule in March 2015 that established new or more stringent standards relating to hydraulic fracturing on federal and American Indian lands but, in June 2016, a Wyoming federal judge struck down this final rule, finding that the BLM lacked authority to promulgate the rule. That decision is current being appealed by the federal government. In addition, Various studies have also been conducted or are currently underway by the EPA, and other federal agencies. concerning the potential environmental impacts of hydraulic fracturing activities. State and federal regulatory agencies have recently focused on a possible connection between the operation of injection wells used for oil and natural gas waste disposal and seismic activity. Similar concerns have been raised that hydraulic fracturing may also contribute to seismic activity. At the same time, certain environmental groups have suggested that additional laws may be needed to more closely and uniformly limit or otherwise regulate the hydraulic fracturing process, and legislation has been proposed by some members of Congress to provide for such regulation.
The adoption of new laws or regulations at the federal or state levels prohibiting, limiting or otherwise regulating the hydraulic fracturing process could make it more difficult, or even impossible, to complete oil and natural gas wells, increase our customers’ costs of compliance and doing business, and otherwise adversely affect the hydraulic fracturing services they perform, which could negatively impact demand for our products and services. In addition, heightened political, regulatory, and public scrutiny of hydraulic fracturing practices could expose us or our customers to increased legal and regulatory proceedings, which could be time-consuming, costly, or result in substantial legal liability or significant reputational harm. We could be directly affected by adverse litigation involving us, or indirectly affected if the cost of compliance limits the ability of our customers to operate. Such costs and scrutiny could directly or indirectly, through reduced demand for our products and services, have a material adverse effect on our business, financial condition and results of operations.
We are subject to a number of federal and state laws and regulations, including the federal Occupational Safety and Health Act and comparable state statutes, establishing requirements to protect the health and safety of workers. Substantial fines and penalties can be imposed and orders or injunctions limiting or prohibiting certain operations may be issued in connection with any failure to comply with laws and regulations relating to worker health and safety.
Employees
As of December 31, 2016, we had 197 employees. 119 of our employees as of such date were based in the United States, 75 were based in Canada and three were based outside of North America. Our international operations are currently serviced by employees operating out of the United States and Canada. We are not a party to any collective bargaining agreements, and we consider our relations with our employees to be good.
Legal Proceedings
Due to the nature of our business, from time to time, we have various claims, lawsuits and administrative proceedings that are pending or threatened, all arising in the ordinary course of business, with respect to commercial, product liability and employee matters.
Our management currently does not expect that the results of any of these legal proceedings, either individually or in the aggregate, would have a material adverse effect on our financial position, results of operations or cash flows.
91
Table of Contents
Directors and Executive Officers
The following table sets forth the names and ages, as of April 15, 2017, of the individuals who will serve as our executive officers, key employees and members of our Board at the time of the offering.
| Name |
Age | Position | ||||
| Robert Nipper |
53 | Chief Executive Officer and Director | ||||
| Marty Stromquist |
57 | President and Director | ||||
| Tim Willems |
55 | Chief Operations Officer | ||||
| Ryan Hummer |
40 | Chief Financial Officer | ||||
| Wade Bitter |
54 | Chief Accounting Officer and Treasurer | ||||
| Kevin Trautner |
50 | Executive Vice President, General Counsel and Secretary | ||||
| Don Battenfelder |
57 | President, North America | ||||
| Roger Dwyer |
43 | Vice President, HSE | ||||
| Richard Finney |
55 | Vice President, Manufacturing | ||||
| John Ravensbergen |
51 | Vice President, Research & Development | ||||
| Dustin Ellis |
40 | Vice President, Global Technical Services | ||||
| Mike McKown |
47 | Vice President, U.S. Operations | ||||
| Shawn Leggett |
47 | Vice President, Canadian Operations | ||||
| Dave Anderson |
43 | Director of Anderson Thompson Reservoir Strategies | ||||
| Don Getzlaf |
58 | Executive Advisor | ||||
| Michael McShane |
62 | Chairman | ||||
| John Deane |
65 | Director | ||||
| Matthew Fitzgerald |
59 | Director | ||||
| Gurinder Grewal |
39 | Director | ||||
| David McKenna |
49 | Director | ||||
| Franklin Myers |
64 | Director | ||||
| W. Matt Ralls |
67 | Director | ||||
Robert Nipper
Mr. Nipper is our Chief Executive Officer, a position he has held since November 2016. He previously served as the Chairman of our Board from April 2016 to February 2017, our Chief Executive Officer from December 2012 until April 2016 and as Executive Chairman from April 2016 until November 2016. Mr. Nipper co-founded NCS in 2006 and has served on our Board since December 2012. He has more than 30 years of industry experience and has invented several patented technologies relating to downhole oil and natural gas and geothermal service equipment. Prior to founding NCS, Mr. Nipper spent 18 years with Tri-State Oil Tools Inc. and Baker Hughes, including various operations and sales management positions. Prior to leaving Baker Hughes, he held the position of North American Marketing Manager.
Marty Stromquist
Mr. Stromquist is our President, a position he has held since November 2016. He has served as a member of our Board since January 2010. Mr. Stromquist co-founded NCS and served as Chief Operating Officer from January 2010 to June 2015, Chief Technology Officer from June 2015 to March 2016 and Chief Executive Officer from March 2016 to November 2016, before being named to his current position. He has served in technical and management positions in the oil and natural gas industry for more than 35 years, in both service company and producer roles. He co-founded Cemblend Systems, Inc., which provided cementing solutions, and Frac Source, Inc., which specialized in stimulation services for unconventional reservoirs. He also served as operations manager of the well services group for Pioneer Natural Resources USA, Inc., and as technical
92
Table of Contents
manager for stimulation services for Halliburton Energy Services Canada. He holds numerous patents for completion-related tools, processes and downhole procedures, and he has authored numerous technical papers and articles.
Tim Willems
Mr. Willems is our Chief Operations Officer, a position he has held since May 2015. Mr. Willems previously served as our President of U.S./International Operations from January 2012 to May 2015 and Senior Vice President from April 2010 to January 2012. Mr. Willems has more than 30 years’ experience in the oil and natural gas industry, specializing in wellbore construction, completion and remediation. Sixteen of those years were spent in the international arena. He has held diverse positions, including applications engineering, operations, sales and marketing, and he has held vice president positions for a major service company in U.S. and international operations and marketing. Mr. Willems received a B.S. in Petroleum Engineering from Montana College of Mineral Science and Technology.
Ryan Hummer
Mr. Hummer is our Chief Financial Officer, a position he has held since November 2016. Mr. Hummer previously served as Executive Vice President, Corporate Development since August 2015 and as Vice President, Corporate Development from July 2014 until August 2015. Prior to joining us, Mr. Hummer served as Director, Investment Banking at Lazard Freres & Co. from January 2011 to April 2014, during which time he advised clients on a broad range of transactions, including mergers & acquisitions, restructuring and debt and equity capital raises. Mr. Hummer holds a B.S. in Economics from the Wharton School of the University of Pennsylvania.
Wade Bitter
Mr. Bitter is our Chief Accounting Officer and Treasurer, a position he has held since November 2016. He previously served as our Chief Financial Officer from January 2011 to November 2016. He has more than 25 years of corporate financial experience, including more than 20 years in the oilfield services industry. He has extensive experience with international accounting and reporting, currency and treasury functions, compliance and systems integrations and conversions. Mr. Bitter received an MBA from Utah State University and a B.S. in Finance from Brigham Young University.
Kevin Trautner
Mr. Trautner is our Executive Vice President, General Counsel and Secretary, a position he has held since November 2016. Mr. Trautner previously served as Vice President, General Counsel from July 2016 to November 2016. Prior to joining us, Mr. Trautner was a corporate and securities Partner at Andrews Kurth Kenyon LLP from March 2014 to July 2016 and a Partner at Norton Rose Fulbright US LLP from March 2007 to March 2014. Prior to that, Mr. Trautner was engaged in the private practice of law as an associate and then a Partner at other national law firms. Mr. Trautner has more than 20 years’ experience in advising energy companies on corporate and securities matters including mergers and acquisitions, SEC filings and corporate governance matters. Mr. Trautner has a J.D. from the University of Virginia School of Law, an M.D. from the Vanderbilt University School of Medicine, and a B.S. from the University of Notre Dame.
Don Battenfelder
Mr. Battenfelder is our President of North American Operations, a position he has held since April 2016. He previously served as our President of Canada Operations from October 2012 to April 2016. Prior to joining us, Mr. Battenfelder was Vice President of Global Operations at Calfrac Well Services Ltd. (“Calfrac”) since May 2000. Mr. Battenfelder has spent over 35 years in the oil and natural gas industry, primarily in the Canadian pressure-pumping sector. He was previously employed for 17 years by Fracmaster Ltd. and for 13 years by Calfrac, and held senior executive positions at both companies.
93
Table of Contents
Roger Dwyer
Mr. Dwyer is our Vice President of Health, Safety and Environment, a position he has held since November 2016. He previously served as Vice President of Organization Development from May 2015 to November 2016. Prior to joining us, Mr. Dwyer served as Health, Safety and Environment Manager for the Canadian Division of Calfrac since October 2010. Prior to joining Calfrac, Mr. Dwyer held various positions with Jacobs Engineering Group Inc., from operations to Health, Safety and Environment Manager for Western Canada. Mr. Dwyer is a graduate of the University of Alberta with a Diploma in Occupational Health and Safety.
Richard Finney
Mr. Finney is our Vice President of Manufacturing, a position he has held since February 2016. Mr. Finney previously served as Director of Manufacturing from October 2014 until February 2016. Prior to joining us, Mr. Finney was a Plant Manager with Forum Energy Technologies, Inc. from October 2012 to March 2014 and had a 32 year career with Baker Hughes from June 1980 to October 2012, where he served in multiple positions including Manufacturing Supervisor, Plant Manager and Director of Manufacturing. Mr. Finney has more than 35 years of manufacturing experience in the oil and natural gas industry. His manufacturing experience includes a wide range of product categories, including fishing tools, float equipment, intelligent well systems, liners, multilateral equipment and packers. Mr. Finney received his Six Sigma Green Belt Certification from the University of Houston.
John Ravensbergen
Mr. Ravensbergen is our Vice President of Research and Development, a position he has held since April 2012. He previously served as an Engineering Manager since April 2011. Prior to joining us, Mr. Ravensbergen served as an Engineering Manager for Baker Hughes from September 2010 to April 2011, and before that for BJ Services Company since September 1996. Mr. Ravensbergen has over 20 years of experience in the oil and natural gas industry. His experience includes working as a design manager in coiled tubing research and development departments at Nowsco Well Services Ltd., BJ Services Company and Baker Oil Tools, Inc., where he developed innovative coiled tubing processes, deployment systems and bottomhole assemblies for underbalanced directional drilling, well cleanout, multilateral acid stimulation and, most recently, multi-stage hydraulic fracturing completions. He holds 18 patents and has authored a number of papers for the Society of Petroleum Engineers. Mr. Ravensbergen received a B.S. in Mechanical Engineering from the University of Calgary.
Dustin Ellis
Mr. Ellis is our Vice President of Global Technical Services, a position he has held since January 2014. He was previously the U.S. Technical Services Manager from November 2012 to January 2014. Prior to joining us, Mr. Ellis performed Operations and Field Engineering Manager roles at Baker Hughes since May 2003. Mr. Ellis has 16 years of experience in oil and natural gas, including well completions (open and cased hole), wellbore construction (including multilaterals), wellbore intervention, rig-site operations and pumping operations. His prior experience includes roles as rig supervisor, field engineer, field service technician, district manager, engineering manager and project manager for large service and operating companies in the United States. Mr. Ellis received a B.S. in Engineering from Texas A&M University.
Mike McKown
Mr. McKown is our Vice President of U.S. Operations, a position he has held since April 2016. Mr. McKown previously served as U.S. Sales Manager from November 2013 to April 2016 and Business Development Manager since October 2012. Prior to joining us, he was Deepwater Project Manager for Baker Hughes Incorporated since November 2010 and before that was a completion superintendent for EQT
94
Table of Contents
Corporation in the Appalachian Basin. Mr. McKown has more than 25 years of experience in the oil and natural gas industry, including sand control systems, well completions and pumping operations. Mr. McKown oversees all operations and sales in the United States.
Shawn Leggett
Mr. Leggett is our Vice President of Canadian Operations, a position he has held since April 2016. Mr. Leggett previously served as Director of Sales and Business Development in Canada from April 2015 to April 2016 and Technical Services Manager since November 2010. Mr. Leggett is responsible for all of our operations and sales in Canada. He has more than 19 years of experience in the oil and natural gas industry with a focus on hydraulic fracturing. Before joining us, Mr. Leggett was a fracturing supervisor for Calfrac and later was a wellsite supervision consultant. He is a graduate of the Southern Alberta Institute of Technology in their Petroleum Engineering Technologist program.
Dave Anderson
Mr. Anderson is Director of our Anderson Thompson Reservoir Strategies team, a position he has held since February 2015. Prior to joining us, Mr. Anderson served as Executive Product Manager for IHS Markit from April 2013 to December 2014, where he managed the development of software for the oil and natural gas industry. Before joining IHS Markit, Mr. Anderson was Vice President at Fekete Associates since July 1996 where he oversaw the development of Fekete’s petroleum engineering software suite. Mr. Anderson has over 20 years of experience in the petroleum industry as a reservoir engineer, has been a lecturer within the Society of Petroleum Engineers and is a recognized expert in the area of well performance analysis. He received his B.Sc. in Mechanical Engineering from the University of Calgary.
Don Getzlaf
Mr. Getzlaf has served as an Executive Advisor since June 2015. Mr. Getzlaf previously served as our Chief Technology Officer since January 2010, and since September 2016 has served as President of Fluid Energy Group. Mr. Getzlaf is a professional engineer with more than 35 years of oilfield experience, specializing in cementing, completions and field operations. Mr. Getzlaf has authored numerous papers on materials and methods related to oilfield cementing, and holds a number of patents and pending patents related to those disciplines. As an Executive Advisor at NCS, Mr. Getzlaf continues to design new and innovative solutions to industry challenges.
Michael McShane
Mr. McShane has served as the Chairman of our Board since February 2017 and as one of our directors since December 2012. Since September 2009, Mr. McShane has been an Operating Partner for Advent in the oil and natural gas services and equipment sector. Prior to his engagement with Advent, Mr. McShane was the Chairman and Chief Executive Officer of Grant Prideco Inc., a manufacturer and supplier of oilfield drill pipe and other drill stem products. Prior to joining Grant Prideco, Mr. McShane was Senior Vice President—Finance and Chief Financial Officer of BJ Services Company, a provider of pressure pumping, cementing, stimulation and coiled tubing services for oil and natural gas operators. Mr. McShane also serves on the board of directors of Superior Energy Services, Inc., Forum Energy Technologies Inc., Enbridge Inc. and Oasis Petroleum Inc. We believe that Mr. McShane’s management experience and broad experience in the energy industry qualify him to serve as one of our directors.
John Deane
Mr. Deane has served as one of our directors since December 2012 and served as Chairman of the Board from December 2012 to April 2016. Since October 2009, Mr. Deane has been an Operating Partner for Advent in
95
Table of Contents
the oil and natural gas industry, primarily in the services sector, and sits on the board of BOS Solutions Ltd. and RGL Reservoir Management Inc. Prior to his engagement with Advent, Mr. Deane served as President of ReedHycalog, L.P., Vice President of Schlumberger Limited, President of Hycalog and numerous executive and technical positions with Reed Tool Co. and Camco Intl. Mr. Deane has over 40 years of experience in the oil and natural gas industry, specializing in drilling technology. Mr. Deane holds a B.S. in Physics from the Colorado School of Mines. We believe that Mr. Deane’s management experience and expertise in the oil and natural gas industry qualify him to serve as one of our directors.
Matthew Fitzgerald
Mr. Fitzgerald has served as one of our directors since February 2017. Mr. Fitzgerald is now a private investor and volunteer instructor and counselor with SCORE (Service Corp of Retired Executives), an affiliate of the Small Business Administration. From 2009 until July 2013, Mr. Fitzgerald served as President of Total Choice Communications LLC, a wireless retailer in Houston, Texas. Mr. Fitzgerald retired from Grant Prideco, Inc. following its merger with National Oilwell Varco in 2008. He had served as Senior Vice President and Chief Financial Officer beginning in January 2004 and as Treasurer beginning in February 2007. Mr. Fitzgerald held the positions of Executive Vice President, Chief Financial Officer, and Treasurer of Veritas DGC from 2001 until January 2004. Mr. Fitzgerald also served as Vice President and Controller for BJ Services Company from 1989 to 2001. Mr. Fitzgerald currently serves on the board of directors, as chairman of the audit committee and the corporate governance and nominating committee of Independence Contract Drilling, Inc. He previously served on the board of directors of Rosetta Resources, Inc. and Maverick Oil and Gas, Inc. Mr. Fitzgerald began his career as a certified public accountant with the accounting firm of Ernst & Whinney. He holds a Bachelor of Business Administration in Accounting and a Masters in Accountancy from the University of Florida. We believe that Mr. Fitzgerald’s diverse management experience and experience serving as a director qualifies him to serve as one of our directors.
Gurinder Grewal
Mr. Grewal has served as one of our directors since December 2012. He is a managing director of Advent, focusing on investments in the energy and industrial sectors. Prior to joining Advent, Mr. Grewal was a vice president at Bain Capital where he was involved in investments in several large companies in the industrial, media and retail sectors. He currently serves on the boards of directors of BOS Solutions Ltd., Oleoducto Central S.A. (Ocensa), RGL Reservoir Management Inc., Quala and Culligan International Group. Mr. Grewal received an HBA from the Richard Ivey School of Business at the University of Western Ontario and an M.B.A. from Harvard Business School. We believe that Mr. Grewal’s experience in the private equity and energy industries qualifies him to serve as one of our directors.
David McKenna
Mr. McKenna has served as one of our directors since December 2012. He is a managing partner of Advent and coordinates the firm’s investment efforts in the North American industrial sector. Mr. McKenna joined Advent in 1992 and for eight years held various positions, including head of the firm’s Hong Kong office. In 2000, he joined Bain Capital, where he spent three years as a senior dealmaker working on large investments in the industrial, retail and consumer sectors before rejoining Advent in 2003. Mr. McKenna currently serves on the boards of directors of BOS Solutions Ltd., RGL Reservoir Management Inc. and Serta Simmons Bedding LLC and previously served on the boards of ABC Supply Co. Inc., Aspen Technology Inc., Boart Longyear Limited, Bradco Supply and Keystone Automotive Operations Inc. He holds an A.B. in English from Dartmouth College. We believe that Mr. McKenna’s experience at Advent and as a director of numerous private and public companies provides insight that is beneficial to our Board.
Franklin Myers
Mr. Myers has served as one of our directors since February 2017. Mr. Myers serves as Senior Advisor to Quantum Energy Partners, a Houston-based private equity firm. Previously, Mr. Myers served as Senior Advisor
96
Table of Contents
to Cameron International Corporation, a publicly traded provider of flow equipment products, from April 2008 through March 2009, prior to which, from 2003 through March 2008, he served as the Senior Vice President and Chief Financial Officer. From 1995 to 2003, he served as Senior Vice President and President of a division within Cooper Cameron Corporation, as well as General Counsel and Secretary. Prior to joining Cooper Cameron Corporation in 1995, Mr. Myers served as Senior Vice President and General Counsel of Baker Hughes Incorporated, and as attorney and partner at the law firm of Fulbright & Jaworski (now known as Norton Rose Fulbright). Mr. Myers currently serves on the board of directors of Forum Energy Technologies, Inc., ION Geophysical Corporation, Comfort Systems USA, Inc. and HollyFrontier Corporation. Mr. Myers also served as an operating adviser for Paine Partners, a private equity fund, from 2009 through December 2012. We believe that Mr. Myers’s management experience and experience serving as a director of numerous public companies qualify him to serve as one of our directors.
W. Matt Ralls
Mr. Ralls has served as one of our directors since March 2017. Mr. Ralls previously served as Executive Chairman of Rowan Companies plc (“Rowan”) from April 2014 to April 2016, its Chief Executive Officer from January 2009 until April 2014, and its President from January 2009 to April 2013. Mr. Ralls served as Senior Vice President and Chief Financial Officer from 2001 to 2005 and as Executive Vice President and Chief Operating Officer of GlobalSantaFe Corporation from 2005 until the completion of the merger of GlobalSantaFe with Transocean, Inc. in 2007. Mr. Ralls currently serves on the board of directors Cabot Oil & Gas Corporation and Superior Energy Services, Inc. Mr. Ralls previously served on the boards of several other publicly traded companies as well as the boards of the American Petroleum Institute, the National Oceanic Industries Association and the International Association of Drilling Contractors. We believe that Mr. Ralls’ boardroom experience and broad management experience in the oil and gas industry qualify him to serve as one of our directors.
Board of Directors
Our business and affairs are managed under the direction of our Board. Our amended and restated certificate of incorporation will provide that our Board consist of nine directors. Contemporaneously with this offering, our Board will be composed of nine directors.
Our amended and restated certificate of incorporation will provide that our Board will be divided into three classes, with one class being elected at each annual meeting of stockholders. Each director will serve a three-year term, with termination staggered according to class. Class I will initially consist of three directors, Class II will initially consist of three directors and Class III will initially consist of three directors. The Class I directors, whose terms will expire at the first annual meeting of our stockholders following the filing of our amended and restated certificate of incorporation, will be Franklin Myers, Gurinder Grewal and Michael McShane. The Class II directors, whose terms will expire at the second annual meeting of our stockholders following the filing of our amended and restated certificate of incorporation, will be Matthew Fitzgerald, David McKenna and Robert Nipper. The Class III directors, whose terms will expire at the third annual meeting of our stockholders following the filing of our amended and restated certificate of incorporation, will be W. Matt Ralls, John Deane and Marty Stromquist. See “Description of Capital Stock—Anti-takeover Provisions.”
Director Independence and Controlled Company Exemption
After the completion of this offering, we will qualify as a “controlled company” and will be able to rely on the controlled company exemption under the corporate governance rules of NASDAQ. As a controlled company, we will not be required to have a majority of “independent directors” on our Board as defined under the rules of NASDAQ or to have a compensation committee or a Board committee performing the Board nominating function composed entirely of independent directors. The “controlled company” exemption does not modify the independence requirements for the audit committee which requires that our audit committee be composed of at least three independent members, subject to a permitted “phase-in” period within one year of listing.
97
Table of Contents
Even though we will qualify as a controlled company, we expect to have a majority of independent directors serving on our Board. Our Board has affirmatively determined that Messrs. McShane, Deane, Fitzgerald, Grewal, McKenna, Myers and Ralls are independent under applicable NASDAQ rules. In addition, we expect the audit committee and the compensation, nominating and corporate governance committee to be composed entirely of independent directors.
If at any time we cease to be a “controlled company” under the rules of NASDAQ, our Board will take all action necessary to comply with the NASDAQ corporate governance rules, including appointing a majority of independent directors to our Board and establishing certain committees composed entirely of independent directors, subject to a permitted “phase-in” period.
Board Committees
Upon consummation of this offering our Board will establish an audit committee and compensation, nominating and corporate governance committee. Each committee will operate under a charter that will be approved by our Board and will have the composition and responsibilities described below. Members will serve on these committees until their resignations or until otherwise determined by our Board. The charter of each committee will be available on our website.
Audit Committee. The primary purposes of our audit committee are to assist our Board’s oversight of:
| • | audits of our financial statements; |
| • | the integrity of our financial statements; |
| • | our process relating to risk management and the conduct and systems of internal control over financial reporting and disclosure controls and procedures; |
| • | the qualifications, engagement, compensation, independence and performance of our independent auditor; and |
| • | the performance of our internal audit function. |
Upon the consummation of this offering, and prior to the listing of our common stock, our audit committee will be composed of Messrs. Fitzgerald, Myers and Ralls. Mr. Fitzgerald will serve as chair of the audit committee. Messrs. Fitzgerald, Myers and Ralls qualify as an “audit committee financial expert” as such term has been defined by the SEC in Item 407(d) of Regulation S-K. Our Board has affirmatively determined that Messrs. Fitzgerald, Myers and Ralls meet the definition of an “independent director” for the purposes of serving on the audit committee under applicable NASDAQ rules and Rule 10A-3 under the Exchange Act. The audit committee will be governed by a charter that complies with the rules of NASDAQ.
Compensation, Nominating and Corporate Governance Committee. The primary purposes of our compensation, nominating and corporate governance committee is to:
| • | determine and approve the compensation of our executive officers; |
| • | review and approve incentive compensation and equity compensation policies and programs; |
| • | recommend to the Board for approval the qualifications, qualities, skills and expertise required for Board membership; |
| • | identify potential members of our Board consistent with the criteria approved by our Board and select and recommend to our Board the director nominees for election at the next annual meeting of stockholders or to otherwise fill vacancies; |
| • | evaluate and make recommendations regarding the structure, membership and governance of the committees of our Board; |
98
Table of Contents
| • | develop and make recommendations to our Board with regard to our corporate governance policies and principles; and |
| • | oversee the annual review of our Board’s performance. |
Upon the consummation of this offering, Messrs. Deane, McShane, Myers and Ralls will serve on the compensation, nominating and corporate governance committee, and Mr. Deane will serve as the chairman. Our Board has affirmatively determined that Messrs. Deane, McShane, Myers and Ralls meet the definition of an “independent director” for the purposes of serving on the committee under applicable NASDAQ rules. The compensation, nominating and corporate governance committee will be governed by a charter that complies with the rules of NASDAQ.
Compensation Committee Interlocks and Insider Participation
The members of our compensation, nominating and corporate governance committee during 2017 were Messrs. Deane, McShane, Myers and Ralls. During 2017, none of our executive officers served (i) as a member of the compensation, nominating and corporate governance committee or board of directors of another entity, one of whose executive officers served on our compensation, nominating and corporate governance committee, or (ii) as a member of the compensation committee of another entity, one of whose executive officers served on our Board.
Indemnification of Directors
Our amended and restated certificate of incorporation will provide that we will indemnify our directors to the fullest extent permitted by the DGCL.
We intend to enter into indemnification agreements with each of our directors prior to the completion of this offering. The indemnification agreements will provide our directors with contractual rights to indemnification, expense advancement and reimbursement, to the fullest extent permitted under the DGCL, subject to certain exceptions contained in those agreements.
Code of Business Conduct and Ethics
Prior to the completion of this offering, we will implement a code of business conduct and ethics that applies to all of our employees, officers, agents, consultants, representatives, affiliates, subsidiaries and anyone who is authorized to act on our behalf. A copy of the code will be available on our website located at www.ncsmultistage.com. Any amendments or waivers from our code for our principal executive officer, principal financial officer, principal accounting officer or controller, or persons performing similar functions, to our code will be disclosed on our Internet website promptly following the date of such amendment or waiver.
Corporate Governance Guidelines
Our Board will adopt corporate governance guidelines in accordance with the corporate governance rules of NASDAQ that serve as a flexible framework within which our Board and its committees operate. These guidelines will cover a number of areas including the duties and responsibilities of our Board, director independence, Board leadership structure, executive sessions, CEO evaluations, management development and succession planning, director nominations and qualifications director orientation and continuing education, Board agenda and meeting information, director access to company employees and independent advisers, Board communication with stockholders and others, director compensation and annual board and committee performance evaluations. A copy of our corporate governance guidelines will be posted on our website.
99
Table of Contents
EXECUTIVE AND DIRECTOR COMPENSATION
The following discussion and analysis of compensation arrangements should be read with the compensation tables and related disclosures set forth below. This discussion contains forward-looking statements that are based on our current plans and expectations regarding future compensation programs. See “Cautionary Note Regarding Forward-Looking Statements.” Actual compensation programs that we adopt may differ materially from the programs summarized in this discussion.
Overview
The discussion below includes a review of our compensation decisions with respect to 2016 for our named executive officers (“NEO”), namely our principal executive officer and our two other most highly compensated executive officers. Our NEOs for 2016 were:
| • | Robert Nipper |
| • | Tim Willems |
| • | Wade Bitter |
In 2016, we compensated our NEOs through a combination of base salary and annual cash bonuses. Our executive officers are also eligible to receive certain benefits, which include a 401(k) plan with matching contributions, life insurance, automobile allowances and group health insurance, including medical, dental and vision insurance.
Summary Compensation Table
The following table sets forth certain information for 2016 concerning the total compensation awarded to, earned by or paid to our NEOs.
| Name and principal position |
Year | Salary(1) | Bonus(1) | Non-Qualified Deferred Compensation Earnings |
All other compensation (2) |
Total | ||||||||||||||||||
| Robert Nipper |
2016 | $ | 208,154 | $ | 2,220 | $ | — | $ | 48,260 | $ | 258,634 | |||||||||||||
| Tim Willems |
2016 | $ | 268,953 | $ | 2,220 | — | $ | 46,916 | $ | 318,089 | ||||||||||||||
| Wade Bitter |
2016 | $ | 255,067 | $ | 2,220 | $ | 3,073 | $ | 43,689 | $ | 304,049 | |||||||||||||
| (1) | Represents annual salary and bonus amounts paid pursuant to the terms of each of Mr. Nipper’s, Mr. Willems’ and Mr. Bitter’s employment agreement. See “—Employment Agreements.” The terms of our employment agreements with each of the NEOs provide that any bonuses are entirely at the discretion of the Board. |
| (2) | Includes the following, as set forth below: |
| Name and principal position |
Automobile allowance |
401(k) matching and contributions |
Health insurance premiums |
Total | ||||||||||||
| Robert Nipper Chief Executive Officer |
$ | 21,150 | $ | 9,172 | $ | 17,938 | $ | 48,260 | ||||||||
| Tim Willems Chief Operations Officer |
$ | 21,150 | $ | 11,604 | $ | 14,162 | $ | 46,916 | ||||||||
| Wade Bitter Chief Accounting Officer & Treasurer |
$ | 14,950 | $ | 10,801 | $ | 17,938 | $ | 43,689 | ||||||||
100
Table of Contents
Outstanding Equity Awards as of December 31, 2016
The following table sets forth certain information about outstanding equity awards held by our NEOs as of December 31, 2016.
| Name |
Option grant date |
Number of securities underlying unexercised options exercisable (#) |
Number of securities underlying unexercised options unexercisable (#) |
Option exercise price(5) |
Option expiration date |
|||||||||||||||
| Robert Nipper |
12/21/2012 | 132,441 | (1) | 281,430 | (1) | $ | 5.878 | 12/21/2022 | ||||||||||||
| Chief Executive Officer |
||||||||||||||||||||
| Tim Willems |
1/1/2011 | 119,235 | — | $ | 1.237 | 1/1/2018 | ||||||||||||||
| Chief Operations Officer |
12/21/2012 | 36,678 | (2) | 77,934 | (2) | $ | 5.878 | 12/21/2022 | ||||||||||||
| Wade Bitter |
2/9/2011 | 45,582 | — | $ | 1.237 | 2/9/2018 | ||||||||||||||
| Chief Accounting Officer & Treasurer |
12/21/2012 | 2,889 | (3) | 6,132 | (3) | $ | 5.878 | 12/21/2022 | ||||||||||||
| 4/3/2013 | 6,840 | (4) | 21,660 | (4) | $ | 5.878 | 4/3/2023 | |||||||||||||
| (1) | Represents options to purchase (i) 165,549 shares of common stock which vest over five years, with 20% vesting each year beginning on December 21, 2013 and (ii) 248,322 shares of common stock which shall vest effective as of the consummation of a Company Sale, as defined in our 2012 Equity Incentive Plan (the “2012 Equity Incentive Plan”) as any transaction or series of related transactions in which any person or group of persons other than Advent or their affiliates acquire 50% or more of the voting power at elections for the Board, or the sale, transfer or other disposition of all or substantially all of our assets, in one or a series of related transactions (“Company Sale”), provided that on each applicable vesting date Mr. Nipper is still then employed by us. In connection with this offering, the terms of any options that vest upon a Company Sale shall be amended to provide that such awards shall vest over three years, with 33% vesting each year beginning on the first anniversary of the consummation of this offering, subject to accelerated vesting upon a Company Sale (as defined in our 2012 Equity Incentive Plan), provided that on each applicable vesting date the award holder is still employed by us. |
| (2) | Represents options to purchase (i) 45,846 shares of common stock which vest over five years, with 20% vesting each year beginning on December 21, 2013 and (ii) 68,766 shares of common stock which shall vest effective as of the consummation of a Company Sale, provided that on each applicable vesting date Mr. Willems is still then employed by us. In connection with this offering, the terms of any options that vest upon a Company Sale shall be amended to provide that such awards shall vest over three years, with 33% vesting each year beginning on the first anniversary of the consummation of this offering, subject to accelerated vesting upon a Company Sale (as defined in our 2012 Equity Incentive Plan), provided that on each applicable vesting date the award holder is still employed by us. |
| (3) | Represents options to purchase 3,609 shares of common stock which vest over five years, with 20% vesting each year beginning on December 21, 2013, and 5,412 shares of common stock which shall vest effective as of the consummation of a Company Sale, provided that on each applicable vesting date Mr. Bitter is still then employed by us. In connection with this offering, the terms of any options that vest upon a Company Sale shall be amended to provide that such awards shall vest over three years, with 33% vesting each year beginning on the first anniversary of the consummation of this offering, subject to accelerated vesting upon a Company Sale (as defined in our 2012 Equity Incentive Plan), provided that on each applicable vesting date the award holder is still employed by us. |
| (4) | Represents options to purchase (i) 11,400 shares of common stock which vest over five years, with 20% vesting each year beginning on April 3, 2014 and (ii) 17,100 shares of common stock which shall vest effective as of the consummation of a Company Sale, provided that on each applicable vesting date Mr. Bitter is still then employed by us. In connection with this offering, the terms of any options that vest upon a Company Sale shall be amended to provide that such awards shall vest over three years, with 33% vesting each year beginning on the first anniversary of the consummation of this offering, subject to accelerated vesting upon a Company Sale (as defined in our 2012 Equity Incentive Plan), provided that on each applicable vesting date the award holder is still employed by us. |
| (5) | The option exercise prices reflect an adjustment downward by $4.648 per share in connection with the payment of the 2014 Dividend in order to preserve the intrinsic value of the options giving effect to the 2014 Dividend. |
Employment Agreements
We are currently party to employment agreements with each of our NEOs. The material provisions of each such agreement are described below.
In February 2017, we entered into amended and restated employment agreements with each of Robert Nipper, our Chief Executive Officer, Tim Willems, our Chief Operations Officer and Wade Bitter, our Chief
101
Table of Contents
Accounting Officer and Treasurer, each of whom we refer to as an Executive. The agreements provide for an initial term of three years from December 30, 2015 (or in the case of Mr. Bitter’s agreement December 31, 2015), which will automatically renew at the end of such period for an additional three year-period, and at the end of each three-year period thereafter. The agreements provide that the Executives will receive an annualized base salary subject to review by our Board (currently $324,480 for Mr. Nipper, $296,400 for Mr. Willems and $279,740 for Mr. Bitter). The agreements also provide that the Executives are eligible to receive discretionary bonuses during the employment period as the Board may determine.
Either we or the Executive may terminate the agreement at any time prior to the end of the term of the agreement or any renewal term upon written notice. We may terminate the Executive’s employment for death, disability, by resolution of our Board for cause or without cause. The Executive may resign following a good reason event or without a good reason event. The employment agreements may also be terminated upon the sale of substantially all of the assets of the Company or the sale of more than fifty percent of the equity interests of the Company.
If we terminate an Executive’s employment other than for cause or the Executive resigns following a good reason event, prior to the end of the term of the agreement or any renewal term then, in addition to any accrued but unpaid base salary, we must provide the Executive with, subject to his execution of a release of claims, such release becoming effective and his continued compliance with the restricted covenants contained in his agreement, (i) all previously earned but unpaid bonuses for the fiscal period prior to the fiscal period when such termination occurs, (ii) base salary continuation for the twelve-month period following the date of the termination; provided that if we elect to extend the restrictive covenant period (described below) to two years then such base salary continuation shall be for a twenty-four month period, and (iii) benefits for which the Executive is eligible through the end of the twelve-month period following the date of termination (in the case of Mr. Nipper, we shall pay the difference between the cost of such benefits under COBRA and the amount Mr. Nipper would have paid had he remained employed).
If an Executive’s employment is terminated as a result of death, disability, voluntary resignation other than following a good reason event, by resolution of our Board for cause or upon the sale of substantially all of our assets or more than fifty percent of our equity interests, the Executive shall only be entitled to receive accrued but unpaid base salary and benefits through the date of termination.
For purposes of the agreements, good reason event means a material breach of the agreement by us that we have not cured within thirty (30) days after written notice of such breach is given to us by the Executive no later than thirty (30) days after the initial existence of the breach.
For purposes of the agreements, cause means (1) a breach of the Executive’s covenants under the agreement or any other agreements between the Executive and us that, if susceptible to cure, has not been cured within thirty (30) days after written notice to the Executive; (2) the conviction (or plea of no contest/nolo contendere) of a felony or a crime involving moral turpitude, or commission of any act or omission involving dishonesty or fraud with respect to us or any act by the Executive causing material harm to our standing or reputation or to any of our subsidiaries; (3) any act by the Executive that causes the Company to violate a local, state, federal, tribal or any other applicable statute, regulation or law of any jurisdiction (including foreign jurisdictions) causing substantial or material harm to us; (4) negligence or willful misconduct in the conduct or management of the Company, subject to the Executive’s right to cure any negligence within thirty (30) days after written notice, to the extent susceptible to cure; (5) the Executive’s misappropriation of the Company’s assets (of any significance) or business opportunities; (6) the Executive’s failure to comply with the reasonable and lawful directives of the Board, subject to the Executive’s right to cure within thirty (30) days after written notice, to the extent susceptible to cure; (7) the Executive’s misrepresentation to the Board of, or willful failure to disclose to the Board, information material to us, our business or our operations; or (8) the use of illegal drugs, or the use of legal drugs or alcohol in any manner that adversely in any material respect affects the Executive’s ability to perform his duties under the agreement.
102
Table of Contents
The agreements include perpetual confidentiality provisions, a company non-disparagement provision, an assignment of inventions provision as well as provisions relating to non-competition and non-solicitation that apply during employment and for one year following a termination of employment by us other than for cause or resignation by the Executive following a good reason event or for two years following a termination of employment for any other reason; provided that we may extend such period to two years following a termination of employment by us other than for cause or resignation by the Executive following a Good Reason Event if we continue to provide the severance payments described above for such period.
Potential Payments Upon Termination Of Employment Or Change Of Control
Our NEOs are entitled to certain payments in the event their employment is terminated by us other than for cause or by the NEO for good reason, as provided in “—Employment Agreements.” Additionally, certain of the options held by our NEOs would vest upon the occurrence of a Company Sale (as defined in the 2012 Equity Incentive Plan).
Director Compensation
Directors who are employed by us or who are full-time investment professionals of Advent are not eligible to receive compensation for their service on our Board. All other members of our Board received $250,000 as compensation for their services as members of our Board in 2016.
Following this offering, we expect to pay directors who are not employed by us and who are not full-time investment professionals of Advent an annual retention fee of $50,000 in cash. Such directors shall also receive an annual award of restricted stock units in an amount of $125,000, such award becoming fully vested on the one year anniversary of the grant date, and receive a fee of $2,000 per Board or committee meeting attended. Each such director shall also receive a one-time grant of restricted stock units upon election to the Board in an amount of $100,000, which award vesting in equal increments over a period of three years from the grant date. The chair of the audit committee, the chair of the compensation nominating and corporate governance committee will receive an additional annual fee in cash of $18,000 and $10,000, respectively. The Chairman of our Board will also receive an additional $50,000 annual fee in cash and an additional annual award of restricted stock units in an amount of $50,000.
Equity Incentive Plans
2011 Plan
The NCS Energy Holdings, LLC 2011 Equity Incentive Plan (the “2011 Plan”) provided awards to employees, directors and consultants of HoldCo. In connection with Advent’s acquisition of HoldCo in 2012, we assumed the outstanding options under the 2011 Plan and converted them into options to purchase shares of our common stock (the “Rollover Options”).
2012 Plan
The 2012 Plan provides for the grant of options, stock appreciation rights, restricted stock, dividend equivalents and other stock-based awards to employees, directors and consultants.
The 2012 Plan is administered by our Board. The Board has the authority to interpret and administer the 2012 Plan to determine to whom we grant incentive awards under the 2012 Plan, the type and amount of awards to be granted, the terms and conditions of the awards and the terms of award agreements. The Board, in its sole discretion, can interpret, clarify, construe or resolve any ambiguity in any provision of the 2012 Plan or any award agreement thereunder, accelerate or waive vesting of any award and exercisability of any award, extend the term or period of exercisability of any award, modify the purchase price, or waive any terms or conditions applicable to any award. All actions taken and all interpretations and determinations made by the Board shall be final and binding upon all 2012 Plan participants, us and all other interested parties.
103
Table of Contents
We do not intend to grant any awards under the 2012 Plan following the offering. The Board may amend, alter, suspend, discontinue or terminate the 2012 Plan or any award under the 2012 Plan at any time, provided such action will not adversely affect the rights granted to any participant under any outstanding award without the participant’s consent.
2017 Plan
In connection with this offering, our Board expects to adopt, and our stockholders expect to approve, the 2017 Plan prior to the completion of this offering. The following summary of certain features of the 2017 Plan is not a complete description of all of the provisions of the 2017 Plan, and is qualified in its entirety by reference to the full text of the 2017 Plan, a copy of which is filed as an exhibit to the registration statement of which this prospectus is a part.
Reservation of Shares
Subject to adjustments as described below, the maximum aggregate number of shares of common stock that may be issued pursuant to awards granted under the 2017 Plan will be 4,532,523. Any shares of common stock delivered under the 2017 Plan will consist of authorized and unissued shares, or treasury shares.
In the event of any recapitalization, reclassification, stock dividend, extraordinary dividend, stock split, reverse stock split, or other distribution with respect to our common stock, or any merger, reorganization, consolidation, combination, spin-off or other similar corporate change, or any other change affecting our common stock, appropriate and equitable adjustments will be made to the number and kind of shares of common stock available for grant, as well as to other maximum limitations under the 2017 Plan, and the number and kind of shares of common stock or other terms of the awards that are affected by the event.
Share Counting
Awards that are required to be paid in cash pursuant to their terms will not reduce the share reserve. To the extent that an award granted under the 2017 Plan is canceled, expired, forfeited, surrendered, settled by delivery of fewer shares than the number underlying the award or otherwise terminated without delivery of the shares to the participant, the shares of common stock retained by or returned to us will not be deemed to have been delivered under the 2017 Plan, and will be available for future awards under the 2017 Plan. Notwithstanding the foregoing, shares that are (i) withheld or separately surrendered from an award in payment of the exercise or purchase price or taxes relating to such an award or (ii) not issued or delivered as a result of the net settlement of an outstanding stock option or stock appreciation right will be deemed to constitute delivered shares and will not be available for future awards under the 2017 Plan.
Administration
The 2017 Plan will be administered by the compensation, nominating and corporate governance committee, such other committee of the Board appointed by the Board or the Board, as determined by the Board (the “Plan Administrator”). Subject to the limitations set forth in the 2017 Plan, the Plan Administrator has the authority to, among other things, determine the persons to whom awards are to be granted, prescribe the restrictions, terms and conditions of all awards, interpret the 2017 Plan and terms of awards and adopt rules for the administration, interpretation and application of the 2017 Plan.
Eligibility
Awards under the 2017 Plan may be granted to any employees, non-employee directors, consultants or other personal service providers to us or any of our subsidiaries.
104
Table of Contents
Stock Options
Stock options granted under the 2017 Plan may be issued as either incentive stock options, within the meaning of Section 422 of the Internal Revenue Code, or as nonqualified stock options. The exercise price of an option will be not less than 100% of the fair market value of a share of common stock on the date of the grant of the option, or such higher amount determined by the Plan Administrator. The Plan Administrator will determine the vesting and/or exercisability requirements and the term of exercise of each option, including the effect of termination of service of a participant or a change of control. The vesting requirements may be based on the continued employment or service of the participant for a specified time period or on the attainment of specified performance goals established by the Plan Administrator. The maximum term of an option will be ten years from the date of grant.
To exercise an option, the participant must pay the exercise price, subject to specified conditions, (i) in cash or, (ii) to the extent permitted by the Plan Administrator, (A) in shares of common stock, (B) through an open-market broker-assisted transaction, (C) by reducing the number of shares of common stock otherwise deliverable upon the exercise of the stock option, (D) by combination of any of the above methods, or (E) by such other method approved by the Plan Administrator, and must satisfy any required tax withholding amounts. All options generally are nontransferable. Without the prior approval of our stockholders, the 2017 Plan prohibits the cancellation of underwater stock options in exchange for cash or another award (other than in connection with a change of control) or the “repricing” of stock options. Dividends will not be paid with respect to stock options. Dividend equivalent rights may be granted with respect to the shares of common stock subject to stock options to the extent permitted by the Plan Administrator and set forth in the award agreement.
Stock Appreciation Rights
A stock appreciation right may be granted either in tandem with an option or without a related option. A stock appreciation right entitles the participant, upon settlement or exercise, to receive a payment based on the excess of the fair market value of a share of common stock on the date of settlement or exercise over the base price of the right, multiplied by the number of shares of common stock as to which the right is being settled or exercised. Stock appreciation rights may be granted on a basis that allows for the exercise of the right by the participant or that provides for the automatic payment of the right upon a specified date or event. The base price per share of a stock appreciation right may not be less than the fair market value of a share of common stock on the date of grant. The Plan Administrator will determine the vesting requirements and the term of exercise of each stock appreciation right, including the effect of termination of service of a participant or a change of control. The vesting requirements may be based on the continued employment or service of the participant for a specified time period or on the attainment of specified business performance goals established by the Plan Administrator. The maximum term of a stock appreciation right will be ten years from the date of grant. Stock appreciation rights may be payable in cash or in shares of common stock or in a combination of both. Without the prior approval of our stockholders, the 2017 Plan prohibits the cancellation of underwater stock appreciation rights in exchange for cash or another award (other than in connection with a change of control) or the “repricing” of stock appreciation rights. Dividends shall not be paid with respect to stock appreciation rights. Dividend equivalent rights may be granted with respect to the shares of common stock subject to stock appreciation rights to the extent permitted by the Plan Administrator and set forth in the award agreement.
Restricted Stock Awards
A restricted stock award represents shares of common stock that are issued subject to restrictions on transfer and vesting requirements. The vesting requirements may be based on the continued service of the participant for a specified time period or on the attainment of specified performance goals established by the Plan Administrator, and/or on such other terms and conditions as approved by the Plan Administrator in its discretion. Unless otherwise set forth in an award agreement, restricted stock award holders will have all of the rights of our stockholders, including the right to vote the shares and the right to receive dividends, during the restricted period.
105
Table of Contents
Any dividends with respect to a restricted stock award that is subject to performance-based vesting may be subject to the same restrictions on transfer and vesting requirements as the underlying restricted stock award.
Restricted Stock Units
An award of an RSU provides the participant the right to receive a payment based on the value of a share of common stock. RSUs may be subject to vesting requirements, restrictions and conditions to payment. Such requirements may be based on the continued service of the participant for a specified time period, on the attainment of specified performance goals established by the Plan Administrator and/or on such other terms and conditions as approved by the Plan Administrator in its discretion. In addition, an RSU may be designated as a performance stock unit (“PSU”), the vesting requirements of which may be based, in whole or in part, on the attainment of pre-established performance goal(s) over a specified performance period designed to meet the requirements for exemption under Section 162(m) of the Internal Revenue Code, or otherwise, as approved by the Plan Administrator in its discretion. An RSU award will become payable to a participant at the time or times determined by the Plan Administrator and set forth in the award agreement, which may be upon or following the vesting of the award. RSUs are payable in cash or in shares of common stock or in a combination of both. RSUs may, but are not required to, be granted together with a dividend equivalent right with respect to the shares of common stock subject to the award. Dividend equivalent rights may be subject to conditions that apply to the underlying RSUs.
Stock Awards
A stock award represents shares of common stock that are issued free of restrictions on transfer and free of forfeiture conditions and to which the participant is entitled all incidents of ownership. A stock award may be granted for past services, in lieu of bonus or other cash compensation, directors’ fees or for any other valid purpose as determined by the Plan Administrator. The Plan Administrator will determine the terms and conditions of stock awards, and such stock awards may be made without vesting requirements, subject to certain conditions. Upon the issuance of shares of common stock under a stock award, the participant will have all rights of a stockholder with respect to such shares of common stock, including the right to vote the shares and receive all dividends and other distributions on the shares.
Cash Performance Awards
A cash performance award is denominated in a cash amount (rather than in shares) and is payable based on the attainment of pre-established business and/or individual performance goals over a specified performance period. The requirements for vesting may be also based upon the continued service of the participant during the performance period. The maximum amount of cash performance awards intended to qualify as “performance-based compensation” under Section 162(m) of the Internal Revenue Code that may be paid to a participant during any one calendar year under all cash performance awards is $15.0 million.
Performance Criteria
For purposes of cash performance awards, PSUs, as well as for any other awards under the 2017 Plan intended to qualify as “performance-based compensation” under Section 162(m) of the Internal Revenue Code, the performance criteria will be one or any combination of the following, for us or any identified subsidiary or business unit, as determined by the Plan Administrator at the time of the award: (i) net earnings; (ii) earnings per share; (iii) net debt; (iv) revenue or sales growth; (v) net or operating income; (vi) net operating profit; (vii) return measures (including, but not limited to, return on assets, capital, equity or sales); (viii) cash flow (including, but not limited to, operating cash flow, distributable cash flow and free cash flow); (ix) earnings before or after taxes, interest, depreciation, amortization and/or rent; (x) share price (including, but not limited to growth measures and total stockholder return); (xi) expense control or loss management; (xii) market share; (xiii) economic value added; (xiv) working capital; (xv) the formation of joint ventures or the completion of
106
Table of Contents
other corporate transactions; (xvi) gross or net profit margins; (xvii) revenue mix; (xviii) operating efficiency; (xix) product diversification; (xx) market penetration; (xxi) measurable achievement in quality, technology, operation or compliance initiatives; (xxii) quarterly dividends or distributions; (xxiii) employee retention or turnover; (xxiv) operating income before depreciation, amortization and certain additional adjustments to operating income permitted under our senior secured credit facilities, and/or (xxv) any combination of or a specified increase or decrease, as applicable in any of the foregoing. Each of the performance criteria shall be applied and interpreted in accordance with an objective formula or standard established by the Plan Administrator at the time the applicable award is granted including, without limitation, GAAP.
At the time that an award is granted, the Plan Administrator may provide that performance will be measured in such objective manner as it deems appropriate, including, without limitation, adjustments to reflect charges for restructurings, non-operating income, the impact of corporate transactions or discontinued operations, events that are unusual in nature or infrequent in occurrence and other non-recurring items, currency fluctuations, litigation or claim judgments, settlements and the cumulative effects of accounting or tax law changes. In addition, with respect to a participant hired or promoted following the beginning of a performance period, the Plan Administrator may determine to prorate the amount of any payment in respect of such participant’s cash performance awards or PSUs for the partial performance period, to the extend not inconsistent with Section 162(m) of the Internal Revenue Code.
Further, the Plan Administrator shall, to the extent provided in an award agreement, have the right, in its discretion, to reduce or eliminate the amount otherwise payable to any participant under an award and to establish rules or procedures that have the effect of limiting the amount payable to any participant to an amount that is less than the amount that is otherwise payable under an award. Following the conclusion of the performance period, the Plan Administrator shall certify in writing whether the applicable performance goals have been achieved.
Award Limitations
For purposes of complying with the requirements of Section 162(m) of the Internal Revenue Code, the maximum number of shares of common stock that may be subject to stock options, stock appreciation rights, performance-based restricted stock awards, performance-based RSUs and performance-based stock awards granted to any participant other than a non-employee director during any calendar year will be limited to 450,000 shares of common stock for each such award type individually.
Further, no non-employee director may be granted, during any calendar year, awards under the 2017 Plan having a fair value (determined on the date of grant) that, when added to all cash compensation paid to the non-employee director during the same calendar year, exceed $750,000.
Effect of Change of Control
Upon the occurrence of a “change of control” (as defined in the 2017 Plan), unless otherwise provided in the applicable award agreement, the Plan Administrator is authorized to make adjustments in the terms and conditions of outstanding awards, including without limitation the following (or any combination thereof): (i) continuation or assumption of such outstanding awards by us (if it is the surviving company or corporation) or by the surviving company or corporation or its parent; (ii) substitution by the surviving company or corporation or its parent of awards with substantially the same terms as such outstanding awards (with appropriate adjustments to the type of consideration payable upon settlement of the awards); (iii) acceleration of exercisability, vesting and/or payment; and (iv) if all or substantially all of our outstanding shares of common stock are transferred in exchange for cash consideration in connection with such change of control: (A) upon written notice, provide that any outstanding stock options and stock appreciation rights are exercisable during a reasonable period of time immediately prior to the scheduled consummation of the event or such other reasonable period as determined by the Plan Administrator (contingent upon the consummation of the event), and at the end
107
Table of Contents
of such period, such stock options and stock appreciation rights will terminate to the extent not so exercised within the relevant period; and (B) cancel all or any portion of outstanding awards for fair value, as determined in the sole discretion of the Plan Administrator.
Substitute Awards in Corporate Transactions
The Plan Administrator may grant awards under the 2017 Plan to employees or directors of corporations that are acquired by us in substitution of awards previously granted by such corporations to such persons. Any such substitute awards shall not reduce the share reserve; provided, however, that such treatment is permitted by applicable law and the listing requirements of the NASDAQ or other exchange or securities market on which the common stock is listed.
Forfeiture / Right of Recapture
The Plan Administrator may specify in an award agreement that an award will be subject to reduction, cancellation, forfeiture or recoupment upon the occurrence of certain specified events, including termination of service for “cause” (as defined in the 2017 Plan) or a participant’s violation of any continuing obligation or duty of the participant in respect of the Company.
If within one year (or such longer time specified in an award agreement or other agreement or policy applicable to a participant) after the date on which a participant exercises a stock option or stock appreciation right or on which a stock award, restricted stock award or restricted stock unit vests or becomes payable or on which a cash performance award is paid to a participant, or on which income otherwise is realized by a participant in connection with an Award, either (i) a participant is terminated for cause, (ii) the Plan Administrator determines in its discretion that the participant is subject to any recoupment of benefits pursuant to our compensation recovery policy, “clawback” or similar policy, as may be in effect from time to time, or (iii) after a participant is terminated for any other reason, the Plan Administrator determines in its discretion either that, (A) during the participant’s period of service, the participant engaged in an act or omission which would have warranted termination of service for “cause” and a forfeiture event has occurred with respect to the participant or (B) after termination, the participant engaged in conduct that materially violated any continuing obligation or duty of the participant in respect of us or any of our subsidiaries, then, at the sole discretion of the Plan Administrator, any gain realized by the participant from the exercise, vesting, payment or other realization of income by the participant in connection with an award, will be paid by the participant to us upon notice from us, subject to applicable state law.
Participants may be subject to our compensation recovery policy, “clawback” or similar policy, as may be in effect from time to time and/or any compensation recovery, “clawback” or similar policy made applicable by law including the Dodd-Frank Wall Street Reform and Consumer Protection Act.
Awards to Non U.S. Participants
To comply with the laws in countries other than the United States in which we or any of our subsidiaries or affiliates operates or has employees, non-employee directors or consultants, the Plan Administrator, in its sole discretion, has the power and authority to (i) modify the terms and conditions of any award granted to participants outside the United States to comply with applicable foreign laws, (ii) take any action, before or after an award is made, that it deems advisable to obtain approval or comply with any necessary local government regulatory exemptions or approvals and (iii) establish subplans and modify exercise procedures and other terms and procedures, to the extent such actions may be necessary or advisable.
We will adopt an addendum to the 2017 Plan applicable to participants who are non U.S. residents which may include terms that vary from the terms described in this summary.
108
Table of Contents
Term, Amendment and Termination
The term of the 2017 Plan is ten years from the date it is approved by the stockholders. Our Board may amend, modify, suspend or terminate the 2017 Plan at any time, provided, however, that no termination or amendment of the 2017 Plan will materially and adversely affect any award granted under the 2017 Plan without the consent of the participant or the permitted transferee of the award. Our Board may seek the approval of any amendment by our stockholders to the extent it deems necessary for purposes of compliance with Section 162(m) or Section 422 of the Internal Revenue Code, the listing requirements of the NASDAQ, or for any other purpose. Notwithstanding the foregoing, our Board shall have broad authority to amend the 2017 Plan and any award without the consent of a participant to the extent it deems necessary or desirable in its discretion to comply with, take into account changes in, or interpretation of, applicable tax laws, securities laws, employment laws, accounting rules and other applicable laws, rules and regulations.
Anticipated Awards in Connection with this Offering
In connection with this offering, we expect to grant an aggregate of 59,090 restricted stock units to members of our Board, who will receive the following grants:
| Name |
Number of Restricted Stock Units | |
| Michael McShane |
10,606 | |
| John Deane |
7,576 | |
| Matthew Fitzgerald |
13,636 | |
| W. Matt Ralls |
13,636 | |
| Franklin Myers |
13,636 |
The amount of restricted stock units shown in the table above includes annual grants to be made to members of our Board as well as initial grants made to each of Mr. Fitzgerald, Mr. Ralls and Mr. Myers in connection with their election to our Board.
109
Table of Contents
PRINCIPAL AND SELLING STOCKHOLDERS
The following table shows information as of March 31, 2017 regarding the beneficial ownership of our common stock (1) immediately following the 3.00 for 1.00 stock split of our common stock that occurred on April 13, 2017 and (2) as adjusted to give effect to this offering by:
| • | each person or group who is known by us to own beneficially more than 5% of our common stock; |
| • | each member of our Board and each of our named executive officers; |
| • | all members of our Board and our executive officers as a group; and |
| • | each selling stockholder. |
Beneficial ownership of shares is determined under rules of the SEC and generally includes any shares over which a person exercises sole or shared voting or investment power. Except as noted by footnote, and subject to community property laws where applicable, we believe based on the information provided to us that the persons and entities named in the table below have sole voting and investment power with respect to all shares of our common stock shown as beneficially owned by them. Percentage of beneficial ownership is based on 34,005,978 shares of common stock outstanding as of March 31, 2017 after giving effect to the 3.00 for 1.00 stock split of our common stock that occurred on April 13, 2017, and 43,505,978 shares of common stock outstanding after giving effect to this offering. Shares of common stock subject to options currently exercisable or exercisable within 60 days of the date of this prospectus are deemed to be outstanding and beneficially owned by the person holding the options for the purposes of computing the percentage of beneficial ownership of that person and any group of which that person is a member, but are not deemed outstanding for the purpose of computing the percentage of beneficial ownership for any other person. Except as otherwise indicated, the persons named in the table below have sole voting and investment power with respect to all shares of capital stock held by them. The table does not reflect any shares of common stock that directors may purchase in this offering through the directed share program described under “Underwriting (Conflicts of Interest).” Unless otherwise indicated, the address for each holder listed below is 19450 State Highway 249, Suite 200, Houston, TX 77070.
| Shares of common stock beneficially owned before this offering |
Shares of common stock beneficially owned after this offering (assuming no exercise of the option to purchase additional shares) |
Number of shares of common stock being offered assuming full exercise of the option to purchase additional shares |
Shares of common stock beneficially owned after this offering assuming full exercise of the option to purchase additional shares |
|||||||||||||||||||||||||||||
| Name and address of |
Number of shares |
Percentage of shares |
Number of shares |
Percentage of shares |
Number of shares |
% of shares |
Number of shares |
Percentage of shares |
||||||||||||||||||||||||
| 5% stockholders: |
||||||||||||||||||||||||||||||||
| Advent Funds(1) |
30,943,536 | 91.0 | % | 30,943,536 | 71.1 | % | 1,375,000 | 4.4 | % | 29,597,677 | 65.9 | % | ||||||||||||||||||||
| Cemblend(2) |
1,819,247 | 5.1 | % | 1,819,247 | 4.0 | % | 50,000 | 2.7 | % | 1,769,247 | 3.8 | % | ||||||||||||||||||||
| Named executive officers and directors: |
||||||||||||||||||||||||||||||||
| Robert Nipper(3) |
2,089,617 | 6.1 | % | 2,089,617 | 4.4 | % | — | — | 2,089,617 | 4.4 | % | |||||||||||||||||||||
| Tim Willems |
605,172 | 1.8 | % | 605,172 | 1.4 | % | — | — | 605,172 | 1.4 | % | |||||||||||||||||||||
| Wade Bitter(4) |
68,091 | * | 68,091 | * | — | — | 68,091 | * | ||||||||||||||||||||||||
| Marty Stromquist(5) |
1,232,102 | 3.5 | % | 1,232,102 | 2.8 | % | 25,000 | 2.0 | % | 1,207,102 | 2.6 | % | ||||||||||||||||||||
| John Deane(6) |
380,997 | 1.1 | % | 380,997 | * | — | — | 380,997 | * | |||||||||||||||||||||||
| Gurinder Grewal(7) |
— | — | — | — | — | — | — | — | ||||||||||||||||||||||||
| Matthew Fitzgerald |
— | — | — | — | — | — | — | — | ||||||||||||||||||||||||
| David McKenna(8) |
— | — | — | — | — | — | — | — | ||||||||||||||||||||||||
| Michael McShane |
266,364 | * | 266,364 | * | — | — | 266,364 | * | ||||||||||||||||||||||||
| Franklin Myers |
— | — | — | — | — | — | — | — | ||||||||||||||||||||||||
| W. Matt Ralls |
— | — | — | — | — | — | — | — | ||||||||||||||||||||||||
| All Board members and executive officers as a group (12 persons) |
|
4,688,399 |
|
|
13.1 |
% |
|
4,688,399 |
|
10.3 | % | — | — |
|
4,663,399 |
|
10.0 | % | ||||||||||||||
| * | Represents beneficial ownership of less than 1% of our outstanding common stock. |
110
Table of Contents
| (1) | Consists of 3,864,846 shares indirectly owned by Advent International GPE VII Limited Partnership, 3,577,074 shares indirectly owned by Advent International GPE VII-A Limited Partnership, 8,989,098 shares indirectly owned by Advent International GPE VII-B Limited Partnership, 2,856,087 shares indirectly owned by Advent International GPE VII-C Limited Partnership, 2,314,575 shares indirectly owned by Advent International GPE VII-D Limited Partnership 6,476,481 shares indirectly owned by Advent International GPE VII-E Limited Partnership, 835,476 shares indirectly owned by Advent International GPE VII-F Limited Partnership, 835,476 shares indirectly owned by Advent International GPE VII-G Limited Partnership, 504,381 shares indirectly owned by Advent International GPE VII-H Limited Partnership, 12,378 shares indirectly owned by Advent Partners GPE VII Limited Partnership, 30,945 shares indirectly owned by Advent Partners GPE VII-A Limited Partnership, 303,246 shares indirectly owned by Advent Partners GPE VII-B Cayman Limited Partnership, 272,304 shares indirectly owned by Advent Partners GPE VII Cayman Limited Partnership and 71,169 shares indirectly owned by Advent Partners GPE VII-A Cayman Limited Partnership. Advent-NCS Acquisition L.P. directly owns 30,943,536 shares. The general partner of Advent-NCS Acquisition L.P. is Advent-NCS GP LLC. Advent International GPE VII Limited Partnership, Advent International GPE VII-A Limited Partnership, Advent International GPE VII-B Limited Partnership, Advent International GPE VII-C Limited Partnership, Advent International GPE VII-D Limited Partnership, Advent International GPE VII-E Limited Partnership, Advent International GPE VII-F Limited Partnership, Advent International GPE VII-G Limited Partnership, Advent International GPE VII-H Limited Partnership, Advent Partners GPE VII Limited Partnership, Advent Partners GPE VII-A Limited Partnership, Advent Partners GPE VII-B Cayman Limited Partnership, Advent Partners GPE VII Cayman Limited Partnership and Advent Partners GPE VII-A Cayman Limited Partnership collectively own 100% of Advent-NCS Acquisition L.P. in pro rata proportion to the number of shares above disclosed as owned by each fund. |
| Advent is the manager of Advent International GPE VII LLC, which is the general partner of Advent Partners GPE VII Limited Partnership, Advent Partners GPE VII-A Limited Partnership, Advent Partners GPE VII Cayman Limited Partnership, Advent Partners GPE VII-A Cayman Limited Partnership, Advent Partners GPE VII-B Cayman Limited Partnership; and, GPE VII GP Limited Partnership, General Partner which in turn is the limited partner of Advent International GPE VII-A Limited Partnership, Advent International GPE VII-E Limited Partnership and Advent International GPE VII-H Limited Partnership; and GPE VII GP (Delaware) Limited Partnership, General Partner which in turn is the general partner of Advent International GPE VII Limited Partnership, Advent International GPE VII-B Limited Partnership, Advent International GPE VII-C Limited Partnership, Advent International GPE VII-D Limited Partnership, Advent International GPE VII-F Limited Partnership and Advent International GPE VII-G Limited Partnership. Advent exercises voting and investment power over the shares held by each of these entities and may be deemed to have beneficial ownership of these shares. With respect to the shares held by the Advent Funds, a number of individuals currently composed of David M. McKenna, David M. Mussafer and Steven M. Tadler, none of whom have individual voting or investment power, exercise voting and investment power over the shares beneficially owned by Advent. The address of Advent and each of the funds and other entities listed above is c/o Advent International Corporation, 75 State Street, Floor 29, Boston, MA 02109. |
| (2) | Includes 909,623 shares held by Mr. Stromquist as a 50% owner of Cemblend. |
| (3) | Consists of 185,250 shares held by Mr. Nipper individually and 1,904,367 shares held by Nipper Family Limited Partnership (the “Nipper Family Partnership”). Mr. Nipper exercises sole voting and investment power over the shares beneficially owned by the Nipper Family Partnership. |
| (4) | Consists of 58,971 shares held by the Wade C. Bitter and Susan L. Bitter Revocable 2013 Trust. Wade and Susan Bitter share voting and investment power over the shares beneficially owned by the Wade C. Bitter and Susan L. Bitter Revocable 2013 Trust. |
| (5) | Consists of 322,479 shares held by Mr. Stromquist individually and 909,623 shares held by Mr. Stromquist as a 50% owner of Cemblend. |
| (6) | Consists of 380,997 shares held by the Deane Family Partnership Limited. Mr. Deane holds sole voting and investment power over the shares beneficially owned by the Deane Family Partnership Limited. |
111
Table of Contents
| (7) | Mr. Grewal holds no shares directly. Mr. Grewal is a managing director at Advent, which manages funds that collectively own 30,943,536 shares. See footnote (1) above. The address of Mr. Grewal is c/o Advent International Corporation, 75 State Street, Floor 29, Boston, MA 02109. |
| (8) | Mr. McKenna holds no shares directly. Mr. McKenna is a managing partner at Advent, which manages funds that collectively own 30,943,536 shares. See footnote (1) above. Mr. McKenna’s address is c/o Advent International Corporation, 75 State Street, Floor 29, Boston, MA 02109. |
112
Table of Contents
CERTAIN RELATIONSHIPS AND RELATED PARTY TRANSACTIONS
Set forth below is a description of certain relationships and related person transactions between us or our subsidiaries and our directors, executive officers or holders of more than 5% of our voting securities.
Stockholders Agreement
On December 20, 2012, we entered into a stockholders agreement with the Advent Funds, Nipper Corporate Holdings, LLC, SKPT Holdings, LLC, Robert Key and Cemblend Systems, Inc., a holding company jointly owned by Mr. Stromquist and Mr. Getzlaf (“Cemblend”), and a stockholder of HoldCo, which was subsequently amended on April 1, 2013 (the “Stockholders Agreement”). The Stockholders Agreement contains provisions relating to the election of directors, stock transfer restrictions with respect to stock held by non-Advent stockholders, drag-along rights in favor of Advent and tag-along rights, preemptive rights, our right to repurchase stock from non-Advent stockholders upon termination of employment and noncompetition, nonsolicitation and confidentiality restrictions for non-Advent stockholders. The Stockholders Agreement will be terminated upon consummation of this offering and will be replaced by the provisions of the Registration Rights Agreement described below.
Registration Rights Agreement
In connection with this offering, we intend to enter into a registration rights agreement that will provide the Advent Funds an unlimited number of “demand” registrations and customary “piggyback” registration rights, and will provide certain members of our management with customary “piggyback” registration rights. The registration rights agreement will also provide that we will pay certain expenses relating to such registrations and indemnify the registration rights holders against certain liabilities which may arise under the Securities Act.
Dividend
On August 7, 2014, we paid a cash dividend of approximately $150.0 million (“2014 Dividend”) which included two components, (i) $146.9 million related to declared dividends and (ii) $3.1 million related to dividends treated as compensation. Pursuant to the 2014 Dividend (i) each holder of our common stock received $4.65 for each share of common stock held by such stockholder and (ii) each holder of options issued under the NCS Energy Holdings, LLC 2011 Equity Incentive Plan received $4.65 for each option held by such option holder, as applicable. Options issued prior to such date pursuant to our 2012 Equity Incentive Plan were adjusted by reducing the per share strike price by $4.65. The following directors, executive officers and holders of more than 5% of our common stock received the dividend payments listed below:
| Directors, Executive Officers and 5% Stockholders |
Total Dividend Received | |||
| Advent Funds |
$ | 125,854,448 | ||
| Robert Nipper(1) |
8,611,095 | |||
| Marty Stromquist(2) |
5,357,265 | |||
| Don Getzlaf(3) |
5,357,265 | |||
| Tim Willems(4) |
2,449,707 | |||
| John Deane |
883,185 | |||
| Michael McShane |
220,793 | |||
| Wade Bitter(5) |
212,565 | |||
| John Ravensbergen |
27,569 | |||
| (1) | Consists of $861,110 received by Mr. Nipper individually and $7,749,985 received by Nipper Family Partnership. |
| (2) | Consists of $1,129,009 received by Mr. Stromquist individually and $4,228,256 received by Mr. Stromquist as a 50% owner of Cemblend. |
113
Table of Contents
| (3) | Consists of $1,129,009 received by Mr. Getzlaf individually and $4,228,256 received by Mr. Getzlaf as a 50% owner of Cemblend. |
| (4) | Consists of $556,004 received by Mr. Willems individually and $1,893,701 received by Willems Family Limited Partnership. |
| (5) | Consists of $212,565 received by the Wade C. Bitter and Susan L. Bitter Revocable 2013 Trust. |
Cemblend Transactions
In connection with Advent’s acquisition of HoldCo in 2012, we entered into an exchange agreement with Cemblend, HoldCo and NCS Multistage Inc. (formerly known as NCS Oilfield Services Canada, Inc.) (“Exchangeco”), dated December 20, 2012 (the “Exchange Agreement”). Pursuant to the Exchange Agreement, we exchanged Cemblend’s exchangeable shares, which were exchangeable for common units of HoldCo, for 1,819,247 shares of Exchangeco which are exchangeable on a one-to-one basis for shares of our common stock.
In connection with the 2014 Dividend, we provided a loan in the amount of approximately $750,000 to Cemblend for the payment of withholding taxes payable by Cemblend as a result of the 2014 Dividend. Cemblend repaid the loan in February 2017.
From time to time we purchase services and a grease product produced by Cemblend to use with our products and services. Payments to Cemblend for the services and grease totaled approximately $49,000 and $59,000 for the fiscal years ending December 31, 2016 and 2015, respectively.
Subscription Agreement
In December 2015, we entered into a subscription agreement with the Advent Funds pursuant to which the Advent Funds purchased an aggregate of 3,868,539 shares of our common stock for an aggregate purchase price of $36,957,442, or approximately $9.55 per share. In connection with the purchase by the Advent Funds, certain other parties to the Stockholders Agreement exercised their preemptive rights and purchased additional shares. In addition, the offering was extended to all option holders. The following directors, executive officers and holders of more than 5% of our common stock purchased the number of shares listed below at a purchase price of $9.55 per share:
| Directors, Executive Officers and 5% Stockholders |
Shares Purchased | |||
| Advent Funds |
3,868,539 | |||
| Robert Nipper(1) |
104,676 | |||
| Ryan Hummer |
8,250 | |||
| Wade Bitter(2) |
10,500 | |||
| Tim Willems(3) |
41,868 | |||
| John Ravensbergen |
5,100 | |||
| Dustin Ellis |
2,094 | |||
| Mike McKown |
600 | |||
| Dave Anderson |
11,445 | |||
| John Deane(4) |
24,633 | |||
| Michael McShane |
52,500 | |||
| (1) | Consists of 104,676 purchased by Nipper Family Partnership. |
| (2) | Consists of 10,500 purchased by Wade C. Bitter and Susan L. Bitter Revocable 2013 Trust. |
| (3) | Consists of 41,868 purchased by Willems Family LP. |
| (4) | Consists of 24,633 purchased by Deane Family Partnership Limited. |
114
Table of Contents
Board Compensation
Our directors who are our employees, employees of our subsidiaries or employees of Advent will receive no compensation for their service as members of our Board, except as limited to expense reimbursement. Our other directors will receive compensation for their service as members of our Board.
Employment Agreements
We have entered into an employment agreement with each of our NEOs as well as other executive officers.
Indemnification Agreements
We intend to enter into indemnification agreements with each of our directors prior to the completion of this offering. The indemnification agreements will provide the directors with contractual rights to indemnification, expense advancement and reimbursement, to the fullest extent permitted under the DGCL, subject to certain exceptions contained in those agreements.
Policies for Approval of Related Person Transactions
In connection with this offering, we will adopt a written policy relating to the approval of related person transactions. A “related person transaction” is a transaction or arrangement or series of transactions or arrangements in which we participate (whether or not we are a party) and a related person has a direct or indirect material interest in such transaction. Our audit committee will review and approve or ratify all relationships and related person transactions between us and (i) our directors, director nominees or executive officers, (ii) any 5% record or beneficial owner of our common stock or (iii) any immediate family member of any person specified in (i), (ii) and (iii) above.
As set forth in the related person transaction policy, in the course of its review and approval or ratification of a related party transaction, the audit committee will, in its judgment, consider in light of the relevant facts and circumstances whether the transaction is, or is not inconsistent with, our best interests, including consideration of various factors enumerated in the policy.
Any member of the audit committee who is a related person with respect to a transaction under review will not be permitted to participate in the discussions or approval or ratification of the transaction. However, such member of the audit committee will provide all material information concerning the transaction to the audit committee. Our policy also includes certain exceptions for transactions that need not be reported and provides the audit committee with the discretion to pre-approve certain transactions.
115
Table of Contents
DESCRIPTION OF MATERIAL INDEBTEDNESS
Secured Credit Facilities
On August 7, 2014, Pioneer Investment, Inc., a wholly owned indirect subsidiary of the company (the “Borrower”), Pioneer Intermediate, Inc., a wholly owned direct subsidiary of the company (the “Parent Guarantor”) and certain of their subsidiaries entered into senior secured credit facilities (the “Senior Secured Credit Facilities”) arranged by Wells Fargo Securities, LLC, HSBC Bank Canada and Citibank, N.A. The Senior Secured Credit Facilities consist of a term loan in the original principal amount of $197,640,000 CAD (the “Term Loan”) and a $38,430,000 CAD revolving credit facility (the “Revolving Credit Facility”), of which $5,000,000 CAD may be made available for letters of credit and $10,000,000 CAD may be made available for swingline loans. The Senior Secured Credit Facilities were amended on April 15, 2015 (the “First Amendment”) to, among other things, amend certain of the financial covenants described below. The Senior Secured Credit Facilities were further amended on December 22, 2015 (the “Second Amendment”) to, among other things, further amend certain of the financial covenants described below, to evidence the prepayment of the Term Loan in an amount of $55,784,000 CAD and the reduction of the commitments under the Revolving Credit Facility from $38,430,000 CAD to $27,800,000 CAD and to reduce the amount available for swingline loans under the Revolving Credit Facility from $10,000,000 CAD to $5,000,000 CAD. The description of the Senior Secured Credit Facilities below gives effect to the First Amendment and Second Amendment thereto. We intend to terminate the Senior Secured Credit Facilities in connection with this offering and enter into a new revolving credit facility.
Interest Rate and Fees
Borrowings under the Senior Secured Credit Facilities bear interest at a rate per annum equal to the applicable margin plus a base rate determined by reference to the highest of either: (a) in the case of loans denominated in U.S. dollars, at our election, either (i) (A) the federal funds rate plus 0.5%, (B) one-month LIBOR plus 1.00% and (C) the prime commercial lending rate of the administrative agent as in effect on the relevant day or (ii) the LIBOR rate determined by reference to the applicable Reuters screen two business days prior to the commencement of the interest period relevant to the subject borrowing or (b) in the case of loans denominated in Canadian dollars, at our election, either (i)(A) the prime commercial lending rate of the administrative agent as in effect on the relevant day for determining interest rates on Canadian dollar denominated commercial loans made in Canada and (B) CDOR plus 1.0% or (ii) the CDOR rate determined by reference to the applicable Reuters screen page for a term equal to the interest period or contract period relevant to the subject borrowing.
The applicable margin for loans under the Senior Secured Credit Facilities is determined in accordance with the table set forth below, with the leverage ratio determined in accordance with the terms of the documentation governing the Senior Secured Credit Facilities:
| Leverage Ratio |
Applicable Margin for Eurocurrency / B/A Advances |
Applicable Margin for Base Rate Loans |
||||||
| Less than 1.50:1.00 |
3.25 | % | 2.25 | % | ||||
| Equal to or greater than 1.50:1.00 but less than 2.00:1.00 |
3.50 | % | 2.50 | % | ||||
| Equal to or greater than 2.00:1.00 but less than 2.50:1.00 |
3.75 | % | 2.75 | % | ||||
| Greater than or equal to 2.50:1.00 but less than 3.00:1.00 |
4.00 | % | 3.00 | % | ||||
| Greater than or equal to 3.00:1.00 but less than 3.50:1.00 |
4.25 | % | 3.25 | % | ||||
| Greater than or equal to 3.50:1.00 but less than 4.00:1.00 |
4.50 | % | 3.50 | % | ||||
| Greater than or equal to 4.00:1.00 |
4.75 | % | 3.75 | % | ||||
The following fees are required to be paid under the Senior Secured Credit Facilities:
| • | a commitment fee to each revolving lender on the average daily unused portion of such revolving lender’s revolving credit commitment of 0.25% per annum when the leverage ratio is less than 1.50 to 1.00, |
116
Table of Contents
| 0.375% when the leverage ratio is equal to or greater than 1.50 to 1.00 but less than 2.00 to 1.00, 0.50% when the leverage ratio is equal to or greater than 2.00 to 1.00 but less than 3.50 to 1.00 and 0.65% when the leverage ratio is greater than or equal to 3.50 to 1.00; |
| • | a participation fee to each revolving lender on the daily face amount of such revolving lender’s letter of credit exposure at a rate equal to the greater of (i) the applicable margin for LIBOR loans under the revolving credit facility and (ii) $600 CAD per letter of credit (or $600 per letter of credit denominated in U.S. dollars); |
| • | an annual fronting fee to each issuing lender equal to the greater of (i) 0.20% per annum on the face amount of such letter of credit and (ii) $600 CAD per annum (or $600 per annum for letters of credit denominated in U.S. dollars); and |
| • | a customary annual administration fee to the administrative agent. |
Voluntary Prepayments
Subject to certain notice requirements, the Borrower may voluntarily prepay outstanding loans under the Senior Secured Credit Facilities in whole or in part without premium or penalty other than customary “breakage” costs with respect to Eurocurrency Advances.
Mandatory Prepayments
The documentation governing the Senior Secured Credit Facilities requires us to prepay the Term Loan outstanding thereunder:
| • | if the Leverage Ratio is greater than 2.00 to 1.00 at December 31 of any year (as determined based upon the annual financial statements of the Parent Guarantor), with 50% of excess cash flow for such year (as determined in accordance with the terms of the documentation governing the Senior Secured Credit Facilities) for each fiscal year, minus, at the option of the Borrower, the amount of any voluntary prepayment under the Senior Secured Credit Facilities (in the case of any voluntary prepayment of revolving loans under the Senior Secured Credit Facilities, to the extent accompanied by a permanent reduction of the related commitment); |
| • | with 100% of the net cash proceeds of certain asset sales above a threshold amount and/or insurance/condemnation events, subject to reinvestment rights and other exceptions; |
| • | with 100% of the net cash proceeds of any issuance or incurrence of debt that is not permitted by the terms of the documentation governing the Senior Secured Credit Facilities; and |
| • | with the proceeds of any equity contribution made to cure a breach of any financial covenant |
Final Maturity and Amortization
The Term Loan and the Revolving Credit Facility under the Senior Secured Credit Facilities will mature on August 7, 2019.
The Borrower is required to make quarterly amortization payments in respect of the Term Loan under the Senior Secured Credit Facilities in an amount equal to (i) 2.50% of the original principal amount thereof for each fiscal quarter ending prior to December 31, 2016, (ii) 3.75% of the original principal amount thereof for each fiscal quarter ending on or after December 31, 2016 and prior to December 31, 2018 and (iii) an amount equal to 5.00% of the original principal amount thereof for each fiscal quarter ending on or after December 31, 2018. A prepayment of $55,784,000 CAD made in connection with the Second Amendment was applied to reduce the amortization payments due for the quarters ending December 31, 2015, March 31, 2016, June 30, 2016, September 30, 2016, December 31, 2016, March 31, 2017, June 30, 2017, September 30, 2017 and, to the extent of any remaining amount of the prepayment, December 31, 2017 and any fiscal quarter thereafter.
117
Table of Contents
Borrowers and Guarantors
Pioneer Investment, Inc. is the borrower under the Senior Secured Credit Facilities.
The obligations of the Borrower under the Senior Secured Credit Facilities are guaranteed by the Parent Guarantor and each wholly-owned domestic subsidiary of the Borrower, subject to certain exceptions.
Security
The obligations under the Senior Secured Credit Facilities are secured by first priority security interests in substantially all of the assets of the Borrower and the guarantors, subject to permitted liens and other exceptions, a pledge of all capital stock of the Borrower and each guarantor, a pledge of all of the capital stock of NCS Multistage, Inc. and the pledge of 65% of the capital stock of other foreign subsidiaries, subject to customary exclusions.
Certain Covenants, Representations and Warranties
The agreements governing the Senior Secured Credit Facilities contain customary representations and warranties, affirmative covenants (including reporting obligations) and negative covenants. With respect to the negative covenants, these restrictions include, among other things and subject to certain exceptions, restrictions on the ability of the Borrower and its subsidiaries’ ability to:
| • | incur additional indebtedness; |
| • | grant liens; |
| • | enter into burdensome agreements with negative pledge clauses or restrictions on subsidiary distributions; |
| • | make certain investments; |
| • | pay dividends; |
| • | make payments in respect of junior lien or subordinated debt; |
| • | make acquisitions; |
| • | consolidate, amalgamate, merge, liquidate or dissolve; |
| • | sell, transfer or otherwise dispose of assets; |
| • | make certain organizational changes (including with respect to organizational documents and changes in fiscal year); |
| • | engage in sale-leaseback transactions; |
| • | engage in transactions with affiliates; |
| • | enter into operating leases; |
| • | enter into hedging arrangements; |
| • | enter into certain leasehold arrangements and arrangements with respect to inventory and equipment; |
| • | materially alter the business of the Borrower and its restricted subsidiaries; and |
| • | incur capital expenditures. |
Financial Covenants
The Senior Secured Credit Facilities contain financial covenants that require (i) commencing with the fiscal quarter ended March 31, 2019, compliance with a leverage ratio test set at 3.00 to 1.00 as of the last day of each
118
Table of Contents
fiscal quarter, (ii) commencing with the fiscal quarter ended March 31, 2019, compliance with a fixed charge coverage ratio test set at 1.25 to 1.00 as of the last day of each fiscal quarter and (iii) commencing with the fiscal quarter ended December 31, 2015, compliance with an interest coverage ratio set at (x) 1.50 to 1.00 as of the last day of each fiscal quarter through and including the fiscal quarter ended December 31, 2017 and (y) 1.75 to 1.00 as of the last day of the fiscal quarter ended March 31, 2018 through and including the fiscal quarter ending December 31, 2018.
In the event that the Borrower fails to comply with the covenants relating to the leverage ratio and interest coverage ratio, the Parent Guarantor may issue equity or certain parent companies of the Parent Guarantor may contribute cash equity to the Parent Guarantor in order to increase EBITDA for purposes of calculating and determining compliance with the financial covenants, subject to certain limitations.
Events of Default
The lenders under Senior Secured Credit Facilities are permitted under certain circumstances to accelerate the loans and terminate commitments thereunder and exercise other remedies upon the occurrence of certain customary events of default, subject to grace periods, thresholds and exceptions. These events of default include, among others, payment defaults, cross-defaults to certain material indebtedness, covenant defaults, material inaccuracy of representations and warranties, bankruptcy events, material judgments, certain ERISA-related events, material defects with respect to guarantees and collateral and change of control.
New Senior Secured Credit Facility
Concurrently with the closing of this offering, the Borrower, NCS Multistage, Inc., a wholly owned indirect subsidiary of the Company (the “Canadian Borrower” and together with the Borrower, the “Borrowers”), the Parent Guarantor and the Company (together with the Parent Guarantor, the “Parent Guarantors”) intends to enter into an Amended and Restated Credit Agreement (the “Credit Agreement”) with the lenders party thereto, Wells Fargo Bank, National Association and Wells Fargo Bank, National Association, Canadian Branch, as administrative agents and the other parties thereto (the facilities provided thereunder, the “New Senior Secured Credit Facility”). The final terms of the Credit Agreement may not be determined until shortly before completion of this offering and may differ from those described below.
The New Senior Secured Credit Facility consists of (i) a revolving credit facility in an aggregate principal amount of $25,000,000 made available to the Borrower (the “U.S. Facility”), of which up to $5,000,000 may be made available for letters of credit and up to $5,000,000 may be made available for swingline loans and (ii) a revolving credit facility in an aggregate principal amount of $25,000,000 made available to the Canadian Borrower (the “Canadian Facility”). The Credit Agreement will amend and restate that certain Credit Agreement, dated as of August 7, 2014, among the U.S. Borrower, Pioneer Intermediate, Wells Fargo Bank, National Association and the lenders party thereto.
Interest Rate and Fees
Borrowings under the New Senior Secured Credit Facility (other than swingline loans) may, at our election, bear interest at a rate per annum equal to the applicable margin plus either (i) the base rate or (ii) the LIBOR rate. The base rate is determined by reference to the highest of (i) in the case of loans that are denominated in U.S. dollars, (A) the federal funds rate plus 0.5%, (B) one-month LIBOR plus 1.00% and (C) the prime commercial lending rate of the U.S. administrative agent as in effect on the relevant day (the “U.S. Base Rate”) and (ii) in the case of loans that are denominated in Canadian dollars, (A) the prime commercial lending rate of the Canadian administrative agent as in effect on the relevant day for determining interest rates on Canadian dollar denominated commercial loans made in Canada and (B) CDOR plus 1.0%. The LIBOR rate is (i) in the case of loans that are denominated in U.S. Dollars or Euros, determined by reference to the applicable Reuters screen two business days prior to the commencement of the interest period relevant to the subject borrowing and (ii) in
119
Table of Contents
the case of loans that are denominated in Canadian dollars, CDOR determined by reference to the applicable Reuters screen two business days prior to the commencement of the interest period relevant to the subject borrowing. Swingline loans bear interest at the U.S. Base Rate plus the applicable margin.
The applicable margin for loans under the New Senior Secured Credit Facility is determined in accordance with the table set forth below, with the leverage ratio determined in accordance with the terms of the Credit Agreement:
| Leverage Ratio | Applicable Margin for Eurocurrency / B/A Advances |
Applicable Margin for Base Rate Loans |
||||||
| Less than 1.50:1.00 |
3.25 | % | 2.25 | % | ||||
| Equal to or greater than 1.50:1.00 but less than 2.00:1.00 |
3.50 | % | 2.50 | % | ||||
| Equal to or greater than 2.00:1.00 but less than 2.50:1.00 |
3.75 | % | 2.75 | % | ||||
| Greater than or equal to 2.50:1.00 |
4.00 | % | 3.00 | % | ||||
The following fees will be required to be paid under the Credit Agreement:
| • | a commitment fee to each revolving lender on the average daily unused portion of such revolving lender’s revolving credit commitment of 0.375% per annum when the leverage ratio is less than 2.00 to 1.00 and 0.50% when the leverage ratio is greater than or equal to 2.00 to 1.00; |
| • | a participation fee to each revolving lender on the daily face amount of such revolving lender’s letter of credit exposure at a rate equal to the applicable margin for LIBOR loans; |
| • | an annual fronting fee to each issuing lender equal to the greater of (i) 0.20% per annum on the face amount of such letter of credit and (ii) $600; and |
| • | a customary annual administration fee to the administrative agent. |
Voluntary Prepayments
Subject to certain notice requirements, the Borrowers may voluntarily prepay outstanding loans under the New Senior Secured Credit Facility in whole or in part without premium or penalty other than customary “breakage” costs with respect to Eurocurrency Advances.
Final Maturity
The New Senior Secured Credit Facility will mature three years from the closing date of the Credit Agreement.
Guarantors and Security
The obligations of the Borrower under the New Senior Secured Credit Facility will be guaranteed by and secured by substantially all of the assets of the Parent Guarantors and each wholly-owned restricted subsidiary of the company organized under the laws of the US (subject to certain exceptions and permitted liens) (“U.S. Guarantors”). The obligations of the Canadian Borrower under the New Senior Secured Credit Facility will be guaranteed by and secured by substantially all of the assets of each wholly-owned restricted subsidiary of the Company organized under the laws of Canada and the U.S. Guarantors (subject to certain exceptions and permitted liens) (“Canadian Guarantors”).
Certain Covenants, Representations and Warranties
The Credit Agreement shall contain customary representations and warranties, affirmative covenants (including reporting obligations) and negative covenants. With respect to the negative covenants, these
120
Table of Contents
restrictions include, among other things and subject to certain exceptions, restrictions on the ability of the Borrowers and their respective subsidiaries’ ability to:
| • | incur additional indebtedness; |
| • | grant liens; |
| • | enter into burdensome agreements with negative pledge clauses or restrictions on subsidiary distributions; |
| • | make certain investments; |
| • | pay dividends; |
| • | make payments in respect of junior lien or subordinated debt; |
| • | make acquisitions; |
| • | consolidate, amalgamate, merge, liquidate or dissolve; |
| • | sell, transfer or otherwise dispose of assets; |
| • | make certain organizational changes (including with respect to organizational documents and changes in fiscal year); |
| • | engage in sale-leaseback transactions; |
| • | engage in transactions with affiliates; |
| • | enter into operating leases; |
| • | enter into hedging arrangements; |
| • | enter into certain leasehold arrangements and arrangements with respect to inventory and equipment; |
| • | materially alter the business of the Borrowers and their respective restricted subsidiaries; and |
| • | make capital expenditures. |
Financial Covenants
The Credit Agreement will contain financial covenants that require (i) commencing with the fiscal quarter ending June 30, 2017, compliance with a leverage ratio test set at (A) 3.00 to 1.00 as of the last day of each fiscal quarter ending prior to March 31, 2018 and (B) 2.50 to 1:00 as of the last day of each fiscal quarter ending on or after March 31, 2018, (ii) commencing with the fiscal quarter ending June 30, 2017, compliance with an interest coverage ratio test set at 2.75 to 1.00 as of the last day of each fiscal quarter, (iii) if the leverage ratio as of the end of any fiscal quarter is greater than 2.00 to 1.00 and the amount outstanding under the Canadian Facility at any time during such fiscal quarter was greater than $0, compliance with a Canadian asset coverage ratio set at 1.00 to 1.00 and (iv) if the leverage ratio as of the end of any fiscal quarter is greater than 2.00 to 1.00 and the amount outstanding under the U.S. Facility at any time during such fiscal quarter was greater than $0, compliance with a U.S. asset coverage ratio set at 1.00 to 1.00.
Events of Default
The lenders under New Senior Secured Credit Facility will be permitted under certain circumstances to accelerate the loans and terminate commitments thereunder and exercise other remedies upon the occurrence of certain customary events of default, subject to grace periods, thresholds and exceptions. These events of default include, among others, payment defaults, cross-defaults to certain material indebtedness, covenant defaults, material inaccuracy of representations and warranties, bankruptcy events, material judgments, certain ERISA-related events, material defects with respect to guarantees and collateral and change of control.
121
Table of Contents
The following is a description of (i) the material terms of our amended and restated certificate of incorporation and amended and restated bylaws as they will be in effect upon the consummation of this offering and the related 3.00 for 1.00 stock split of our common stock that occurred on April 13, 2017 and (ii) certain applicable provisions of Delaware law. We refer you to our amended and restated certificate of incorporation and amended and restated bylaws, copies of which are filed as exhibits to the registration statement of which this prospectus is a part.
Authorized Capitalization
Our authorized capital stock shall consist of 225,000,000 shares of common stock, par value $0.01 per share and 10,000,000 shares of preferred stock, par value $0.01 per share. Following the consummation of this offering, 45,325,225 shares of common stock and 1 share of preferred stock shall be issued and outstanding. As of April 14, 2017, there were approximately 25 holders of our common stock.
Common Stock
Holders of our common stock are entitled to the rights set forth below.
Voting Rights
Directors will be elected by a plurality of the votes entitled to be cast except as set forth below with respect to directors to be elected by the holders of common stock. Our stockholders will not have cumulative voting rights. Except as otherwise provided in our amended and restated certificate of incorporation or as required by law, all matters to be voted on by our stockholders other than matters relating to the election and removal of directors must be approved by a majority of the votes properly cast for or against such matter, and, for the avoidance of doubt, neither abstention nor broker non-votes shall be counted as votes cast for or against such matter or by a written resolution of the stockholders representing the number of affirmative votes required for such matter at a meeting.
Dividend Rights
Holders of common stock will share equally in any dividend declared by our Board, subject to the rights of the holders of any outstanding preferred stock.
Liquidation Rights
In the event of any voluntary or involuntary liquidation, dissolution, distribution of assets or winding up of our affairs, holders of our common stock would be entitled to share ratably in our assets that are legally available for distribution to stockholders after payment of liabilities. If we have any preferred stock outstanding at such time, holders of the preferred stock may be entitled to distribution and/or liquidation preferences. In either such case, we must pay the applicable distribution to the holders of our preferred stock before we may pay distributions to the holders of our common stock.
Registration Rights
Certain of our existing stockholders have certain registration rights with respect to our common stock pursuant to a registration rights agreement. See “Certain Relationships and Related Party Transactions— Registration Rights Agreement.”
122
Table of Contents
Other Rights
Our stockholders have no preemptive or other rights to subscribe for additional shares. All holders of our common stock are entitled to share equally on a share-for-share basis in any assets available for distribution to common stockholders upon our liquidation, dissolution or winding up.
Preferred Stock
Our Board is authorized to provide for the issuance of preferred stock in one or more series and to fix the preferences, powers and relative, participating, optional or other special rights and qualifications, limitations or restrictions thereof, including the dividend rate, conversion rights, voting rights, redemption rights and liquidation preference and to fix the number of shares to be included in any such series without any further vote or action by our stockholders. Any preferred stock so issued may rank senior to our common stock with respect to the payment of dividends or amounts upon liquidation, dissolution or winding up, or both. In addition, any such shares of preferred stock may have class or series voting rights. The issuance of preferred stock may have the effect of delaying, deferring or preventing a change in control of our company without further action by the stockholders and may adversely affect the voting and other rights of the holders of our common stock.
Our Board has authorized the issuance of 1 share of preferred stock, par value $0.01 per share (the “Special Voting Share”) in our amended and restated certificate of incorporation. The Special Voting Share is currently issued and outstanding. The holder of the Special Voting Share is entitled to vote on all matters that a holder of our common stock is entitled to vote on and is entitled to cast a number of votes equal to the number of exchangeable shares of Exchangeco then outstanding that are not owned by the company, multiplied by the exchange ratio (as defined in Exchangeco’s articles of incorporation). As of December 31, 2016 and 2015, exchangeable shares of Exchangeco for our common stock totaled 1,819,247 and are held by the preferred stockholder. The holder of the Special Voting Share is not entitled to receive dividends.
Anti-takeover Provisions
Our amended and restated certificate of incorporation and amended and restated bylaws will contain provisions that delay, defer or discourage transactions involving an actual or potential change in control of us or change in our management. We expect that these provisions, which are summarized below, will discourage coercive takeover practices or inadequate takeover bids. These provisions will be designed to encourage persons seeking to acquire control of us to first negotiate with our Board, which we believe may result in an improvement of the terms of any such acquisition in favor of our stockholders. However, they will also give our Board the power to discourage transactions that some stockholders may favor, including transactions in which stockholders might otherwise receive a premium for their shares or transactions that our stockholders might otherwise deem to be in their best interests. Accordingly, these provisions could adversely affect the price of our common stock.
Requirements for Advance Notification of Stockholder Meetings, Nominations and Proposals
Our amended and restated bylaws will provide that special meetings of the stockholders may be called only upon the request of a majority of our Board or upon the request of the Chief Executive Officer. Our amended and restated bylaws will prohibit the conduct of any business at a special meeting other than as specified in the notice for such meeting. These provisions may have the effect of deferring, delaying or discouraging hostile takeovers or changes in control or management of our company.
Our amended and restated bylaws will establish advance notice procedures with respect to stockholder proposals and the nomination of candidates for election as directors, other than nominations made by or at the direction of our Board or a committee of our Board. In order for any matter to be “properly brought” before a meeting, a stockholder will have to comply with the advance notice requirements of directors, which may be filled only by a vote of a majority of directors then in office, even though less than a quorum, and not by the
123
Table of Contents
stockholders. Our amended and restated bylaws will allow the presiding officer at a meeting of the stockholders to adopt rules and regulations for the conduct of meetings which may have the effect of precluding the conduct of certain business at a meeting if the rules and regulations are not followed. These provisions may also defer, delay or discourage a potential acquirer from conducting a solicitation of proxies to elect the acquirer’s own slate of directors or otherwise attempting to obtain control of our company.
No Stockholder Action by Written Consent
Our amended and restated certificate of incorporation will provide that after the time that the Advent Funds collectively own less than 50.01% of our then outstanding common stock, subject to the rights of any holders of preferred stock to act by written consent instead of a meeting, stockholder action may be taken only at an annual meeting or special meeting of stockholders and may not be taken by written consent instead of a meeting. Failure to satisfy any of the requirements for a stockholder meeting could delay, prevent or invalidate stockholder action.
Section 203 of the DGCL
Our amended and restated certificate of incorporation will provide that the provisions of Section 203 of the DGCL, which relate to business combinations with interested stockholders, do not apply to us. Section 203 of the DGCL prohibits a publicly held Delaware corporation from engaging in a business combination transaction with an interested stockholder (a stockholder who owns more than 15% of our common stock) for a period of three years after the interested stockholder became such unless the transaction fits within an applicable exemption, such as Board approval of the business combination or the transaction that resulted in such stockholder becoming an interested stockholder. These provisions will apply even if the business combination could be considered beneficial by some stockholders. Although we have elected to opt out of the statute’s provisions, we could elect to be subject to Section 203 in the future.
Amendment to Bylaws and Certificate of Incorporation
Any amendment to our amended and restated certificate of incorporation must first be approved by a majority of our Board and (i) if required by law, thereafter be approved by a majority of the outstanding shares entitled to vote on the amendment or (ii) if related to provisions regarding the classification of our Board, the removal of directors, director vacancies, forum selection for certain lawsuits, indemnification, corporate opportunities, business combinations, severability, the provision opting-out of Section 203 of the DGCL or the amendment of certain provisions of our amended and restated bylaws or amended and restated certificate of incorporation, thereafter be approved by at least 66 2⁄3% of the outstanding shares entitled to vote on the amendment. For so long as the Advent Funds beneficially owns 50% or more of our issued and outstanding common stock entitled to vote generally in the election of directors, any amendment to provisions regarding Section 203 of the DGCL or corporate opportunities must also receive Advent’s prior written consent. Our amended and restated bylaws may be amended (x) by the affirmative vote of a majority of the directors then in office, subject to any limitations set forth in the bylaws, without further stockholder action or (y) by the affirmative vote of at least 66 2⁄3% of the outstanding shares entitled to vote on the amendment, without further action by our Board.
Exclusive Forum
Our amended and restated certificate of incorporation will provide that, subject to certain exceptions, the Court of Chancery of the State of Delaware shall be the sole and exclusive forum for certain stockholder litigation matters. However, it is possible that a court could rule that this provision is unenforceable or inapplicable.
Listing
We have applied to have our common stock listed on NASDAQ under the symbol “NCSM.”
Transfer Agent and Registrar
The transfer agent and registrar for our common stock is Computershare Trust Company, N.A.
124
Table of Contents
SHARES ELIGIBLE FOR FUTURE SALE
Prior to this offering, there has been no public market for our common stock. Future sales of our common stock in the public market, or the perception that sales may occur, could materially adversely affect the prevailing market price of our common stock at such time and our ability to raise equity capital in the future.
Sale of Restricted Securities
Upon consummation of this offering, we will have 45,325,225 shares of our common stock outstanding. Of these shares, all shares sold in this offering (other than shares sold pursuant to our directed share program that are subject to “lock-up” restrictions as described under “Underwriting (Conflicts of Interest)—Directed Share Program”) will be freely tradable without further restriction or registration under the Securities Act, except that any shares purchased by our affiliates may generally only be sold in compliance with Rule 144, which is described below. Of the remaining outstanding shares, 35,825,225 shares will be deemed “restricted securities” under the Securities Act.
Lock-Up Arrangements and Registration Rights
In connection with this offering, we, each of our executive officers, directors, the Advent Funds and certain of our other existing stockholders, will enter into lock-up agreements that restrict the sale of our securities for up to 180 days after the date of this prospectus (including any shares acquired pursuant to our directed share program), subject to certain exceptions. For additional information, see “Underwriting (Conflicts of Interest).”
In addition, following the expiration of the lock-up period, certain stockholders will have the right, subject to certain conditions, to require us to register the sale of their shares of our common stock under federal securities laws. See “Certain Relationships and Related Party Transactions—Registration Rights Agreement.” If these stockholders exercise this right, our other existing stockholders may require us to register their registrable securities.
Following the lock-up periods described above, all of the shares of our common stock that are restricted securities or are held by our affiliates as of the date of this prospectus will be eligible for sale in the public market in compliance with Rule 144 under the Securities Act.
Rule 144
The shares of our common stock sold in this offering will generally be freely transferable without restriction or further registration under the Securities Act, except that any shares of our common stock held by an “affiliate” of ours may not be resold publicly except in compliance with the registration requirements of the Securities Act or under an exemption under Rule 144 or otherwise. Rule 144 permits our common stock that has been acquired by a person who is an affiliate of ours, or has been an affiliate of ours within the past three months, to be sold into the market in an amount that does not exceed, during any three-month period, the greater of:
| • | one percent of the total number of shares of our common stock outstanding; or |
| • | the average weekly reported trading volume of our common stock for the four calendar weeks prior to the sale. |
Such sales are also subject to specific manner of sale provisions, a six-month holding period requirement, notice requirements and the availability of current public information about us.
289,620 shares of our common stock that are not subject to lock-up arrangements described above will be eligible for sale under Rule 144 immediately upon the closing of this offering.
125
Table of Contents
Rule 144 also provides that a person who is not deemed to have been an affiliate of ours at any time during the three months preceding a sale, and who has for at least six months beneficially owned shares of our common stock that are restricted securities, will be entitled to freely sell such shares of our common stock subject only to the availability of current public information regarding us. A person who is not deemed to have been an affiliate of ours at any time during the three months preceding a sale, and who has beneficially owned for at least one year shares of our common stock that are restricted securities, will be entitled to freely sell such shares of our common stock under Rule 144 without regard to the current public information requirements of Rule 144.
Rule 701
Rule 701 generally allows a stockholder who purchased shares of our capital stock pursuant to a written compensatory plan or contract and who is not deemed to have been an affiliate of our company during the immediately preceding 90 days to sell these shares in reliance upon Rule 144, but without being required to comply with the public information, holding period, volume limitation or notice provisions of Rule 144. Rule 701 also permits affiliates of our company to sell their Rule 701 shares under Rule 144 without complying with the holding period requirements of Rule 144. All holders of Rule 701 shares, however, are required to wait until 90 days after the date of this prospectus before selling those shares pursuant to Rule 701.
Additional Registration Statements
We intend to file a registration statement on Form S-8 under the Securities Act to register 7,645,071 shares of our common stock to be issued or reserved for issuance under our equity incentive plans. Such registration statement is expected to be filed soon after the date of this prospectus and will automatically become effective upon filing with the SEC. Accordingly, shares registered under such registration statement will be available for sale in the open market, unless such shares are subject to vesting restrictions with us or the lock-up restrictions described above.
126
Table of Contents
MATERIAL U.S. FEDERAL INCOME AND ESTATE TAX CONSIDERATIONS FOR NON-U.S. HOLDERS
The following discussion summarizes the material U.S. federal income and estate tax consequences to “non-U.S. holders” of ownership and disposition of our common stock, but does not purport to provide a complete analysis of all potential U.S. federal income tax and estate tax considerations relating thereto.
A “non-U.S. holder” is a beneficial owner of our common stock that is, for U.S. federal income tax purposes:
| • | a non-resident alien individual; |
| • | a foreign corporation; or |
| • | a foreign estate or trust. |
You are not a non-U.S. holder if you are a nonresident alien individual present in the United States for 183 days or more in the taxable year of disposition, or if you are a former citizen or former resident of the United States, in either of which cases you should consult your tax advisor regarding the U.S. federal income tax consequences of owning or disposing of our common stock.
If an entity or arrangement treated as a partnership or other type of pass-through entity for U.S. federal income tax purposes owns our common stock, the tax treatment of a partner or beneficial owner of the entity may depend upon the status of the partner or beneficial owner, the activities of the entity and certain determinations made at the partner or beneficial owner level. Partners and beneficial owners in partnerships or other pass-through entities that own our common stock should consult their own tax advisors as to the particular U.S. federal income and estate tax consequences applicable to them.
This discussion is based on the Internal Revenue Code of 1986, as amended, final, temporary and proposed Treasury regulations promulgated thereunder and administrative and judicial interpretations thereof, all as in effect on the date hereof, and all of which are subject to change or differing interpretations, possibly with retroactive effect, which may affect the tax consequences described herein. This discussion does not address all aspects of U.S. federal income (including the alternative minimum tax) and estate taxation that may be relevant to non-U.S. holders in light of their particular circumstances and does not address any tax consequences arising under the laws of any state, local or foreign jurisdiction. Moreover, this discussion does not deal with non-U.S. holders that may be subject to special treatment under U.S. federal income tax laws, including, without limitation: U.S. expatriates, insurance companies, tax-exempt or governmental organizations, mutual funds, dealers or traders in securities or currency, banks or other financial institutions, “controlled foreign corporations,” “passive foreign investment companies,” companies that accumulate earnings to avoid U.S. federal income tax, common trust funds, certain trusts, and hybrid entities; traders in securities that use the mark-to-market method of accounting for U.S. federal income tax purposes; persons who hold our common stock in connection with a constructive sale or who acquired our common stock through the exercise of employee stock options or otherwise as compensation or through a tax-qualified investment plan; investors that hold our common stock as part of a hedge, straddle, synthetic security, conversion transaction or other integrated investment or risk reduction transaction; and individuals who are present in the United States for a period or periods aggregating 183 days or more during the calendar year in which a sale or disposition of our common stock occurs. Prospective purchasers should consult their tax advisors with respect to the particular tax consequences to them of owning and disposing of our common stock, including the consequences under the laws of any state, local or foreign jurisdiction, the effect of any changes in applicable tax law and their entitlement to benefits under any applicable tax treaty.
Distributions on Common Stock
We do not expect to pay any dividends on our common stock in the foreseeable future. If we do pay dividends on shares of our common stock, however, such distributions will constitute dividends for U.S. federal
127
Table of Contents
income tax purposes to the extent paid from our current or accumulated earnings and profits, as determined under U.S. federal income tax principles. Distributions in excess of our current and accumulated earnings and profits will constitute a return of capital that is applied against and reduces, but not below zero, a non-U.S. holder’s adjusted tax basis in shares of our common stock. Any remaining excess will be treated as gain realized on the sale or other disposition of our common stock. See “—Dispositions of Common Stock.”
Any dividend paid to a non-U.S. holder on our common stock will generally be subject to U.S. federal withholding tax at a 30% rate, or a reduced rate specified by an applicable tax treaty, on the gross amount of the dividend. In order to obtain a reduced rate of withholding, a non-U.S. holder will be required to provide an IRS Form W-8BEN or W-8BEN-E (or other applicable or successor form) certifying its entitlement to benefits under a treaty. Special certification requirements and other requirements apply to certain non-U.S. holders that are entities rather than individuals. A non-U.S. holder of our common stock that is eligible for a reduced rate of U.S. federal withholding tax under an income tax treaty may obtain a refund from the IRS of any excess amounts withheld by timely filing an appropriate claim for refund with the IRS. Non-U.S. holders should consult their own tax advisors regarding any possible qualification under an income tax treaty and the filing of a U.S. tax return to claim a refund of U.S. federal withholding tax.
The withholding tax does not apply to dividends paid to a non-U.S. holder who provides a Form W-8ECI, certifying that the dividends are effectively connected with the non-U.S. holder’s conduct of a trade or business within the United States (and, if an applicable tax treaty so provides, are attributable to a permanent establishment or fixed base maintained by the non-U.S. holder in the United States). Instead, the effectively connected dividends will be generally subject to regular U.S. income tax as if the non-U.S. holder were a United States person, subject to an applicable tax treaty providing otherwise. In addition, in certain circumstances, if you are a foreign corporation you may be subject to a 30% (or, if a tax treaty applies, such lower rate as provided) branch profits tax.
Dispositions of Common Stock
Subject to the discussion below on backup withholding and FATCA, gain realized by a non-U.S. holder on a sale, exchange or other disposition of our common stock generally will not be subject to U.S. federal income or withholding tax, unless:
| • | the gain is effectively connected with a trade or business of the non-U.S. holder in the United States, subject to an applicable treaty providing otherwise, in which case the gain will be subject to U.S. federal income tax generally in the same manner as effectively connected dividend income as described above; or |
| • | we are or have been a U.S. real property holding corporation at any time within the five-year period preceding the disposition or the non-U.S. holder’s holding period, whichever period is shorter, and either (i) our common stock has ceased to be “regularly traded” as defined by applicable Treasury regulations on an established securities market prior to the beginning of the calendar year in which the sale or disposition occurs or (ii) such non-U.S. holder owns, or has owned, at any time during the five-year period preceding the disposition or such non-U.S. holder’s holding period, whichever is shorter, actually or constructively, more than 5% of our common stock. |
We believe that we are not, and we do not anticipate becoming, a U.S. real property holding corporation.
Backup Withholding and Information Reporting
Any dividends that are paid to a non-U.S. holder must be reported annually to the IRS and to the non-U.S. holder. Copies of these information returns also may be made available to the tax authorities of the country in which the non-U.S. holder resides under the provisions of various treaties or agreements for the exchange of information. Unless the non-U.S. holder is an exempt recipient, dividends paid on our common stock and the gross proceeds from a taxable disposition of our common stock may be subject to additional information
128
Table of Contents
reporting and may also be subject to U.S. federal backup withholding (at the applicable rate, which is currently 28%) if such non-U.S. holder fails to comply with applicable U.S. information reporting and certification requirements. Provision of any properly completed IRS Form W-8 appropriate to the non-U.S. holder’s circumstances will satisfy the certification requirements necessary to avoid the backup withholding. Notwithstanding the foregoing, backup withholding (and information reporting) may apply if either we or a broker or other paying agent has actual knowledge, or reason to know, that the beneficial owner is a U.S. person.
Backup withholding is not an additional tax. Any amounts so withheld under the backup withholding rules will be refunded by the IRS or credited against the non-U.S. holder’s U.S. federal income tax liability, provided that the required information is timely furnished to the IRS.
FATCA Withholding Taxes
Provisions commonly referred to as “FATCA” impose withholding of 30% on payments of U.S.-source dividends, and, beginning in 2019, sales or other disposition proceeds from our common stock to “foreign financial institutions” (which is broadly defined for this purpose and in general includes investment vehicles) and certain other non-U.S. entities unless various U.S. information reporting and due diligence requirements (generally relating to ownership by U.S. persons of interests in or accounts with those entities) have been satisfied, or an exemption applies (typically certified as to by the delivery of a properly completed IRS Form W-8BEN-E). If FATCA withholding is imposed, a beneficial owner that is not a foreign financial institution generally will be entitled to a refund of any amounts withheld by filing a U.S. federal income tax return (which may entail significant administrative burden). Foreign financial institutions located in jurisdictions that have an intergovernmental agreement with the United States governing FATCA may be subject to different rules. Prospective investors should consult their tax advisers regarding the effects of FATCA on their investment in our common shares.
U.S. Federal Estate Tax
The estates of nonresident alien individuals generally are subject to U.S. federal estate tax on property with a U.S. situs. Because we are a U.S. corporation, our common stock will be U.S. situs property and therefore will be included in the taxable estate of a nonresident alien decedent, unless an applicable estate tax treaty between the United States and the decedent’s country of residence provides otherwise.
THE FOREGOING DISCUSSION IS INTENDED FOR GENERAL INFORMATION ONLY AND SHOULD NOT BE VIEWED AS TAX ADVICE. INVESTORS CONSIDERING THE PURCHASE OF OUR COMMON STOCK ARE URGED TO CONSULT THEIR OWN TAX ADVISORS REGARDING THE APPLICATION OF THE U.S. FEDERAL INCOME AND ESTATE TAX LAWS TO THEIR PARTICULAR SITUATIONS AND THE APPLICABILITY AND EFFECT OF STATE, LOCAL OR FOREIGN TAX LAWS AND TREATIES.
129
Table of Contents
UNDERWRITING (CONFLICTS OF INTEREST)
Under the terms and subject to the conditions contained in an underwriting agreement dated , 2017, we have agreed to sell to the underwriters named below, for whom Credit Suisse (USA) LLC, Citigroup Global Markets Inc. and Wells Fargo Securities, LLC are acting as representatives the following respective numbers of shares of common stock:
| Underwriter |
Number of Shares |
|||
| Credit Suisse Securities (USA) LLC |
||||
| Citigroup Global Markets Inc. |
||||
| Wells Fargo Securities, LLC |
||||
| J.P. Morgan Securities LLC |
||||
| Piper Jaffray & Co. |
||||
| Raymond James & Associates, Inc. |
||||
| RBC Capital Markets, LLC |
||||
| Tudor, Pickering, Holt & Co. Securities, Inc. |
||||
|
|
|
|||
| Total |
9,500,000 | |||
|
|
|
|||
The underwriting agreement provides that the underwriters are obligated to purchase all the shares of common stock in the offering if any are purchased, other than those shares covered by the over-allotment option described below. The underwriting agreement also provides that if an underwriter defaults, the purchase commitments of non-defaulting underwriters may be increased or the offering may be terminated.
The selling stockholders have also granted to the underwriters a 30-day option to purchase 1,425,000 additional outstanding shares at the initial public offering price less the underwriting discounts and commissions. The option may be exercised only to cover any over-allotments of common stock.
The underwriters propose to offer the shares of common stock initially at the public offering price on the cover page of this prospectus and to selling group members at that price less a selling concession of $ per share. After the initial public offering the underwriters may change the public offering price and concession and discount to broker/dealers. The offering of the shares by the underwriters is subject to receipt and acceptance and subject to the underwriters’ right to reject any order in whole or in part.
The following table summarizes the compensation and estimated expenses we and the selling stockholders will pay:
| Per Share | Total | |||||||||||||||
| Without Over- allotment |
With Over- allotment |
Without Over- allotment |
With Over- allotment |
|||||||||||||
| Underwriting Discounts and Commissions paid by us |
||||||||||||||||
| Underwriting Discounts and Commissions paid by selling stockholders |
||||||||||||||||
| Expenses payable by us |
||||||||||||||||
The expenses of this offering that have been paid or are payable by us are estimated to be approximately $2,500,000 (excluding underwriting discounts and commissions). We have agreed to pay expenses incurred by the selling stockholders in connection with this offering, other than the underwriting discounts and commissions. We have also agreed to reimburse the underwriters for certain of their expenses in an amount up to $40,000.
The underwriters have agreed to reimburse us for certain expenses incurred in connection with this offering upon closing of this offering.
130
Table of Contents
We have agreed, subject to certain exceptions, that we will not offer, sell, contract to sell, pledge or otherwise dispose of, directly or indirectly, or file with the SEC a registration statement under the Securities Act relating to, any shares of our common stock or securities convertible into or exchangeable or exercisable for any shares of our common stock, or publicly disclose the intention to make any offer, sale, pledge, disposition or filing, without the prior written consent of the representatives for a period of 180 days after the date of this prospectus.
Each of our executive officers, directors, the Advent Funds and certain of our other existing stockholders have agreed that they will not offer, sell, contract to sell, pledge or otherwise dispose of, directly or indirectly, any shares of our common stock or securities convertible into or exchangeable or exercisable for any shares of our common stock, enter into a transaction that would have the same effect, or enter into any swap, hedge or other arrangement that transfers, in whole or in part, any of the economic consequences of ownership of our common stock, whether any of these transactions are to be settled by delivery of our common stock or other securities, in cash or otherwise, or publicly disclose the intention to make any offer, sale, pledge or disposition, or to enter into any transaction, swap, hedge or other arrangement, without, in each case, the prior written consent of the representatives for a period of 180 days after the date of this prospectus. The lock-up restrictions described in the foregoing do not apply to, among others, transfers of our common stock (i) as a bona fide gift; (ii) to any trust for the benefit of the lock-up party or any family member of the lock-up party; (iii) to the Company to satisfy tax withholding obligations in connection with the exercise of stock options or the vesting of restricted stock outstanding as of the date of the lock-up agreement; and (iv) in transactions relating to shares of our common stock acquired in open market transactions after the completion of this offering; provided that, for (i) and (ii) above each donee, trustee, distributee or transferee, as the case may be, agrees to be bound in writing by the restrictions described above and that any such transfer shall not involve a disposition for value; provided further that for (i), (ii), (iii) and (iv) above, any such transactions are not required to be reported in any public report or filing with the Securities and Exchange Commission, or otherwise, and the transferring party does not otherwise voluntarily effect any public filing.
Participants in the directed share program who purchase $50,000 or more of shares of our common stock under the program will be subject to a 30-day lock-up period with respect to any shares of our common stock sold to them under the program. This lock-up will have similar restrictions to the lock-up agreements described above. Any shares of common stock sold through the directed share program to our directors will be subject to the 180-day lock-up agreements described above.
The underwriters are offering the shares, subject to prior sale, when, as and if issued to and accepted by them, subject to approval of legal matters by their counsel including the validity of the shares, and subject to other conditions contained in the underwriting agreement, such as receipt by the underwriters of officer’s certificates and legal opinions.
We and the selling stockholders have agreed to indemnify the underwriters and certain of their controlling persons against certain liabilities, including liabilities under the Securities Act, and to contribute to payments that the underwriters may be required to make in respect of those liabilities.
We have applied to have our common stock listed NASDAQ under the symbol “NCSM.”
In connection with the listing of the common stock on an exchange, the underwriters will undertake to sell round lots of 100 shares or more to a minimum of 450 beneficial owners.
Prior to this offering, there has been no public market for our common stock. The initial public offering price was determined by negotiations among us, the selling stockholders and the representatives and will not necessarily reflect the market price of the common stock following this offering. The principal factors that were considered in determining the initial public offering price included:
| • | the information presented in this prospectus and otherwise available to the underwriters; |
131
Table of Contents
| • | the history of, and prospects for, the industry in which we compete; |
| • | the ability of our management; |
| • | the prospects for our future earnings; |
| • | the present state of our development, results of operations and our current financial condition; |
| • | the general condition of the securities markets at the time of this offering; |
| • | the recent market prices of, and the demand for, publicly traded common stock of generally comparable companies; and |
| • | other factors deemed relevant by the underwriters and us. |
Neither we nor the underwriters can assure you that the initial public offering price will correspond to the price at which the common stock will trade in the public market subsequent to this offering or that an active trading market for the common stock will develop and continue after this offering.
In connection with the offering the underwriters may engage in stabilizing transactions, over-allotment transactions and syndicate covering transactions in accordance with Regulation M under the Exchange Act.
| • | Stabilizing transactions permit bids to purchase the underlying security so long as the stabilizing bids do not exceed a specified maximum. |
| • | Over-allotment involves sales by the underwriters of shares in excess of the number of shares the underwriters are obligated to purchase, which creates a syndicate short position. The short position may be either a covered short position or a naked short position. In a covered short position, the number of shares over-allotted by the underwriters is not greater than the number of shares that they may purchase in the over-allotment option. In a naked short position, the number of shares involved is greater than the number of shares in the over-allotment option. The underwriters may close out any covered short position by either exercising their over-allotment option and/or purchasing shares in the open market. |
| • | Syndicate covering transactions involve purchases of the common stock in the open market after the distribution has been completed in order to cover syndicate short positions. In determining the source of shares to close out the short position, the underwriters will consider, among other things, the price of shares available for purchase in the open market as compared to the price at which they may purchase shares through the over-allotment option. If the underwriters sell more shares than could be covered by the over-allotment option, a naked short position, the position can only be closed out by buying shares in the open market. A naked short position is more likely to be created if the underwriters are concerned that there could be downward pressure on the price of the shares in the open market after pricing that could adversely affect investors who purchase in the offering. |
These stabilizing transactions and syndicate covering transactions may have the effect of raising or maintaining the market price of our common stock or preventing or retarding a decline in the market price of the common stock. As a result the price of our common stock may be higher than the price that might otherwise exist in the open market. These transactions may be effected on an exchange the company is listed on or otherwise and, if commenced, may be discontinued at any time.
A prospectus in electronic format may be made available on the web sites maintained by one or more of the underwriters, or selling group members, if any, participating in this offering and one or more of the underwriters participating in this offering may distribute prospectuses electronically. The representatives may agree to allocate a number of shares to underwriters and selling group members for sale to their online brokerage account holders. Internet distributions will be allocated by the underwriters and selling group members that will make internet distributions on the same basis as other allocations.
132
Table of Contents
Conflicts of Interest
The underwriters and their respective affiliates are full-service financial institutions engaged in various activities, which may include securities trading, commercial and investment banking, financial advisory, investment management, investment research, principal investment, hedging, financing and brokerage activities. Certain of the underwriters and their respective affiliates have, from time to time, performed, and may in the future perform, various financial advisory and investment banking services for us, for which they received or will receive customary fees and expenses.
In addition, in the ordinary course of their business activities, the underwriters and their affiliates may make or hold a broad array of investments and actively trade debt and equity securities (or related derivative securities) and financial instruments (including bank loans) for their own account and for the accounts of their customers. These investments and securities activities may involve securities and/or instruments of ours or our affiliates. The underwriters and their affiliates may also make investment recommendations and/or publish or express independent research views in respect of such securities or financial instruments and may hold, or recommend to clients that they acquire, long and/or short positions in such securities and instruments.
Affiliates of each of Citigroup Global Markets Inc., Wells Fargo Securities LLC and J.P. Morgan Securities LLC, underwriters in this offering, are lenders under our Senior Secured Credit Facilities that will be repaid with net proceeds of this offering. See “Use of Proceeds.” As a result of the repayment of our Senior Secured Credit Facilities, affiliates of Citigroup Global Markets Inc., Wells Fargo Securities LLC and J.P. Morgan Securities LLC could receive 5% or more of the net proceeds of this offering. As a result of this repayment, we expect a “conflict of interest” may be deemed to exist under FINRA Rule 5121(f)(5)(C)(i), and this offering will be made in compliance with the applicable provisions of FINRA Rule 5121, which requires a “qualified independent underwriter,” as defined by the FINRA rules, to participate in the preparation of the registration statement and the prospectus and exercise the usual standards of due diligence in respect thereto, and Credit Suisse Securities (USA) LLC has served in that capacity and will not receive any additional fees for serving as qualified independent underwriter in connection with this offering. We have agreed to indemnify Credit Suisse Securities (USA) LLC against liabilities incurred in connection with acting as a qualified independent underwriter, including liabilities under the Securities Act. To comply with FINRA Rule 5121, Citigroup Global Markets Inc., Wells Fargo Securities, LLC and J.P. Morgan Securities LLC will not confirm sales to any account over which they exercise discretionary authority without the specific written approval of the transaction of the account holder.
Directed Share Program
At our request, the underwriters have reserved for sale, at the initial public offering price, up to 475,000 shares, or approximately 5% of the common stock to be issued by us and offered by this prospectus for sale to our directors and directors of our joint venture with one of our suppliers. The sales will be made by Wells Fargo Securities, LLC through a directed share program. The number of shares of common stock available for sale to the general public in the offering will be reduced to the extent these persons purchase the directed shares in the program. Any reserved shares of common stock that are not so purchased will be offered by the underwriters to the public on the same terms as the other shares of common stock offered by this prospectus. We have agreed to indemnify the underwriters against certain liabilities and expenses, including liabilities under the Securities Act, in connection with sales of the directed shares.
Selling Restrictions
European Economic Area
In relation to each Member State of the European Economic Area which has implemented the Prospectus Directive (each, a “Relevant Member State”), an offer of shares to the public may not be made in that Relevant
133
Table of Contents
Member State, except that an offer of shares to the public may be made at any time under the following exemptions under the Prospectus Directive, if they have been implemented in that Relevant Member State:
(a) to any legal entity which is a qualified investor as defined in the Prospectus Directive;
(b) to fewer than 100 or, if the Relevant Member State has implemented the relevant provisions of the 2010 Amending Directive, 150, natural or legal persons (other than qualified investors as defined in the Prospectus Directive) subject to obtaining the prior consent of the representatives for any such offer; or
(c) in any other circumstances falling within Article 3(2) of the Prospectus Directive, provided that no such offer of shares shall result in a requirement for the publication of a prospectus pursuant to Article 3 of the Prospectus Directive or any measure implementing the Prospectus Directive in a Relevant Member State and each person who initially acquires any shares or to whom an offer is made will be deemed to have represented, warranted and agreed to and with the underwriters that it is a qualified investor within the meaning of the law in that Relevant Member State implementing Article 2(1)(e) of the Prospectus Directive.
For the purposes of this provision, the expression an “offer of shares to the public” in relation to any shares in any Relevant Member State means the communication in any form and by any means of sufficient information on the terms of the offer and the shares to be offered so as to enable an investor to decide to purchase or subscribe the shares, as the same may be varied in that Relevant Member State by any measure implementing the Prospectus Directive in that Relevant Member State, the expression “Prospectus Directive” means Directive 2003/71/EC (and amendments thereto, including the 2010 PD Amending Directive, to the extent implemented in the Relevant Member State) and includes any relevant implementing measure in each Relevant Member State.
In the case of any shares being offered to a financial intermediary as that term is used in Article 3(2) of the Prospectus Directive, such financial intermediary will also be deemed to have represented, acknowledged and agreed that the shares acquired by it in the offer have not been acquired on a non-discretionary basis on behalf of, nor have they been acquired with a view to their offer or resale to, persons in circumstances which may give rise to an offer of shares to the public other than their offer or resale in a Relevant Member State to qualified investors as so defined or in circumstances in which the prior consent of the underwriters has been obtained to each such proposed offer or resale.
Notice to Prospective Investors in the United Kingdom
This prospectus is only being distributed to, and is only directed at, persons in the United Kingdom that are qualified investors within the meaning of Article 2(1)(e) of the Prospectus Directive that are also (i) investment professionals falling within Article 19(5) of the Financial Services and Markets Act 2000 (Financial Promotion) Order 2005 (the “Order”) or (ii) high net worth entities, and other persons to whom it may lawfully be communicated, falling within Article 49(2)(a) to (d) of the Order (each such person being referred to as a “relevant person”). This prospectus and its contents are confidential and should not be distributed, published or reproduced (in whole or in part) or disclosed by recipients to any other persons in the United Kingdom. Any person in the United Kingdom that is not a relevant person should not act or rely on this document or any of its contents.
Canada
Resale Restrictions
The distribution of the shares in Canada is being made only in the provinces of Ontario, Quebec, Alberta and British Columbia on a private placement basis exempt from the requirement that we and the selling stockholders prepare and file a prospectus with the securities regulatory authorities in each province where trades of these securities are made. Any resale of the shares in Canada must be made under applicable securities laws which may vary depending on the relevant jurisdiction, and which may require resales to be made under available statutory exemptions or under a discretionary exemption granted by the applicable Canadian securities regulatory authority. Purchasers are advised to seek legal advice prior to any resale of the securities.
134
Table of Contents
Representations of Canadian Purchasers
By purchasing the shares in Canada and accepting delivery of a purchase confirmation, a purchaser is representing to us, the selling stockholders and the dealer from whom the purchase confirmation is received that:
| • | the purchaser is entitled under applicable provincial securities laws to purchase the shares without the benefit of a prospectus qualified under those securities laws as it is an “accredited investor” as defined under National Instrument 45-106—Prospectus Exemptions or subsection 73.3(1) of the Securities Act (Ontario), |
| • | the purchaser is a “permitted client” as defined in National Instrument 31-103—Registration Requirements, Exemptions and Ongoing Registrant Obligations, |
| • | where required by law, the purchaser is purchasing as principal and not as agent, and |
| • | the purchaser has reviewed the text above under Resale Restrictions. |
Conflicts of Interest
Canadian purchasers are hereby notified that each of the underwriters is relying on the exemption set out in section 3A.3 or 3A.4, if applicable, of National Instrument 33-105 – Underwriting Conflicts from having to provide certain conflict of interest disclosure in this document.
Statutory Rights of Action
Securities legislation in certain provinces or territories of Canada may provide a purchaser with remedies for rescission or damages if the offering memorandum (including any amendment thereto) such as this document contains a misrepresentation, provided that the remedies for rescission or damages are exercised by the purchaser within the time limit prescribed by the securities legislation of the purchaser’s province or territory. The purchaser of these securities in Canada should refer to any applicable provisions of the securities legislation of the purchaser’s province or territory for particulars of these rights or consult with a legal advisor.
Enforcement of Legal Rights
All of our directors and officers as well as the experts named herein and the selling stockholders may be located outside of Canada and, as a result, it may not be possible for Canadian purchasers to effect service of process within Canada upon us or those persons. All or a substantial portion of our assets and the assets of those persons may be located outside of Canada and, as a result, it may not be possible to satisfy a judgment against us or those persons in Canada or to enforce a judgment obtained in Canadian courts against us or those persons outside of Canada.
Taxation and Eligibility for Investment
Canadian purchasers of the shares should consult their own legal and tax advisors with respect to the tax consequences of an investment in the shares in their particular circumstances and about the eligibility of the shares for investment by the purchaser under relevant Canadian legislation.
Hong Kong
The shares may not be offered or sold in Hong Kong by means of any document other than (i) in circumstances which do not constitute an offer to the public within the meaning of the Companies (Winding Up and Miscellaneous Provisions) Ordinance (Cap. 32 of the Laws of Hong Kong) (“Companies (Winding Up and Miscellaneous Provisions) Ordinance”) or which do not constitute an invitation to the public within the meaning of the Securities and Futures Ordinance (Cap. 571 of the Laws of Hong Kong) (“Securities and Futures
135
Table of Contents
Ordinance”), or (ii) to “professional investors” as defined in the Securities and Futures Ordinance and any rules made thereunder, or (iii) in other circumstances which do not result in the document being a “prospectus” as defined in the Companies (Winding Up and Miscellaneous Provisions) Ordinance, and no advertisement, invitation or document relating to the shares may be issued or may be in the possession of any person for the purpose of issue (in each case whether in Hong Kong or elsewhere), which is directed at, or the contents of which are likely to be accessed or read by, the public in Hong Kong (except if permitted to do so under the securities laws of Hong Kong) other than with respect to shares which are or are intended to be disposed of only to persons outside Hong Kong or only to “professional investors” in Hong Kong as defined in the Securities and Futures Ordinance and any rules made thereunder.
Singapore
This prospectus has not been registered as a prospectus with the Monetary Authority of Singapore. Accordingly, this prospectus and any other document or material in connection with the offer or sale, or invitation for subscription or purchase, of the shares may not be circulated or distributed, nor may the shares be offered or sold, or be made the subject of an invitation for subscription or purchase, whether directly or indirectly, to persons in Singapore other than (i) to an institutional investor (as defined under Section 4A of the Securities and Futures Act, Chapter 289 of Singapore (the “SFA”)) under Section 274 of the SFA, (ii) to a relevant person (as defined in Section 275(2) of the SFA) pursuant to Section 275(1) of the SFA, or any person pursuant to Section 275(1A) of the SFA, and in accordance with the conditions specified in Section 275 of the SFA or (iii) otherwise pursuant to, and in accordance with the conditions of, any other applicable provision of the SFA, in each case subject to conditions set forth in the SFA.
Where the shares are subscribed or purchased under Section 275 of the SFA by a relevant person which is a corporation (which is not an accredited investor (as defined in Section 4A of the SFA)) the sole business of which is to hold investments and the entire share capital of which is owned by one or more individuals, each of whom is an accredited investor, the securities (as defined in Section 239(1) of the SFA) of that corporation shall not be transferable for 6 months after that corporation has acquired the shares under Section 275 of the SFA except: (1) to an institutional investor under Section 274 of the SFA or to a relevant person (as defined in Section 275(2) of the SFA), (2) where such transfer arises from an offer in that corporation’s securities pursuant to Section 275(1A) of the SFA, (3) where no consideration is or will be given for the transfer, (4) where the transfer is by operation of law, (5) as specified in Section 276(7) of the SFA, or (6) as specified in Regulation 32 of the Securities and Futures (Offers of Investments) (Shares and Debentures) Regulations 2005 of Singapore (“Regulation 32”).
Where the shares are subscribed or purchased under Section 275 of the SFA by a relevant person which is a trust (where the trustee is not an accredited investor (as defined in Section 4A of the SFA)) whose sole purpose is to hold investments and each beneficiary of the trust is an accredited investor, the beneficiaries’ rights and interest (howsoever described) in that trust shall not be transferable for 6 months after that trust has acquired the shares under Section 275 of the SFA except: (1) to an institutional investor under Section 274 of the SFA or to a relevant person (as defined in Section 275(2) of the SFA), (2) where such transfer arises from an offer that is made on terms that such rights or interest are acquired at a consideration of not less than S$200,000 (or its equivalent in a foreign currency) for each transaction (whether such amount is to be paid for in cash or by exchange of securities or other assets), (3) where no consideration is or will be given for the transfer, (4) where the transfer is by operation of law, (5) as specified in Section 276(7) of the SFA, or (6) as specified in Regulation 32.
Japan
The securities have not been and will not be registered under the Financial Instruments and Exchange Act of Japan (Act No. 25 of 1948, as amended), or the FIEA. The securities may not be offered or sold, directly or indirectly, in Japan or to or for the benefit of any resident of Japan (including any person resident in Japan or any
136
Table of Contents
corporation or other entity organized under the laws of Japan) or to others for reoffering or resale, directly or indirectly, in Japan or to or for the benefit of any resident of Japan, except pursuant to an exemption from the registration requirements of the FIEA and otherwise in compliance with any relevant laws and regulations of Japan.
Australia
No prospectus or other disclosure document (as defined in the Corporations Act 2001 (Cth) of Australia (“Corporations Act”)) in relation to the common stock has been or will be lodged with the Australian Securities & Investments Commission (“ASIC”). This document has not been lodged with ASIC and is only directed to certain categories of exempt persons. Accordingly, if you receive this document in Australia:
| (a) | you confirm and warrant that you are either: |
| (i) | a “sophisticated investor” under section 708(8)(a) or (b) of the Corporations Act; |
| (ii) | a “sophisticated investor” under section 708(8)(c) or (d) of the Corporations Act and that you have provided an accountant’s certificate to us which complies with the requirements of section 708(8)(c)(i) or (ii) of the Corporations Act and related regulations before the offer has been made; |
| (iii) | a person associated with the company under section 708(12) of the Corporations Act; or |
| (iv) | a “professional investor” within the meaning of section 708(11)(a) or (b) of the Corporations Act, and to the extent that you are unable to confirm or warrant that you are an exempt sophisticated investor, associated person or professional investor under the Corporations Act any offer made to you under this document is void and incapable of acceptance; and |
| (b) | you warrant and agree that you will not offer any of the common stock for resale in Australia within 12 months of that common stock being issued unless any such resale offer is exempt from the requirement to issue a disclosure document under section 708 of the Corporations Act. |
France
Neither this prospectus nor any other offering material relating to the shares described in this prospectus has been submitted to the clearance procedures of the Autorité des Marchés Financiers or of the competent authority of another member state of the European Economic Area and notified to the Autorité des Marchés Financiers. The shares have not been offered or sold and will not be offered or sold, directly or indirectly, to the public in France. Neither this prospectus nor any other offering material relating to the shares has been or will be:
| • | released, issued, distributed or caused to be released, issued or distributed to the public in France; or |
| • | used in connection with any offer for subscription or sale of the shares to the public in France. |
Such offers, sales and distributions will be made in France only:
| • | to qualified investors (investisseurs qualifiés) and/or to a restricted circle of investors (cercle restreint d’investisseurs), in each case investing for their own account, all as defined in, and in accordance with articles L.411-2, D.411-1, D.411-2, D.734-1, D.744-1, D.754-1 and D.764-1 of the French Code monétaire et financier; |
| • | to investment services providers authorized to engage in portfolio management on behalf of third parties; or |
| • | in a transaction that, in accordance with article L.411-2-II-1°-or-2°-or 3° of the French Code monétaire et financier and article 211-2 of the General Regulations (Règlement Général) of the Autorité des Marchés Financiers, does not constitute a public offer (appel public à l’épargne). |
The shares may be resold directly or indirectly, only in compliance with articles L.411-1, L.411-2, L.412-1 and L.621-8 through L.621-8-3 of the French Code monétaire et financier.
137
Table of Contents
Weil, Gotshal & Manges LLP, New York, New York, has passed upon the validity of the common stock offered by this prospectus. Certain legal matters will be passed upon on behalf of the underwriters by Baker Botts L.L.P., Houston, Texas.
The consolidated financial statements of NCS Multistage Holdings, Inc. as of December 31, 2016 and 2015 and for the years then ended have been included in this prospectus have been so included in reliance upon the report of PricewaterhouseCoopers LLP, an independent registered public accounting firm, given on the authority of said firm as experts in auditing and accounting.
WHERE YOU CAN FIND MORE INFORMATION
We have filed with the SEC a registration statement on Form S-1 under the Securities Act with respect to the shares of our common stock offered by this prospectus. For purposes of this section, the term registration statement means the original registration statement and any and all amendments including the schedules and exhibits to the original registration statement or any amendment. This prospectus, filed as part of the registration statement, does not contain all of the information set forth in the registration statement or the exhibits and schedules thereto as permitted by the rules and regulations of the SEC. For further information about us and our common stock, you should refer to the registration statement, including the exhibits. This prospectus summarizes provisions that we consider material of certain contracts and other documents to which we refer you. Because the summaries may not contain all of the information that you may find important, you should review the full text of those documents.
The registration statement, including its exhibits and schedules, may be inspected and copied at the public reference facilities maintained by the SEC at 100 F Street, N.E., Room 1580, Washington, D.C. 20549. You may obtain information on the operation of the public reference room by calling 1-800-SEC-0330. Copies of such materials are also available by mail from the Public Reference Branch of the SEC at 100 F Street, N.E., Room 1580, Washington, D.C. 20549 at prescribed rates. In addition, the SEC maintains a website at (http://www.sec.gov) from which interested persons can electronically access the registration statement, including the exhibits and schedules to the registration statement.
We have not authorized anyone to give you any information or to make any representations about us or the transactions we discuss in this prospectus other than those contained in this prospectus. If you are given any information or representations about these matters that is not discussed in this prospectus, you must not rely on that information. This prospectus is not an offer to sell or a solicitation of an offer to buy securities anywhere or to anyone where or to whom we are not permitted to offer or sell securities under applicable law.
138
Table of Contents
| Page | ||||
| CONSOLIDATED FINANCIAL STATEMENTS |
||||
| F-2 | ||||
| Consolidated Balance Sheets as of December 31, 2016 and 2015 |
F-3 | |||
| Consolidated Statements of Operations for the years ended December 31, 2016 and 2015 |
F-4 | |||
| F-5 | ||||
| F-6 | ||||
| Consolidated Statements of Cash Flows for the years ended December 31, 2016 and 2015 |
F-7 | |||
| F-8 | ||||
| SCHEDULE I-CONDENSED FINANCIAL INFORMATION OF REGISTRANT |
||||
| F-28 | ||||
| Condensed Statements of Operations as of December 31, 2016 and 2015 |
F-29 | |||
| Condensed Statements of Comprehensive Loss as of December 31, 2016 and 2015 |
F-30 | |||
| Condensed Statements of Cash Flows as of December 31, 2016 and 2015 |
F-31 | |||
| F-32 | ||||
F-1
Table of Contents
Report of Independent Registered Public Accounting Firm
To the Board of Directors and Stockholders of NCS Multistage Holdings, Inc:
In our opinion, the accompanying consolidated balance sheets and the related consolidated statements of operations and comprehensive (loss) income, changes in stockholders’ equity and cash flows present fairly, in all material respects, the financial position of NCS Multistage Holdings, Inc. as of December 31, 2016 and 2015, and the results of its operations and its cash flows for each of the two years in the period ended December 31, 2016 in conformity with accounting principles generally accepted in the United States of America. In addition, in our opinion, the financial statement schedule included in Schedule I presents fairly, in all material respects, the information set forth therein when read in conjunction with the related consolidated financial statements. These financial statements and financial statement schedule are the responsibility of the Company’s management. Our responsibility is to express an opinion on these financial statements and schedule based on our audits. We conducted our audits of these statements and financial statement schedule in accordance with the standards of the Public Company Accounting Oversight Board (United States). Those standards require that we plan and perform the audit to obtain reasonable assurance about whether the financial statements are free of material misstatement. An audit includes examining, on a test basis, evidence supporting the amounts and disclosures in the financial statements, assessing the accounting principles used and significant estimates made by management, and evaluating the overall financial statement presentation. We believe that our audits provide a reasonable basis for our opinion.
/s/ PricewaterhouseCoopers LLP
Houston, Texas
March 9, 2017, except for the effect of the stock split described in Note 17,
as to which the date is April 17, 2017
F-2
Table of Contents
NCS Multistage Holdings, Inc.
| (in thousands except share data) |
December 31, 2016 |
December 31, 2015 |
||||||
| Assets |
||||||||
| Current assets |
||||||||
| Cash and cash equivalents |
$ | 18,275 | $ | 9,545 | ||||
| Accounts receivable—trade, net |
32,116 | 25,225 | ||||||
| Inventories |
17,017 | 22,424 | ||||||
| Prepaid expenses and other current assets |
2,445 | 603 | ||||||
| Other current receivables |
3,053 | 3,354 | ||||||
| Deferred income taxes, net |
2,116 | 1,594 | ||||||
|
|
|
|
|
|||||
| Total current assets |
75,022 | 62,745 | ||||||
|
|
|
|
|
|||||
| Noncurrent assets |
||||||||
| Property and equipment, net |
9,759 | 10,584 | ||||||
| Goodwill |
122,077 | 119,283 | ||||||
| Identifiable intangibles, net |
118,697 | 138,888 | ||||||
| Deposits and other assets |
1,272 | 1,037 | ||||||
|
|
|
|
|
|||||
| Total noncurrent assets |
251,805 | 269,792 | ||||||
|
|
|
|
|
|||||
| Total assets |
$ | 326,827 | $ | 332,537 | ||||
|
|
|
|
|
|||||
| Liabilities and Stockholders’ Equity |
||||||||
| Current liabilities |
||||||||
| Accounts payable—trade |
$ | 10,258 | $ | 5,077 | ||||
| Accrued expenses |
3,290 | 714 | ||||||
| Income taxes payable |
— | 122 | ||||||
| Other current liabilities |
3,223 | 2,174 | ||||||
| Current maturities of long-term debt |
772 | — | ||||||
|
|
|
|
|
|||||
| Total current liabilities |
17,543 | 8,087 | ||||||
|
|
|
|
|
|||||
| Noncurrent liabilities |
||||||||
| Long-term debt, less current maturities |
88,394 | 85,856 | ||||||
| Other long-term liabilities |
717 | 693 | ||||||
| Deferred income taxes, net |
42,695 | 50,432 | ||||||
|
|
|
|
|
|||||
| Total noncurrent liabilities |
131,806 | 136,981 | ||||||
|
|
|
|
|
|||||
| Total liabilities |
149,349 | 145,068 | ||||||
|
|
|
|
|
|||||
| Commitments and contingencies (Note 9) |
||||||||
| Stockholders’ equity |
||||||||
| Preferred stock, $.01 par value, 1 share authorized, issued, and outstanding at December 31, 2016 and December 31, 2015, respectively. |
— | — | ||||||
| Common stock, $.01 par value, 54,000,000 shares authorized, 34,024,326 shares issued and 34,005,978 shares outstanding at December 31, 2016 and 45,000,000 shares authorized and 34,013,691 shares issued and outstanding at December 31, 2015. |
340 | 340 | ||||||
| Additional paid-in capital |
237,566 | 236,110 | ||||||
| Accumulated other comprehensive loss |
(82,015 | ) | (88,670 | ) | ||||
| Retained earnings |
21,762 | 39,689 | ||||||
| Treasury stock, at cost; 18,348 shares at December 31, 2016 |
(175 | ) | — | |||||
|
|
|
|
|
|||||
| Total stockholders’ equity |
177,478 | 187,469 | ||||||
|
|
|
|
|
|||||
| Total liabilities and stockholders’ equity |
$ | 326,827 | $ | 332,537 | ||||
|
|
|
|
|
|||||
The accompanying notes are an integral part of these consolidated financial statements.
F-3
Table of Contents
NCS Multistage Holdings, Inc.
Consolidated Statements of Operations
| (in thousands except share and per share data) |
December 31, 2016 |
December 31, 2015 |
||||||
| Revenues |
||||||||
| Product sales |
$ | 73,220 | $ | 80,079 | ||||
| Services |
25,259 | 33,926 | ||||||
|
|
|
|
|
|||||
| Total revenues |
98,479 | 114,005 | ||||||
| Cost of sales |
||||||||
| Cost of product sales, exclusive of depreciation and amortization expense shown below |
40,511 | 40,160 | ||||||
| Cost of services, exclusive of depreciation and amortization expense shown below |
13,322 | 14,553 | ||||||
|
|
|
|
|
|||||
| Total cost of sales, exclusive of depreciation and amortization expense shown below |
53,833 | 54,713 | ||||||
| Selling, general and administrative expenses |
37,061 | 37,804 | ||||||
| Depreciation |
1,766 | 2,695 | ||||||
| Amortization |
23,801 | 24,576 | ||||||
|
|
|
|
|
|||||
| (Loss) from operations |
(17,982 | ) | (5,783 | ) | ||||
|
|
|
|
|
|||||
| Other (expense) income |
||||||||
| Interest (expense), net |
(6,286 | ) | (8,064 | ) | ||||
| Other income (expense), net |
45 | (131 | ) | |||||
| Foreign currency exchange (loss) gain |
(2,522 | ) | 25,779 | |||||
|
|
|
|
|
|||||
| Total other (expense) income |
(8,763 | ) | 17,584 | |||||
|
|
|
|
|
|||||
| (Loss) income before income tax expense |
(26,745 | ) | 11,801 | |||||
| Income tax (benefit) |
(8,818 | ) | (16,224 | ) | ||||
|
|
|
|
|
|||||
| Net (loss) income |
$ | (17,927 | ) | $ | 28,025 | |||
|
|
|
|
|
|||||
| Per share information |
||||||||
| Net (loss) income per share: |
||||||||
| Basic |
$ | (0.53 | ) | $ | 0.88 | |||
|
|
|
|
|
|||||
| Diluted |
$ | (0.53 | ) | $ | 0.86 | |||
|
|
|
|
|
|||||
| Weighted average shares outstanding |
||||||||
| Basic |
34,007,505 | 29,965,946 | ||||||
|
|
|
|
|
|||||
| Diluted |
34,007,505 | 32,432,919 | ||||||
|
|
|
|
|
|||||
The accompanying notes are an integral part of these consolidated financial statements.
F-4
Table of Contents
NCS Multistage Holdings, Inc.
Consolidated Statements of Comprehensive (Loss) Income
| (in thousands) |
December 31, 2016 |
December 31, 2015 |
||||||
| Net (loss) income |
$ | (17,927 | ) | $ | 28,025 | |||
| Foreign currency translation adjustments, net of tax of $0 |
6,655 | (43,280 | ) | |||||
|
|
|
|
|
|||||
| Comprehensive (loss) income |
$ | (11,272 | ) | $ | (15,255 | ) | ||
|
|
|
|
|
|||||
The accompanying notes are an integral part of these consolidated financial statements.
F-5
Table of Contents
NCS Multistage Holdings, Inc.
Consolidated Statements of Changes in Stockholders’ Equity
| (in thousands except share data) | Preferred Stock | Common Stock | Additional Paid-in Capital |
Accumulated Other Comprehensive (Loss) Income |
Retained Earnings |
Treasury Stock | Total Stockholders’ Equity |
|||||||||||||||||||||||||||||||||
| Shares | Amount | Shares | Amount | Shares | Amount | |||||||||||||||||||||||||||||||||||
| Balances as of January 1, 2015 |
1 | $ | — | 29,826,669 | $ | 298 | $ | 194,840 | $ | (45,390 | ) | $ | 11,664 | — | $ | — | $ | 161,412 | ||||||||||||||||||||||
| Contributions |
— | — | 4,187,022 | 42 | 39,957 | — | — | — | — | 39,999 | ||||||||||||||||||||||||||||||
| Share-based compensation |
— | — | — | — | 1,313 | — | — | — | — | 1,313 | ||||||||||||||||||||||||||||||
| Treasury shares purchased at cost |
— | — | — | — | — | — | — | — | — | — | ||||||||||||||||||||||||||||||
| Net income |
— | — | — | — | — | — | 28,025 | — | — | 28,025 | ||||||||||||||||||||||||||||||
| Currency translation adjustment |
— | — | — | — | — | (43,280 | ) | — | — | — | (43,280 | ) | ||||||||||||||||||||||||||||
|
|
|
|
|
|
|
|
|
|
|
|
|
|
|
|
|
|
|
|
|
|||||||||||||||||||||
| Balances as of December 31, 2015 |
1 | $ | — | 34,013,691 | $ | 340 | $ | 236,110 | $ | (88,670 | ) | $ | 39,689 | — | $ | — | $ | 187,469 | ||||||||||||||||||||||
| Contributions |
— | — | 10,635 | 0 | 102 | — | — | — | — | 102 | ||||||||||||||||||||||||||||||
| Share-based compensation |
— | — | — | — | 1,354 | — | — | — | — | 1,354 | ||||||||||||||||||||||||||||||
| Treasury shares purchased at cost |
— | — | — | — | — | — | — | 18,348 | (175 | ) | (175 | ) | ||||||||||||||||||||||||||||
| Net loss |
— | — | — | — | — | — | (17,927 | ) | — | — | (17,927 | ) | ||||||||||||||||||||||||||||
| Currency translation adjustment |
— | — | — | — | — | 6,655 | — | — | — | 6,655 | ||||||||||||||||||||||||||||||
|
|
|
|
|
|
|
|
|
|
|
|
|
|
|
|
|
|
|
|
|
|||||||||||||||||||||
| Balances as of December 31, 2016 |
1 | $ | — | 34,024,326 | $ | 340 | $ | 237,566 | $ | (82,015 | ) | $ | 21,762 | 18,348 | $ | (175 | ) | $ | 177,478 | |||||||||||||||||||||
|
|
|
|
|
|
|
|
|
|
|
|
|
|
|
|
|
|
|
|
|
|||||||||||||||||||||
The accompanying notes are an integral part of these consolidated financial statements.
F-6
Table of Contents
NCS Multistage Holdings, Inc.
Consolidated Statements of Cash Flows
| (in thousands) |
December 31, 2016 |
December 31, 2015 |
||||||
| Cash flows from operating activities |
||||||||
| Net (loss) income |
$ | (17,927 | ) | $ | 28,025 | |||
| Adjustments to reconcile net (loss) income to net cash provided by operating activities: |
||||||||
| Depreciation and amortization |
25,567 | 27,271 | ||||||
| Amortization of deferred loan cost |
740 | 945 | ||||||
| Share-based compensation |
1,354 | 1,313 | ||||||
| Provision for doubtful accounts receivable |
— | 113 | ||||||
| Provision for inventory obsolescence |
2,415 | 1,544 | ||||||
| Deferred income tax (benefit) |
(9,266 | ) | (11,300 | ) | ||||
| (Gain)/Loss on sale of property and equipment |
(143 | ) | 744 | |||||
| Foreign exchange loss (gain) on financing item |
2,576 | (26,277 | ) | |||||
| Changes in operating assets and liabilities: |
||||||||
| Accounts receivable—trade |
(6,482 | ) | 16,297 | |||||
| Inventories |
3,540 | 4,159 | ||||||
| Prepaid expenses and other assets |
(119 | ) | (195 | ) | ||||
| Accounts payable—trade |
5,131 | (3,130 | ) | |||||
| Accrued expenses |
1,861 | (6,672 | ) | |||||
| Other current liabilities |
1,209 | (2,842 | ) | |||||
| Income taxes receivable/payable |
228 | (25,626 | ) | |||||
|
|
|
|
|
|||||
| Net cash provided by operating activities |
10,684 | 4,369 | ||||||
|
|
|
|
|
|||||
| Cash flows from investing activities |
||||||||
| Purchases of property and equipment |
(1,157 | ) | (890 | ) | ||||
| Proceeds from sales of property and equipment |
317 | 424 | ||||||
| Issuance of note receivable—related party |
— | (755 | ) | |||||
| Funding of short-term note receivable |
(1,000 | ) | — | |||||
|
|
|
|
|
|||||
| Net cash used in investing activities |
(1,840 | ) | (1,221 | ) | ||||
|
|
|
|
|
|||||
| Cash flows from financing activities |
||||||||
| Debt issuance cost |
— | (1,195 | ) | |||||
| Payments related to public offering |
(242 | ) | — | |||||
| Purchases of treasury stock |
(175 | ) | — | |||||
| Repayment of term note |
— | (51,570 | ) | |||||
| Proceeds from issuance of common stock |
102 | 39,999 | ||||||
|
|
|
|
|
|||||
| Net cash used in financing activities |
(315 | ) | (12,766 | ) | ||||
|
|
|
|
|
|||||
| Effect of exchange rate changes on cash and cash equivalents |
201 | (1,008 | ) | |||||
|
|
|
|
|
|||||
| Net change in cash and cash equivalents |
8,730 | (10,626 | ) | |||||
| Cash and cash equivalents |
||||||||
| Beginning of year |
9,545 | 20,171 | ||||||
|
|
|
|
|
|||||
| End of year |
$ | 18,275 | $ | 9,545 | ||||
|
|
|
|
|
|||||
| Supplemental cash flow information |
||||||||
| Cash paid for interest |
$ | 5,447 | $ | 9,381 | ||||
| Cash for income taxes |
130 | 20,476 | ||||||
| Noncash investing and financing activities |
||||||||
| Unpaid costs related to public offering |
708 | — | ||||||
The accompanying notes are an integral part of these consolidated financial statements.
F-7
Table of Contents
NCS Multistage Holdings, Inc.
Notes to Consolidated Financial Statements
For the Years Ended December 31, 2016 and 2015
(in thousands, except share and per share data)
1. Organization and Nature of Business
NCS Multistage Holdings, Inc. through its wholly owned subsidiaries (collectively referred to as the “Company” or “we” or “us”), is primarily engaged in providing engineered products and support services for oil and natural gas well completions and field development strategies. We offer our products and services primarily to exploration and production companies for use in onshore wells. The company operates through six service facilities principally located in Houston and Midland, Texas; and Calgary, Red Deer, Grande Prairie and Estevan, Canada. The Company had approximately 200 employees as of December 31, 2016 and its corporate headquarters are located in Houston, Texas.
The Company is a Delaware corporation that was incorporated on December 19, 2012 as a holding company for the primary purpose, through its wholly owned subsidiaries, of acquiring all of the outstanding interests in NCS Energy Holdings, LLC as of December 20, 2012. The Company changed its name from Pioneer Super Holdings, Inc. to NCS Multistage Holdings, Inc. on December 13, 2016.
For the years ended December 31, 2016 and 2015, approximately 71% and 66%, respectively, of the Company’s revenues were derived from its Canadian operations.
2. Basis of Presentation
The accompanying consolidated financial statements of the Company have been prepared in accordance with accounting principles generally accepted in the United States (“U.S. GAAP”). All intercompany transactions have been eliminated in consolidation.
3. Summary of Significant Accounting Policies
Use of Estimates
The preparation of consolidated financial statements in conformity with U.S. GAAP requires management to make estimates and assumptions that affect the reported amounts of assets and liabilities and disclosure of contingent assets and liabilities at the date of the consolidated financial statements and the reported amounts of revenues and expenses during the reporting period. Such estimates include but are not limited to estimated losses on accounts receivables, estimated realizable value on excess and obsolete inventories, estimates related to fair value of reporting units for purposes of assessing possible goodwill impairment, expected future cash flows from long lived assets to support impairment tests, share based compensation, amounts of deferred taxes and income tax contingencies. Actual results could materially differ from those estimates.
Foreign Currency
The Company’s functional currency is the U.S. Dollar (“USD”). The financial position and results of operations of the Company’s Canadian subsidiary are measured using the local currency as the functional currency. In accordance with Financial Accounting Standards Board (“FASB”) Accounting Standards Codification (“ASC”) 830, Foreign Currency Matters, revenues and expenses of the subsidiary have been translated into U.S. dollars at average exchange rates prevailing during the period. Assets and liabilities have been translated at the rates of exchange on the consolidated balance sheet date. The resulting translation gain and loss adjustments have been recorded directly as a separate component of other comprehensive (loss) in the accompanying consolidated statements of comprehensive (loss), and changes in stockholders’ equity.
F-8
Table of Contents
NCS Multistage Holdings, Inc.
Notes to Consolidated Financial Statements
For the Years Ended December 31, 2016 and 2015
(in thousands, except share and per share data)
Transaction gains and losses that arise from exchange rate fluctuations on transactions denominated in a currency other than the functional currency are included in the consolidated statements of operations as incurred.
Revenue Recognition
The Company recognizes revenue when it is determined that the following criteria are met: (i) persuasive evidence of an arrangement exists; (ii) delivery has occurred or services have been rendered; (iii) the fee is fixed or determinable; and (iv) collectability is reasonably assured. Proceeds from customers for the cost of oilfield service equipment that is damaged or lost-in-hole are reflected as revenues.
The Company recognizes revenue based upon purchase orders, contracts or other persuasive evidence of an arrangement with the customer that include fixed or determinable prices, provided that collectability is reasonably assured, but that do not include right of return or other similar provisions or other significant postdelivery obligations. Revenue is recognized generally for products upon installation and when the customer assumes the risks and rewards of ownership. In cases where services are being performed, the Company generally does not recognize revenue until a job has been completed, which includes a customer signature or acknowledgement and that there are no additional services or future performance obligation required by the Company. Rates for services are typically priced on a per day, per man-hour or similar basis that include both the cost of utilizing our downhole frac isolation assembly and our personnel required to supervise the operation of the assembly. Proceeds from customers for the cost of oilfield equipment that is damaged or lost-in-hole are reflected as revenues.
Historically, the Company has not experienced significant customer complaints regarding our products or services and therefore the Company has elected not to implement separate warranty provisions and instead records any such instances on an actual basis as they occur.
Cash and Cash Equivalents
The Company considers all highly liquid instruments purchased with an original maturity date of three months or less to be cash equivalents. These items are carried at cost, which approximates fair value.
In accordance with ASC 230, Statements of Cash Flow, cash flows from the Company’s Canadian subsidiary are calculated based on its functional currency. As a result, amounts related to changes in assets and liabilities reported in the consolidated statements of cash flows will not necessarily agree to changes in the corresponding balances on the consolidated balance sheets.
Concentration of Credit Risk
Financial instruments that potentially subject the Company to credit risk are cash and cash equivalents and trade accounts receivable. Cash balances are maintained in financial institutions which, at times, exceed federally insured limits. The Company monitors the financial condition of the financial institutions in which the accounts are maintained and has not experienced any losses in such accounts.
Substantially all of the Company’s sales are to customers whose activities are directly or indirectly related to the oil and gas industry. The Company generally extends credit to these customers and, therefore, collection of receivables is affected by the oil and gas industry economy. The Company performs ongoing credit evaluations as to the financial condition of its customers with respect to trade accounts receivables. Generally, no collateral is required as a condition of sale.
F-9
Table of Contents
NCS Multistage Holdings, Inc.
Notes to Consolidated Financial Statements
For the Years Ended December 31, 2016 and 2015
(in thousands, except share and per share data)
For the years ended December 31, 2016 and 2015, there was one customer that accounted for 10% or more of the total revenue or 10% or more of the total accounts receivable balance at the end of the respective periods. The Company recognized revenue from this one customer totaling approximately $25.5 million, or 26% of 2016 total revenue for the year ended December 31, 2016 and approximately $35.1 million or 31% of 2015 total revenue for the year ended December 31, 2015. Amounts due from this customer included in trade accounts receivable in the accompanying consolidated balance sheets was approximately $7.8 million as of December 31, 2016 and $4.4 million as of December 31, 2015. No other customer individually accounted for 10% or more of the Company’s consolidated revenue during 2016 and 2015 or trade receivable balance as of December 31, 2016 and 2015.
Accounts Receivable, Trade and Allowance for Doubtful Accounts
Trade accounts receivables are carried at their estimated collectible amounts. Trade credit is generally extended on a short-term basis; thus receivables do not bear interest, although a finance charge may be applied to amounts past due.
The Company maintains an allowance for doubtful accounts for estimated losses that may result from the inability of its customers to make required payments. Earnings are charged with a provision for doubtful accounts based on a current review of the collectability of customer accounts by management. Such allowances are based upon several factors including, but not limited to credit approval practices, industry and customer historical experience as well as the current and projected financial condition of the specific customer. Accounts deemed uncollectible are applied against the allowance for doubtful accounts. As of December 31, 2016 and 2015, the Company has recorded approximately $70 and $445, respectively, in provisions for doubtful accounts.
Inventories
Inventories consist primarily of raw material, sliding sleeves components, assembled sliding sleeves and certain components used to internally construct our frac isolation assemblies. Inventories are stated at the lower of cost or estimated net realizable value. Cost is determined at standard costs approximating the first-in first-out basis. The Company continuously evaluates inventories, based on an analysis of inventory levels, historical sales experience and future sales forecasts, to determine obsolete, slow-moving and excess inventory. Adjustments to reduce such inventory to its estimated recoverable value have been recorded as an adjustment to cost of sales.
Property and Equipment
Property and equipment are stated at cost less accumulated depreciation. Equipment held under capital leases are stated at the present value of minimum lease payments. Expenditures for property and equipment and for items which substantially increase the useful lives of existing assets are capitalized at cost and depreciated over their estimated useful life utilizing the straight-line method. Routine expenditures for repairs and maintenance are expensed as incurred. Depreciation is calculated over the estimated useful lives of the related assets using the straight-line method. Leasehold improvements and property under capital leases are amortized over the shorter of the remaining lease term or useful life of the related asset. Depreciation expense includes amortization of assets under capital leases. The cost and related accumulated depreciation of assets retired or otherwise disposed of are eliminated from the accounts, and any resulting gains or losses are recognized in operations in the year of disposal.
F-10
Table of Contents
NCS Multistage Holdings, Inc.
Notes to Consolidated Financial Statements
For the Years Ended December 31, 2016 and 2015
(in thousands, except share and per share data)
Depreciation on property and equipment, including assets held under capital leases, is calculated using the straight-line method over the following useful service lives or lease term (which includes reasonably assured renewal periods):
| Years | ||||
| Buildings |
30 | |||
| Building equipment |
5-15 | |||
| Machinery and equipment |
12 | |||
| Furniture and fixtures |
3-5 | |||
| Computers and software |
3-5 | |||
| Vehicles and rental equipment |
3-4 | |||
| Leasehold improvements |
Lease term (1-4 | ) | ||
The Company periodically assesses potential impairment of its property and equipment, when events or changes in circumstances occur that indicate the carrying value of the asset or asset group may not be recoverable. The assessment of possible impairment is based on the Company’s overall valuation calculation using forward looking as well as historical computations to measure the value of the Company. If the overall valuation results are less than the carrying value of such assets, an impairment loss is recognized for the difference between estimated fair value and carrying value. No impairment loss has been recognized for the years ended December 31, 2016 and 2015.
Goodwill and Intangible Assets
For goodwill, an assessment for impairment is performed annually or when there is an indication an impairment may have occurred. The Company completes its annual impairment test for goodwill using an assessment date in the fourth quarter of each fiscal year. Goodwill is reviewed for impairment by comparing the carrying value of the reporting unit’s net assets (including allocated goodwill) to the fair value of the reporting unit. The fair value of the reporting unit is determined using a discounted cash flow approach. Determining the fair value of a reporting unit requires the use of estimates and assumptions. Such estimates and assumptions include revenue growth rates, operating margins, weighted average costs of capital, a terminal growth rate, and future market conditions, among others. The Company believes that the estimates and assumptions used in impairment assessments are reasonable. If the reporting unit’s carrying value is greater than its fair value, a second step is performed whereby the implied fair value of goodwill is estimated by allocating the fair value of the reporting unit in a hypothetical purchase price allocation analysis. The Company recognizes a goodwill impairment charge for the amount by which the carrying value of goodwill exceeds its fair value. The Company concluded that there was no impairment of goodwill or identifiable intangibles in 2016 and 2015. All identifiable intangibles are amortized on a straight-line basis over the estimated useful life or term of related agreements as indicated above. These assets are tested for impairment whenever events or changes in circumstances indicate that their carrying amount may not be recoverable.
Income Taxes
The Company is taxed as a corporation as defined under the Internal Revenue Code. The liability method is used in accounting for deferred income taxes. Under this method, deferred tax assets and liabilities are determined based on the difference between the financial reporting and tax bases of assets and liabilities and are measured using the enacted tax rates and laws that will be in effect when these differences are expected to reverse. The realizability of deferred tax assets are evaluated annually and a valuation allowance is provided if it
F-11
Table of Contents
NCS Multistage Holdings, Inc.
Notes to Consolidated Financial Statements
For the Years Ended December 31, 2016 and 2015
(in thousands, except share and per share data)
is more likely than not that the deferred tax assets will not give rise to future benefits. The Company follows guidance in ASC 740 “Income Taxes” for uncertainty in income taxes by prescribing the minimum recognition threshold an income tax position is required to meet before being recognized in the consolidated financial statements and applies to all income tax positions. Each income tax position is assessed using a two-step process. A determination is first made as to whether it is more likely than not that the income tax position will be sustained, based upon technical merits, upon examination by the taxing authorities. If the income tax position is expected to meet the more likely than not criteria, the benefit recorded in the consolidated financial statements equals the largest amount that is greater than 50% likely to be realized upon its ultimate settlement. A valuation allowance to reduced deferred tax assets is established when is more likely than not that some portion or all the deferred tax assets will not be realized. As of December 31, 2016 and 2015, the Company’s valuation allowance was approximately $63. The Company recognizes accrued interest and penalties related to uncertain tax positions in other income (expense) on the statement of operations. During the year ended December 31, 2016 and 2015, respectively, the Company recognized approximately $129 and $82 in interest and penalties. The Company had approximately $411 and $664 in interest and penalties accrued at December 31, 2016 and 2015, respectively.
The Company completed its analysis of its tax positions and believes there are no material uncertain tax positions that would require recognition in the consolidated financial statements as of December 31, 2016 and 2015. The Company believes that there are no tax positions taken or expected to be taken as of December 31, 2016 and 2015 that would significantly increase or decrease unrecognized tax benefits within the next twelve months following the balance sheet date. As of December 31, 2016 and 2015, there were no material amounts that had been accrued with respect to uncertain tax positions.
During 2014, our Canadian subsidiary guaranteed the credit facilities of our U.S. entities. Under U.S. federal income tax rules, this guarantee results in all of the earnings and profits of our Canadian subsidiary being subject to current U.S. tax. As a result, we have recognized a U.S. deferred tax liability of $3.9 million and $4.0 million as of December 31, 2016 and 2015, respectively, related to a portion of our outside basis differences in our Canadian subsidiary for which we are unable to assert indefinite reinvestment. No U.S. deferred taxes have been recognized on $52.1 million and $54.2 million as of December 31, 2016 and 2015, respectively, of our outside basis differences that we continue to indefinitely reinvest. Upon reversal of these outside basis differences through dividends or otherwise, we may be subject to U.S. income taxes (subject to adjustment for foreign tax credits) and foreign withholding taxes. It is not practical, however, to estimate the amount of taxes that may be payable on the eventual remittance of these temporary differences after consideration of available foreign tax credits.
The Company files income tax returns in the U.S. and in various state and foreign jurisdictions. The Company’s U.S. income tax returns for 2011 and subsequent years remain open for examination. The Internal Revenue Service (“IRS”) commenced an examination of the Company’s U.S. income tax return for 2011 through 2012 in the first quarter of 2014 which was completed in 2015. No tax adjustments were proposed. Additionally, the IRS commenced an examination of the Company’s U.S. income tax return for 2014 in the second quarter of 2016. No tax adjustments have been proposed.
Share-Based Compensation
The Company measures all share-based compensation awards at fair value on the date they are granted, and recognizes compensation cost, net of forfeitures, over the requisite service period for awards with only a service condition, and over a graded vesting period for awards with service and performance conditions.
F-12
Table of Contents
NCS Multistage Holdings, Inc.
Notes to Consolidated Financial Statements
For the Years Ended December 31, 2016 and 2015
(in thousands, except share and per share data)
The Black-Scholes option pricing model is used to measure the fair value of options. The following sections address the assumptions used related to the Black-Scholes option pricing model:
Expected volatility—The Company developed its expected volatility by using the historical volatilities of the Company’s peer group of public companies for a period equal to the expected life of the option by taking the median of the annualized weekly ten year standard deviation of their stock prices.
Risk-free interest rate—The risk-free interest rates for options granted are based on the ten year constant maturity Treasury bond rates whose term is consistent with the expected life of an option from the date of grant.
Expected Term—As the Company does not have sufficient historical experience for determining the expected term of the stock option awards granted, we based our expected term for awards issued to employees on the “simplified” method under the provisions of ASC 718-10. The expected term is based on the midpoint between the vesting date and contractual term of an option. The expected term represents the period that our stock-based awards are expected to be outstanding.
Expected dividend yield—The Company does not anticipate paying cash dividends on our shares of common stock; therefore, the expected dividend yield is assumed to be zero.
Shipping and Handling Fees and Cost
Shipping and handling fees, if billed to customers, are included in revenues. Shipping and handling costs are classified as cost of revenues.
Fair Value
The carrying amounts for financial instruments classified as current assets and current liabilities approximate fair value, due to the short maturity of such instruments. The book values of other financial instruments, such as the Company’s debt under its Credit Facility, approximates fair value because interest rates charged are similar to other financial instruments with similar terms and maturities and the rates vary in accordance with a market index in accordance with ASC 820—Fair Value measurement.
For the financial assets and liabilities disclosed at fair value, fair value is determined as the exit price, or the price that would be received to sell an asset or paid to transfer a liability in an orderly transaction between market participants at the measurement date. The established fair value hierarchy divides fair value measurement into three broad levels:
| • | Level 1—inputs are quoted prices (unadjusted) in active markets for identical assets or liabilities that the reporting entity has the ability to access at the measurement date; |
| • | Level 2—inputs other than quoted prices included within Level 1 that are observable for the assets or liability, either directly or indirectly; and |
| • | Level 3—inputs are unobservable for the asset or liability, which reflect the best judgment of management. |
The financial assets and liabilities that are disclosed at fair value for disclosure purposes are categorized in one of the above three levels based on the lowest level input that is significant to the fair value measurement in its entirety. Level 1 provides the most reliable measure of fair value, whereas Level 3 generally requires significant management judgment.
F-13
Table of Contents
NCS Multistage Holdings, Inc.
Notes to Consolidated Financial Statements
For the Years Ended December 31, 2016 and 2015
(in thousands, except share and per share data)
Earnings Per Share
Basic income per share is calculated by dividing net income, reduced for the allocation of net income (loss) attributable to participating security holders of exchangeable securities held in the Company’s indirect subsidiary, by the weighted-average number of common shares outstanding during the period. The participating security holders were allocated 0% and 5.72% of the net income for December 31, 2016 and 2015, respectively. The participating security holders are not contractually obligated to share in the losses of the Company, therefore, losses are not allocated to the participating security holders. The diluted income per share computation is calculated by dividing net income by the weighted-average number of common shares outstanding during the period, taking into effect, if any, of shares that would be issuable upon the exercise of outstanding stock options and conversion of the participating security holders exchangeable securities, reduced by the number of shares purchased by the Company at cost, when such amounts are dilutive to the income per share calculation. There is no dilutive effect for 2016 since the company is in a net loss position.
Research and Development
Research and development (“R&D”) costs are incurred both through engaging third parties to perform development activities under coordination and management of the Company as well as through the utilization of Company employees to create and develop new ideas and product. The Company incurred approximately $3.3 million and $3.0 million in R&D costs for the years ended December 31, 2016 and 2015, respectively. These costs are recorded in selling, general and administrative expense on the statements of operation.
Recent Accounting Pronouncements
In February 2016, the FASB issued ASU No. 2016-02, Leases (“ASC 842”), which replaces the existing guidance in ASC 840, Leases. ASC 842 requires lessees to recognize most leases on their balance sheets as lease liabilities with corresponding right-of-use assets. The new lease standard does not substantially change lessor accounting. The new standard is effective for interim and annual reporting periods beginning after December 15, 2018, with early adoption permitted. We are currently evaluating the impact of the adoption of this guidance.
In November 2015, the FASB issued ASU No. 2015-17, Balance Sheet Classification of Deferred Taxes. This standard requires all deferred taxes, along with any related valuation allowance, to be presented as a noncurrent deferred asset or liability. The guidance is effective for fiscal years beginning after December 15, 2016, and includes interim periods within those fiscal years. Early adoption is permitted and the guidance may be applied either prospectively, for all deferred tax assets and liabilities, or retrospectively by reclassifying the comparative balance sheet. We do not expect this ASU to have a material impact on our financial statements.
In July 2015, the FASB issued ASU No. 2015-11, Simplifying the Measurement of Inventory, which requires companies to measure inventory at the lower of cost or net realizable value rather than at the lower of cost or market. Net realizable value is the estimated selling price in the ordinary course of business, less reasonably predictable costs of completion, disposal and transportation. The new standard is effective for the Company for the fiscal year beginning after December 15, 2016 and interim periods within those fiscal years. The Company has early adopted the guidance as of January 1, 2016 and there was no material impact on our financial statements.
In August 2014, the FASB issued ASU No. 2014-15, Presentation of Financial Statements—Going Concern. The new standard requires management to evaluate whether there are conditions and events that raise
F-14
Table of Contents
NCS Multistage Holdings, Inc.
Notes to Consolidated Financial Statements
For the Years Ended December 31, 2016 and 2015
(in thousands, except share and per share data)
substantial doubt about an entity’s ability to continue as a going concern for both annual and interim reporting. The guidance is effective for the Company for the annual period ending after December 15, 2016 and interim periods thereafter. Management performed an evaluation of the Company’s ability to fund operations and to continue as a going concern according to ASC Topic 205-40, Presentation of Financial Statements—Going Concern. The guidance did not have a material impact on our financial statements.
In May 2014, the FASB issued ASU No. 2014-09, Revenue from Contracts with Customers (Topic 606). The new standard is effective for annual reporting periods beginning after December 15, 2017 and early adoption is permitted, however, not before fiscal years beginning after December 15, 2016. Subsequent to ASU 2014-09’s issuance, Topic 606 was amended for FASB updates that changed the Effective date as well as addressing certain aspects regarding new revenue standards. The comprehensive new standard will supersede existing revenue recognition guidance and require revenue to be recognized when promised goods or services are transferred to customers in amounts that reflect the consideration to which the company expects to be entitled in exchange for those goods or services. Adoption of the new rules could affect the timing of revenue recognition for certain transactions. The guidance permits two implementation approaches, one requiring retrospective application of the new standard with restatement of prior years and one requiring prospective application of the new standard with disclosure of results under old standards. We are currently evaluating this standard in order to select a transition method and the effective date. We have not determined the effect of this standard on our financial statements and related disclosures.
4. Inventories
Inventories consist of the following as of December 31, 2016 and 2015:
| December 31, 2016 |
December 31, 2015 |
|||||||
| Raw materials |
$ | 695 | $ | 2,303 | ||||
| Work in process |
688 | 104 | ||||||
| Finished goods |
15,634 | 20,017 | ||||||
|
|
|
|
|
|||||
| $ | 17,017 | $ | 22,424 | |||||
|
|
|
|
|
|||||
F-15
Table of Contents
NCS Multistage Holdings, Inc.
Notes to Consolidated Financial Statements
For the Years Ended December 31, 2016 and 2015
(in thousands, except share and per share data)
5. Property and Equipment
Property and equipment consist of the following as of December 31, 2016 and 2015:
| December 31, 2016 |
December 31, 2015 |
|||||||
| Land |
$ | 2,026 | $ | 1,966 | ||||
| Building and improvements |
4,517 | 4,234 | ||||||
| Machinery and equipment |
1,983 | 1,796 | ||||||
| Computers and software |
1,345 | 1,102 | ||||||
| Furniture and fixtures |
916 | 894 | ||||||
| Vehicles |
2,475 | 2,730 | ||||||
| Service equipment |
1,964 | 2,297 | ||||||
|
|
|
|
|
|||||
| 15,226 | 15,019 | |||||||
| Less: Accumulated depreciation and amortization |
5,763 | 4,794 | ||||||
|
|
|
|
|
|||||
| 9,463 | 10,225 | |||||||
| Construction in progress |
296 | 359 | ||||||
|
|
|
|
|
|||||
| Property and equipment, net |
$ | 9,759 | $ | 10,584 | ||||
|
|
|
|
|
|||||
Depreciation expense and amortization for property and equipment totaled approximately $1.8 million and $2.7 million for the years ended December 31, 2016 and 2015, respectively.
The Company leases vehicles for its transportation fleet, which are included in the table above. See Note 9—Commitments and Contingencies for the related amortization expense.
6. Goodwill and Identifiable Intangibles
Changes in the carrying amount of goodwill is as follows:
| At December 31, 2014 |
$ | 137,709 | ||
| Currency translation adjustment |
(18,426 | ) | ||
|
|
|
|||
| At December 31, 2015 |
119,283 | |||
| Currency translation adjustment |
2,794 | |||
|
|
|
|||
| At December 31, 2016 |
$ | 122,077 | ||
|
|
|
|||
F-16
Table of Contents
NCS Multistage Holdings, Inc.
Notes to Consolidated Financial Statements
For the Years Ended December 31, 2016 and 2015
(in thousands, except share and per share data)
Identifiable intangibles consist of the following:
| December 31, 2016 | ||||||||||||||||
| Estimated Useful Lives (Years) |
Gross Carrying Amount |
Accumulated Amortization |
Net Balance |
|||||||||||||
| Technology |
14 | $ | 138,026 | $ | (39,956 | ) | $ | 98,070 | ||||||||
| Trademark |
5 | 936 | (759 | ) | 177 | |||||||||||
| In-process research and development |
5 | 35,306 | (28,621 | ) | 6,685 | |||||||||||
| Customer relationships |
15 | 11,577 | (3,128 | ) | 8,449 | |||||||||||
| Noncompete agreements |
5 | 28,065 | (22,749 | ) | 5,316 | |||||||||||
|
|
|
|
|
|
|
|||||||||||
| Total identifiable intangibles |
$ | 213,910 | $ | (95,213 | ) | $ | 118,697 | |||||||||
|
|
|
|
|
|
|
|||||||||||
| Estimated Useful Lives (Years) |
December 31, 2015 | |||||||||||||||
| Gross Carrying Amount |
Accumulated Amortization |
Net Balance |
||||||||||||||
| Technology |
14 | $ | 134,919 | $ | (29,421 | ) | $ | 105,498 | ||||||||
| Trademark |
5 | 916 | (559 | ) | 357 | |||||||||||
| In-process research and development |
5 | 34,305 | (20,948 | ) | 13,357 | |||||||||||
| Customer relationships |
15 | 11,307 | (2,301 | ) | 9,006 | |||||||||||
| Noncompete agreements |
5 | 27,400 | (16,730 | ) | 10,670 | |||||||||||
|
|
|
|
|
|
|
|||||||||||
| Total identifiable intangibles |
$ | 208,847 | $ | (69,959 | ) | $ | 138,888 | |||||||||
|
|
|
|
|
|
|
|||||||||||
Total amortization expense for the years ended December 31, 2016 and 2015 was $23.8 million and $24.0 million, respectively.
The total weighted average amortization period is 9 years and estimated future amortization expense is as follows:
| 2017 |
$ | 22,810 | ||
| 2018 |
10,631 | |||
| 2019 |
10,631 | |||
| 2020 |
10,631 | |||
| 2021 |
10,631 | |||
| Thereafter |
53,363 |
7. Accrued Expenses
Accrued expenses consist of the following as of December 31, 2016 and 2015:
| December 31, 2016 |
December 31, 2015 |
|||||||
| Accrued payroll |
$ | 850 | $ | 334 | ||||
| Property and franchise taxes accrual |
322 | 337 | ||||||
| Accrual related to public offering |
1,153 | — | ||||||
| Accrued acquisition related costs |
618 | — | ||||||
| Accrued other miscellaneous liabilities |
347 | 43 | ||||||
|
|
|
|
|
|||||
| $ | 3,290 | $ | 714 | |||||
|
|
|
|
|
|||||
F-17
Table of Contents
NCS Multistage Holdings, Inc.
Notes to Consolidated Financial Statements
For the Years Ended December 31, 2016 and 2015
(in thousands, except share and per share data)
8. Revolving Line of Credit and Long-term Debt
The Company’s long-term debt, net is as follows:
| December 31, 2016 |
December 31, 2015 |
|||||||
| Term |
$ | 90,836 | $ | 88,260 | ||||
| Revolving line of credit |
— | — | ||||||
|
|
|
|
|
|||||
| Total |
90,836 | 88,260 | ||||||
| Less debt issuance costs |
1,670 | 2,404 | ||||||
|
|
|
|
|
|||||
| Total debt, net |
89,166 | 85,856 | ||||||
| Less: current portion |
(772 | ) | — | |||||
|
|
|
|
|
|||||
| Long-term debt |
$ | 88,394 | $ | 85,856 | ||||
|
|
|
|
|
|||||
Effective August 7, 2014, the Company entered into a new credit agreement with a group of financial institutions which was denominated in Canadian dollars (“CAD”) and allows for a term loan of up to approximately $197.6 million CAD ($180.0 million USD), and a $38.4 million CAD ($35.0 million USD) revolving line of credit of which $5.0 million CAD ($3.8 million USD) may be made available for letters of credit and $5.0 million CAD ($3.8 million USD) may be made available for swingline loans.
The term loan bears interest at the adjusted base rate or Canadian base rate plus an applicable margin, as defined in the credit agreement governing the Credit Facility, with quarterly interest payments. The applicable interest rate at December 31, 2016 and 2015 was 5.769% and 5.512%, respectively. The term loan is collateralized by certain assets of the Company and guaranteed by certain wholly owned subsidiaries of the Company. The interest on the term loan is payable in quarterly installments. Beginning in November 2017, quarterly principal payments will resume with all unpaid principal and interest due at maturity on August 7, 2019. The term loan had an outstanding balance of $90.8 million and $88.3 million as of December 31, 2016 and 2015, respectively. We incurred interest expense of $5.5 million and $7.3 million for the years ended December 31, 2016 and 2015, respectively.
The revolving line of credit is collateralized by certain assets of the Company and guaranteed by certain wholly owned subsidiaries of the Company. Interest on the revolving line of credit is payable monthly at the adjusted base rate or Canadian base rate plus an applicable margin, as defined in the agreement governing the Credit Facility. All unpaid principal and interest on the revolving line of credit is due at maturity on August 7, 2019. As of December 31, 2016 and 2015, the outstanding balance under the revolving line of credit was zero.
The agreement governing the Credit Facility contains financial covenants that requires (i) commencing with the fiscal quarter ended March 31, 2019, compliance with a leverage ratio test set at 3.00 to 1.00 as of the last day of each fiscal quarter, (ii) commencing with the fiscal quarter ended March 31, 2019, compliance with a fixed charge coverage ratio test set at 1.25 to 1.00 as of the last day of each fiscal quarter and (iii) commencing with the fiscal quarter ended December 31, 2015, compliance with an interest coverage ratio set at (x) 1.50 to 1.00 as of the last day of each fiscal quarter through and including the fiscal quarter ended December 31, 2017 and (y) 1.75 to 1.00 as of the last day of the fiscal quarter ended March 31, 2018 through and including the fiscal quarter ending December 31, 2018. As of December 31, 2016, the Company was in compliance with these covenants. Our ability to meet these financial ratios can be affected by events beyond our control and we cannot assure you that we will be able to meet these ratios. A breach of any covenant or restriction contained in the agreement governing our Credit Facility could result in a default under this agreement. If any such default
F-18
Table of Contents
NCS Multistage Holdings, Inc.
Notes to Consolidated Financial Statements
For the Years Ended December 31, 2016 and 2015
(in thousands, except share and per share data)
occurs, the lenders under the Credit Facility, may elect (after the expiration of any applicable notice or grace periods) to declare all outstanding borrowings, together with accrued and unpaid interest and other amounts payable thereunder, to be immediately due and payable. The lenders under the Credit Facility also have the right upon an event of default thereunder to terminate any commitments they have to provide further borrowings. Further, following an event of default under the agreement governing our Credit Facility, the lenders under the Credit Facility will have the right to proceed against the collateral granted to them to secure that debt. If the debt under the Credit Facility was to be accelerated, our assets may not be sufficient to repay in full that debt or any other debt that may become due as a result of that acceleration.
The Company entered into Amendment No. 1, effective April 15, 2015, which modified the original agreement governing the Credit Facility. The modifications change various defined terms as well as the covenants. On December 22, 2015, the Company prepaid a portion of the principal balance outstanding on the term loan with proceeds from the sale of common stock as described in Note 10 below when it Amendment No. 2 to the original agreement governing the Credit Facility. This amendment also revised the revolving credit commitment to $27.8 million CAD ($20.0 million USD).
Future principal payments on long-term debt for each of the years ending December 31, are as follows:
| 2017 |
$ | 772 | ||
| 2018 |
23,894 | |||
| 2019 |
66,170 | |||
| 2020 |
— | |||
| Thereafter |
— | |||
|
|
|
|||
| $ | 90,836 | |||
|
|
|
Deferred loan costs are also included as part of debt and are amortized to interest expense using the effective interest method in accordance with ASC 470 Debt. Direct costs incurred in connection with the term loan have been capitalized and are amortized over the term of the debt using the effective interest method. Net fees attributable to the lender of approximately $1.7 million and $2.4 million are presented as a discount to the carrying value of the debt as of December 31, 2016 and 2015, respectively. Amortization expense of the deferred financing charges of approximately $740 and $945 are included in interest expense for the years ended December 31, 2016 and 2015, respectively.
The estimated fair value of total debt was approximately $92.8 million and $87.7 million as December 31, 2016 and 2015, respectively. The fair value was estimated using Level 2 inputs by calculating the sum of the discounted future interest and principal payments through the date of maturity.
9. Commitments and Contingencies
Litigation
In the ordinary course of business, the Company is involved in various pending or threatened legal actions, some of which may or may not be covered by insurance. Management has reviewed such pending judicial and legal proceedings, the reasonably anticipated costs and expenses in connection with such proceedings, and the availability and limits of insurance coverage, and has established reserves that are believed to be appropriate in light of those outcomes that are believed to be probable and can be estimated. The reserves accrued as of
F-19
Table of Contents
NCS Multistage Holdings, Inc.
Notes to Consolidated Financial Statements
For the Years Ended December 31, 2016 and 2015
(in thousands, except share and per share data)
December 31, 2016 and 2015 are immaterial. In the opinion of management, the Company’s ultimate liability, if any, with respect to these actions is not expected to have a material adverse effect on the Company’s financial position, results of operations or cash flows.
Operating Leases
The Company has entered into certain operating lease commitments for buildings and office equipment, which expire at various dates through April 2022. Total rental expense charged to consolidated statement of operations was approximately $2.1 million for each of the years ended December 31, 2016 and 2015.
Minimum rental payments under non-cancelable operating leases which have terms in excess of one year as of December 31, 2016, are as follows:
| 2017 |
$ | 1,499 | ||
| 2018 |
1,320 | |||
| 2019 |
848 | |||
| 2020 |
210 | |||
| 2021 |
182 | |||
| Thereafter |
31 | |||
|
|
|
|||
| Total payments |
$ | 4,090 | ||
|
|
|
Capital Leases
The Company has entered into various capital lease agreements which expire at various dates through 2019. Total capital lease amortization expense was $201 for each of the years ended December 31, 2016 and 2015. Future minimum lease payments under capital leases at December 31, 2016, together with the present value of the minimum lease payments, are as follows:
| 2017 |
$ | 246 | ||
| 2018 |
181 | |||
| 2019 |
14 | |||
| 2020 |
13 | |||
| 2021 |
— | |||
| Less: amount representing interest |
(53 | ) | ||
|
|
|
|||
| Present value of payments |
401 | |||
| Less: current portion |
(246 | ) | ||
|
|
|
|||
| Long-term payment obligations |
$ | 155 | ||
|
|
|
F-20
Table of Contents
NCS Multistage Holdings, Inc.
Notes to Consolidated Financial Statements
For the Years Ended December 31, 2016 and 2015
(in thousands, except share and per share data)
Property under capital leases included within property and equipment consisted of the following at December 31, 2016 and 2015:
| As of | ||||||||
| December 31, 2016 |
December 31, 2015 |
|||||||
| Vehicles |
$ | 1,025 | $ | 1,016 | ||||
|
|
|
|
|
|||||
| Gross assets under capital leases |
1,025 | 1,016 | ||||||
| Less: Accumulated Depreciation |
439 | 253 | ||||||
|
|
|
|
|
|||||
| Net assets under capital leases |
$ | 586 | $ | 763 | ||||
|
|
|
|
|
|||||
10. Stockholders’ Equity
The Company currently has common stock and preferred stock outstanding. In September 2016, the Company was authorized to increase the available shares of common stock for issuance from 45.0 million to 54.0 million shares with $.01 par value.
On December 22, 2015, the Company received approximately $40.0 million in aggregate proceeds in connection with the sale of 4,187,022 shares of common stock. As of December 31, 2016 and 2015, 34,005,978 and 34,013,691 shares of common stock were outstanding, respectively.
As of December 31, 2016, the Company was also authorized to issue 1 share of preferred stock with $0.01 par value, defined as the “Special Voting Share” in the amended and restated certificate of incorporation. As of December 31, 2016 and 2015, 1 share of preferred stock was issued and outstanding.
The holders of common stock are entitled to one vote for each share of common stock held. The holder of the Special Voting Share shall be entitled to vote on all matters that a holder of common stock is entitled to vote on and shall be entitled to cast a number of votes equal to the number of exchangeable shares of NCS Multistage, Inc. (NCS Canada), a subsidiary of the Company, then outstanding that are not owned by the Company, multiplied by the exchange ratio (as defined in the Company’s articles of incorporation). As of December 31, 2016 and 2015, exchangeable shares for common stock totaled 1,819,247 and are held by the preferred stockholder. The holders of common stock are entitled to receive dividends as declared from time-to-time by the Company’s Board of Directors and Dividend Committee. The holder of the Special Voting Share is not entitled to receive dividends. During the years ended December 31, 2016 and 2015, no dividends were declared.
Upon acquiring all of the outstanding interests in NCS Energy Holdings, LLC as of December 20, 2012, the remaining options outstanding, approximating 649,000, under the predecessor company immediately vested and remain exercisable as of December 31, 2016 and 2015.
11. Share-Based Compensation
2012 NCS Incentive Stock Plan
The Board of Directors of the Company adopted and approved the NCS 2012 Equity Incentive plan on December 20, 2012 as amended on February 6, 2015 and July 1, 2016 (the “NCS Plan”). The NCS Plan permits the grant of incentive stock options, stock appreciation rights, restricted stock, dividend equivalent or other stock based awards (referred to as “Options” or “Awards”) related to the Company’s common stock to officers,
F-21
Table of Contents
NCS Multistage Holdings, Inc.
Notes to Consolidated Financial Statements
For the Years Ended December 31, 2016 and 2015
(in thousands, except share and per share data)
directors, employees and consultants of the Company through December 31, 2016. The original aggregate number of shares of 2,426,121 that may be issued pursuant to awards made under the 2012 Plan was increased to 2,550,000 shares on July 1, 2016 by way of an amendment approved by the Board of Directors. As of December 31, 2016 and 2015, there were 86,499 and 16,875 shares available for future grants under the NCS Plan, respectively.
In conjunction with the stock options issued above to key employees, the Company also issued “Liquidity Awards” with weighted average grant date fair value of $6.89 and weighted average remaining contractual life of 6 years. These Liquidity Awards will become 100% vested on the effective date of a Company Sale (as defined below), subject to the grantee’s continued service through the consummation of the Company Sale. Company Sale is defined as (a) any transaction or series of related transactions in which any person or group of persons other than the Advent International Corporation or its affiliates shall (i) directly or indirectly, acquire, whether by purchase, exchange, tender offer, merger, consolidation, recapitalization or otherwise, or (ii) otherwise be the owner of (as a result of a redemption of shares or otherwise), shares or other equity in a successor entity (by merger, consolidation or otherwise) such that following such transaction or transactions, such person or group of persons and their respective affiliates beneficially own fifty percent (50%) or more of the voting power at elections for the board of directors of the Company or any successor entity, or (b) the sale, transfer or other disposition of all or substantially all of the Company’s assets, in one or a series of related transactions; provided, however, that in no event shall a Company Sale be deemed to include (x) any transaction effected for the purpose of (i) changing, directly or indirectly, the domicile or form of organization or the organizational structure of the Company or any of its subsidiaries or (ii) contributing assets or equity to entities controlled by the Company (or owned by the stockholders of the Company in substantially the same proportions as the stockholders own of the Company immediately prior to such contribution), or (y) an initial public offering or other primary issuance of shares. The grantee may exercise Liquidity Awards at any time after a Company Sale and prior to the earliest to occur of (i) the tenth anniversary of the grant date, (ii) the date that is 90 days following the grantee’s termination for any reason other than death, permanent disability or cause, (iii) the date that is twelve months following termination of grantee’s service due to death or permanent disability and (iv) the date of the grantee’s termination for cause. Accordingly, no value has been reflected in the consolidated financial statements for the Liquidity Awards as they will not vest until the occurrence of a change in control event. Total unamortized expense related to the Liquidity Awards at December 31, 2016 and 2015 amounted to approximately $10.1 million and $9.9 million, respectively.
Determining fair market value
Determining the appropriate fair value model and calculating the fair value of options requires the input of highly subjective assumptions, including the expected volatility of the price of our stock, the risk-free rate, the expected term of the options and the expected dividend yield of our common stock. These estimates involve inherent uncertainties and the application of management’s judgment. If factors change and different assumptions are used, our share-based compensation expense could be materially different in the future. The Company estimates the fair value of each option grant using the Black-Scholes option-pricing model. The Black-Scholes option pricing model requires estimates of key assumptions based on both historical information and management judgment regarding market factors and trends.
F-22
Table of Contents
NCS Multistage Holdings, Inc.
Notes to Consolidated Financial Statements
For the Years Ended December 31, 2016 and 2015
(in thousands, except share and per share data)
The weighted average assumptions used to estimate the fair value of stock options granted in 2016 and 2015 are as follows:
| 2016 | 2015 | |||
| Volatility |
42% - 45% | 43% | ||
| Risk free interest rate |
1.69% | 2.29% | ||
| Expected term (in years) |
6.5 | 6.5 | ||
| Dividend yield |
0% | 0% |
The follow table summarizes transactions involving outstanding Awards under the NCS Plan:
| 2012 NCS Plan |
Time Based Shares |
Liquidity Shares |
Total Shares |
Time Based Weighted Average Exercise Price |
Liquid Based Weighted Average Exercise Price |
Time Based Weighted Average Remaining Contractual Life (Years) |
Liquidity Weighted Average Remaining Contractual Life (Years) |
|||||||||||||||||||||
| Outstanding at December 31, 2014 |
959,259 | 1,427,637 | 2,386,896 | $ | 6.18 | $ | 6.27 | 8.05 | 9.00 | |||||||||||||||||||
| Granted during the year |
21,894 | 20,406 | 42,300 | 7.35 | 11.82 | |||||||||||||||||||||||
| Exercised during the year |
— | — | — | — | — | |||||||||||||||||||||||
| Forfeited during the year |
(7,980 | ) | (11,970 | ) | (19,950 | ) | 5.88 | 5.88 | ||||||||||||||||||||
|
|
|
|
|
|
|
|
|
|
|
|
|
|
|
|||||||||||||||
| Outstanding at December 31, 2015 |
973,173 | 1,436,073 | 2,409,246 | $ | 6.13 | $ | 6.35 | 7.05 | 7.03 | |||||||||||||||||||
| Granted during the year |
24,348 | 46,533 | 70,881 | 9.55 | 9.58 | |||||||||||||||||||||||
| Exercised during the year |
— | — | — | — | ||||||||||||||||||||||||
| Forfeited during the year |
(6,651 | ) | (9,975 | ) | (16,626 | ) | 5.88 | 5.88 | ||||||||||||||||||||
|
|
|
|
|
|
|
|
|
|
|
|
|
|
|
|||||||||||||||
| Outstanding at December 31, 2016 |
990,870 | 1,472,631 | 2,463,501 | $ | 6.01 | $ | 6.19 | 6.19 | 6.19 | |||||||||||||||||||
|
|
|
|
|
|
|
|
|
|
|
|
|
|
|
|||||||||||||||
| Unvested as of December 31, 2016 |
251,610 | 1,472,631 | 1,724,241 | $ | 6.57 | $ | 6.19 | |||||||||||||||||||||
|
|
|
|
|
|
|
|
|
|
|
|
|
|
|
|||||||||||||||
| Exercisable as at December 31, 2016 |
739,260 | — | 739,260 | $ | 5.82 | N/A | 6.19 | N/A | ||||||||||||||||||||
|
|
|
|
|
|
|
|
|
|
|
|
|
|
|
|||||||||||||||
As of December 31, 2016 and 2015, there was approximately $1.6 million and $2.8 million in unrecognized compensation expense related to the non-vested portion of the time vested options granted, respectively. The cost of those options is expected to be recognized over a period of five years from the date of grant.
Share based compensation expense of approximately $1.4 million and $1.3 million was recognized in selling, general and administrative expense in the Company’s consolidated statements of operations for the years ended December 31, 2016 and 2015, respectively.
12. Employee Benefit Plan
The employees of the Company are eligible to participate in a 401(k) plan sponsored by the Company. All eligible employees may contribute a percent of their compensation subject to a maximum imposed by the Internal Revenue Code. All Company contributions are discretionary. During the period January 1, 2015 through April 30, 2015, the Company matched 6% of gross pay contributed by each employee until the program was suspended on April 30, 2015. The matching program was reinitiated on January 1, 2016 by the Company and matched approximately 4% of gross pay for the remainder of 2016. The Company’s contribution was approximately $563 and $575 for the years ended December 31, 2016 and 2015, respectively.
F-23
Table of Contents
NCS Multistage Holdings, Inc.
Notes to Consolidated Financial Statements
For the Years Ended December 31, 2016 and 2015
(in thousands, except share and per share data)
13. Income Taxes
The provision (benefit) from income taxes consists of the following for the years ended December 31, 2016 and 2015:
| December 31, 2016 |
December 31, 2015 |
|||||||
| Current tax expense (benefit) |
||||||||
| U.S. Federal |
$ | (505 | ) | $ | (9,047 | ) | ||
| State |
(145 | ) | 189 | |||||
| Foreign |
1,098 | 3,934 | ||||||
|
|
|
|
|
|||||
| Total current |
448 | (4,924 | ) | |||||
|
|
|
|
|
|||||
| Deferred tax expense (benefit) |
||||||||
| U.S. Federal |
(4,190 | ) | (7,608 | ) | ||||
| State |
(133 | ) | 253 | |||||
| Foreign |
(4,943 | ) | (3,945 | ) | ||||
|
|
|
|
|
|||||
| Total deferred |
(9,266 | ) | (11,300 | ) | ||||
|
|
|
|
|
|||||
| Total income taxes |
$ | (8,818 | ) | $ | (16,224 | ) | ||
|
|
|
|
|
|||||
The following is the domestic and foreign components of the Company’s (loss) income before income taxes for the years ended December 31, 2016 and 2015:
| December 31, 2016 |
December 31, 2015 |
|||||||
| U.S. Federal |
$ | (15,221 | ) | $ | 18,047 | |||
| Foreign |
(11,524 | ) | (6,246 | ) | ||||
|
|
|
|
|
|||||
| (Loss) Income before income taxes |
$ | (26,745 | ) | $ | 11,801 | |||
|
|
|
|
|
|||||
The following is a summary of the items that caused recorded income taxes to differ from income taxes computed using the statutory federal income tax rate for the years ended December 31, 2016 and 2015:
| December 31, 2016 |
December 31, 2015 |
|||||||
| Income tax expense at federal statutory rate |
35.0 | % | 35.0 | % | ||||
| Increase (Decrease) in income taxes resulting from |
||||||||
| Effect of foreign deemed and unremitted earnings |
(3.6 | )% | 20.2 | % | ||||
| Change in tax year for subsidiary |
0.0 | % | (105.9 | )% | ||||
| Outside basis adjustment on foreign subsidiary |
1.8 | % | (99.6 | )% | ||||
| Effect of rate change on deferred tax |
0.0 | % | 16.2 | % | ||||
| Different rate on earnings of foreign operations |
(3.6 | )% | 4.3 | % | ||||
| Research credits |
3.0 | % | (6.3 | )% | ||||
| Manufacturing deduction |
0.3 | % | (7.6 | )% | ||||
| Non deductible expenses |
(1.2 | )% | 3.1 | % | ||||
| State taxes |
0.8 | % | 3.1 | % | ||||
| Other |
0.5 | % | 0.0 | % | ||||
|
|
|
|
|
|||||
| Income tax |
33.0 | % | (137.5 | )% | ||||
|
|
|
|
|
|||||
F-24
Table of Contents
NCS Multistage Holdings, Inc.
Notes to Consolidated Financial Statements
For the Years Ended December 31, 2016 and 2015
(in thousands, except share and per share data)
The Company recorded a tax (benefit) of $(8.8) million and $(16.2) million for the years ended December 31, 2016 and 2015, respectively. For the years ended December 31, 2016 and 2015, the company’s effective tax rate was approximately 33.0% and (137.5%). The negative effective tax rate in 2015 was primarily due to a tax planning strategy and the effect of our outside basis book value and tax differences in our Canadian subsidiary. The tax planning strategy resulted in the company receiving permission from a foreign tax authority to change the year end to conform to U.S. income tax reporting.
The tax effects of temporary differences that give rise to significant portions of deferred tax assets and deferred tax liabilities as of December 31, 2016 and 2015 are as follows:
| For the years ended | ||||||||
| December 31, 2016 |
December 31, 2015 |
|||||||
| Deferred tax assets |
||||||||
| Accruals not currently deductible |
$ | 2,829 | $ | 1,531 | ||||
| Tax credit carryforwards |
872 | 356 | ||||||
| Other |
1,221 | 1,896 | ||||||
|
|
|
|
|
|||||
| 4,922 | 3,783 | |||||||
| Valuation allowance for deferred tax assets |
(63 | ) | (63 | ) | ||||
|
|
|
|
|
|||||
| Total deferred tax assets |
4,859 | 3,720 | ||||||
|
|
|
|
|
|||||
| Deferred tax liabilities |
||||||||
| Depreciation and amortization |
(33,913 | ) | (39,889 | ) | ||||
| Foreign currency translation |
(6,843 | ) | (7,802 | ) | ||||
| Foreign unremitted earnings |
(3,869 | ) | (4,356 | ) | ||||
| Other |
(813 | ) | (511 | ) | ||||
|
|
|
|
|
|||||
| Total deferred tax liabilities |
(45,438 | ) | (52,558 | ) | ||||
|
|
|
|
|
|||||
| Net deferred tax liabilities |
$ | (40,579 | ) | $ | (48,838 | ) | ||
|
|
|
|
|
|||||
The above are included in the accompanying consolidated balance sheet as follows:
| December 31, 2016 |
December 31, 2015 |
|||||||
| Deferred income tax assets—current |
$ | 2,116 | $ | 1,594 | ||||
| Deferred income tax liabilities—noncurrent |
(42,695 | ) | (50,432 | ) | ||||
|
|
|
|
|
|||||
| $ | (40,579 | ) | $ | (48,838 | ) | |||
|
|
|
|
|
|||||
F-25
Table of Contents
NCS Multistage Holdings, Inc.
Notes to Consolidated Financial Statements
For the Years Ended December 31, 2016 and 2015
(in thousands, except share and per share data)
14. Earnings Per Share
The following table presents the reconciliation of the numerator and denominator for calculating
earnings per share from net (loss) income:
| For the years ended | ||||||||
| December 31, 2016 |
December 31, 2015 |
|||||||
| Basic EPS: |
||||||||
| Net (loss) income |
$ | (17,927 | ) | $ | 28,025 | |||
| Less income attributable to participating shares |
— | 1,604 | ||||||
|
|
|
|
|
|||||
| Net income attributable to participating shares |
$ | (17,927 | ) | $ | 26,421 | |||
|
|
|
|
|
|||||
| Basic weighted average number of shares* |
34,007,505 | 29,965,946 | ||||||
| Basic net (loss) income per common share |
$ | (0.53 | ) | $ | 0.88 | |||
| Diluted EPS: |
||||||||
| Net (loss) income |
$ | (17,927 | ) | $ | 28,025 | |||
| Less income attributable to participating shares |
— | — | ||||||
|
|
|
|
|
|||||
| Net income attributable to participating shares |
$ | (17,927 | ) | $ | 28,025 | |||
|
|
|
|
|
|||||
| Diluted weighted average number of shares* |
34,007,505 | 32,432,919 | ||||||
| Diluted net (loss) income per common share |
$ | (0.53 | ) | $ | 0.86 | |||
| * | Previously reported shares have been adjusted to correct immaterial amounts. |
15. Related Party Transactions
As of December 31, 2016 and December 31, 2015, the Company held a long-term note receivable in the amount of approximately $750 due from a related party. The terms of the agreement call for a maturity date of December 31, 2020 with interest due at a rate of 1.67% compounded semi-annually beginning on January 1, 2016. We purchased services and grease in the amount of approximately $49 and $59 from a related party in the years ended December 31, 2016 and 2015.
16. Segment and Geographic Information
The Company has determined that it operates in one reportable segment that has been identified based on how the Company’s chief operating decision maker manages the Company’s business (see Note 1).
F-26
Table of Contents
NCS Multistage Holdings, Inc.
Notes to Consolidated Financial Statements
For the Years Ended December 31, 2016 and 2015
(in thousands, except share and per share data)
Revenue by country for 2016 and 2015 is attributed based on the current billing address of the customer. The following table summarizes revenue by geographic area:
| For The Years Ended | ||||||||
| December 31, 2016 |
December 31, 2015 |
|||||||
| United States |
||||||||
| Product sales |
$ | 17,595 | $ | 24,857 | ||||
| Services |
4,747 | 8,645 | ||||||
|
|
|
|
|
|||||
| Total United States |
22,342 | 33,502 | ||||||
| Canada |
||||||||
| Product sales |
53,088 | 53,108 | ||||||
| Services |
16,994 | 21,801 | ||||||
|
|
|
|
|
|||||
| Total Canada |
70,082 | 74,909 | ||||||
| Other Countries |
||||||||
| Product sales |
2,537 | 2,114 | ||||||
| Services |
3,518 | 3,480 | ||||||
|
|
|
|
|
|||||
| Total Other Countries |
6,055 | 5,594 | ||||||
| Total |
||||||||
| Product sales |
73,220 | 80,079 | ||||||
| Services |
25,259 | 33,926 | ||||||
|
|
|
|
|
|||||
| Total |
$ | 98,479 | $ | 114,005 | ||||
|
|
|
|
|
|||||
The following table summarizes long-lived assets by geographic area:
| December 31, 2016 |
December 31, 2015 |
|||||||
| United States |
$ | 2,819 | $ | 3,614 | ||||
| Canada |
6,940 | 6,970 | ||||||
|
|
|
|
|
|||||
| $ | 9,759 | $ | 10,584 | |||||
|
|
|
|
|
|||||
17. Subsequent Events
On February 1, 2017, the Company acquired a 50% interest in Repeat Precision LLC for $5.4 million. Concurrent with entering into the transaction, the previous owner of the 50% interest repaid a $1.0 million promissory note to the Company. Additional disclosure around the Joint Venture have not been presented as the accounting of the business combination has not been finalized.
In addition, to ensure compliance with non-financial covenants per the senior secured credit facility a $3.0 million prepayment was made.
On March 3, 2017, the Company received $0.9 million resulting from an arbitration case that was decided in the Company’s favor in February 2017. This will be recorded as other income in the Company’s financial statements for the quarter ended March 31, 2017.
On April 13, 2017, the Company’s board of directors and stockholders approved an amendment to the amended and restated certificate of incorporation effecting a 3.00 for 1.00 stock split of the Company’s issued and outstanding shares of common stock. The stock split was implemented on April 13, 2017. The par value of the common and preferred stock was not adjusted as a result of the stock split. All issued and outstanding share and per share amounts included in the accompanying financial statements have been adjusted to reflect this stock split for all periods presented.
F-27
Table of Contents
Schedule I-Condensed Financial Information of Registrant
NCS Multistage Holdings, Inc. (Parent Company Only)
(in thousands, except share data)
| December 31, 2016 |
December 31, 2015 |
|||||||
| Assets |
||||||||
| Current Assets |
||||||||
| Cash and cash equivalents |
$ | 131 | $ | 36 | ||||
| Accounts Receivable |
4 | — | ||||||
|
|
|
|
|
|||||
| Total Current Assets |
135 | 36 | ||||||
| Noncurrent assets |
||||||||
| Investment in subsidiaries |
169,889 | 181,074 | ||||||
| Loans to subsidiary companies |
6,723 | 5,623 | ||||||
| Long term note receivable |
751 | 755 | ||||||
|
|
|
|
|
|||||
| Total Non-Current Assets |
177,363 | 187,452 | ||||||
|
|
|
|
|
|||||
| Total Assets |
$ | 177,498 | $ | 187,488 | ||||
|
|
|
|
|
|||||
| Liabilities and Stockholders’ Equity |
||||||||
| Current Liabilities |
||||||||
| Accrued expenses |
$ | 20 | $ | 19 | ||||
|
|
|
|
|
|||||
| Total Other Current Liabilities |
20 | 19 | ||||||
|
|
|
|
|
|||||
| Total Liabilities |
20 | 19 | ||||||
|
|
|
|
|
|||||
| Stockholders’ Equity |
||||||||
| Preferred stock, $.01 par value, 1 share authorized issued, and outstanding as of December 31, 2016 and 2015, respectively. |
— | — | ||||||
| Common stock, $.01 par value, 54,000,000 shares authorized, 34,024,326 shares issued and 34,005,978 shares outstanding at December 31, 2016 and 45,000,000 shares authorized and 34,013,691 shares issued and outstanding at December 31, 2015. |
340 | 340 | ||||||
| Additional paid-in capital |
237,566 | 236,110 | ||||||
| Accumulated other comprehensive loss |
(82,015 | ) | (88,670 | ) | ||||
| Retained earnings |
21,762 | 39,689 | ||||||
| Treasury Stock |
(175 | ) | — | |||||
|
|
|
|
|
|||||
| Total Stockholders’ Equity |
177,478 | 187,469 | ||||||
|
|
|
|
|
|||||
| Total Liabilities & Stockholders’ Equity |
$ | 177,498 | $ | 187,488 | ||||
|
|
|
|
|
|||||
The accompanying notes are an integral part of these consolidated financial statements.
F-28
Table of Contents
Schedule I-Condensed Financial Information of Registrant
NCS Multistage Holdings, Inc. (Parent Company Only)
Condensed Statements Of Operations
(in thousands)
| Year Ended December 31, 2016 |
Year Ended December 31, 2015 |
|||||||
| Equity in net income of subsidiaries |
$ | (17,840 | ) | $ | 28,122 | |||
| Other expense (loss) |
(87 | ) | (97 | ) | ||||
|
|
|
|
|
|||||
| Net income (loss) |
$ | (17,927 | ) | $ | 28,025 | |||
|
|
|
|
|
|||||
The accompanying notes are an integral part of these consolidated financial statements.
F-29
Table of Contents
Schedule I-Condensed Financial Information of Registrant
NCS Multistage Holdings, Inc. (Parent Company Only)
Condensed Statements of Consolidated Comprehensive Loss
(in thousands)
| Year Ended December 31 2016 |
Year Ended December 31 2015 |
|||||||
| Net Income (loss) |
$ | (17,927 | ) | $ | 28,025 | |||
| Foreign currency translation adjustments |
6,655 | (43,280 | ) | |||||
|
|
|
|
|
|||||
| Comprehensive (loss) |
$ | (11,272 | ) | $ | (15,255 | ) | ||
|
|
|
|
|
|||||
The accompanying notes are an integral part of these consolidated financial statements.
F-30
Table of Contents
Schedule I-Condensed Financial Information of Registrant
NCS Multistage Holdings, Inc. (Parent Company Only)
Condensed Statements of Cash Flows
(in thousands except share data)
| For The Years Ended | ||||||||
| December 31, 2016 |
December 31, 2015 |
|||||||
| Cash flows from operating activities |
||||||||
| Net (loss) income |
$ | (17,927 | ) | $ | 28,025 | |||
| Adjustments to reconcile net loss to net cash provided by (used) in |
||||||||
| Equity in net income of subsidiaries |
17,840 | (28,122 | ) | |||||
| Accrued expenses |
80 | 97 | ||||||
|
|
|
|
|
|||||
| Net cash used in operating activities |
(7 | ) | (0 | ) | ||||
|
|
|
|
|
|||||
| Cash flows from investing activities |
||||||||
| Investment in Subsidiaries |
(40,000 | ) | ||||||
| Issuance of note receivable—related party |
— | (755 | ) | |||||
|
|
|
|
|
|||||
| Net cash used in investing activities |
— | (40,755 | ) | |||||
|
|
|
|
|
|||||
| Cash flows from financing activities |
||||||||
| Contributions from shareholders |
102 | 39,999 | ||||||
|
|
|
|
|
|||||
| Net cash provided by financing activities |
102 | 39,999 | ||||||
|
|
|
|
|
|||||
| Net change in cash and cash equivalents |
95 | (756 | ) | |||||
| Cash and cash equivalents |
||||||||
| Beginning of year |
36 | 792 | ||||||
|
|
|
|
|
|||||
| End of year |
$ | 131 | $ | 36 | ||||
|
|
|
|
|
|||||
The accompanying notes are an integral part of these consolidated financial statements.
F-31
Table of Contents
Schedule I-Condensed Financial Information of Registrant
NCS Multistage Holdings, Inc. (Parent Company Only)
Notes to Condensed Financial Statements
(in thousands, except share and per share data)
Note 1. Background and basis of presentation
NCS Multistage Holdings, Inc. (the “Parent Company”) is a holding company that conducts substantially all of its business operations through its subsidiaries. The ability of the Parent Company’s subsidiaries to pay dividends is currently restricted by the terms of its credit agreement with a group of financial institutions. Substantially all of the net assets of the Parent Company’s consolidary subsidiaries are restricted.
The accompanying condensed financial information includes the accounts of the Parent Company and, on an equity method basis, its investment in subsidiaries. Accordingly, these condensed financial statements have been presented on a “parent only” basis. These parent only financial statements should be read in conjunction with NCS Multistage Holdings, Inc. audited consolidated financial statements and related notes thereto included elsewhere herein.
The condensed parent-only financial statements have been prepared in accordance with Rule 12-04, Schedule I of Regulation S-X as the restricted net assets of the subsidiaries of the Parent Company exceeds 25% of the consolidated net assets of the Parent Company. The ability of the Parent Company’s operating subsidiaries to pay dividends may be restricted due to terms of the subsidiaries financing arrangements (see Note 8 to the consolidated financial statements).
Note 2. Related Party Transactions
As of December 31, 2016 and December 31, 2015, the Company held a long-term note receivable in the amount of approximately $750 due from a related party. The terms of the agreement call for a maturity date of December 31, 2020 with interest due at a rate of 1.67% compounded semi-annually beginning on January 1, 2016. We purchased services and grease in the amount of approximately $49 and $59 from a related party in the years ended December 31, 2016 and 2015, respectively.
As of December 31, 2016, the Parent Company has total subsidiary loans between the subsidiaries and the Parent Company in the amount of approximately $6.7 million.
Note 3. Commitments and Contingencies
For discussion of the commitments and contingencies of the subsidiaries of the Parent Company see Note 9 to the consolidated financial statements.
F-32
Table of Contents
Table of Contents
PART II—INFORMATION NOT REQUIRED IN PROSPECTUS
Item 13. Other Expenses of Issuance and Distribution.
The following table sets forth all costs and expenses, other than the underwriting discount, paid or payable by us in connection with the sale of the common stock being registered. All amounts shown are estimates except for the SEC registration fee, the FINRA filing fee and the listing fee for NASDAQ.
| Amount Paid or to be Paid |
||||
| SEC registration fee |
$ | 22,792 | ||
| FINRA filing fee |
15,500 | |||
| NASDAQ listing fee |
150,000 | |||
| Blue sky qualification fees and expenses |
— | |||
| Printing and engraving expenses |
575,000 | |||
| Legal fees and expenses |
1,500,000 | |||
| Accounting fees and expenses |
200,000 | |||
| Transfer agent and registrar fees and expenses |
5,000 | |||
| Miscellaneous expenses |
50,000 | |||
|
|
|
|||
| Total |
$ | 2,533,292 | ||
|
|
|
|||
Item 14. Indemnification of Officers and Directors.
The Registrant is governed by the Delaware General Corporation Law, or DGCL. Section 145 of the DGCL provides that a corporation may indemnify any person, including an officer or director, who was or is, or is threatened to be made, a party to any threatened, pending or completed legal action, suit or proceeding, whether civil, criminal, administrative or investigative (other than an action by or in the right of such corporation), by reason of the fact that such person was or is an officer, director, employee or agent of such corporation or is or was serving at the request of such corporation as a director, officer, employee or agent of another corporation or enterprise. The indemnity may include expenses (including attorneys’ fees), judgments, fines and amounts paid in settlement actually and reasonably incurred by such person in connection with such action, suit or proceeding, provided such officer, director, employee or agent acted in good faith and in a manner such person reasonably believed to be in, or not opposed to, the corporation’s best interest and, for criminal proceedings, had no reasonable cause to believe that such person’s conduct was unlawful. A Delaware corporation may indemnify any person, including an officer or director, who was or is, or is threatened to be made, a party to any threatened, pending or contemplated action or suit by or in the right of such corporation, under the same conditions, except that such indemnification is limited to expenses (including attorneys’ fees) actually and reasonably incurred by such person, and except that no indemnification is permitted without judicial approval if such person is adjudged to be liable to such corporation. Where an officer or director of a corporation is successful, on the merits or otherwise, in the defense of any action, suit or proceeding referred to above, or any claim, issue or matter therein, the corporation must indemnify that person against the expenses (including attorneys’ fees) which such officer or director actually and reasonably incurred in connection therewith.
The Registrant’s amended and restated bylaws will authorize the indemnification of its officers and directors, consistent with Section 145 of the DGCL, as amended. The Registrant intends to enter into indemnification agreements with each of its directors. These agreements, among other things, will require the Registrant to indemnify each director to the fullest extent permitted by Delaware law, including indemnification of expenses such as attorneys’ fees, judgments, fines and settlement amounts incurred by the director in any action or proceeding, including any action or proceeding by or in right of the Registrant, arising out of the person’s services as a director.
II-1
Table of Contents
Reference is made to Section 102(b)(7) of the DGCL, which enables a corporation in its original certificate of incorporation or an amendment thereto to eliminate or limit the personal liability of a director for violations of the director’s fiduciary duty, except (i) for any breach of the director’s duty of loyalty to the corporation or its stockholders, (ii) for acts or omissions not in good faith or which involve intentional misconduct or a knowing violation of law, (iii) pursuant to Section 174 of the DGCL, which provides for liability of directors for unlawful payments of dividends of unlawful stock purchase or redemptions or (iv) for any transaction from which a director derived an improper personal benefit.
The Registrant expects to maintain standard policies of insurance that provide coverage (i) to its directors and officers against loss rising from claims made by reason of breach of duty or other wrongful act and (ii) to the Registrant with respect to indemnification payments that it may make to such directors and officers.
The proposed form of Underwriting Agreement to be filed as Exhibit 1.1 to this Registration Statement provides for indemnification to the Registrant’s directors and officers by the underwriters against certain liabilities.
Item 15. Recent Sales of Unregistered Securities
The following sets forth information regarding all unregistered securities sold by the Registrant in transactions that were exempt from the requirements of the Securities Act in the last three years:
| • | In April 2014, the Registrant issued 5,931 shares of common stock at a purchase price of $22.76 per share and granted options to purchase an aggregate of 30,000 shares of common stock at an initial strike price of $22.76 per share, which was subsequently adjusted to $18.11 per share, to John Ravensbergen. |
| • | In July 2014, the Registrant granted options to purchase an aggregate of 39,000 shares of common stock at an initial strike price of $22.76 per share, which was subsequently adjusted to $18.11 per share, to Ryan Hummer. |
| • | In October 2014, the Registrant issued 27,606 shares of common stock at a purchase price of $18.11 to Ryan Hummer. |
| • | In May 2015, the Registrant granted options to purchase 18,612 and 15,399 shares of common stock at a strike price of $11.82 per share, to Roger Dwyer and an employee, respectively. |
| • | In December 2015, the Registrant granted options to purchase an aggregate of 8,289 shares of common stock at a strike price of $0.003 per share, to certain employees. |
| • | In December 2015, in connection with the Registrant entering into the Subscription Agreement with the Advent Funds, the Registrant issued to Advent and certain stockholders and members of management of the Registrant consisting of Robert Nipper, Tim Willems, Wade Bitter, John Ravensbergen, Dustin Ellis Ryan Hummer and Mike McKown, an aggregate of 4,179,174 shares of common stock at a purchase price of $9.55 per share. |
| • | In January 2016, the Registrant issued 5,235 shares of common stock at a purchase price of $9.55 per share, to a former employee. |
| • | In April 2016, the Registrant granted options to purchase 6,150, 4,500 and 18,843 shares of common stock at a strike price of $9.55 per share, to Don Battenfelder, Shawn Leggett and a certain employee. |
| • | In July 2016, the Registrant issued 5,400 shares of common stock at a purchase price of $9.55 per share and granted options to purchase an aggregate of 23,553 shares of common stock at a strike price of $9.55 per share, to Kevin Trautner. |
| • | In August 2016, the Registrant granted options to purchase an aggregate of 17,835 shares of common stock at a strike price of 9.81 per share, to Richard Finney. |
II-2
Table of Contents
The shares of common stock in all of the transactions listed above were issued or will be issued in reliance upon Section 4(2) of the Securities Act or Rule 701 promulgated under Section 3(b) of the Securities Act as the sale of such securities did not or will not involve a public offering. The recipients of the securities in each of these transactions represented their intentions to acquire the securities for investment only and not with a view to or for sale in connection with any distribution thereof, and appropriate legends were placed upon the stock certificates issued in these transactions. All recipients had adequate access, through their relationships with the Registrant, to information about the Registrant.
Item 16. Exhibits and Financial Statement Schedules
(a) Exhibits:
| Exhibit No. |
Description | |
| 1.1** | Form of Underwriting Agreement. | |
| 3.1** | Amended and Restated Certificate of Incorporation of NCS Multistage Holdings, Inc. | |
| 3.2** | Certificate of Amendment to Amended and Restated Certificate of Incorporation of NCS Multistage Holdings, Inc. | |
| 3.3** | Bylaws of NCS Multistage Holdings, Inc. | |
| 3.4** | Form of Amended and Restated Certificate of Incorporation of NCS Multistage Holdings, Inc. to be in effect prior to the consummation of the offering made under this Registration Statement. | |
| 3.5** | Form of Amended and Restated Bylaws of NCS Multistage Holdings, Inc. to be in effect prior to the consummation of the offering made under this Registration Statement. | |
| 4.1** | Form of Registration Rights Agreement. | |
| 5.1** | Opinion of Weil, Gotshal & Manges, LLP. | |
| 10.1** | Form of NCS Multistage Holdings, Inc. 2017 Equity Incentive Plan (“2017 Equity Incentive Plan”). | |
| 10.2** | Subscription Agreement, dated as of December 22, 2015, by and between NCS Multistage Holdings, Inc. (formerly known as Pioneer Super Holdings, Inc.) and Advent-NCS Acquisition Limited Partnership. | |
| 10.3** | Amended and Restated Employment Agreement between NCS Multistage Holdings, Inc. and Robert Nipper, dated as of February 1, 2017. | |
| 10.4** | Amended and Restated Employment Agreement between NCS Multistage Holdings, Inc. and Tim Willems, dated as of February 1, 2017. | |
| 10.5** | Amended and Restated Employment Agreement between NCS Multistage Holdings, Inc. and Wade Bitter, dated as of February 1, 2017. | |
| 10.6** | Form of Director Indemnification Agreement. | |
| 10.7** | Credit Agreement, dated as of August 7, 2014 (the “Credit Agreement”), by and between Pioneer Intermediate, Inc., as parent, Pioneer Investment, Inc., as borrower, Wells Fargo Bank, National Association, as administrative agent, swingline lender and an issuing lender, HSBC Bank Canada, as an issuing lender, and the lenders named therein. | |
| 10.8** | Agreement and Amendment No. 1 to the Credit Agreement. | |
| 10.9** | Amendment No. 2 to the Credit Agreement. | |
| 10.10** | Form of Director Restricted Stock Unit Award Agreement under the 2017 Equity Incentive Plan. | |
| 10.11** | Form of 2012 Equity Incentive Plan (“2012 Equity Incentive Plan”) of NCS Multistage Holdings, Inc. (formerly known as Pioneer Super Holdings, Inc.). | |
| 10.12** | Form of Stock Option Award Agreement under the 2012 Equity Incentive Plan. | |
| 10.13** | Form of Stock Option Award Agreement under the 2017 Equity Incentive Plan for executive officers. | |
| 10.14** | Form of Stock Option Award Agreement under the 2017 Equity Incentive Plan for non-executive employees. | |
II-3
Table of Contents
| Exhibit No. |
Description | |
| 10.15** | Exchange Agreement, dated as of December 20, 2012, by and between NCS Energy Holdings, LLC, NCS Multistage Inc. (formerly known as NCS Oilfield Service Canada, Inc.), Cemblend Systems Inc. and NCS Multistage Holdings, Inc. (formerly known as Pioneer Super Holdings, Inc.). | |
| 10.16** | Call Rights Agreement, dated as of December 20, 2012, by and between NCS Energy Holdings, LLC, NCS Multistage Inc. (formerly known as NCS Oilfield Service Canada, Inc.), Cemblend Systems Inc. and NCS Multistage Holdings, Inc. (formerly known as Pioneer Super Holdings, Inc.). | |
| 21.1** | List of subsidiaries. | |
| 23.1 | Consent of PricewaterhouseCoopers LLP. | |
| 23.2** | Consent of Weil, Gotshal & Manges, LLP (included in Exhibit 5.1). | |
| 24.1** | Power of Attorney (included on signature page). | |
| ** | Previously filed. |
(b) Financial Statement Schedules
Schedule I—Condensed Financial Information of NCS Multistage Holdings, Inc.
Item 17. Undertakings
The undersigned registrant hereby undertakes to provide to the underwriters at the closing specified in the underwriting agreements, certificates in such denominations and registered in such names as required by the underwriters to permit prompt delivery to each purchaser.
Insofar as indemnification for liabilities arising under the Securities Act of 1933 may be permitted to directors, officers and controlling persons of the registrant pursuant to the foregoing provisions, or otherwise, the registrant has been advised that in the opinion of the SEC such indemnification is against public policy as expressed in the Securities Act and is, therefore, unenforceable. In the event that a claim for indemnification against such liabilities (other than the payment by the registrant of expenses incurred or paid by a director, officer, or controlling person of the registrant in the successful defense of any action, suit or proceeding) is asserted by such director, officer or controlling person in connection with the securities being registered, the registrant will, unless in the opinion of its counsel the matter has been settled by controlling precedent, submit to a court of appropriate jurisdiction the question of whether such indemnification by it is against public policy as expressed in the Act and will be governed by the final adjudication of such issue.
The undersigned registrant hereby undertakes that:
| (1) | For purposes of determining any liability under the Securities Act, the information omitted from the form of prospectus filed as part of this registration statement in reliance upon Rule 430A and contained in a form of prospectus filed by the registrant pursuant to Rule 424(b)(1) or (4) or 497(h) under the Securities Act shall be deemed to be part of this registration statement as of the time it was declared effective. |
| (2) | For the purpose of determining any liability under the Securities Act, each post-effective amendment that contains a form of prospectus shall be deemed to be a new registration statement relating to the securities offered therein, and the offering of such securities at that time shall be deemed to be the initial bona fide offering thereof. |
| (3) | For the purposes of determining liability under the Securities Act to any purchaser in the initial distribution of the securities, the undersigned registrant undertakes that in a primary offering of securities of the undersigned registrant pursuant to this registration statement, regardless of the underwriting method used to sell the securities to the purchaser, if the securities are offered or sold to such purchaser by means of any of the following communications, the undersigned registrant will be a seller to the purchaser and will be considered to offer or sell such securities to such purchaser. |
II-4
Table of Contents
| (a) | Any preliminary prospectus or prospectus of the undersigned registrant relating to the offering required to be filed pursuant to Rule 424; |
| (b) | Any free writing prospectus relating to the offering prepared by or on behalf of the undersigned registrant or used or referred to by the undersigned registrant; |
| (c) | The portion of any other free writing prospectus relating to the offering containing material information about the undersigned registrant or its securities provided by or on behalf of the undersigned registrant; and |
| (d) | Any other communication that is an offer in the offering made by the undersigned registrant to be purchaser. |
II-5
Table of Contents
SIGNATURES
Pursuant to the requirements of the Securities Act of 1933, the registrant has duly caused this registration statement to be signed on its behalf by the undersigned, thereunto duly authorized in the City of Houston, State of Texas, on April 26, 2017.
| NCS Multistage Holdings, Inc. | ||
| By: |
/s/ Robert Nipper | |
| Name: |
Robert Nipper | |
| Title: |
Chief Executive Officer and Director | |
Pursuant to the requirements of the Securities Act of 1933, this registration statement has been signed by the following persons in the capacities indicated on April 26, 2017.
| Signature |
Title | |
| /s/ Robert Nipper Robert Nipper |
Chief Executive Officer and Director (Principal Executive Officer) | |
| * Marty Stromquist |
President and Director | |
| /s/ Ryan Hummer Ryan Hummer |
Chief Financial Officer (Principal Financial Officer) | |
| /s/ Wade Bitter Wade Bitter |
Chief Accounting Officer and Treasurer (Principal Accounting Officer) | |
| * Michael McShane |
Chairman | |
| * John Deane |
Director | |
| * Matthew Fitzgerald |
Director | |
| * Gurinder Grewal |
Director | |
| * David McKenna |
Director | |
| * Franklin Myers |
Director | |
| /s/ W. Matt Ralls W. Matt Ralls |
Director | |
| *By: |
/s/ Ryan Hummer | |
| Ryan Hummer Attorney-in-Fact | ||
II-6
Table of Contents
EXHIBIT INDEX
| Exhibit No. |
Description | |
| 1.1** | Form of Underwriting Agreement. | |
| 3.1** | Amended and Restated Certificate of Incorporation of NCS Multistage Holdings, Inc. | |
| 3.2** | Certificate of Amendment to Amended and Restated Certificate of Incorporation of NCS Multistage Holdings, Inc. | |
| 3.3** | Bylaws of NCS Multistage Holdings, Inc. | |
| 3.4** | Form of Amended and Restated Certificate of Incorporation of NCS Multistage Holdings, Inc. to be in effect prior to the consummation of the offering made under this Registration Statement. | |
| 3.5** | Form of Amended and Restated Bylaws of NCS Multistage Holdings, Inc. to be in effect prior to the consummation of the offering made under this Registration Statement. | |
| 4.1** | Form of Registration Rights Agreement. | |
| 5.1** | Opinion of Weil, Gotshal & Manges, LLP. | |
| 10.1** | Form of NCS Multistage Holdings, Inc. 2017 Equity Incentive Plan (“2017 Equity Incentive Plan”). | |
| 10.2** | Subscription Agreement, dated as of December 22, 2015, by and between NCS Multistage Holdings, Inc. (formerly known as Pioneer Super Holdings, Inc.) and Advent-NCS Acquisition Limited Partnership. | |
| 10.3** | Amended and Restated Employment Agreement between NCS Multistage Holdings, Inc. and Robert Nipper, dated as of February 1, 2017. | |
| 10.4** | Amended and Restated Employment Agreement between NCS Multistage Holdings, Inc. and Tim Willems, dated as of February 1, 2017. | |
| 10.5** | Amended and Restated Employment Agreement between NCS Multistage Holdings, Inc. and Wade Bitter, dated as of February 1, 2017. | |
| 10.6** | Form of Director Indemnification Agreement. | |
| 10.7** | Credit Agreement, dated as of August 7, 2014 (the “Credit Agreement”), by and between Pioneer Intermediate, Inc., as parent, Pioneer Investment, Inc., as borrower, Wells Fargo Bank, National Association, as administrative agent, swingline lender and an issuing lender, HSBC Bank Canada, as an issuing lender, and the lenders named therein. | |
| 10.8** | Agreement and Amendment No. 1 to the Credit Agreement. | |
| 10.9** | Amendment No. 2 to the Credit Agreement. | |
| 10.10** | Form of Director Restricted Stock Unit Award Agreement under the 2017 Equity Incentive Plan. | |
| 10.11** | Form of 2012 Equity Incentive Plan (“2012 Equity Incentive Plan”) of NCS Multistage Holdings, Inc. (formerly known as Pioneer Super Holdings, Inc.). | |
| 10.12** | Form of Stock Option Award Agreement under the 2012 Equity Incentive Plan. | |
| 10.13** | Form of Stock Option Award Agreement under the 2017 Equity Incentive Plan for executive officers. | |
| 10.14** | Form of Stock Option Award Agreement under the 2017 Equity Incentive Plan for non-executive employees. | |
| 10.15** | Exchange Agreement, dated as of December 20, 2012, by and between NCS Energy Holdings, LLC, NCS Multistage Inc. (formerly known as NCS Oilfield Service Canada, Inc.), Cemblend Systems Inc. and NCS Multistage Holdings, Inc. (formerly known as Pioneer Super Holdings, Inc.). | |
| 10.16** | Call Rights Agreement, dated as of December 20, 2012, by and between NCS Energy Holdings, LLC, NCS Multistage Inc. (formerly known as NCS Oilfield Service Canada, Inc.), Cemblend Systems Inc. and NCS Multistage Holdings, Inc. (formerly known as Pioneer Super Holdings, Inc.). | |
| 21.1** | List of subsidiaries. | |
| 23.1 | Consent of PricewaterhouseCoopers LLP. | |
| 23.2** | Consent of Weil, Gotshal & Manges, LLP (included in Exhibit 5.1). | |
| 24.1** | Power of Attorney (included on signature page). | |
| ** | Previously filed. |