Attached files
| file | filename |
|---|---|
| EX-99.1 - EXHIBIT 99.1 - Franklin Financial Network Inc. | v465246_ex99-1.htm |
| 8-K - FORM 8-K - Franklin Financial Network Inc. | v465246_8k.htm |
Exhibit 99.2

Franklin Financial Network, Inc. (NYSE:FSB) First Quarter 2017 Investor Call April 27, 2017

2 Forward - Looking Statements Except for the historical information contained herein, this presentation contains forward - looking statements within the meaning of Section 27A of the Securities Act of 1933, as amended, and Section 21E of the Securities Exchange Act of 1934, as amended. The forward - looking statements include, among other things, statements regarding intent, belief or expectations of the Company and can be identified by the use of words such as "may," "will," "should," "would," "assume," "outlook," "seek," "plan," "believe," "expect," "anticipate," "intend," "estimate," "forecast," and other comparable terms. The Company intends that all such statements be subject to the “safe harbor” provisions of those Acts. Because forward - looking statements involve risks and uncertainties, actual results may differ materially from those expressed or implied. Investors are cautioned not to place undue reliance on these forward - looking statements and are advised to carefully review the discussion of forward - looking statements and risk factors in documents the Company files with the Securities and Exchange Commission. The Company undertakes no obligation to publicly update or revise any forward - looking statements, whether as a result of new information, future events or otherwise.

3 First Quarter Highlights Soundness Nonperforming loans to total loans (1) : 0.21% Net charge - offs to average loans: 0.07% Tier 1 risk - based capital ratio (2) : 11.32% Growth Strong growth in total loans (1) : +37.0% y/y Net income available to common shareholders: +27.8% Diluted EPS of $0.58: +5.5% y/y, on 23.4% additional shares outstanding Profitability Return on assets: 0.99% Return on tangible common equity: 12.28% (1) Excludes loans held for sale. (2) This ratio is an estimate, since the Company’s quarterly regulatory reports have not yet been filed.
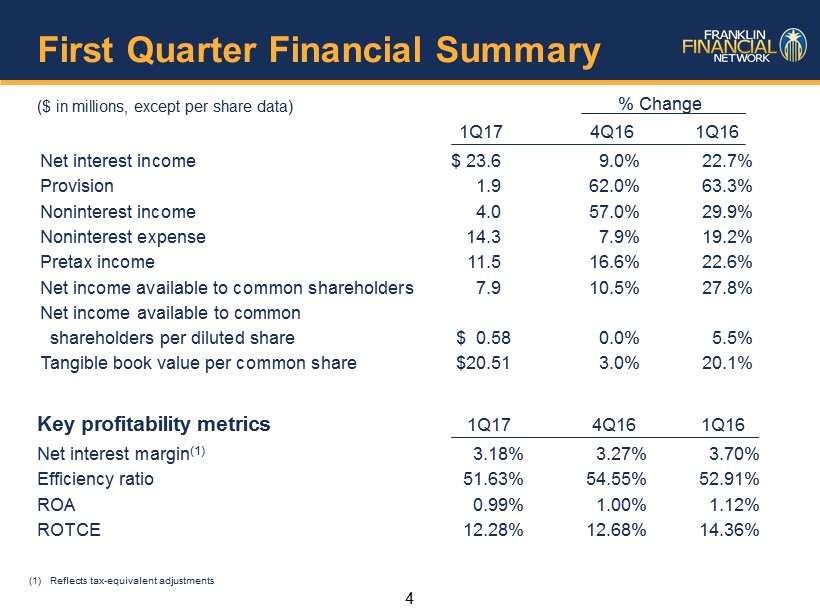
4 First Quarter Financial Summary ($ in millions, except per share data) % Change 1Q17 4Q16 1Q16 Net interest income $ 23.6 9.0% 22.7% Provision 1.9 62.0% 63.3% Noninterest income 4.0 57.0% 29.9% Noninterest expense 14.3 7.9% 19.2% Pretax income 11.5 16.6% 22.6% Net income available to common shareholders 7.9 10.5% 27.8% Net income available to common shareholders per diluted share $ 0.58 0.0% 5.5% Tangible book value per common share $20.51 3.0% 20.1% Key profitability metrics 1Q17 4Q16 1Q16 Net interest margin (1) 3.18% 3.27% 3.70% Efficiency ratio 51.63% 54.55% 52.91% ROA 0.99% 1.00% 1.12% ROTCE 12.28% 12.68% 14.36% (1) Reflects tax - equivalent adjustments

5 Key Metric – Asset Quality: NPLs to Total Loans and “Texas Ratio” 0.12% 0.10% 0.10% 0.35% 0.21% 0.00% 0.20% 0.40% 0.60% 0.80% 1.00% 1Q16 2Q16 3Q16 4Q16 1Q17 NPLs to Total Loans Texas Ratio = (Restructured loans + Nonaccrual loans + Foreclosed Real Estate) / (Total Equity Capital + Allowance for Loan and Lease Losses) 0.44% 0.62% 0.52% 1.26% 1.53% 8.57% 8.37% 8.29% 8.09% 0.00% 2.50% 5.00% 7.50% 10.00% 1Q16 2Q16 3Q16 4Q16 1Q17 Texas Ratio FSB National Peer National peer includes banks of comparable size to Franklin Synergy Bank anywhere in the U.S., as defined by banking regulatory agencies .

6 Key Metric - Asset Quality: Primary Measures ($ in millions) Nonperforming Assets NPAs/total loans + foreclosed assets 0.14% 0.12% 0.10% 0.35% 0.27% Allowance for loan losses/NPLs 734% 884% 976% 268% 449% Net charge offs/average loans 0.01% 0.00% 0.01% 0.04% 0.07% 1Q16 2Q16 3Q16 4Q16 1Q17 Past Due 90 Days or More Non-accrual Foreclosed assets $1.6 $6.2 NPLs $1.8 $1.9 $5.3
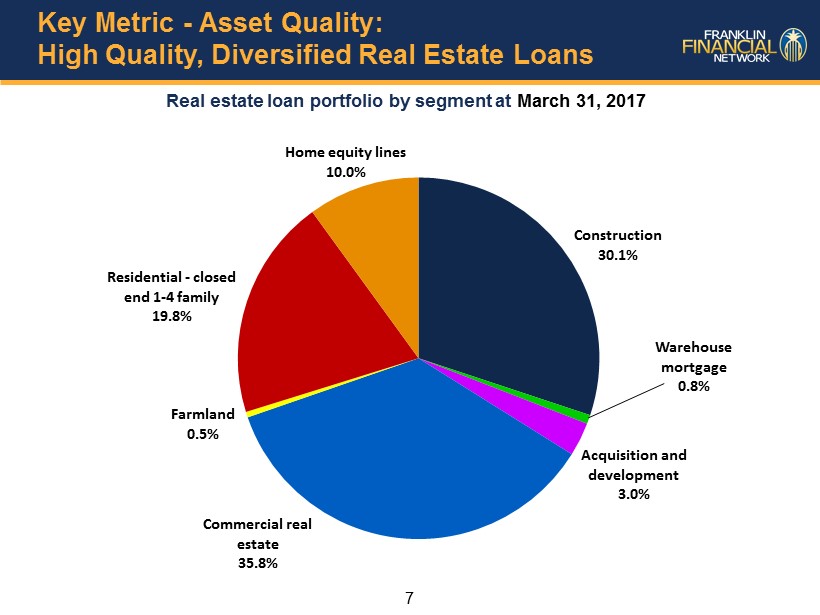
7 Key Metric - Asset Quality: High Quality, Diversified Real Estate Loans Real estate loan portfolio by segment at March 31, 2017 Construction 30.1% Warehouse mortgage 0.8% Acquisition and development 3.0% Commercial real estate 35.8% Farmland 0.5% Residential - closed end 1 - 4 family 19.8% Home equity lines 10.0%

8 Key Metric - Growth: Loans ($ in millions) Loan Growth: Comparable quarter +36.8% Sequential quarter +9.2% $806 $1,318 $1,797 $1,434 $1,962 2014 2015 2016 2016 2017 Year Ended December 31 Quarter Ended March 31 NOTE: Includes loans held for sale.

9 Key Metric – Growth: Annual Loan Growth Loan Type 1Q2017 1Q2016 Growth % Growth Construction 454,493$ 375,896$ 78,597$ 20.9% Acquisition & development 44,779 37,462 7,317 19.5% Commercial real estate - owner-occupied 188,632 70,598 118,034 167.2% Commercial real estate - other 360,526 338,252 22,274 6.6% Residential - closed end 1-4 family 299,628 163,784 135,844 82.9% Residential - open end 1-4 family 151,530 120,577 30,953 25.7% Warehouse mortgage 12,682 11,680 1,002 8.6% Total real estate 1,512,270 1,118,249 394,021 35.2% Commercial 447,245 310,517 136,728 44.0% Consumer & other 3,853 6,453 (2,600) -40.3% Total Gross Loans 1,963,368 1,435,219 528,149 36.8% Less: Deferred fees (971) (1,596) 625 -39.2% Total Net Loans 1,962,397$ 1,433,623$ 528,774$ 36.9%

10 Key Metric - Growth: Substantial Increase in Deposits ($ in millions) Deposit Balances: Comparable quarter +44.2% Sequential quarter +17.8% 1Q16 2Q16 3Q16 4Q16 1Q17 Non-interest Bearing Interest Bearing Checking Other Savings Money Market Demand Time $2,392 $1,953 $2,250 $2,218 $2,817

11 Key Metric – Profitability: Relatively Stable Net Interest Margin Net Interest Margin By Quarter (1) 3.70% 3.47% 3.34% 3.27% 3.18% 1Q16 2Q16 3Q16 4Q16 1Q17 (1) Reflects tax - equivalent adjustments

12 Key Metric – Profitability: Significant Growth in Noninterest Income ($ in thousands) 1Q16 4Q16 1Q17 Service charges on deposit accounts $ 49 $ 46 $ 30 Other service charges and fees 633 796 752 Net gains on sale of loans (1) 1,608 324 2,334 Wealth management 368 551 593 Loan servicing fees, net 42 24 107 Gain on sale of securities 310 637 — Net gain on sale of foreclosed assets 3 4 3 Other 72 171 189 Total noninterest income $3,085 $2,553 $4,008 (1) Primarily from sale of mortgage loans. $67 $114 $139 $124 $90 1Q16 2Q16 3Q16 4Q16 1Q17 Mortgage Production ($ in millions)

13 Key Metric – Profitability: Noninterest Expense and Economies of Scale ($ in thousands) 1Q16 4Q16 1Q17 Salaries and employee benefits $ 6,517 $ 7,930 $ 8,033 Occupancy and equipment 1,807 2,064 2,095 FDIC assessment expense 413 680 760 Marketing 217 151 267 Professional fees 1,094 540 1,035 Amortization of core deposit intangible 149 133 127 Other 1,634 1,731 1,959 Total noninterest expense $11,831 $13,229 $14,276 52.91% 52.58% 53.65% 54.55% 51.63% 1Q16 2Q16 3Q16 4Q16 1Q17 Efficiency Ratio

14 Key Elements of FSB Performance Growth Real Estate Lending Asset Quality Proven, Successful Banking Model