Attached files
| file | filename |
|---|---|
| EX-99.1 - EX-99.1 - FRANKLIN FINANCIAL SERVICES CORP /PA/ | fraf-20170426xex99_1.htm |
| 8-K - 8-K - FRANKLIN FINANCIAL SERVICES CORP /PA/ | fraf-20170426x8k.htm |

Annual Meeting APRIL 25, 2017 franklinfin.com
Call to Order G. WARREN ELLIOTT 2
Invocation RICHARD E. JORDAN III 3
Minutes of Last Meeting G. WARREN ELLIOTT 4
In order for you to better understand the business of the Company – where we all have been and where we want to go – our remarks today (those of the Company officers who will speak or respond to questions) will include forward looking statements related to anticipated financial performance, future operating results, business prospects, new products, and similar matters. These statements represent our best judgment, based upon present circumstances and the information now available to us, of what we think may occur in the future – and, of course, it is possible that actual results may differ materially from those we envision today.
For a more complete discussion on the subject of forward looking statements, including a list of some of the risk factors that might adversely affect future operating results, we refer you to the section entitled “Forward Looking Statements” which appears in our annual report on Form 10-K as filed with the Securities and Exchange Commission.
Forward Looking Statements 5
Introductions G. WARREN ELLIOTT 6
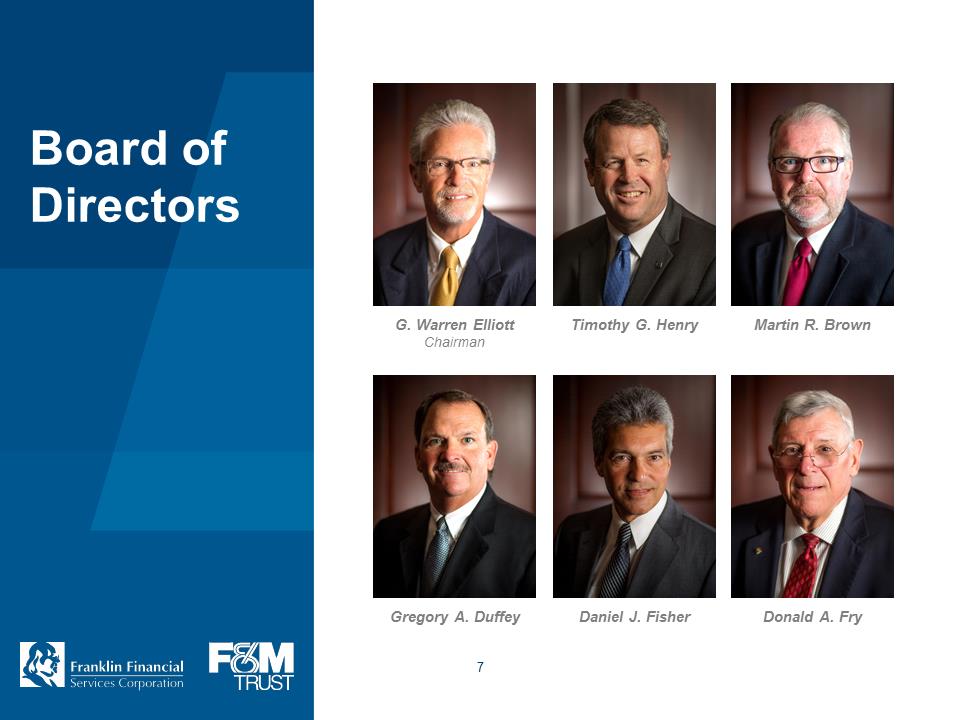
Board of Directors G. Warren Elliott, Chairman Martin R. Brown Gregory A. Duffey Daniel J. Fisher Donald A. Fry Timothy G. Henry 7
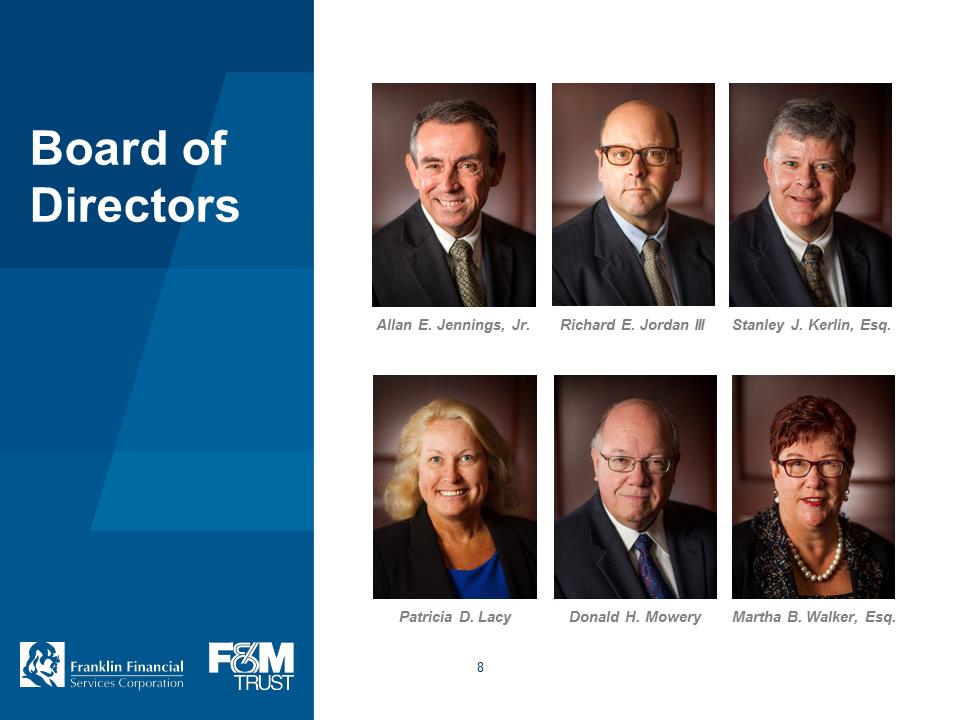
Martha B. Walker, Esq. Donald H. Mowery Patricia D. Lacy Allan E. Jennings, Jr. Richard E. Jordan III Stanley J. Kerlin, Esq. Board of Directors 8
Dean Dusinberre - PARTNER, RHOADS & SINON, LLP, David Cruz - ASSISTANT VICE PRESIDENT, COMPUTERSHARE, Steve Runyeon - SENIOR MANAGER AND CPA, BDO USA, LLP, Bob Kafafian - PRESIDENT & CEO, THE KAFAFIAN GROUP, INC. 9
Chairman’s Remarks G. WARREN ELLIOTT 10


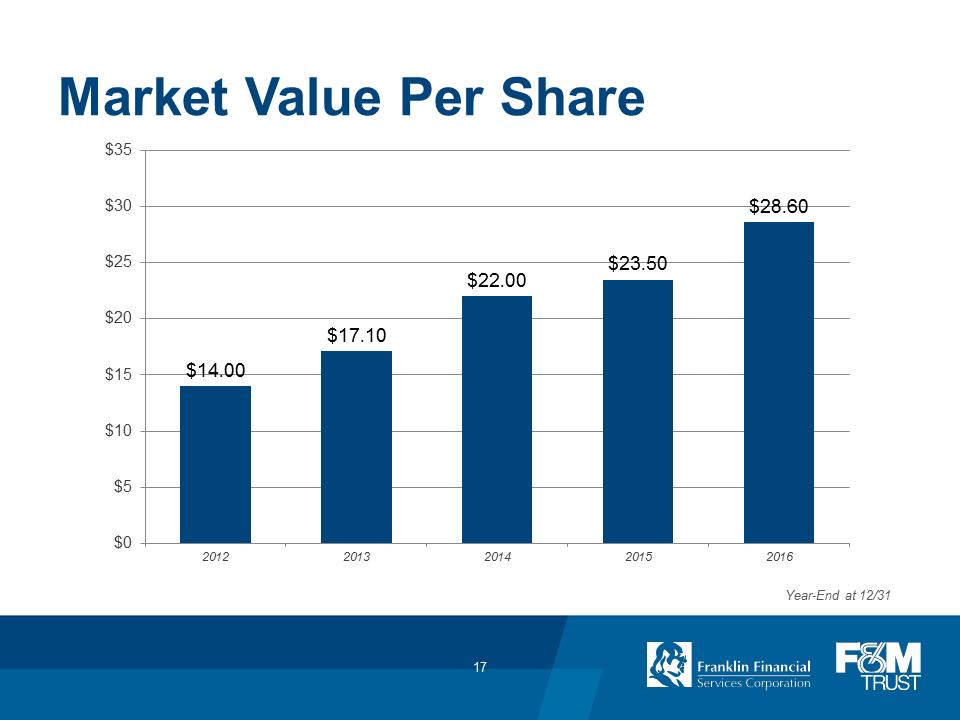
$14.00
$17.10
$22.00
$23.50
$28.60
$0
$5
$10
$15
$20 $25 $30 $35 2012 2013 2014 2015 2016 Market Value Per Share Year-End at 12/31 17
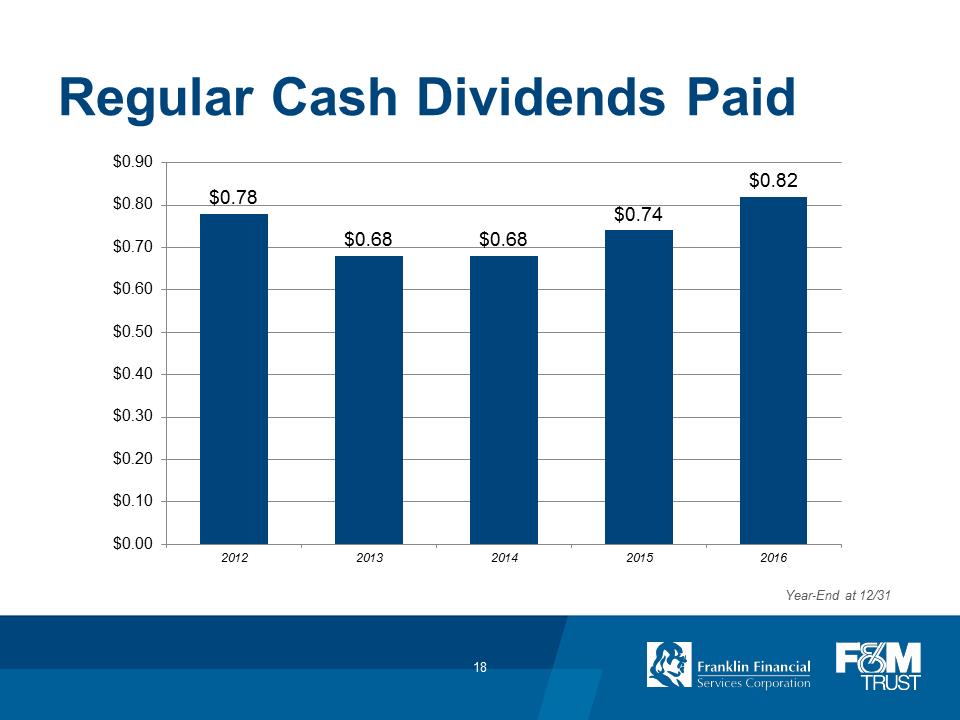
Regular Cash Dividends Paid Year-End at 12/31 $0.78 $0.68 $0.68 $0.74 $0.82 $0.00 $0.10 $0.20 $0.30 $0.40 $0.50 $0.60 $0.70 $0.80 $0.90 2012 2013 2014 2015 2016 18


Election of Directors G. WARREN ELLIOTT 22
G. Warren Elliott - PRESIDENT, CARDINAL CROSSING, INC., FORMER FRANKLIN COUNTY COMMISSIONER
Timothy G. Henry - PRESIDENT & CEO
Stanley J. Kerlin, Esq. - ATTORNEY, LAW OFFICE OF STANLEY J. KERLIN, LLC
Martha B. Walker, Esq. - PARTNER, WALKER, CONNOR & SPANG, LLC 23
Say-On-Pay Vote G. WARREN ELLIOTT 24
Say-On-Frequency Vote G. WARREN ELLIOTT 25
Selection of Auditors G. WARREN ELLIOTT 26

Financial Overview MARK R. HOLLAR, CFO 28
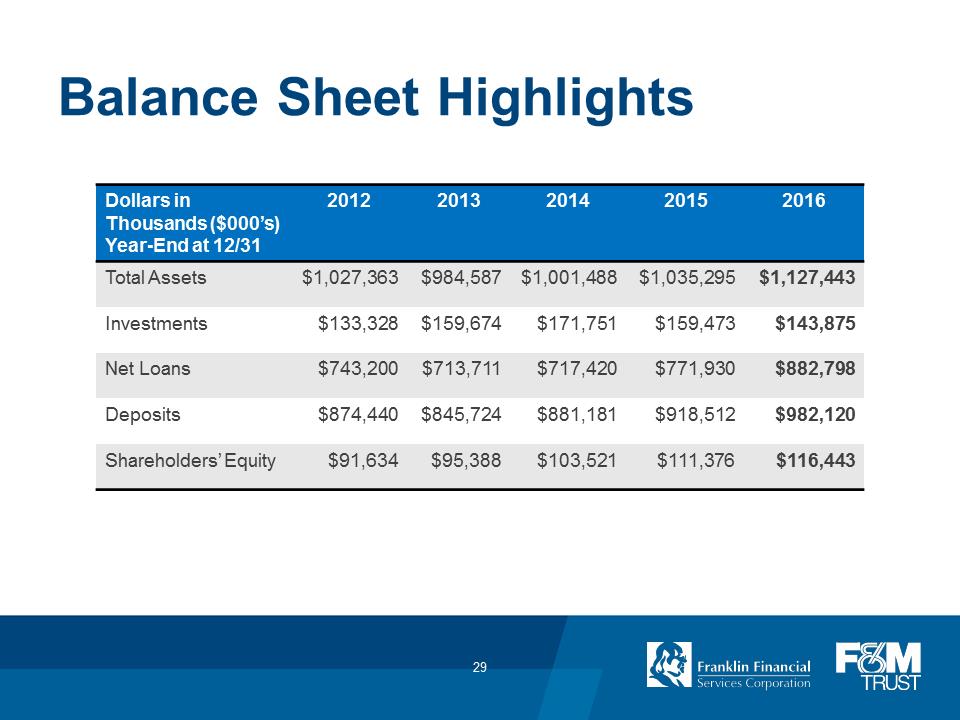
Balance Sheet Highlights Dollars in Thousands ($000’s) Year-End at 12/31 2012 2013 2014 2015 2016 Total Assets $1,027,363 $984,587 $1,001,488 $1,035,295 $1,127,443 Investments $133,328 $159,674 $171,751 $159,473 $143,875 Net Loans $743,200 $713,711 $717,420 $771,930 $882,798 Deposits $874,440 $845,724 $881,181 $918,512 $982,120 Shareholders’ Equity $91,634 $95,388 $103,521 $111,376 $116,443 29
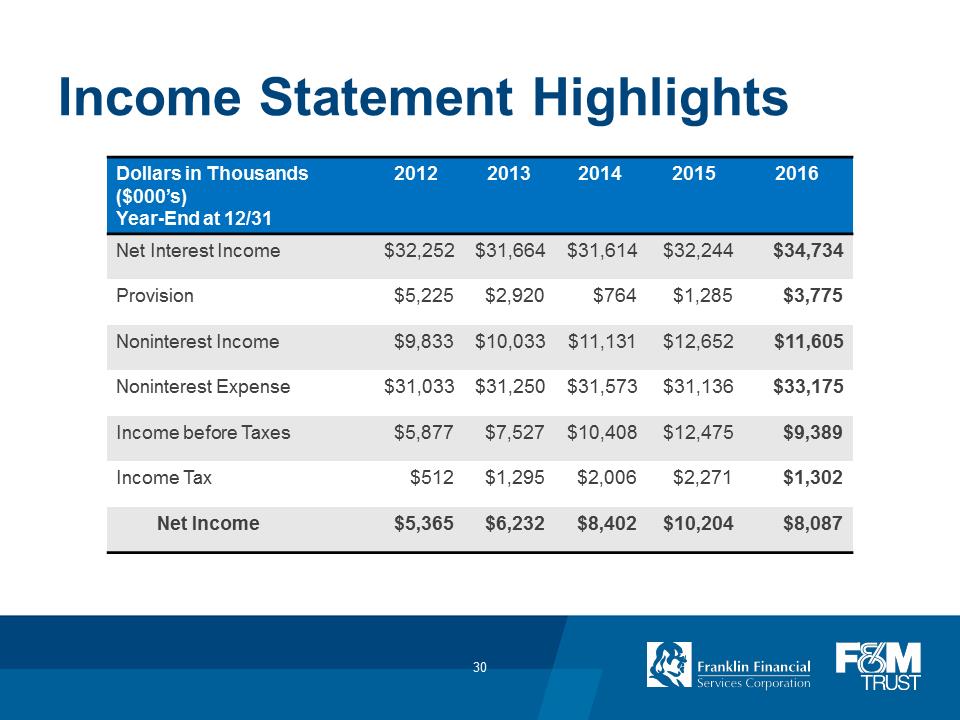
Income Statement Highlights Dollars in Thousands ($000’s) Year-End at 12/31 2012 2013 2014 2015 2016 Net Interest Income $32,252 $31,664 $31,614 $32,244 $34,734 Provision $5,225 $2,920 $764 $1,285 $3,775 Noninterest Income $9,833 $10,033 $11,131 $12,652 $11,605 Noninterest Expense $31,033 $31,250 $31,573 $31,136 $33,175 Income before Taxes $5,877 $7,527 $10,408 $12,475 $9,389 Income Tax $512 $1,295 $2,006 $2,271 $1,302 Net Income $5,365 $6,232 $8,402 $10,204 $8,087 30
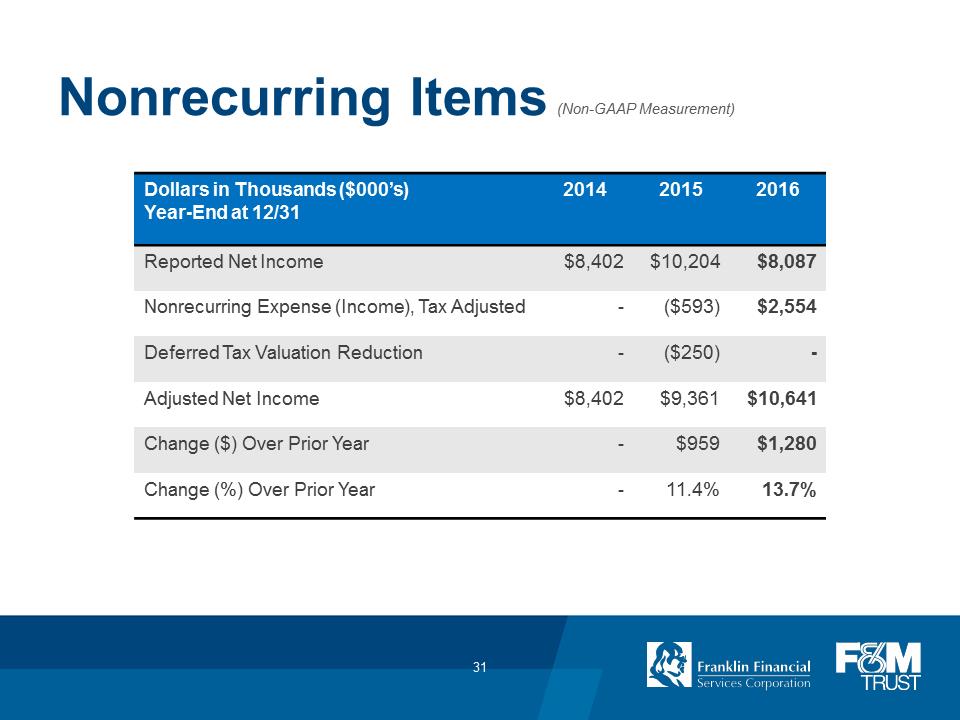
Nonrecurring Items Dollars in Thousands ($000’s) Year-End at 12/31 2014 2015 2016 Reported Net Income $8,402 $10,204 $8,087 Nonrecurring Expense (Income), Tax Adjusted - ($593) $2,554 Deferred Tax Valuation Reduction - ($250) - Adjusted Net Income $8,402 $9,361 $10,641 Change ($) Over Prior Year - $959 $1,280 Change (%) Over Prior Year - 11.4% 13.7% (Non-GAAP Measurement) 31
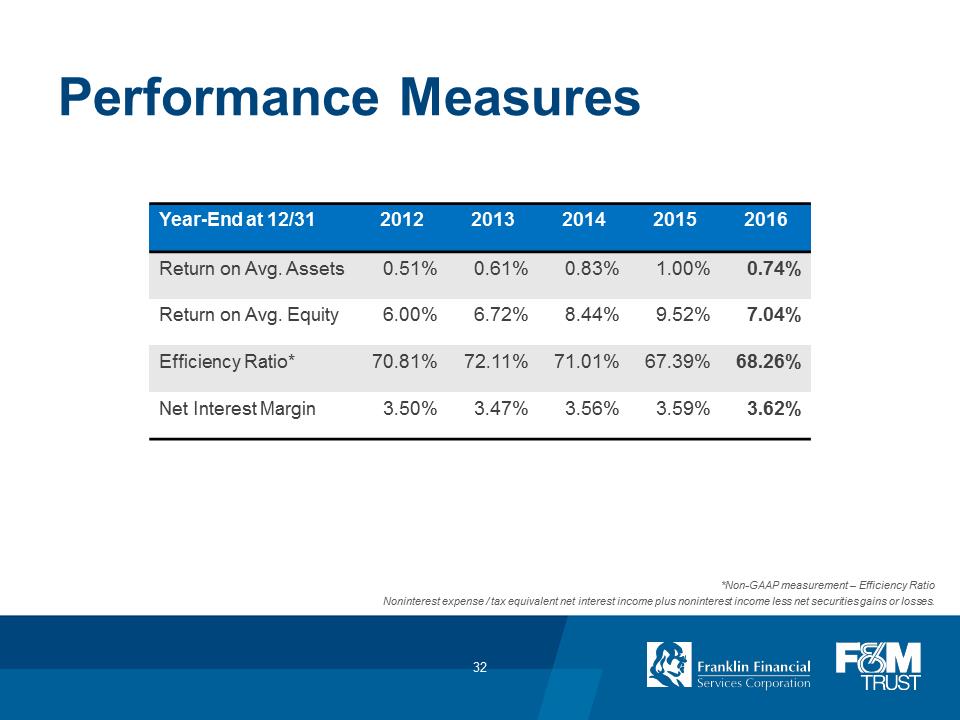
Performance Measures Year-End at 12/31 2012 2013 2014 2015 2016 Return on Avg. Assets 0.51% 0.61% 0.83% 1.00% 0.74% Return on Avg. Equity 6.00% 6.72% 8.44% 9.52% 7.04% Efficiency Ratio* 70.81% 72.11% 71.01% 67.39% 68.26% Net Interest Margin 3.50% 3.47% 3.56% 3.59% 3.62% *Non-GAAP measurement – Efficiency Ratio Noninterest expense / tax equivalent net interest income plus noninterest income less net securities gains or losses. 32
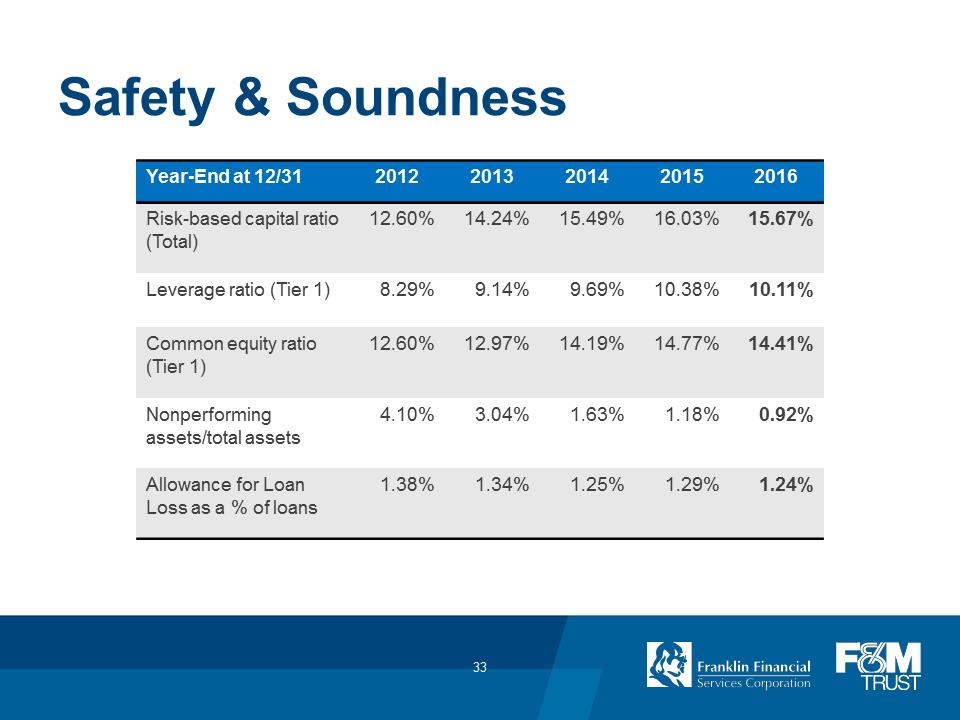
Safety & Soundness Year-End at 12/31 2012 2013 2014 2015 2016 Risk-based capital ratio (Total) 12.60% 14.24% 15.49% 16.03% 15.67% Leverage ratio (Tier 1) 8.29% 9.14% 9.69% 10.38% 10.11% Common equity ratio (Tier 1) 12.60% 12.97% 14.19% 14.77% 14.41% Nonperforming assets/total assets 4.10% 3.04% 1.63% 1.18% 0.92% Allowance for Loan Loss as a % of loans 1.38% 1.34% 1.25% 1.29% 1.24% 33
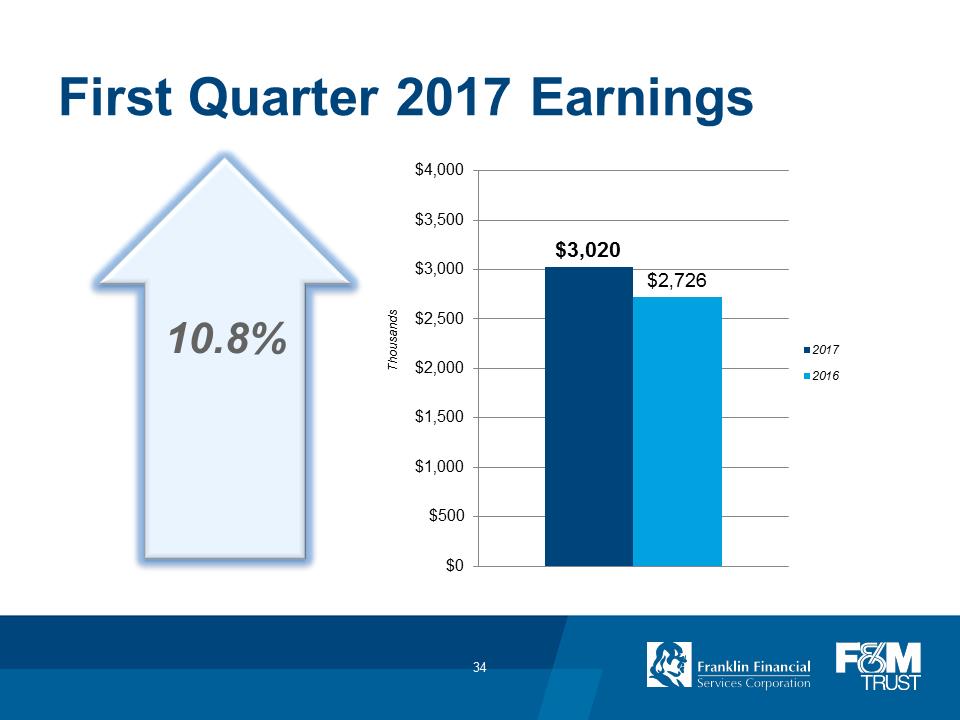
First Quarter 2017 Earnings $3,020 $2,726 $0 $500 $1,000 $1,500 $2,000 $2,500 $3,000 $3,500 $4,000 Thousands 2017 2016 10.8% 34
President & CEO’s Remarks TIMOTHY G. HENRY 35
April 13, 2017 – FFSC Board declared: $.24 per share regular quarterly dividend for the Second Quarter 36

Polls Are Closed 37
Report by Judge of Election DAVID CRUZ 38