Attached files
| file | filename |
|---|---|
| 8-K - FORM 8-K - AMERISERV FINANCIAL INC /PA/ | v465105_8k.htm |
Exhibit 99.1

BANKING FOR TODAY. BANKING FOR TOMORROW. BANKING FOR LIFE. BANKING FOR TODAY. BANKING FOR TOMORROW. BANKING FOR LIFE.

2 2017 Annual Shareholders' Meeting
Kerri Mueller Senior Vice President – Retail Banking 3
4 This meeting is being transmitted in its entirety beyond this room via webcast to all interested shareholders and prospective investors.

Craig G. Ford Chairman AmeriServ Financial, Inc. 5

Welcome to our Annual Shareholder Meeting We appreciate your ongoing loyalty and support. Welcome! 6

Agenda • Proxy items • Comments by Chairman of the Board • Chief Financial Officer presentation • President & CEO comments • Final report on Proxy items • Question & Answer period 7

Election of Class I Directors Allan R. Dennison Sara A. Sargent Jeffrey A. Stopko Robert L. Wise 8

Honored Guests • Elected Officials • Labor Officials • Distinguished Guests • Past Directors • Present Directors • AmeriServ ® Employees • Our Shareholders 9
COMMUNICATION TO YOU – OUR SHAREHOLDERS 10

11 Why is AmeriServ Here?

• 358 Community Banks in the U.S. with total assets between $1 - $3 billion • 16 Headquartered in Pennsylvania 12

13 How is AmeriServ different?

AmeriServ Financial Mission To increase shareholder value by providing exceptional products and customer service. 14
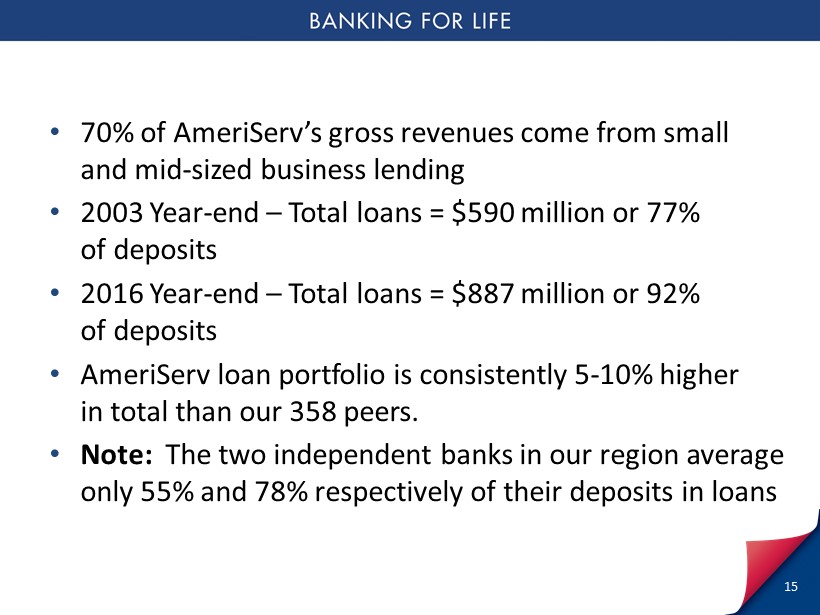
• 70% of AmeriServ’s gross revenues come from small and mid - sized business lending • 2003 Year - end – Total loans = $590 million or 77% of deposits • 2016 Year - end – Total loans = $887 million or 92% of deposits • AmeriServ loan portfolio is consistently 5 - 10% higher in total than our 358 peers. • Note: The two independent banks in our region average only 55% and 78% respectively of their deposits in loans 15

16 Risk Strategy • AmeriServ credit standards are carefully set • Currently troubled loans is at an all time low dating back to April 2000 • Lower than 85% of the 358 peer bank group • AmeriServ lends more and loses less!
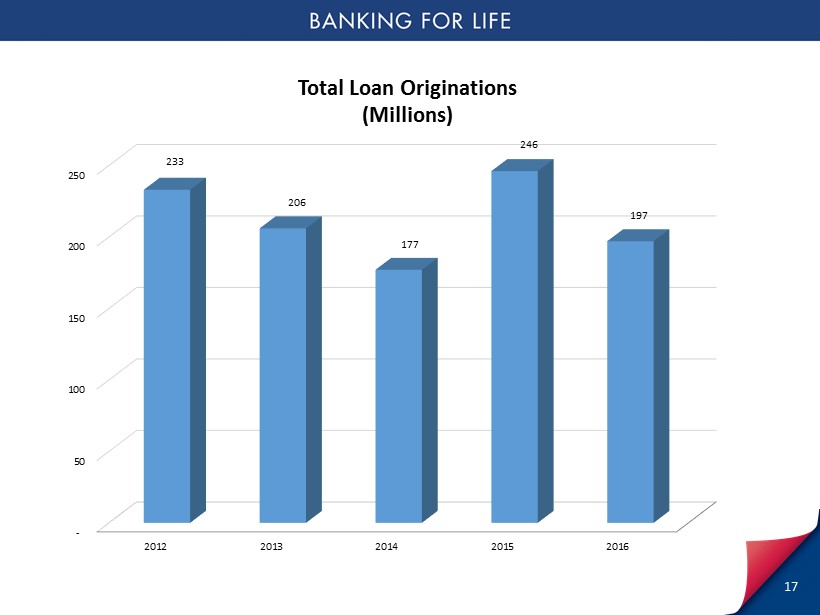
- 50 100 150 200 250 2012 2013 2014 2015 2016 233 206 177 246 197 Total Loan Originations (Millions) 17

18 76.00% 78.00% 80.00% 82.00% 84.00% 86.00% 88.00% 90.00% 92.00% 94.00% 96.00% 2012 2013 2014 2015 2016 82.67% 88.18% 92.32% 95.98% 92.89% Loan to Deposit Ratio - full year average
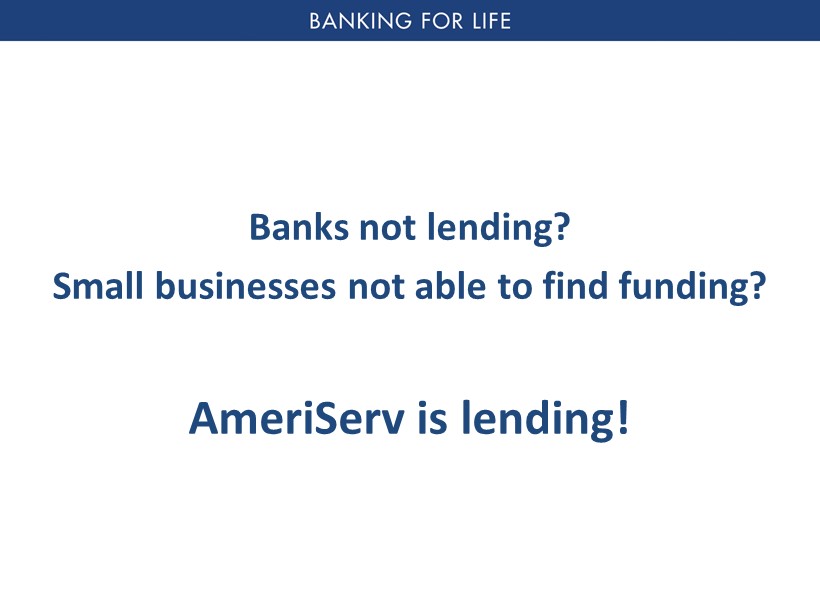
Banks not lending? Small businesses not able to find funding? AmeriServ is lending! 19
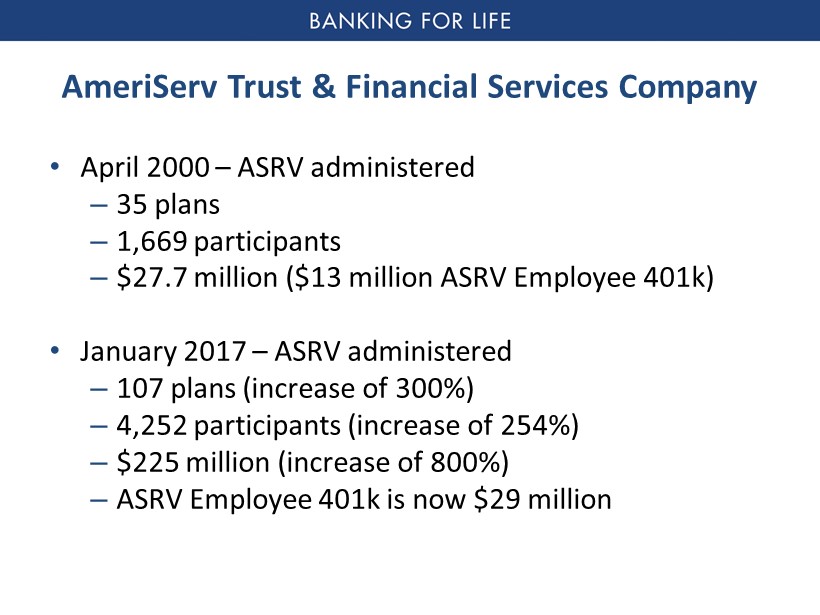
AmeriServ Trust & Financial Services Company • April 2000 – ASRV administered – 35 plans – 1,669 participants – $27.7 million ($13 million ASRV Employee 401k) • January 2017 – ASRV administered – 107 plans (increase of 300%) – 4,252 participants (increase of 254%) – $ 225 million (increase of 800%) – ASRV Employee 401k is now $29 million 20
Why is AmeriServ Here? • To provide a source of credit to small and mid - sized companies • To assist in providing for declining years 21

Michael D. Lynch Senior Vice President Chief Financial Officer Chief Investment Officer Chief Risk Officer 22

23 Annual Financial Results Through 2016

24 $0 $2,000 $4,000 $6,000 2012 2013 2014 2015 2016 5,039 5,193 3,023 5,997 2,310 Net Income (Thousands)
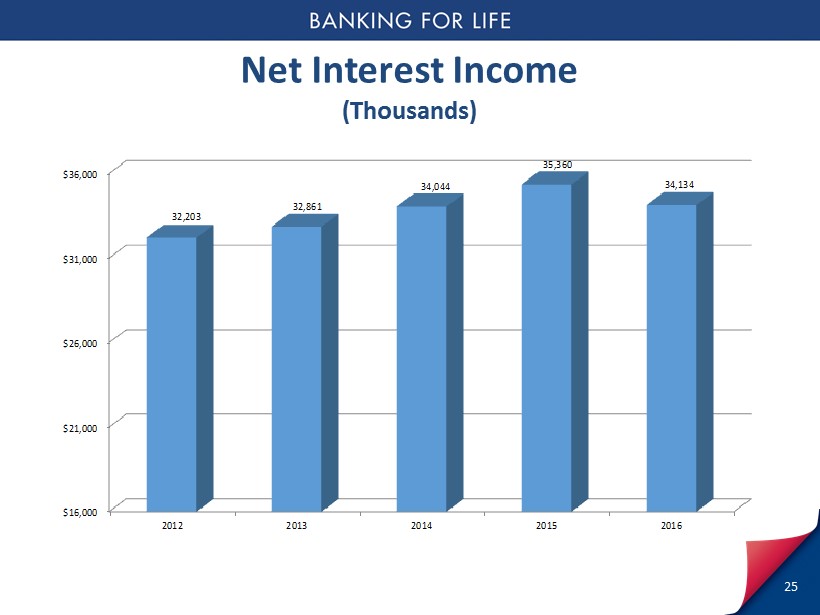
$16,000 $21,000 $26,000 $31,000 $36,000 2012 2013 2014 2015 2016 32,203 32,861 34,044 35,360 34,134 25 Net Interest Income (Thousands)

1.50% 2.00% 2.50% 3.00% 3.50% 4.00% 2012 2013 2014 2015 2016 3.65% 3.56% 3.52% 3.49% 3.26% 26 Net Interest Margin
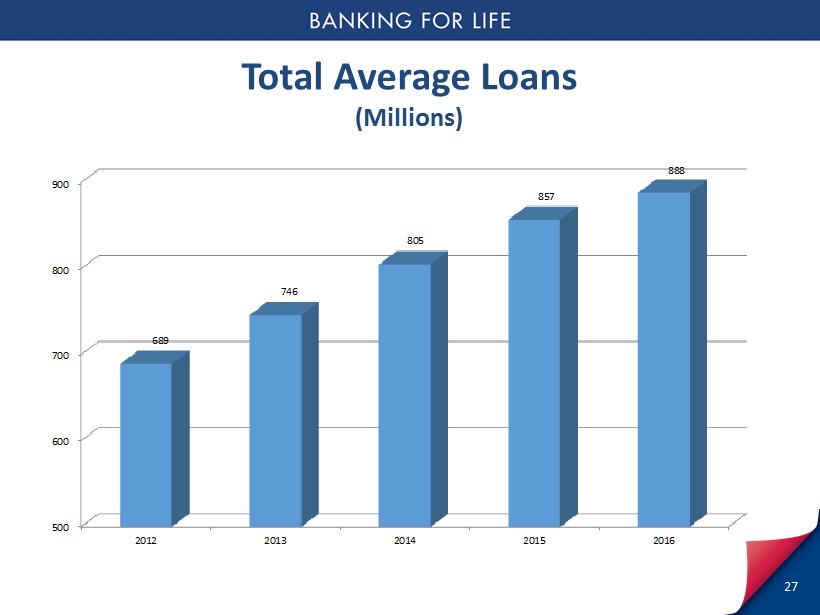
500 600 700 800 900 2012 2013 2014 2015 2016 689 746 805 857 888 27 Total Average Loans (Millions)

500 600 700 800 900 1,000 2012 2013 2014 2015 2016 833 847 872 893 956 28 Total Average Deposits (Millions)
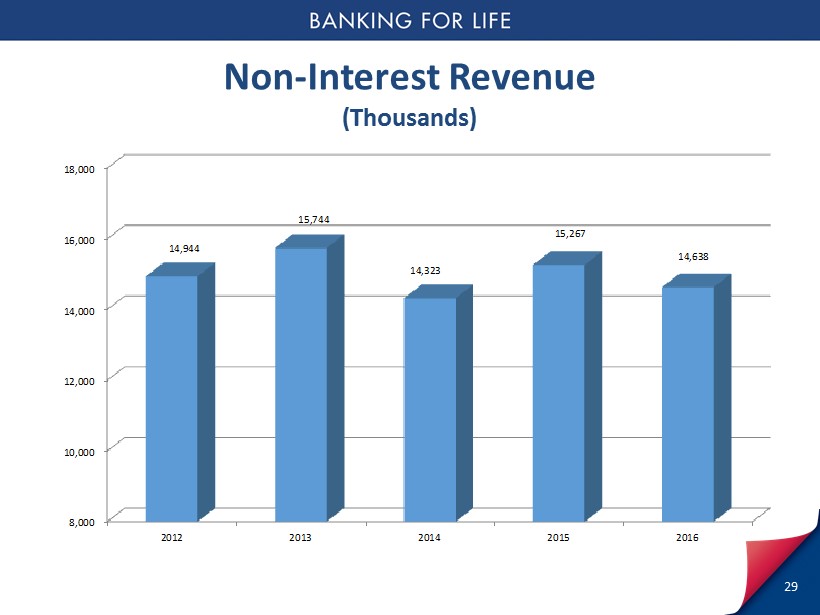
8,000 10,000 12,000 14,000 16,000 18,000 2012 2013 2014 2015 2016 14,944 15,744 14,323 15,267 14,638 29 Non - Interest Revenue (Thousands)

20,000 25,000 30,000 35,000 40,000 45,000 2012 2013 2014 2015 2016 40,641 42,223 43,372 41,038 41,615 30 Non - Interest Expense (Thousands)

(2,000) 0 2,000 4,000 2012 2013 2014 2015 2016 (775) (1,100) 375 1,250 3,950 31 Loan Loss Provision (Thousands)
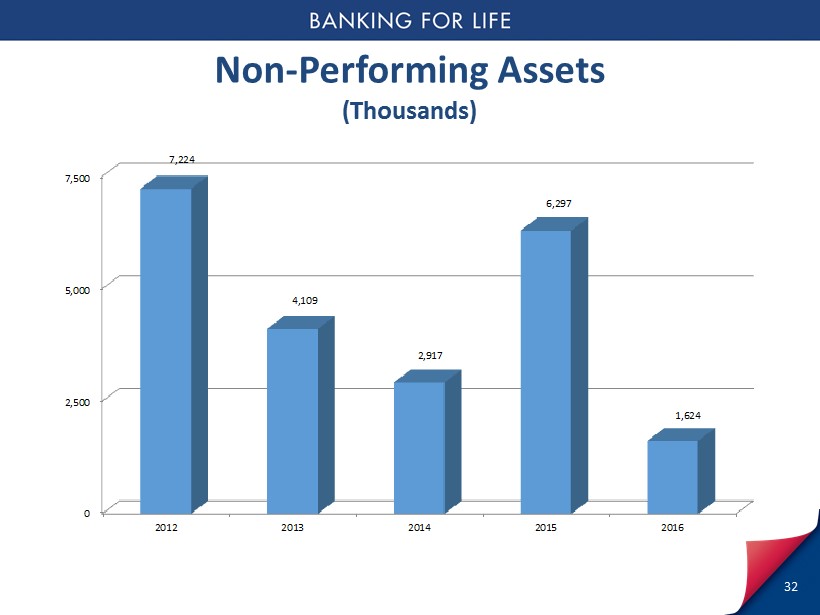
0 2,500 5,000 7,500 2012 2013 2014 2015 2016 7,224 4,109 2,917 6,297 1,624 32 Non - Performing Assets (Thousands)

$3.00 $4.00 $5.00 2012 2013 2014 2015 2016 $4.01 $4.24 $4.33 $4.56 $4.41 33 Tangible Book Value Per Share

$0.00 $0.05 $0.10 $0.15 $0.20 $0.25 $0.30 $0.35 2012 2013 2014 2015 2016 $0.21 $0.26 $0.15 $0.31 $0.12 34 Earnings Per Share

35 Financial Results Through 1 st Quarter 2017

($1,500) ($1,000) ($500) $0 $500 $1,000 $1,500 $2,000 1Q '15 2Q 3Q 4Q 1Q '16 2Q 3Q 4Q 1Q '17 1,369 1,422 1,832 1,375 (1,267) 1,362 1,064 1,150 1,348 36 Net Income (Thousands)

-$0.10 -$0.05 $0.00 $0.05 $0.10 1Q '15 2Q 3Q 4Q 1Q '16 2Q 3Q 4Q 1Q '17 $0.07 $0.07 $0.09 $0.07 -$0.07 $0.07 $0.06 $0.06 $0.07 Earnings per Share 37

$5,000 $6,000 $7,000 $8,000 $9,000 $10,000 1Q '15 2Q 3Q 4Q 1Q '16 2Q 3Q 4Q 1Q '17 8,934 8,800 9,035 8,591 8,558 8,487 8,506 8,584 8,721 38 Net Interest Income (Thousands)
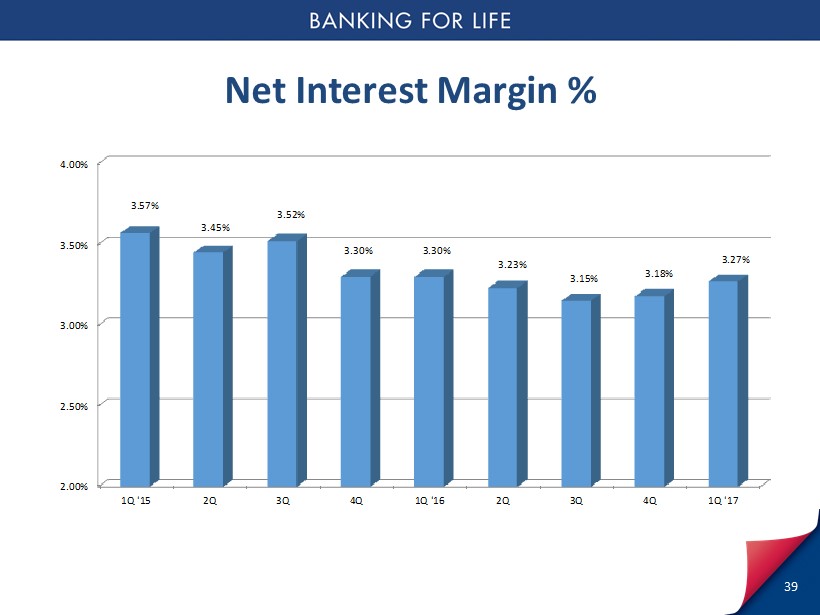
2.00% 2.50% 3.00% 3.50% 4.00% 1Q '15 2Q 3Q 4Q 1Q '16 2Q 3Q 4Q 1Q '17 3.57% 3.45% 3.52% 3.30% 3.30% 3.23% 3.15% 3.18% 3.27% 39 Net Interest Margin %

$0 $50 $100 $150 $200 1Q '15 2Q 3Q 4Q 1Q '16 2Q 3Q 4Q 1Q '17 164 160 158 160 155 158 173 178 177 40 Average Investment Securities (Millions)
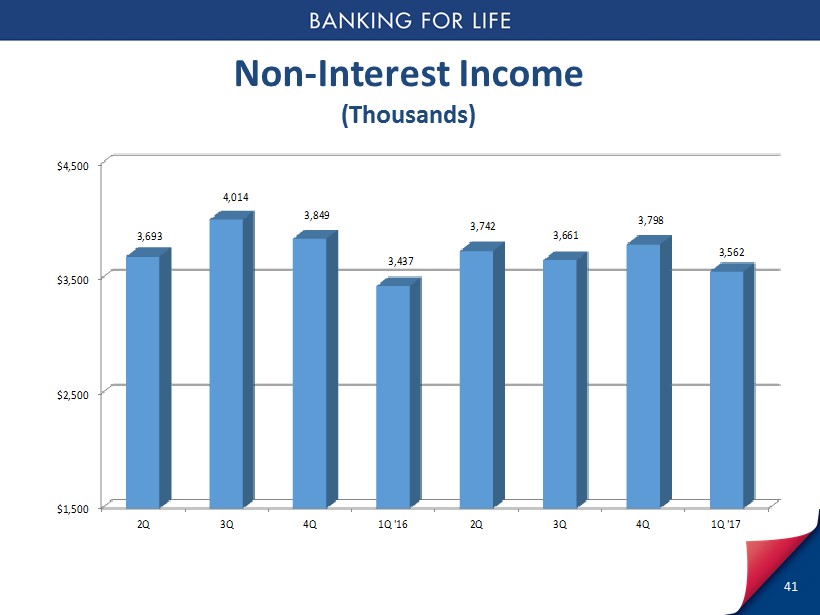
$1,500 $2,500 $3,500 $4,500 2Q 3Q 4Q 1Q '16 2Q 3Q 4Q 1Q '17 3,693 4,014 3,849 3,437 3,742 3,661 3,798 3,562 41 Non - Interest Income (Thousands)

$6,000 $7,000 $8,000 $9,000 $10,000 $11,000 $12,000 1Q '15 2Q 3Q 4Q 1Q '16 2Q 3Q 4Q 1Q '17 10,410 10,239 10,219 10,509 10,086 10,711 10,170 10,039 10,356 42 Non - Interest Expense (Thousands)

$0 $500 $1,000 $1,500 $2,000 $2,500 $3,000 $3,500 1Q '15 2Q 3Q 4Q 1Q '16 2Q 3Q 4Q 1Q '17 250 200 300 500 3,100 250 300 300 225 43 Loan Loss Provision (Thousands)
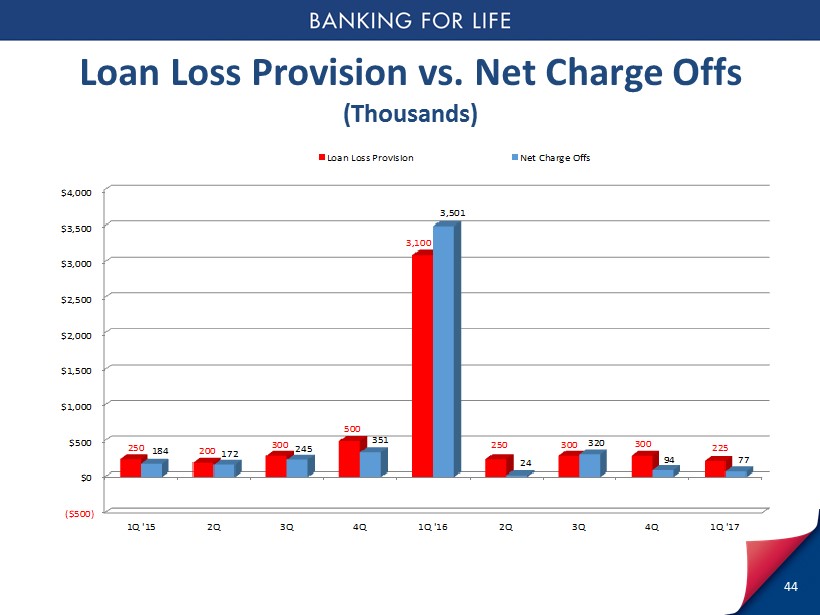
($500) $0 $500 $1,000 $1,500 $2,000 $2,500 $3,000 $3,500 $4,000 1Q '15 2Q 3Q 4Q 1Q '16 2Q 3Q 4Q 1Q '17 250 200 300 500 3,100 250 300 300 225 184 172 245 351 3,501 24 320 94 77 Loan Loss Provision Net Charge Offs 44 Loan Loss Provision vs. Net Charge Offs (Thousands)

$0 $4,000 $8,000 $12,000 1Q '15 2Q 3Q 4Q 1Q '16 2Q 3Q 4Q 1Q '17 Loan Loss Reserve Non Performing Assets 318% 379% 426% 158% 317% 437% 510% 612% 677% 45 Allowance for Loan Loss vs. Non - Performing Assets (Thousands)
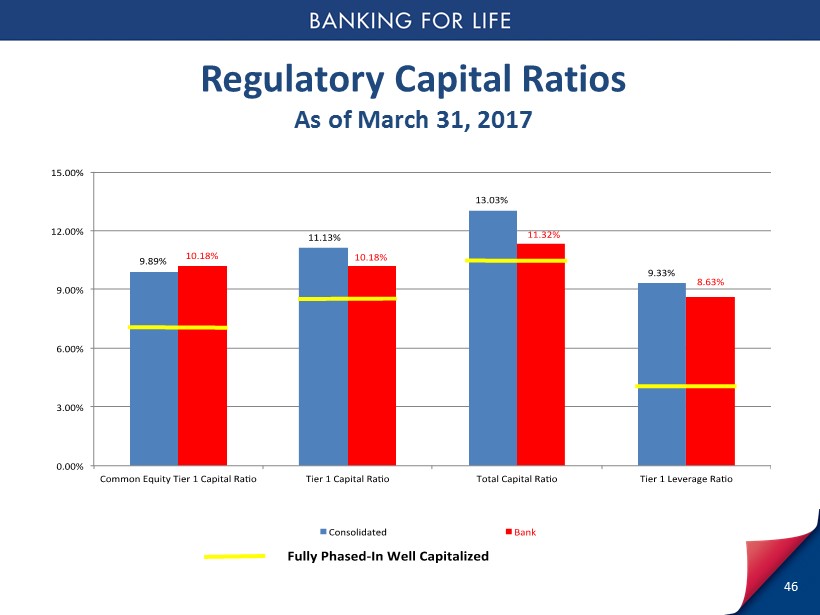
46 Regulatory Capital Ratios As of March 31, 2017

2017 First Quarter Summary 47 • Improved earnings in the first quarter of 2017 resulted from growth in total revenue, a reduction in non - interest expense and a controlled loan loss provision due to outstanding asset quality • We have seen tangible benefit from several profitability improvement initiatives that we executed last year as each of our reported non - interest expense categories declined in the first quarter of 2017

Jeffrey A. Stopko President & Chief Executive Officer AmeriServ Financial, Inc. 48

AmeriServ Financial, Inc. Strategic Plan 2017 - 2019 • Built around our Banking for Life philosophy • Focused on four key constituencies – Shareholders – Customers – Staff – Communities 49

AmeriServ Mission Statement AmeriServ Financial is committed to increasing shareholder value by striving for consistently improving financial performance; providing our customers with products and exceptional service for every step in their lifetime financial journey; cultivating an employee atmosphere rooted in trust, empowerment and growth; and serving our communities through employee involvement and a philanthropic spirit. 50

AmeriServ Core Values • Integrity • Service • Commitment • Teamwork 51

AmeriServ Strategic Shareholder Goal 52 Create long - term value for our shareholders by: – Maintaining a financially strong balance sheet – Appropriately managing risk – Consistently improving shareholder returns

53 AmeriServ Strategic Shareholder Goal Shareholder value creation will focus on: – Increasing Earnings Per Share (EPS) – Providing Strong Capital Returns to Shareholders

54 AmeriServ Strategic Shareholder Goal Increasing Earnings Per Share (EPS) – Striving to grow EPS by at least 10% annually – Improve profitability metrics – Narrow financial performance gap – Careful income statement management

55 AmeriServ Strategic Shareholder Goal Revenue Growth: - Net Interest Income – Balance sheet well positioned for higher interest rates – Controlled growth of loan portfolio and investment securities – Manage risk associated with commercial real estate lending – Strong core deposit base will allow for deposit costs to lag

Revenue Growth: - Non Interest Income – Non interest income represents 30% of total revenue – Strengthened Financial Services division in late 2016 – Opportunistically consider Wealth Management acquisitions – Further leverage union related revenue streams 56 AmeriServ Strategic Shareholder Goal

Revenue Growth: - Non Interest Expense Reduction – 2016 Profitability improvement initiatives showing results – 2017 Further branch consolidation in Richland and State College markets 57 AmeriServ Strategic Shareholder Goal

Non Interest Expense Reduction - Richland – Renovated University Heights office will support closure of Galleria Mall office – After consolidation - highly profitable branch with over $116 million in deposits 58 AmeriServ Strategic Shareholder Goal
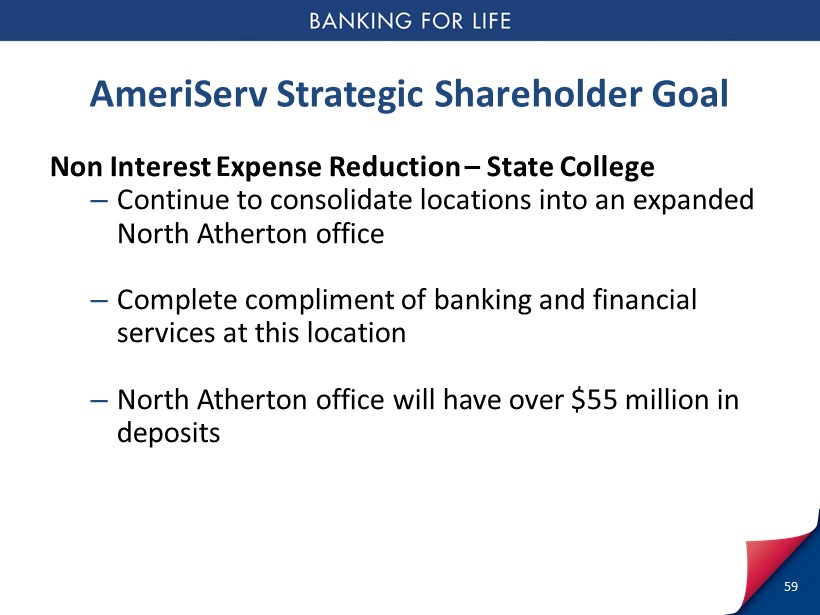
59 AmeriServ Strategic Shareholder Goal Non Interest Expense Reduction – State College – Continue to consolidate locations into an expanded North Atherton office – Complete compliment of banking and financial services at this location – North Atherton office will have over $55 million in deposits
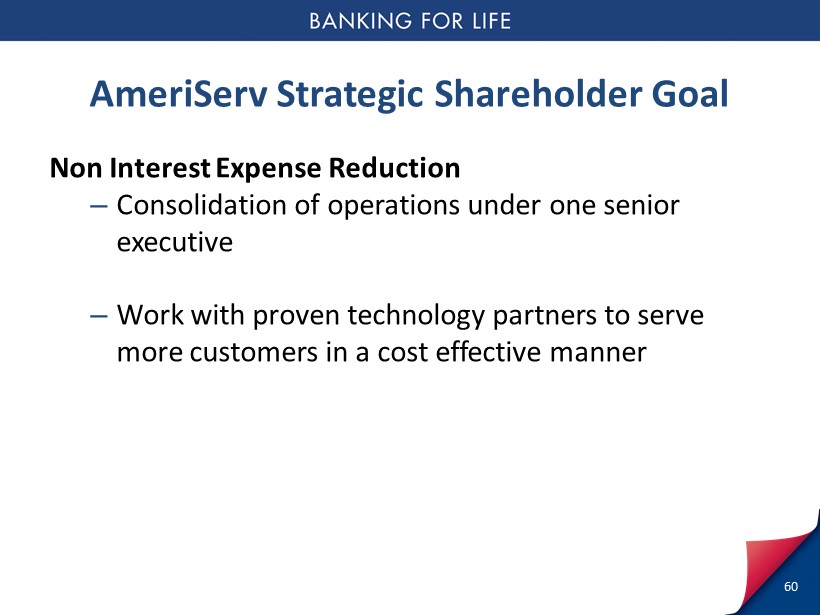
60 AmeriServ Strategic Shareholder Goal Non Interest Expense Reduction – Consolidation of operations under one senior executive – Work with proven technology partners to serve more customers in a cost effective manner

61 AmeriServ Strategic Shareholder Goal Loan Loss Provision and Asset Quality – Disciplined underwriting and prudent credit management are parts of the ASRV risk management culture – Work to maintain excellent asset quality and avoid unusual volatility in loan loss provision

62 AmeriServ Strategic Shareholder Goal Strong Capital Returns to Shareholders – Strategic plan goal – Return 75% of earnings to shareholders through a combination of dividends and share repurchases – Subject to maintaining sufficient capital to support balance sheet growth

63 AmeriServ Strategic Shareholder Goal Strong Capital Returns to Shareholders – July 2016: Increased quarterly common stock cash dividend by ½ cent or 50% to $0.015 per share – January 2017: Announced a new common stock repurchase program that allows the company to buy back up to 5%, or approximately 945,000 shares of common stock during the next 18 months

64 AmeriServ Strategic Shareholder Goal Strong Capital Returns to Shareholders – Buyback program off to a strong start by repurchasing 251,800 shares at a total cost of $992,000 – an average price per share of $3.94 in 1Q 2017 – Very accretive use of our capital given the fact that our most recent tangible book value per share is $4.48
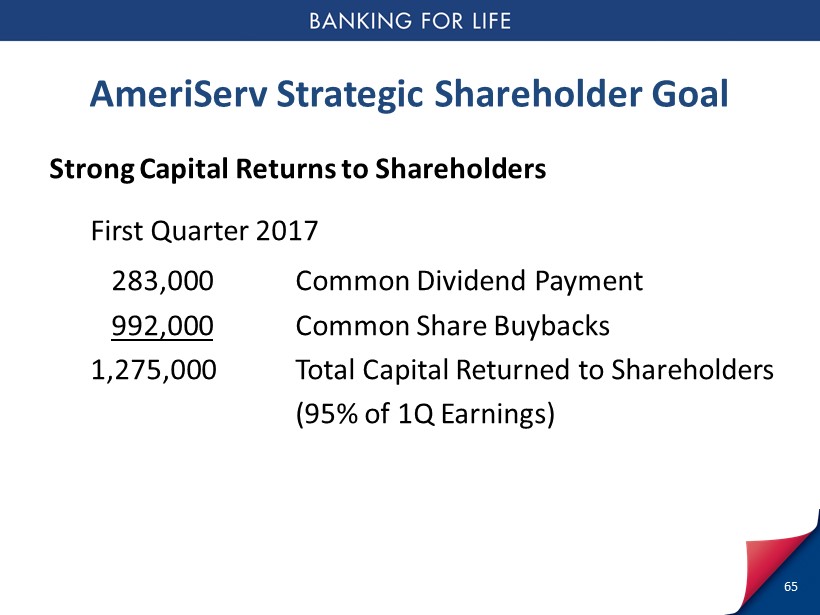
65 AmeriServ Strategic Shareholder Goal Strong Capital Returns to Shareholders First Quarter 2017 283,000 Common Dividend Payment 992,000 Common Share Buybacks 1,275,000 Total Capital Returned to Shareholders (95% of 1Q Earnings)
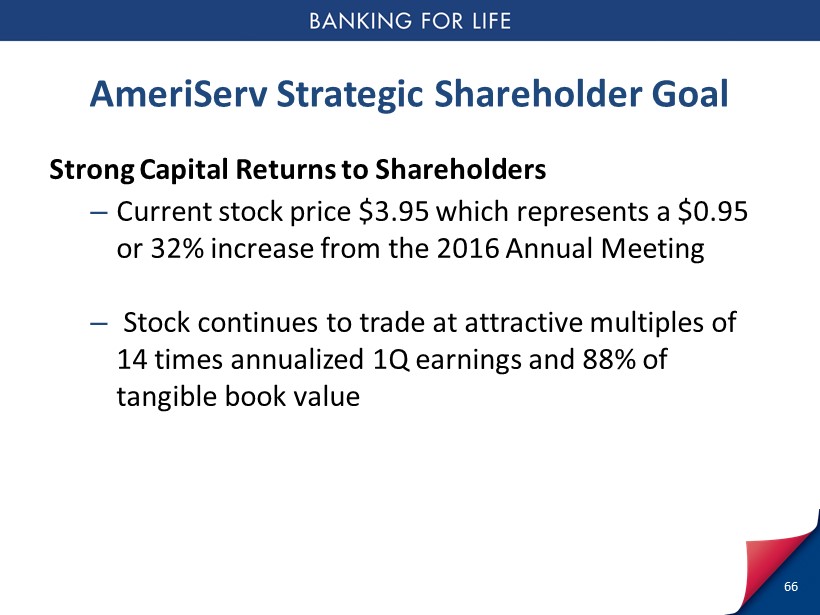
66 AmeriServ Strategic Shareholder Goal Strong Capital Returns to Shareholders – Current stock price $ 3.95 which represents a $ 0.95 or 32% increase from the 2016 Annual Meeting – Stock continues to trade at attractive multiples of 14 times annualized 1Q earnings and 88% of tangible book value

James Huerth President AmeriServ Trust & Financial Services Company 67

Mike Baylor Executive Vice President Chief Commercial Banking Officer 68

Report On Election 69

Question & Answer Period 70

BANKING FOR TODAY. BANKING FOR TOMORROW. BANKING FOR LIFE.