Attached files
| file | filename |
|---|---|
| 8-K - FORM 8-K - POPULAR, INC. | d374965d8k.htm |
Exhibit 99.1

Investor Presentation
First Quarter
2017
Forward-Looking Statements
This presentation contains “forward-looking statements” within the meaning of the Private Securities Litigation Reform Act of 1995. Forward-looking
statements are not historical facts, but instead represent only management’s beliefs regarding future events and current expectations, many of which, by their nature, are inherently uncertain and outside of the control of the Corporation. It is
possible that the Corporation’s actual results and financial condition may differ, possibly materially, from the anticipated results and financial condition indicated or implied in these forward-looking statements. Please refer to our Annual
Report on Form 10-K for the year ended December 31, 2016, and our other filings with the Securities and Exchange Commission for a discussion of some of the risks and important factors that could affect
the
Corporation’s future results and financial condition. Those filings are available on the Corporation’s website (www.popular.com) and on the
Securities and
Exchange Commission website (www.SEC.gov). The Corporation does not undertake to update or revise any forward-looking statement to reflect events or
circumstances that may arise after the date of such statements.
2
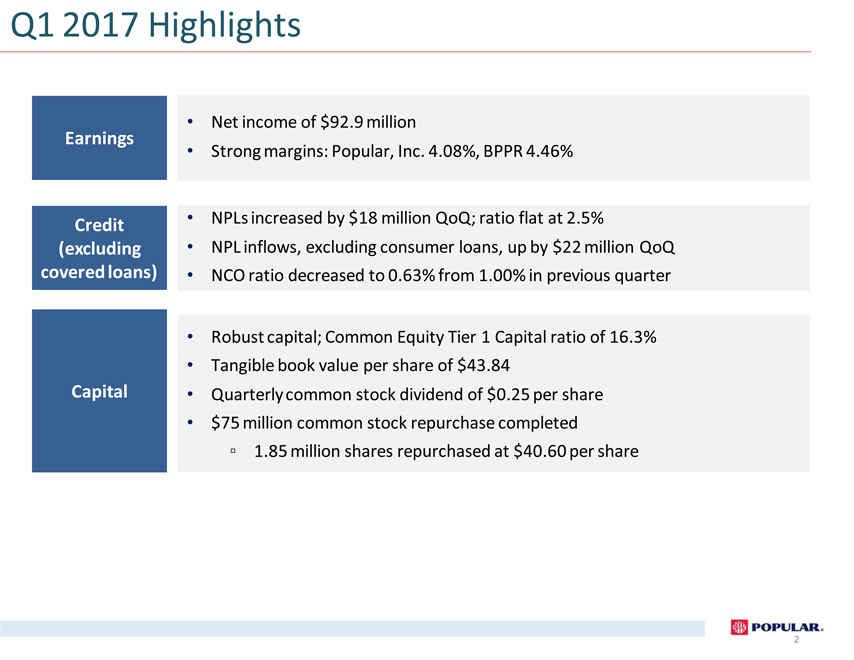
Q1 2017 Highlights
Net
income of $92.9 million
Earnings
Strong margins:
Popular, Inc. 4.08%, BPPR 4.46%
Credit NPLs increased by $18 million QoQ; ratio flat at 2.5%
(excluding NPL inflows, excluding consumer loans, up by $22 million QoQ
covered loans) NCO ratio decreased to 0.63% from 1.00% in previous quarter
Robust capital; Common Equity Tier 1 Capital ratio of 16.3%
Tangible book value per share of
$43.84
Capital Quarterly common stock dividend of $0.25 per share
$75 million common stock repurchase completed
1.85 million shares repurchased at
$40.60 per share
2
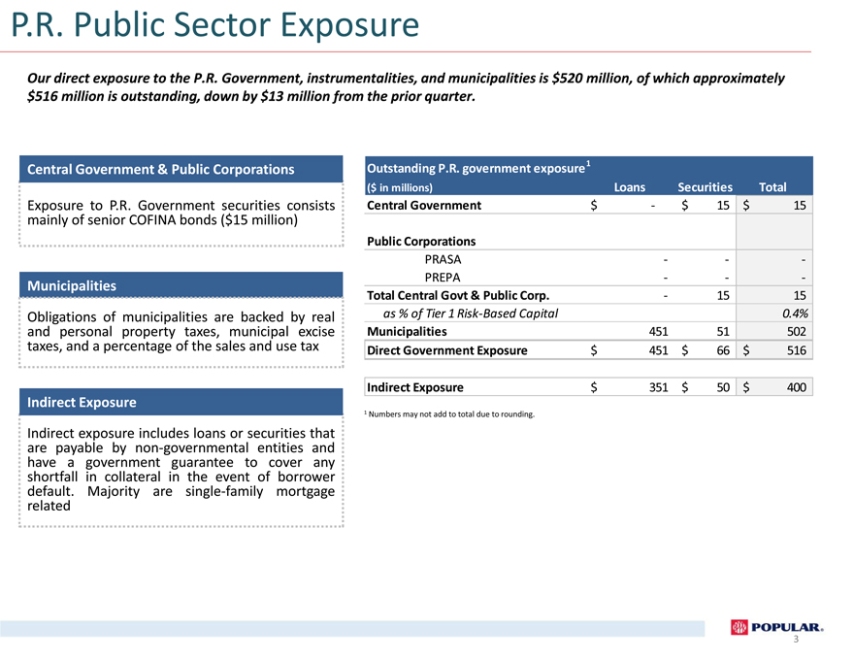
P.R. Public Sector Exposure
Our direct exposure to the P.R. Government, instrumentalities, and municipalities is $520 million, of which approximately $516 million is outstanding,
down by $13 million from the prior quarter.
Central Government & Public Corporations
Exposure to P.R. Government securities consists mainly of senior COFINA bonds ($15 million)
Municipalities
Obligations of municipalities are backed by real and personal
property taxes, municipal excise taxes, and a percentage of the sales and use tax
Indirect Exposure
Indirect exposure includes loans or securities that are payable by non-governmental entities and have a government guarantee to cover any
shortfall in collateral in the event of borrower default. Majority are single-family mortgage related
Outstanding P.R. government exposure
1
($ in millions) LoansSecuritiesTotal
Central Government $-$15$15
Public Corporations
PRASA ---
PREPA ---
Total Central Govt & Public Corp. -1515
as %
of Tier 1 Risk-Based Capital 0.4%
Municipalities 45151502
Direct Government Exposure $451$66$516
Indirect
Exposure $351$50$400
1 Numbers may not add to total due to rounding.
3
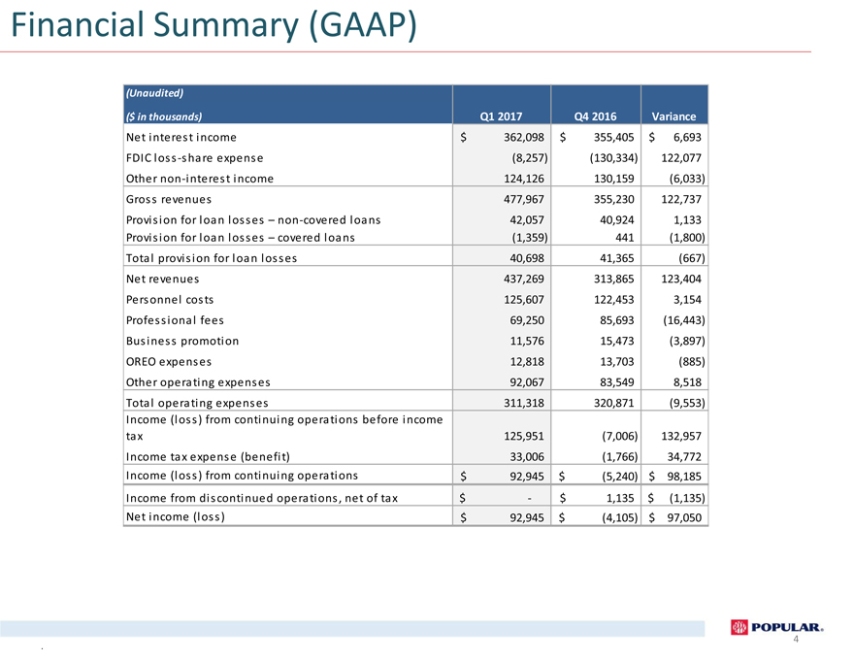
Financial Summary (GAAP)
(Unaudited)
($ in thousands)
Q1 2017Q4 2016Variance
Net interest income $362,098$355,405$6,693
FDIC loss -share expense (8,257)(130,334)122,077
Other non -interest
income 124,126130,159(6,033)
Gross revenues 477,967355,230122,737
Provision for loan losses – non -covered loans 42,05740,9241,133
Provision for loan losses – covered loans (1,359)441(1,800)
Total provision for loan losses 40,69841,365(667)
Net
revenues 437,269313,865123,404
Personnel costs 125,607122,4533,154
Professional fees 69,25085,693(16,443)
Business
promotion 11,57615,473(3,897)
OREO expenses 12,81813,703(885)
Other operating expenses 92,06783,5498,518
Total operating
expenses 311,318320,871(9,553)
Income (loss) from continuing operations before income
tax 125,951(7,006)132,957
Income tax expense
(benefit) 33,006(1,766)34,772
Income (loss) from continuing operations $92,945$(5,240)$98,185
Income from discontinued operations, net of tax $-$1,135$(1,135)
Net
income (loss) $92,945$(4,105)$97,050
4
GAAP Reconciliation-Q4 2016
GAAP Reconciliation-Q4 2016
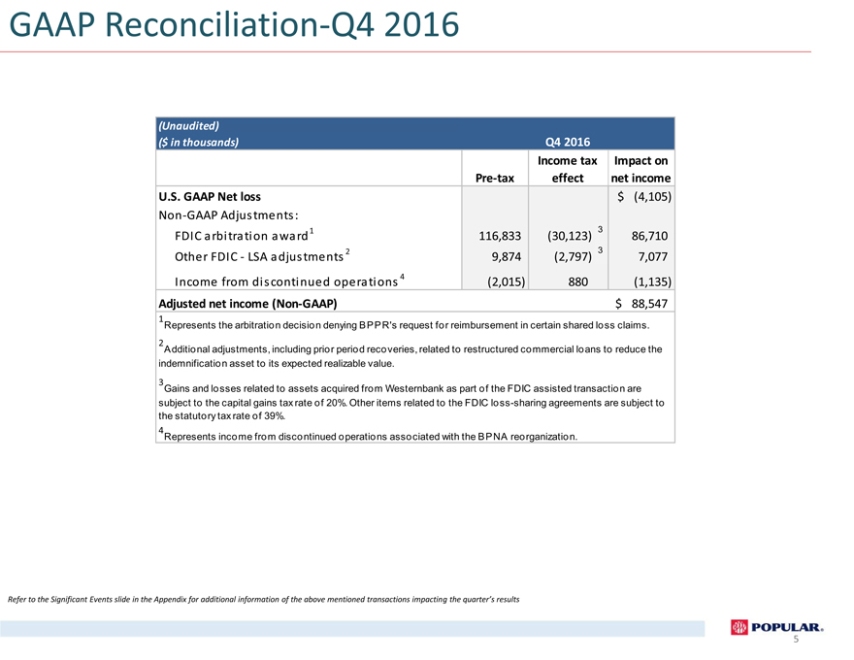
(Unaudited)
($ in thousands)
Q4 2016
Income taxImpact on
Pre-tax effectnet income
U.S. GAAP Net loss $(4,105)
Non -GAAP
Adjustments:
FDIC arbitration award 1 116,833 (30,123)386,710
Other FDIC—LSA adjustments 2 9,874 (2,797)37,077
Income from
discontinued operations 4 (2,015) 880(1,135)
Adjusted net income (Non-GAAP)
$88,547
1
Represents the arbitration decision denying BPPR’s request for
reimbursement in certain shared loss claims.
2
Additional adjustments,
including prior period recoveries, related to restructured commercial loans to reduce the indemnification asset to its expected realizable value.
3
Gains and losses related to assets acquired from Westernbank as part of the FDIC assisted transaction are subject to the capital gains tax rate of 20%. Other items related to the
FDIC loss-sharing agreements are subject to the statutory tax rate of 39%.
4
Represents income from discontinued operations associated with the BPNA reorganization.
Refer to the Significant Events slide in the Appendix for additional information of the above mentioned transactions impacting the quarter’s results
5
Capital
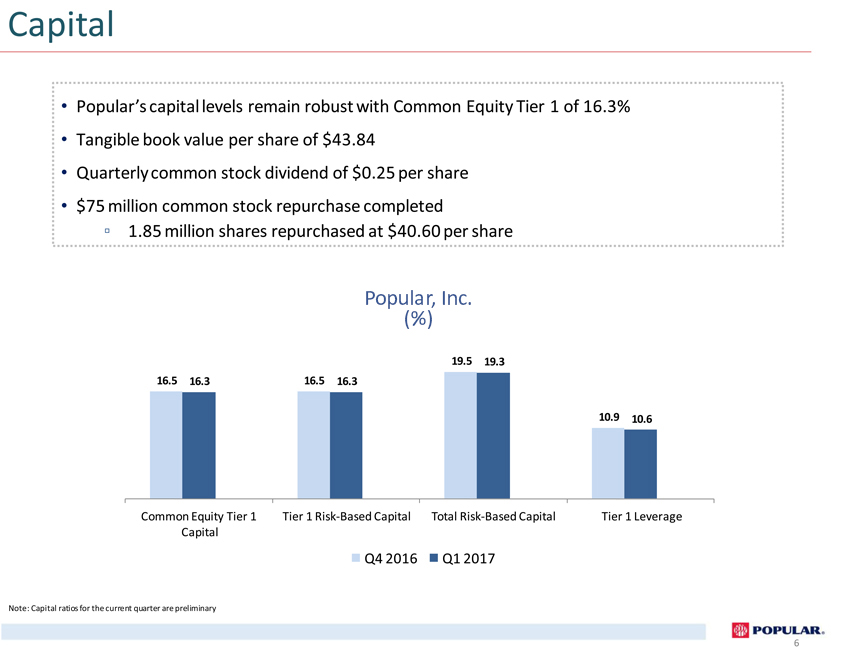
Capital
Popular’s capital levels remain robust with Common Equity Tier 1 of 16.3% Tangible book value per share of $43.84 Quarterly common stock dividend of $0.25 per
share
$75 million common stock repurchase completed
1.85 million
shares repurchased at $40.60 per share
Popular, Inc.
(%)
19.5 19.3
16.5 16.3 16.5 16.3
10.9 10.6
Common Equity Tier 1 Tier 1 Risk-Based Capital Total Risk-Based CapitalTier 1 Leverage
Capital
Q4 2016 Q1 2017
Note: Capital ratios for the current quarter are preliminary
6
Non-Performing Assets
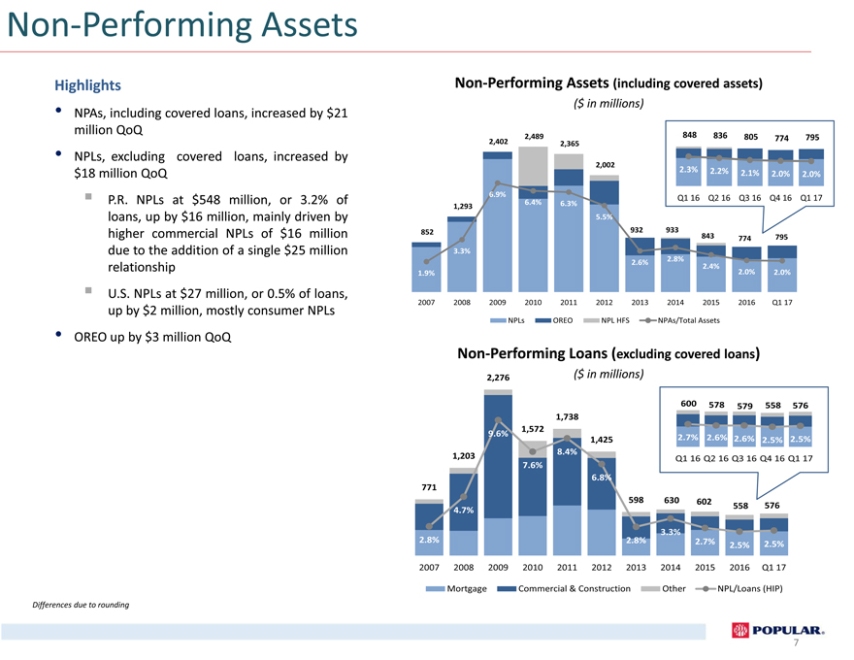
Highlights
NPAs, including covered loans, increased by $21 million QoQ
NPLs, excluding covered loans, increased by $18 million QoQ
?P.R. NPLs at
$548 million, or 3.2% of loans, up by $16 million, mainly driven by higher commercial NPLs of $16 million due to the addition of a single $25 million relationship ?U.S. NPLs at $27 million, or 0.5% of loans, up by
$2 million, mostly consumer NPLs
OREO up by $3 million QoQ
Non-Performing Assets (including covered assets)
($ in millions)
2,489848836805774795
2,4022,365
2,002
2.3%2.2%2.1%2.0%2.0%
6.9%Q1 16Q2 16Q3 16Q4 16Q1 17
1,293 6.4%6.3%
5.5%
852 932933843795
774
3.3%
2.6%2.8%
2.4%
1.9% 2.0%2.0%14.
2007 2008
20092010201120122013201420152016Q1 1712.
NPLsOREONPL HFSNPAs/Total Assets
Non-Performing Loans (excluding covered loans) 14.0%8.
2,276 ($ in millions)
12.0%6.
600 578 579 558576 4.
1,73810.0%
1,572
9.6% 2.
1,4252.7% 2.6% 2.6% 2.5%2.5%
8.0%
8.4%
1,203 Q1 16 Q2 16 Q3 16 Q4 16 Q1 17 0.
7.6%
6.8%6.0%
771
598630602
4.7% 558 5764.0%
3.3%
2.8% 2.8%2.7% 2.5% 2.5%2.0%
2007 2008 2009 2010 2011 2012 201320142015 2016 Q1 170.0%
Mortgage Commercial & ConstructionOtherNPL/Loans (HIP)
Differences due to rounding
7
NPL Inflows
Highlights
•Total NPL inflows up by $22 million QoQ
?P.R. commercial inflows,
up by $16 million, mainly driven by the addition of a single $25 million relationship ?P.R. mortgage inflows up by $6 million ?U.S. inflows flat QoQ
NPL Inflows
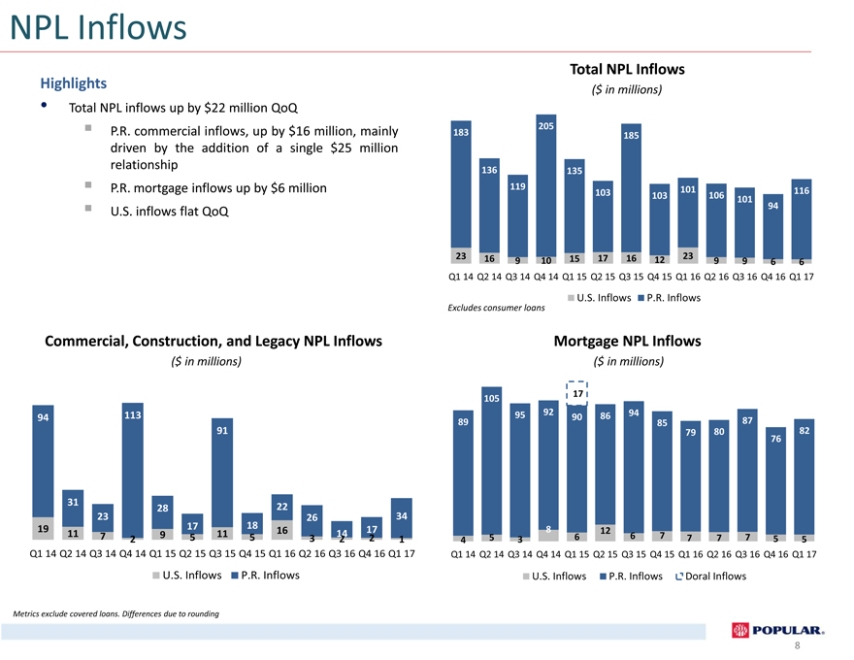
Highlights
Total NPL inflows up by $22 million QoQ
P.R. commercial inflows, up by $16 million,
mainly driven by the addition of a single $25 million relationship ?P.R. mortgage inflows up by $6 million ?U.S. inflows flat QoQ
Total NPL Inflows
($ in millions)
205
183 185
136 135
119101
103103106116
101
94
23 16 91015171612239966
Q1 14 Q2 14 Q3 14 Q4 14 Q1 15
Q2 15 Q3 15 Q4 15 Q1 16 Q2 16 Q3 16 Q4 16 Q1 17
U.S. InflowsP.R. Inflows
Excludes consumer loans
Commercial, Construction, and Legacy NPL
Inflows
($ in millions)
94 113
91
31 2822
23 2634
19 17181617
11 7 295115314 221
Q1 14 Q2 14 Q3 14 Q4 14 Q1 15 Q2 15 Q3 15 Q4 15 Q1
16 Q2 16 Q3 16 Q4 16 Q1 17
U.S. InflowsP.R. Inflows
Mortgage NPL Inflows
($ in millions)
105 17
9592908694
89 8587
798082
76
812
4 5 366777755
Q1 14 Q2 14 Q3 14 Q4 14 Q1 15 Q2 15 Q3 15 Q4 15 Q1 16 Q2 16 Q3 16 Q4 16 Q1 17
U.S. InflowsP.R. InflowsDoral Inflows
Metrics exclude covered loans. Differences due to
rounding
8
Additional Credit Metrics
Highlights
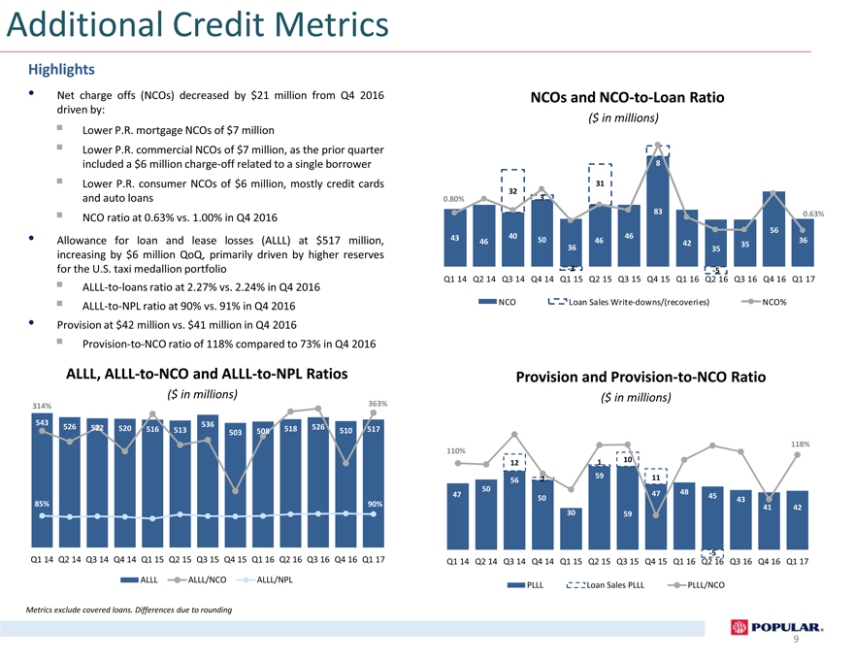
Net charge offs (NCOs) decreased by $21 million from Q4 2016
driven by:
Lower P.R. mortgage NCOs of $7 million
Lower P.R. commercial NCOs
of $7 million, as the prior quarter included a $6 million charge-off related to a single borrower Lower P.R. consumer NCOs of $6 million, mostly credit cards and auto loans NCO ratio at 0.63% vs. 1.00% in Q4 2016
Allowance for loan and lease losses (ALLL) at $517 million, increasing by $6 million QoQ, primarily driven by higher reserves for the U.S. taxi medallion portfolio
ALLL-to-loans ratio at 2.27% vs. 2.24% in Q4 2016 ALLL-to-NPL ratio at 90% vs. 91% in Q4 2016
Provision at $42 million vs. $41 million in Q4 2016
Provision-to-NCO ratio of
118% compared to 73% in Q4 2016
NCOs and NCO-to-Loan Ratio
($ in millions)
8
31
32
0.80% 3
830.63%
56
4346 40504646423536
3635
-3-5
Q1 14Q2 14 Q3 14Q4 14Q1 15 Q2 15Q3 15 Q4 15Q1 16 Q2 16Q3 16Q4 16 Q1 17
NCOLoan Sales Write-downs/(recoveries)NCO%
ALLL, ALLL-to-NCO and ALLL-to-NPL Ratios
($ in millions)
314% 363%
543 536
526 522 520 516513 503508 518 526 510 517
85% 90%
Q1 14 Q2 14 Q3 14 Q4 14 Q1 15Q2 15 Q3 15 Q4 15Q1 16 Q2 16 Q3 16 Q4 16 Q1 17
ALLLALLL/NCO ALLL/NPL
Provision and Provision-to-NCO Ratio
($ in millions)
118%
110%
12110
5625911
4750 474845
5043
4142
3059
-5
Q1 14Q2 14 Q3 14Q4 14 Q1 15Q2 15Q3 15 Q4 15Q1 16Q2 16 Q3 16 Q4 16Q1 17
PLLLLoan Sales
PLLLPLLL/NCO
Metrics exclude covered loans. Differences due to rounding
9
Driving Shareholder Value
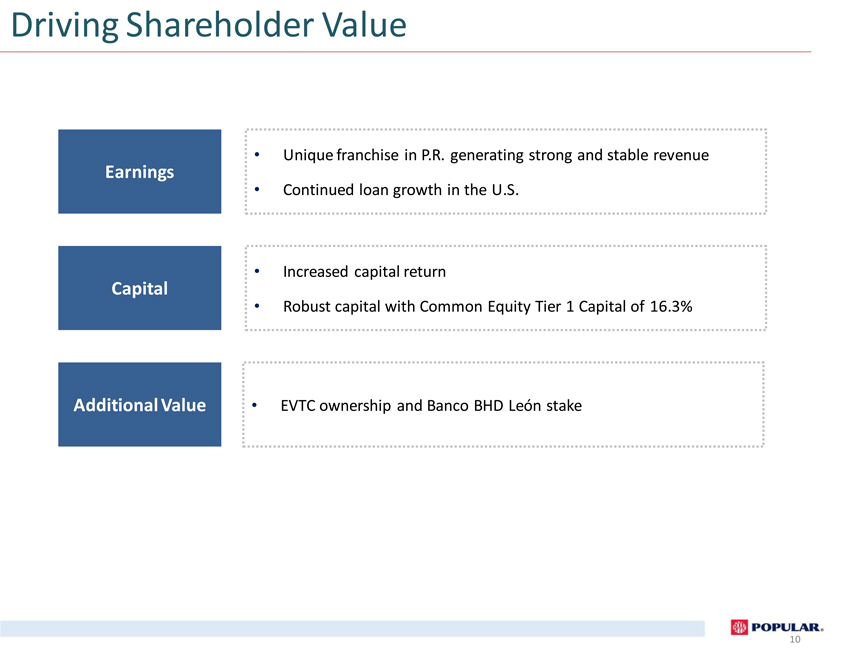
Earnings
Unique franchise in P.R. generating strong and stable revenue
Continued loan growth in the U.S.
Increased capital return
Robust capital with Common Equity Tier 1 Capital of 16.3%
EVTC ownership and Banco BHD
León stake
Capital
Additional Value
Investor Presentation First Quarter 2017 Appendix POPULAR.
Investor Presentation
First Quarter 2017
Appendix
Corporate Who We Are Structure – Popular, – Inc. Popular, Inc.
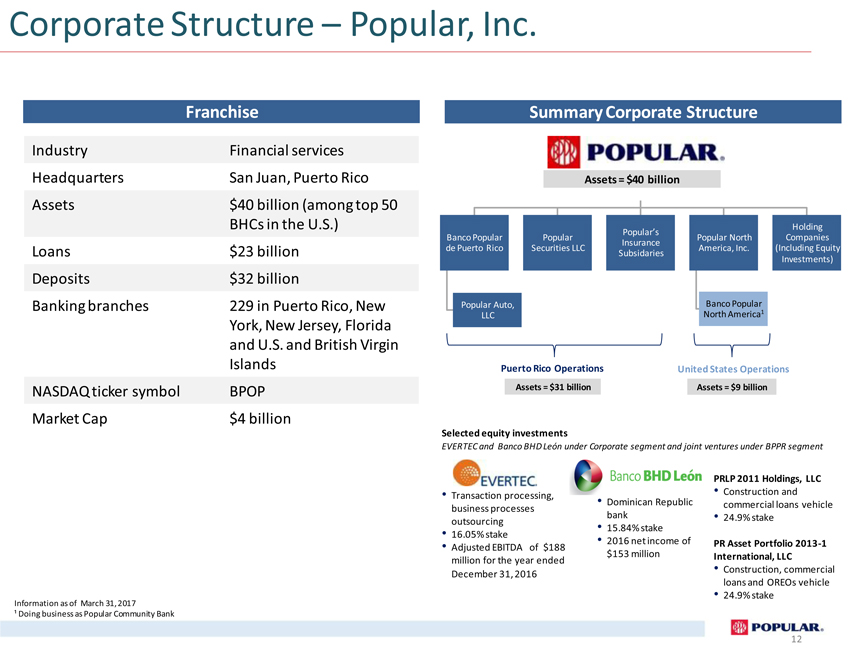
Franchise
Industry Headquarters Assets
Loans Deposits Banking branches
NASDAQ ticker symbol Market Cap
Financial services San Juan, Puerto Rico $40 billion (among top 50 BHCs in the U.S.) $23 billion $32 billion 229 in Puerto Rico, New York, New Jersey, Florida and
U.S. and British Virgin Islands BPOP $4 billion
Summary Corporate Structure
Assets = $40 billion
Popular’s Holding
Banco Popular Popular Popular NorthCompanies
Insurance
de Puerto
Rico Securities LLC America, Inc.(Including Equity
Subsidaries Investments)
Popular Auto, Banco Popular
LLC North America1
Puerto Rico Operations United States Operations
Assets
= $31 billion Assets = $9 billion
Selected equity investments
EVERTEC and Banco BHD León under Corporate segment and joint ventures under BPPR segment
Transaction processing, business processes outsourcing 16.05% stake
Adjusted EBITDA of $188 million for the year ended December 31, 2016
Dominican Republic bank 15.84% stake 2016 net income of $153 million
PRLP 2011 Holdings, LLC
Construction and
commercial loans vehicle
24.9% stake
PR Asset Portfolio 2013-1
International, LLC
Construction, commercial
loans and OREOs vehicle
24.9% stake
Information as of March 31, 2017
¹ Doing business as Popular Community Bank
12
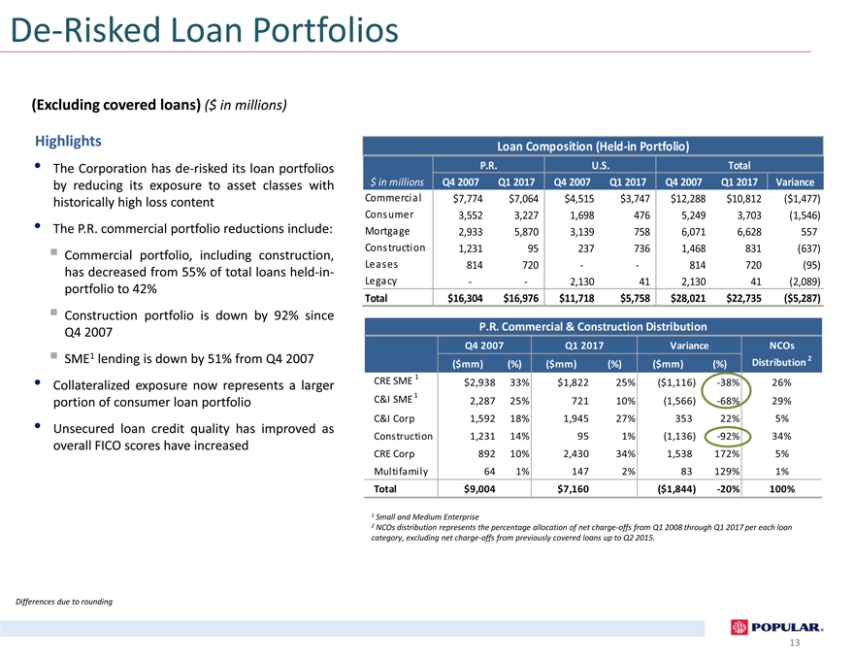
De-Risked Loan Portfolios
(Excluding covered loans) ($ in millions)
Highlights
The Corporation has de-risked its loan portfolios by reducing its exposure to asset classes with historically high loss content
The P.R. commercial portfolio reductions include:
Commercial portfolio, including
construction, has decreased from 55% of total loans held-in-portfolio to 42%
Construction portfolio is down by 92% since Q4 2007
SME1 lending is down by
51% from Q4 2007
Collateralized exposure now represents a larger portion of consumer loan portfolio
Unsecured loan credit quality has improved as overall FICO scores have increased
Loan
Composition (Held-in Portfolio)
P.R. U.S.Total
$ in millions Q4 2007 Q1 2017Q4 2007Q1 2017Q4 2007Q1 2017Variance
Commercial $7,774 $7,064$4,515$3,747$12,288$10,812($1,477)
Consumer 3,552 3,2271,6984765,2493,703(1,546)
Mortgage 2,933 5,8703,1397586,0716,628557
Construction 1,231 952377361,468831(637)
Leases 814 720--814720(95)
Legacy - -2,130412,13041(2,089)
Total $16,304 $16,976$11,718$5,758$28,021$22,735($5,287)
P.R. Commercial & Construction Distribution
Q4 2007 Q1 2017VarianceNCOs
($mm) (%)($mm)(%)($mm)(%)Distribution 2
CRE SME
1 $2,938 33%$1,82225%($1,116)-38%26%
C&I SME 1 2,287 25%72110%(1,566)-68%29%
C&I Corp 1,592 18%1,94527%35322%5%
Construction 1,231 14%951%(1,136)-92%34%
CRE
Corp 892 10%2,43034%1,538172%5%
Multifamily 64 1%1472%83129%1%
Total $9,004 $7,160($1,844)-20%100%
1 Small and Medium
Enterprise
2 NCOs distribution represents the percentage allocation of net charge-offs from Q1 2008 through Q1 2017 per each loan
category, excluding net charge-offs from previously covered loans up to Q2 2015.
Differences due to rounding
13
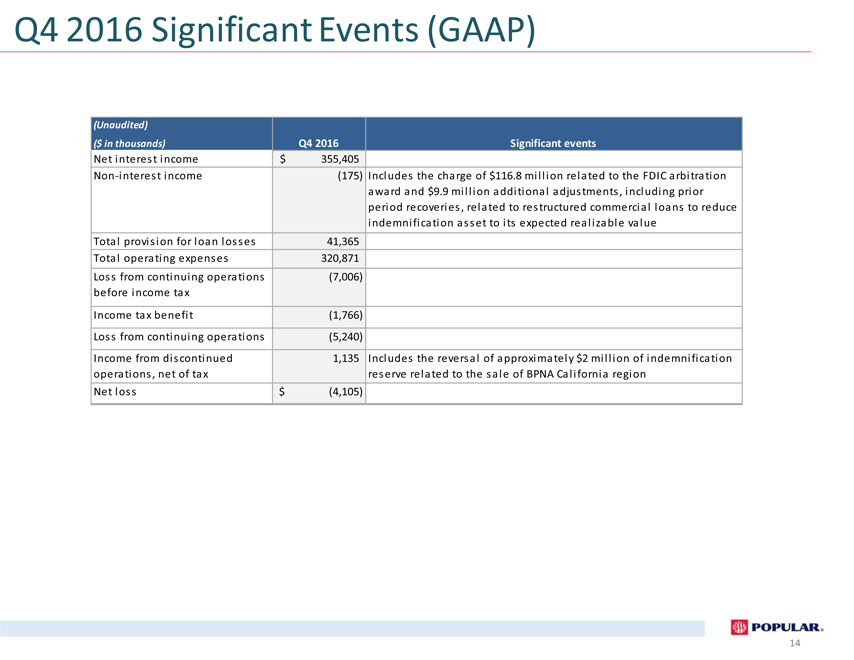
Q4 2016 Significant Events (GAAP)
(Unaudited)
($ in thousands) Q4
2016Significant events
Net interest income $355,405
Non -interest income (175)Includes the charge of $116.8 million related to the FDIC arbitration
award and $9.9 million additional adjustments, including prior
period recoveries, related
to restructured commercial loans to reduce
indemnification asset to its expected realizable value
Total provision for loan losses 41,365
Total operating
expenses 320,871
Loss from continuing operations (7,006)
before income tax
Income tax benefit (1,766)
Loss from continuing operations (5,240)
Income from
discontinued 1,135Includes the reversal of approximately $2 million of indemnification
operations, net of tax
reserve related to the sale of BPNA California region
Net loss $(4,105)
14
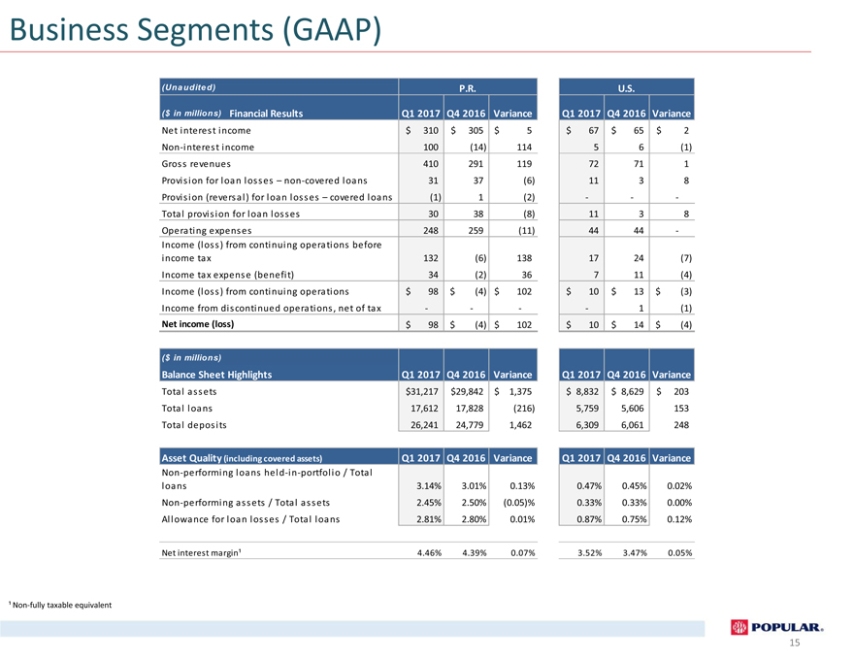
Business Segments (GAAP)
(Una udite d) P.R.U.S.
($ in millions) Financial
Results Q1 2017 Q4 2016VarianceQ1 2017Q4 2016Variance
Net interest income $310$305$5$67$65$2
Non-interest income 100(14)11456(1)
Gross revenues 41029111972711
Provision for loan losses – non-covered loans 3137(6)1138
Provision (reversal) for loan losses – covered
loans (1)1(2)---
Total provision for loan losses 3038(8)1138
Operating expenses 248259(11)4444-
Income (loss) from continuing
operations before
income tax 132(6)1381724(7)
Income tax expense (benefit) 34(2)36711(4)
Income (loss) from
continuing operations $98$(4)$102$10$13$(3)
Income from discontinued operations, net of tax ----1(1)
Net income (loss) $98$(4)$102$10$14$(4)
($ in
millions)
Balance Sheet Highlights Q1 2017 Q4 2016VarianceQ1 2017Q4 2016Variance
Total assets $31,217 $29,842$1,375$8,832$8,629$203
Total
loans 17,61217,828(216)5,7595,606153
Total deposits 26,24124,7791,4626,3096,061248
Asset Quality (including covered assets) Q1 2017 Q4 2016VarianceQ1 2017Q4 2016Variance
Non-performing loans held-in-portfolio /
Total
loans 3.14%3.01%0.13%0.47%0.45%0.02%
Non-performing assets / Total assets 2.45%2.50%(0.05)%0.33%0.33%0.00%
Allowance for loan losses / Total loans 2.81%2.80%0.01%0.87%0.75%0.12%
Net interest margin¹ 4.46%4.39%0.07%3.52%3.47%0.05%
¹ Non-fully taxable equivalent
15
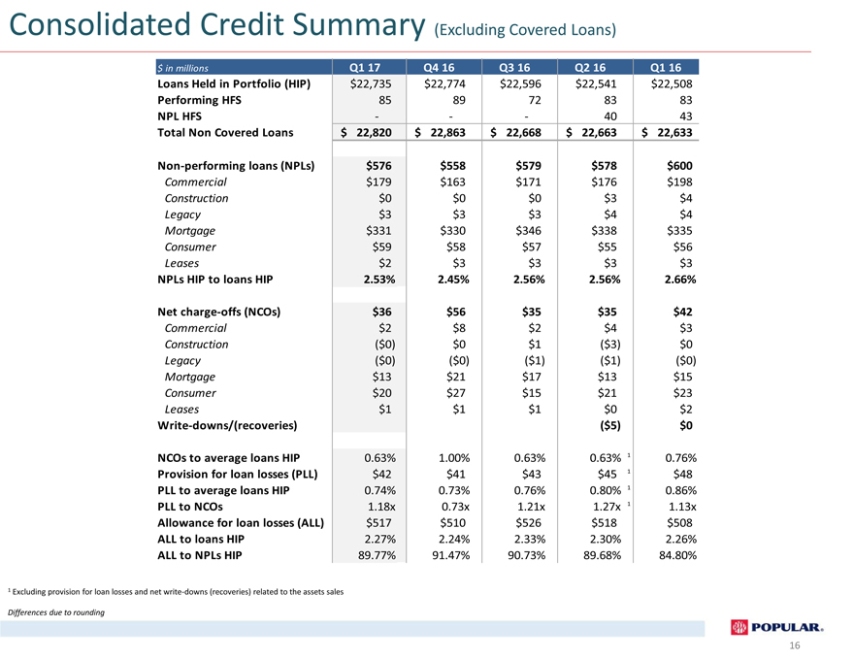
Consolidated Credit Summary (Excluding Covered Loans)
$ in millions Q1 17Q4 16Q3 16Q2 16Q1 16
Loans Held in Portfolio
(HIP) $22,735$22,774$22,596$22,541$22,508
Performing HFS 8589728383
NPL HFS ---4043
Total Non Covered
Loans $22,820$22,863$22,668$22,663$22,633
Non-performing loans (NPLs)
$576$558$579$578$600
Commercial $179$163$171$176$198
Construction $0$0$0$3$4
Legacy $3$3$3$4$4
Mortgage
$331$330$346$338$335
Consumer $59$58$57$55$56
Leases $2$3$3$3$3
NPLs HIP to loans
HIP 2.53%2.45%2.56%2.56%2.66%
Net charge-offs (NCOs) $36$56$35$35$42
Commercial $2$8$2$4$3
Construction
($0)$0$1($3)$0
Legacy ($0)($0)($1)($1)($0)
Mortgage $13$21$17$13$15
Consumer $20$27$15$21$23
Leases $1$1$1$0$2
Write-downs/(recoveries) ($5)$0
NCOs to average loans
HIP 0.63%1.00%0.63%0.63%10.76%
Provision for loan losses (PLL) $42$41$43$451$48
PLL to average loans HIP 0.74%0.73%0.76%0.80%10.86%
PLL to
NCOs 1.18x0.73x1.21x1.27x11.13x
Allowance for loan losses (ALL) $517$510$526$518$508
ALL to loans HIP 2.27%2.24%2.33%2.30%2.26%
ALL to NPLs
HIP 89.77%91.47%90.73%89.68%84.80%
1 Excluding provision for loan losses and net write-downs (recoveries) related to the assets sales
Differences due to rounding
16
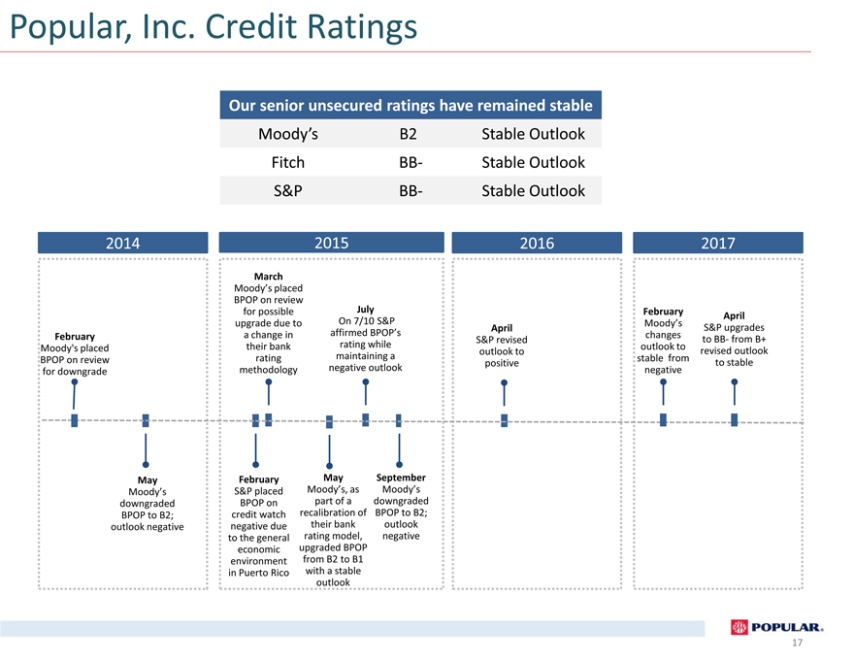
Popular, Inc. Credit Ratings
Our senior unsecured ratings have remained stable
Moody’s B2
Stable Outlook
Fitch BB- Stable Outlook
S&P BB- Stable Outlook
2014 201520162017
March
Moody’s placed
BPOP on
review
for possible JulyFebruaryApril
upgrade due to On 7/10 S&P Moody’s
AprilS&P upgrades
February a change in affirmed BPOP’sS&P revisedchangesto BB- from B+
Moody’s placed their bank rating whileoutlook tooutlook torevised outlook
BPOP on review rating maintaining apositivestable fromto stable
for
downgrade methodology negative outlooknegative
May February MaySeptember
Moody’s S&P placed Moody’s, asMoody’s
downgraded BPOP on part of adowngraded
BPOP to
B2; credit watch recalibration ofBPOP to B2;
outlook negative negative due their bankoutlook
to the general rating model,negative
economic upgraded BPOP
environment from B2 to B1
in Puerto
Rico with a stable
outlook
17

Investor Presentation
First Quarter
2017