Attached files
| file | filename |
|---|---|
| 8-K - 8-K - NORTHERN TRUST CORP | form8-k.htm |
1 northerntrust.com | © 2017 Northern Trust
2017 Annual
Meeting of
Stockholders
NORTHERN TRUST CORPORATION
April 25, 2017
Frederick H. Waddell
Chairman &
Chief Executive Officer
Reminder:
Use of cameras, recording
devices, cell phones and
other electronic equipment
is strictly prohibited.
Thank you.
Michael G. O’Grady
President
2 northerntrust.com | © 2017 Northern Trust
2017 Annual
Meeting of
Stockholders
NORTHERN TRUST CORPORATION
April 25, 2017
Frederick H. Waddell
Chairman &
Chief Executive Officer
Michael G. O’Grady
President

3 northerntrust.com | © 2017 Northern Trust
FORWARD-LOOKING STATEMENTS
This presentation may include statements which constitute “forward-looking statements” within the
meaning of the safe harbor provisions of the Private Securities Litigation Reform Act of 1995. Forward-
looking statements are identified typically by words or phrases such as “believe,” “expect,” “anticipate,”
“intend,” “estimate,” “project,” “likely,” “plan,” “goal,” “target,” “strategy,” and similar expressions or future or
conditional verbs such as “may,” “will,” “should,” “would,” and “could”. Forward-looking statements include
statements, other than those related to historical facts, that relate to Northern Trust’s financial results and
outlook, capital adequacy, dividend policy, anticipated expense levels, spending related to technology and
regulatory initiatives, risk management policies, contingent liabilities, strategic initiatives, industry trends,
and expectations regarding the impact of recent legislation. These statements are based on Northern
Trust’s current beliefs and expectations of future events or future results, and involve risks and
uncertainties that are difficult to predict and subject to change. These statements are also based on
assumptions about many important factors, including the factors discussed in Northern Trust’s most
recent annual report on Form 10-K and other filings with the U.S. Securities and Exchange Commission,
all of which are available on Northern Trust’s website. We caution you not to place undue reliance on any
forward-looking statement as actual results may differ materially from those expressed or implied by
forward-looking statements. Northern Trust assumes no obligation to update its forward-looking
statements.

4 northerntrust.com | © 2017 Northern Trust
$8.9
trillion
$1.0
trillion
$121
billion
ASSETS UNDER
CUSTODY/
ADMINISTRATION
ASSETS UNDER
MANAGEMENT
BALANCE
SHEET
Client-Centric
and Globally
Integrated
NORTHERN TRUST CORPORATION
Service
Expertise
Integrity
Relentless drive to provide
exceptional service.
Resolving complex challenges
with multi-asset class capabilities.
Acting with the highest ethics, utmost
honesty and unfailing reliability.
As of 3/31/2017

5 northerntrust.com | © 2017 Northern Trust
2016 FINANCIAL PERFORMANCE
($ IN MILLIONS, EXCEPT EPS, ROE)
2016
2016
vs. 2015
Trust, Inv. & Other Servicing Fees $3,108 +4%
Total Revenue 4,962 +6%
Non-Interest Expense 3,471 +6%
Net Income 1,032 +6%
Earnings Per Share 4.32 +8%
Return on Common Equity 11.9% +0.4 pts
($ IN BILLIONS, Period-end)
Assets under Custody / Administration $8,541 +10%
Assets under Custody 6,721 +11%
Assets under Management 942 +8%

6 northerntrust.com | © 2017 Northern Trust
1ST QUARTER 2017 FINANCIAL PERFORMANCE
($ IN MILLIONS, EXCEPT EPS, ROE)
1Q17
1Q17
vs. 1Q16
Trust, Inv. & Other Servicing Fees $808 +8%
Total Revenue 1,284 +8%
Non-Interest Expense 894 +8%
Net Income 276 +13%
Earnings Per Share 1.09 +6%
Return on Common Equity 11.6% -- pts
($ IN BILLIONS, Period-end)
Assets under Custody / Administration $8,925 +13%
Assets under Custody 7,108 +14%
Assets under Management 1,001 +11%

7 northerntrust.com | © 2017 Northern Trust
PROFITABILITY AND RETURNS
Return on Equity
Pre-tax Margin
Noninterest Expense as a % of Trust & Investment Fees
As of March 31, 2017
8.6%
9.3% 9.5%
10.0%
11.5% 11.9% 11.6%
23.4%
30.4%
131%
111%
2011 2012 2013 2014 2015 2016 1Q
2017

8 northerntrust.com | © 2017 Northern Trust
2008 2009 2010 2011 2012 2013 2014 2015 2016
$326
$281 $280
$353
$450
$609
$792
$830
$755
Dividends
Share repurchases
CAPITAL RETURN TO SHAREHOLDERS
($ IN MILLIONS)
9 northerntrust.com | © 2017 Northern Trust
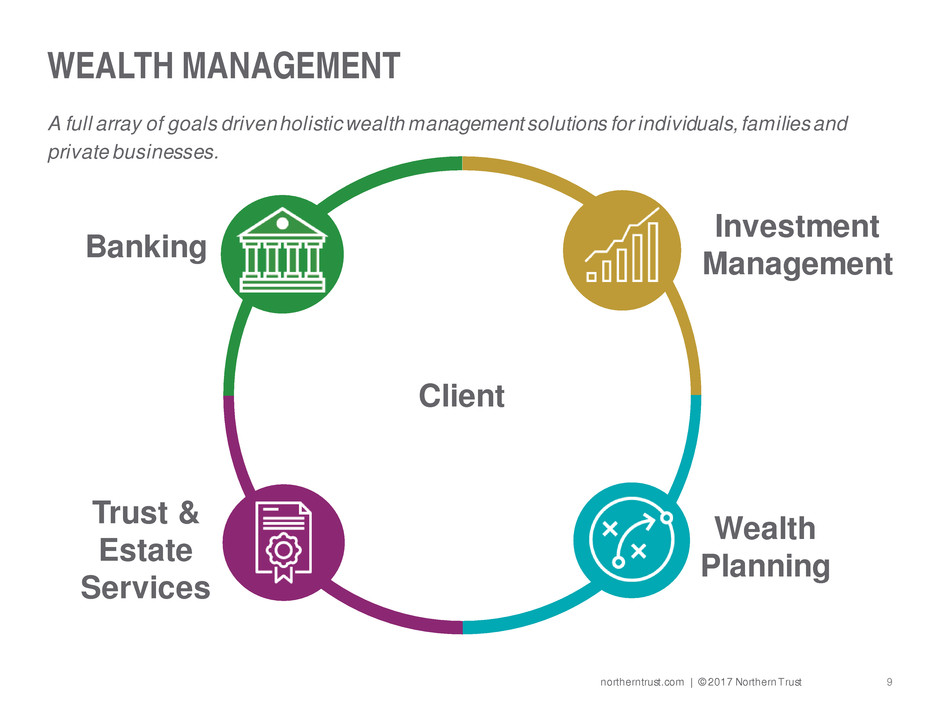
WEALTH MANAGEMENT
A full array of goals driven holistic wealth management solutions for individuals, families and
private businesses.
Client
Banking
Investment
Management
Trust &
Estate
Services
Wealth
Planning

10 northerntrust.com | © 2017 Northern Trust
GOALS DRIVEN WEALTH MANAGEMENT
An approach that aligns financial resources with personal goals creating an integrated strategy
that empowers a full understanding of how to achieve lifetime goals.
Banking
Trust &
Estate
Services
Investment
Management
Wealth
Planning
Client Client
Goals
11 northerntrust.com | © 2017 Northern Trust
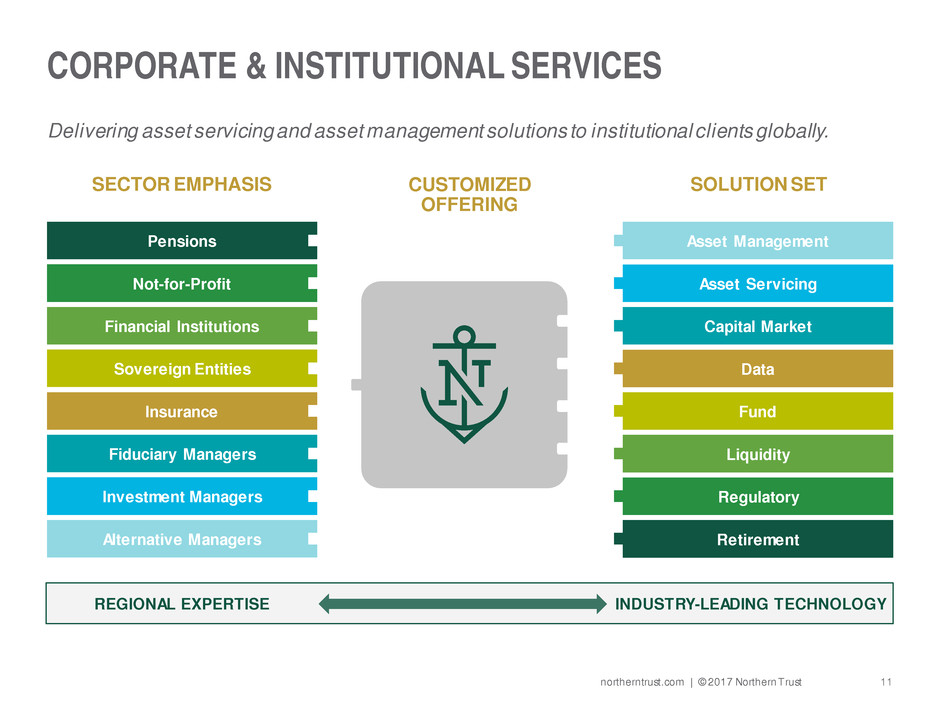
CORPORATE & INSTITUTIONAL SERVICES
Delivering asset servicing and asset management solutions to institutional clients globally.
SECTOR EMPHASIS SOLUTION SET CUSTOMIZED
OFFERING
Not-for-Profit
Pensions
Financial Institutions
Sovereign Entities
Insurance
Fiduciary Managers
Alternative Managers
Investment Managers
Asset Management
Asset Servicing
Capital Market
Data
Fund
Liquidity
Regulatory
Retirement
REGIONAL EXPERTISE INDUSTRY-LEADING TECHNOLOGY

12 northerntrust.com | © 2017 Northern Trust
CORPORATE & INSTITUTIONAL SERVICES
Delivering asset servicing and asset management solutions to institutional clients globally.
SECTOR EMPHASIS SOLUTION SET CUSTOMIZED
OFFERING
Sovereign Entities
Asset Management
Asset Servicing
Capital Market
Data
Fund
Liquidity
REGIONAL EXPERTISE INDUSTRY-LEADING TECHNOLOGY

13 northerntrust.com | © 2017 Northern Trust
ASSET MANAGEMENT
A leading global investment manager with a client-centric culture rooted in a fiduciary heritage.
Institutional
74% Equity
$517B
Fixed
Income
$462B
Other
$22B
Wealth & Retail
26%
Asset
Class
Client
Type
World’s 13th
largest asset
manager
$1.0 trillion
TOTAL ASSETS
UNDER MANAGEMENT
As of March 31, 2017. The above rankings are not indicative of future performance. Rankings are based on total worldwide assets under management of $875 bill ion as of December
31, 2015 by Pensions & Investments magazine’s 2016 Special Report on the Largest Money Managers.
$6.7
$8.4 $7.6
$11.8
$13.4
15 17
22
25 25
2013 2014 2015 2016 1Q 2017
Assets Under
Management ($B) No. of Funds
14 northerntrust.com | © 2017 Northern Trust
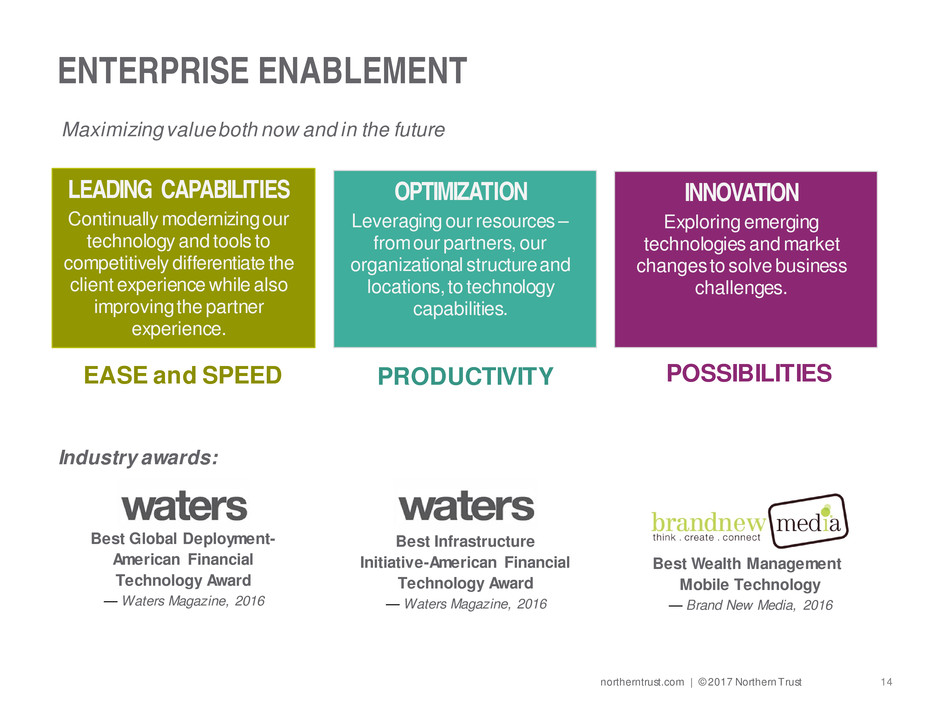
LEADING CAPABILITIES
Continually modernizing our
technology and tools to
competitively differentiate the
client experience while also
improving the partner
experience.
INNOVATION
Exploring emerging
technologies and market
changes to solve business
challenges.
ENTERPRISE ENABLEMENT
EASE and SPEED PRODUCTIVITY POSSIBILITIES
OPTIMIZATION
Leveraging our resources –
from our partners, our
organizational structure and
locations, to technology
capabilities.
Maximizing value both now and in the future
Best Wealth Management
Mobile Technology
— Brand New Media, 2016
Best Global Deployment-
American Financial
Technology Award
— Waters Magazine, 2016
Best Infrastructure
Initiative-American Financial
Technology Award
— Waters Magazine, 2016
Industry awards:
15 northerntrust.com | © 2017 Northern Trust
+8% +12% +9%
LONG-TERM SUCCESS THROUGH A FOCUSED STRATEGY
Relationship-focused strategy
Leader in attractive markets
History of organic growth
Proven record of investing for long-
term growth and profitability
ACHIEVE
GREATER

16 northerntrust.com | © 2017 Northern Trust
