Attached files
| file | filename |
|---|---|
| 8-K - CTBI 2017 SHAREHOLDERS' PRESENTATION 8-K - COMMUNITY TRUST BANCORP INC /KY/ | ctbi2017sharepresentation8k.htm |
Exhibit 99.1
Cautionary Statement Information provided herein by CTBI contains “forward-looking” information. CTBI cautions that any forward-looking statements made are not guarantees of future performance and that actual results may differ materially from those in the forward-looking statements. Please refer to CTBI’s 2016 Annual Report on Form 10-K, Cautionary Statement Regarding Forward Looking Statements for additional information. 2
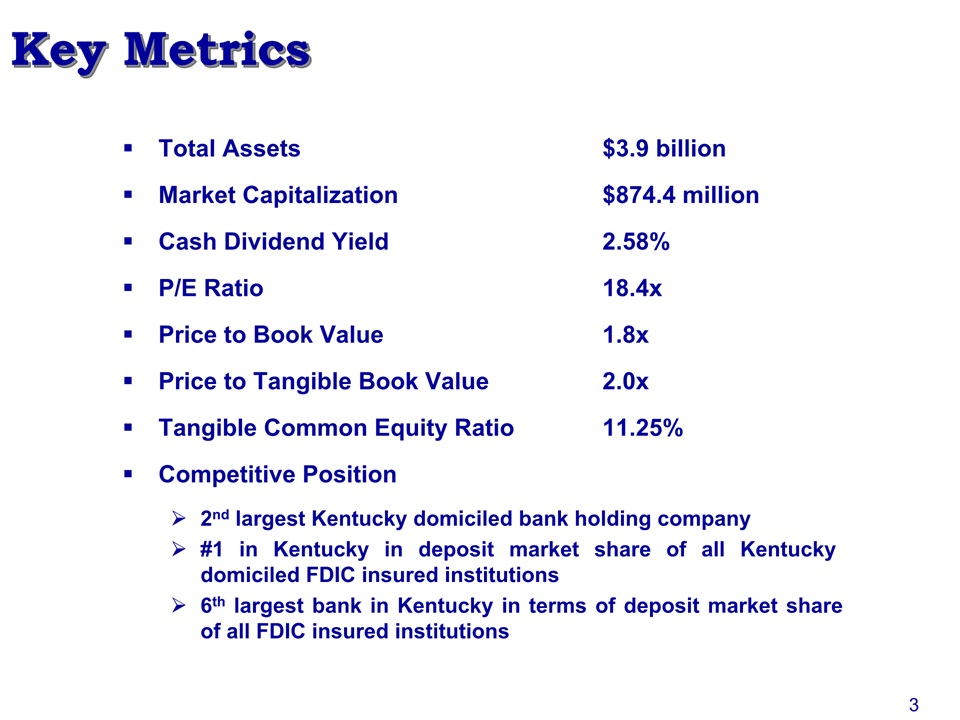
Key Metrics 3 Total Assets $3.9 billionMarket Capitalization $874.4 millionCash Dividend Yield 2.58%P/E Ratio 18.4xPrice to Book Value 1.8xPrice to Tangible Book Value 2.0xTangible Common Equity Ratio 11.25%Competitive Position2nd largest Kentucky domiciled bank holding company #1 in Kentucky in deposit market share of all Kentucky domiciled FDIC insured institutions 6th largest bank in Kentucky in terms of deposit market share of all FDIC insured institutions
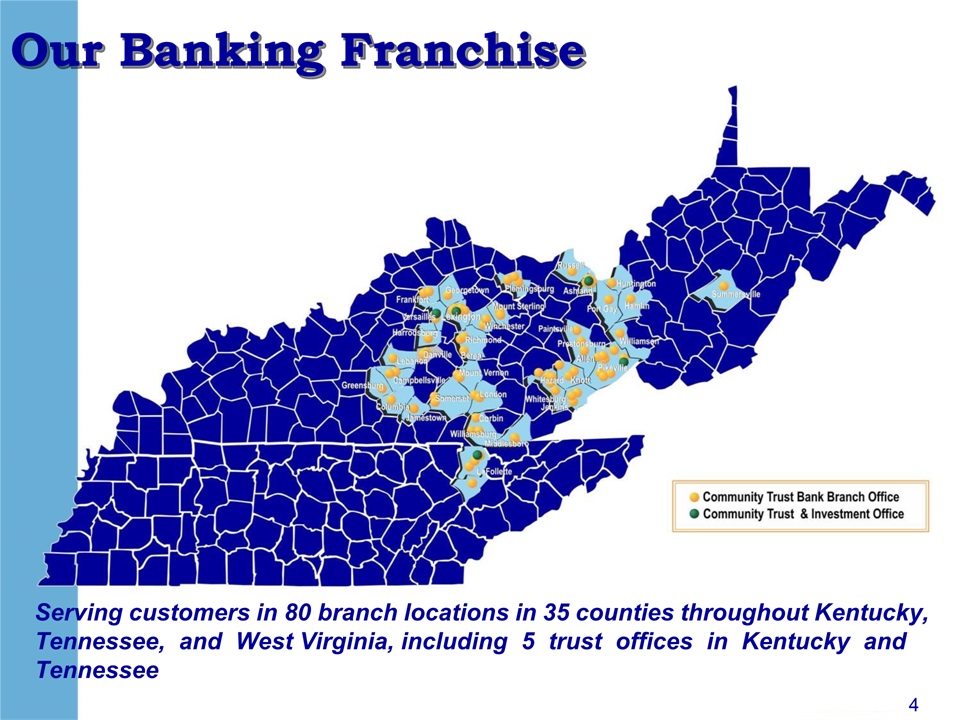
Our Banking Franchise Serving customers in 80 branch locations in 35 counties throughout Kentucky, Tennessee, and West Virginia, including 5 trust offices in Kentucky and Tennessee 4
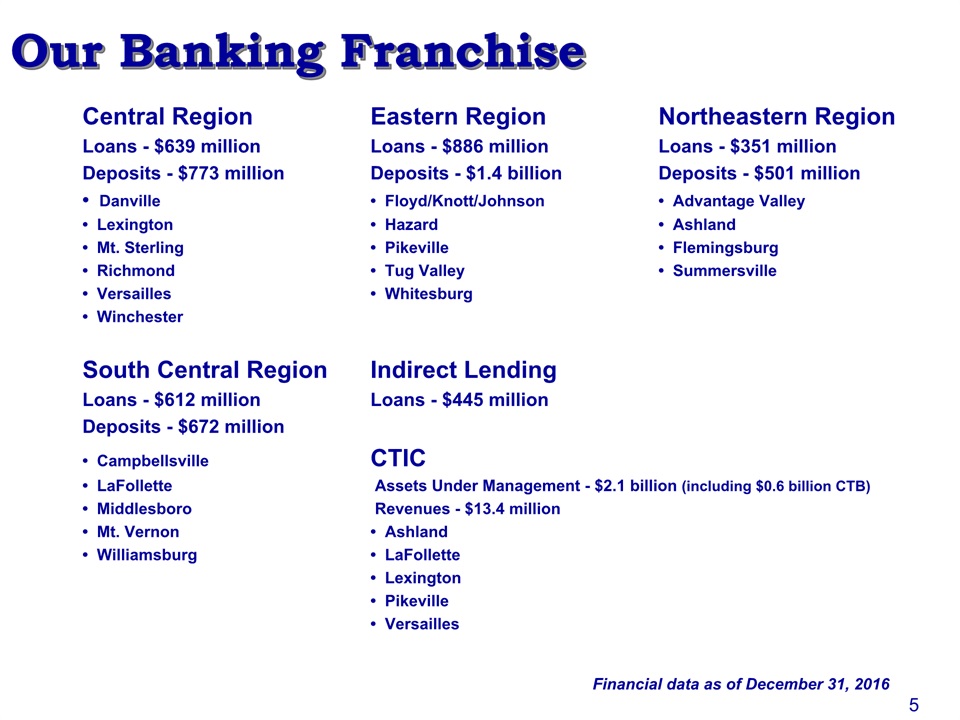
Our Banking Franchise Central Region Eastern Region Northeastern RegionLoans - $639 million Loans - $886 million Loans - $351 millionDeposits - $773 million Deposits - $1.4 billion Deposits - $501 million• Danville • Floyd/Knott/Johnson • Advantage Valley• Lexington • Hazard • Ashland• Mt. Sterling • Pikeville • Flemingsburg• Richmond • Tug Valley • Summersville• Versailles • Whitesburg• Winchester South Central Region Indirect LendingLoans - $612 million Loans - $445 million Deposits - $672 million• Campbellsville CTIC• LaFollette Assets Under Management - $2.1 billion (including $0.6 billion CTB)• Middlesboro Revenues - $13.4 million• Mt. Vernon • Ashland• Williamsburg • LaFollette • Lexington • Pikeville • Versailles Financial data as of December 31, 2016 5
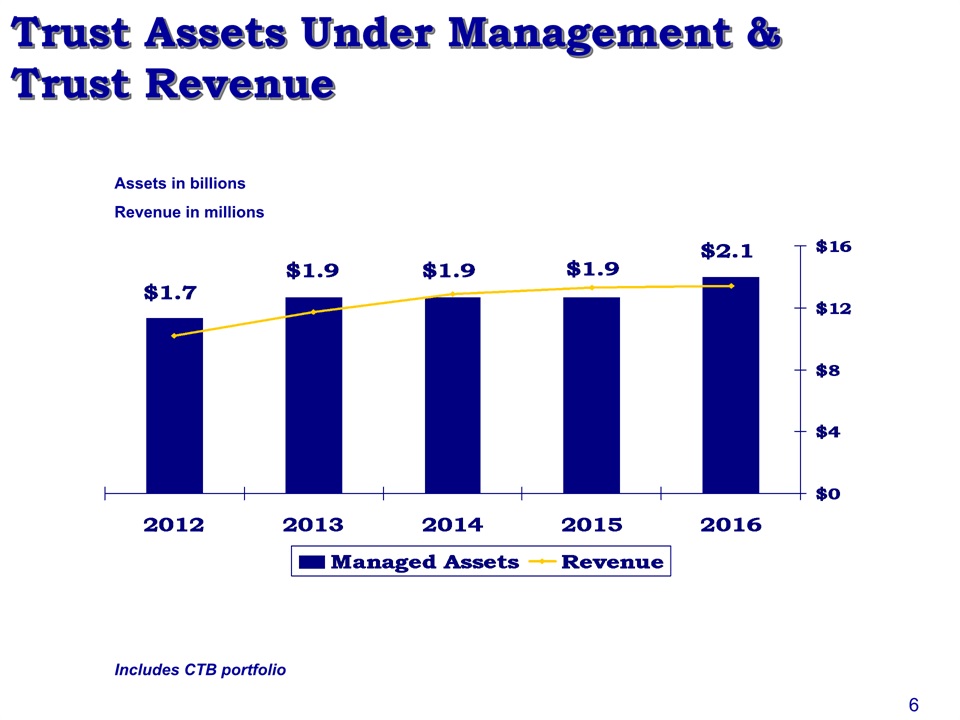
Trust Assets Under Management &Trust Revenue Assets in billionsRevenue in millions 6 Includes CTB portfolio
7 2016 Performance
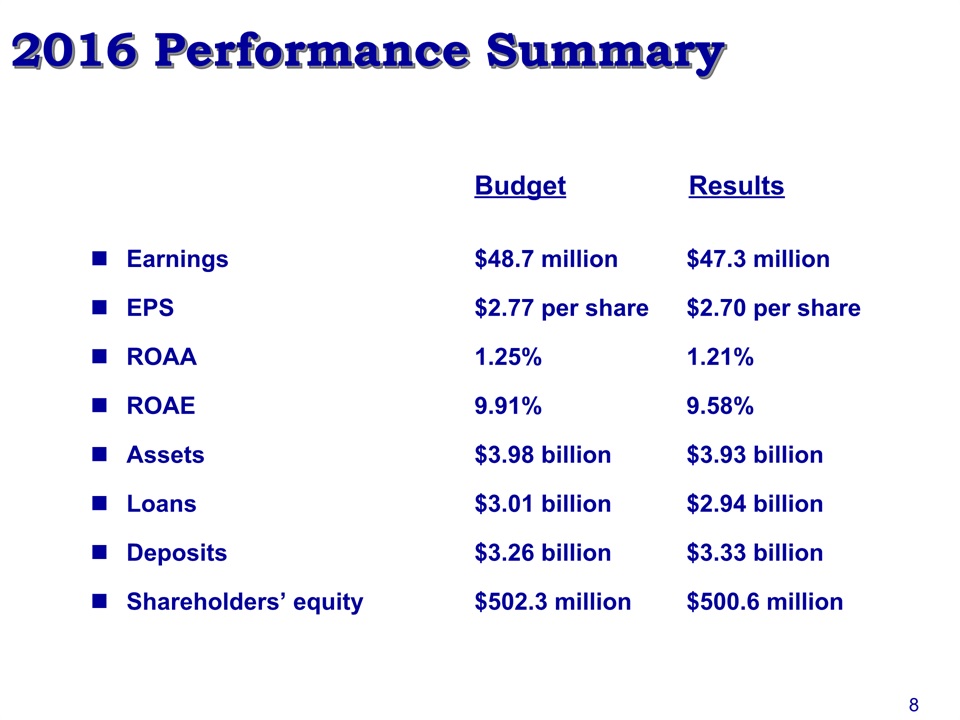
2016 Performance Summary Budget ResultsEarnings $48.7 million $47.3 millionEPS $2.77 per share $2.70 per shareROAA 1.25% 1.21%ROAE 9.91% 9.58%Assets $3.98 billion $3.93 billionLoans $3.01 billion $2.94 billionDeposits $3.26 billion $3.33 billionShareholders’ equity $502.3 million $500.6 million 8

Shareholder Value 9
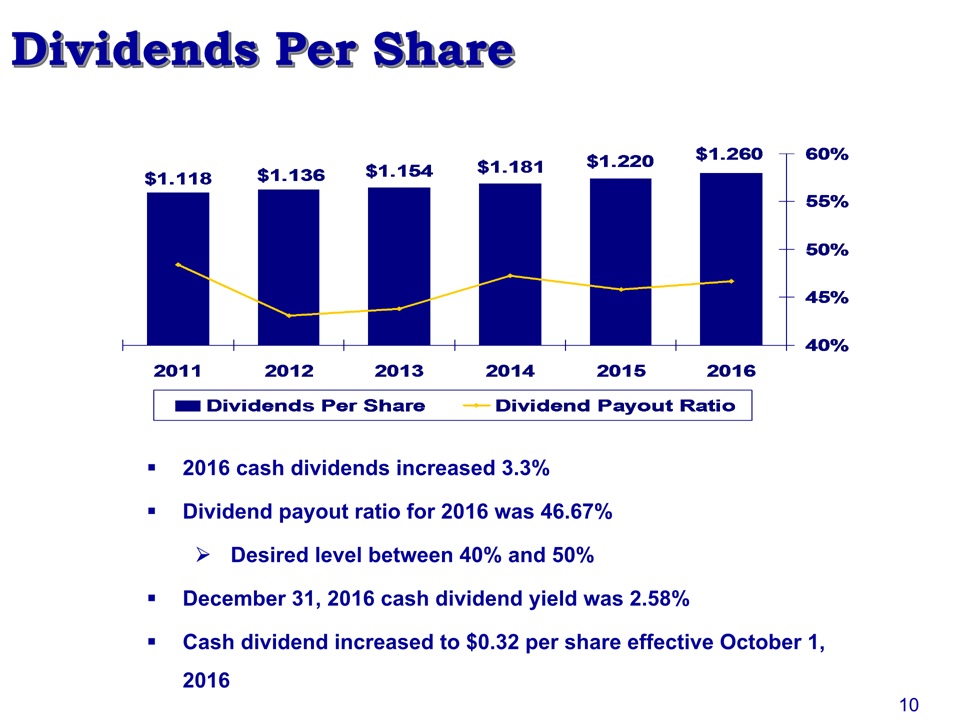
2016 cash dividends increased 3.3%Dividend payout ratio for 2016 was 46.67%Desired level between 40% and 50%December 31, 2016 cash dividend yield was 2.58%Cash dividend increased to $0.32 per share effective October 1, 2016 Dividends Per Share 10
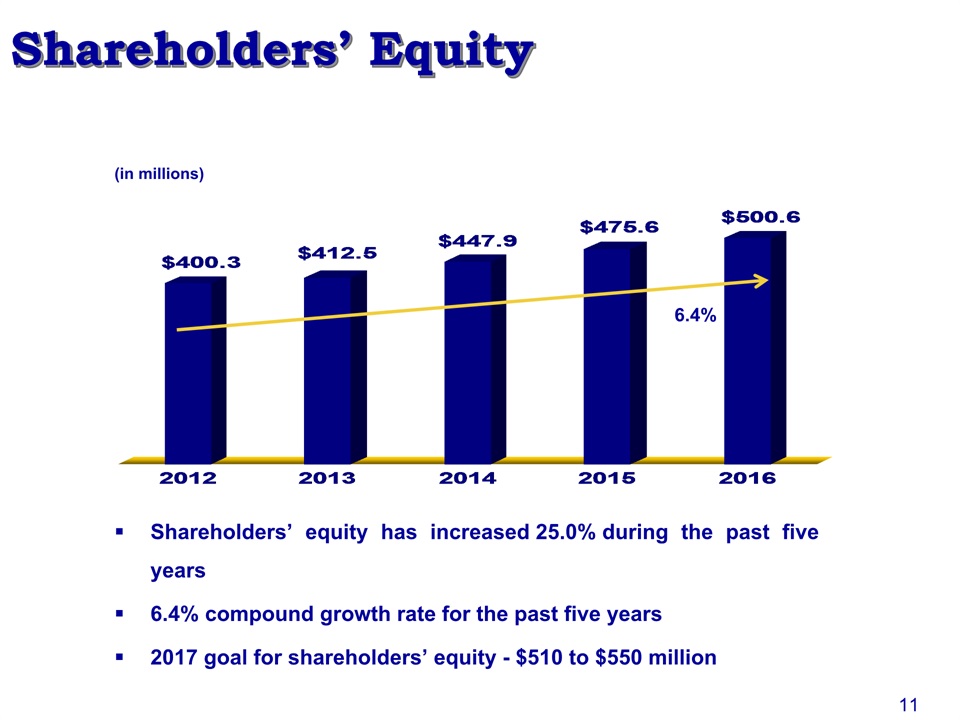
Shareholders’ Equity (in millions) Shareholders’ equity has increased 25.0% during the past five years6.4% compound growth rate for the past five years2017 goal for shareholders’ equity - $510 to $550 million 6.4% 11
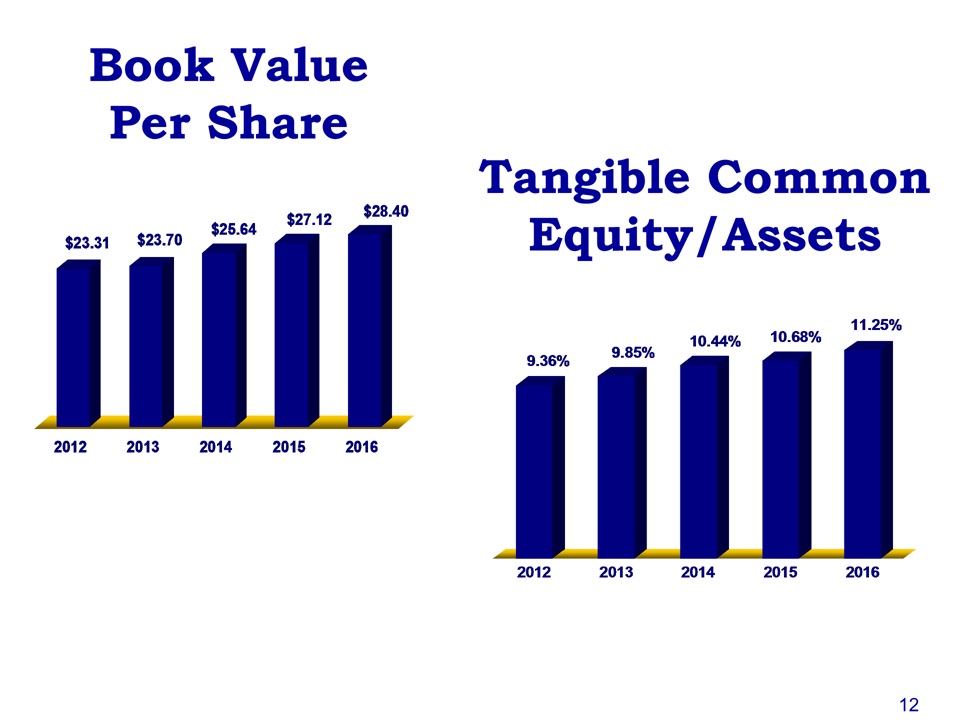
Book ValuePer Share Tangible Common Equity/Assets 12
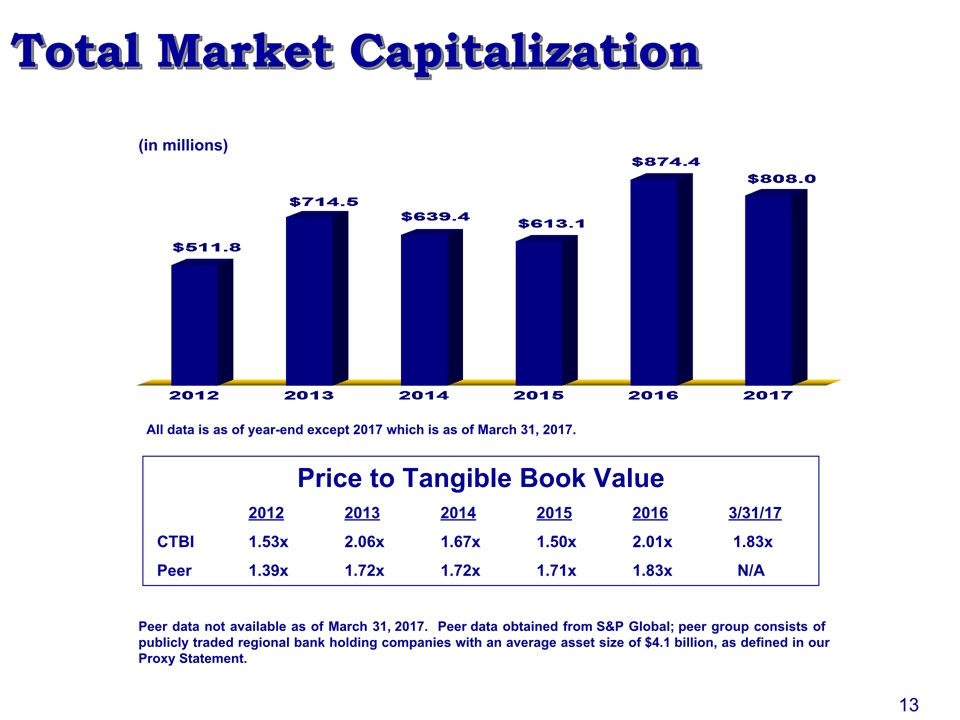
Total Market Capitalization Peer data not available as of March 31, 2017. Peer data obtained from S&P Global; peer group consists of publicly traded regional bank holding companies with an average asset size of $4.1 billion, as defined in our Proxy Statement. (in millions) Price to Tangible Book Value 2012 2013 2014 2015 2016 3/31/17 CTBI 1.53x 2.06x 1.67x 1.50x 2.01x 1.83x Peer 1.39x 1.72x 1.72x 1.71x 1.83x N/A 13 All data is as of year-end except 2017 which is as of March 31, 2017.
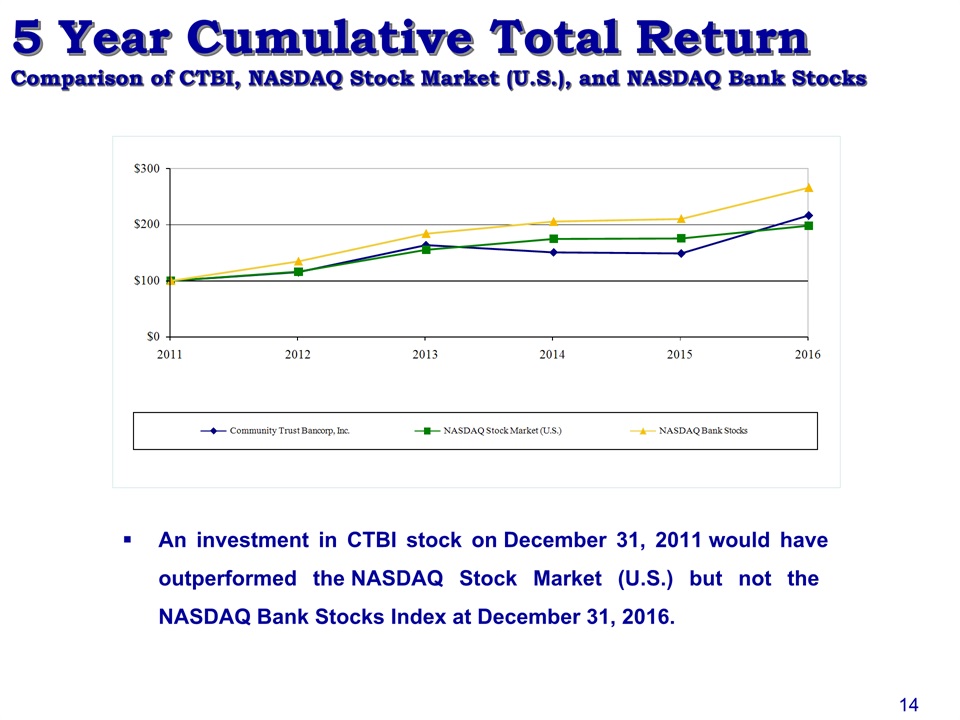
5 Year Cumulative Total ReturnComparison of CTBI, NASDAQ Stock Market (U.S.), and NASDAQ Bank Stocks An investment in CTBI stock on December 31, 2011 would have outperformed the NASDAQ Stock Market (U.S.) but not the NASDAQ Bank Stocks Index at December 31, 2016. 14
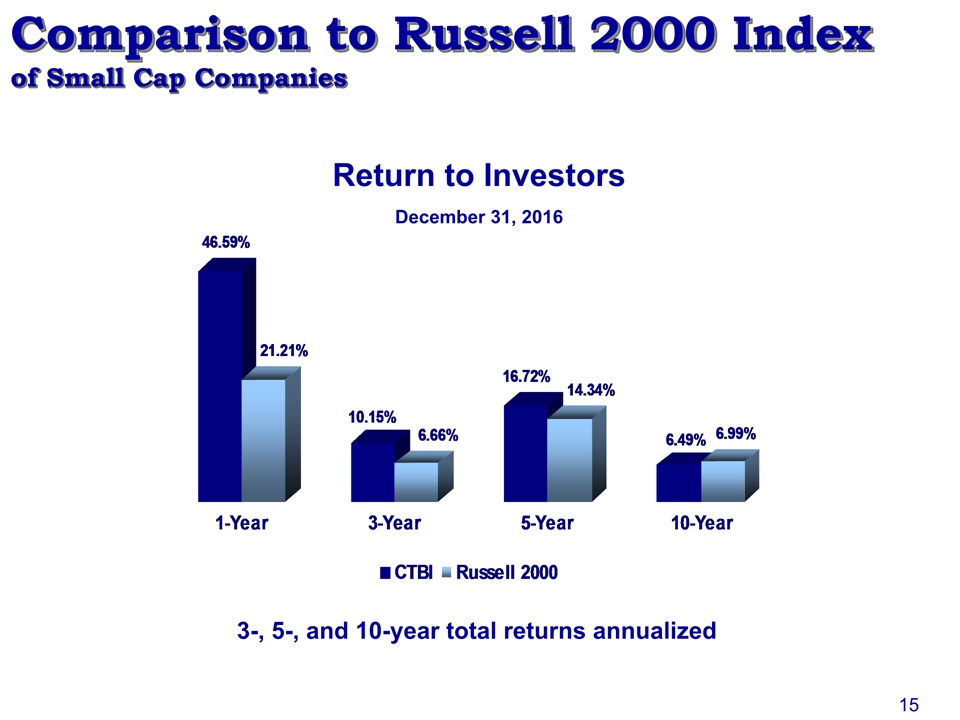
Comparison to Russell 2000 Indexof Small Cap Companies Return to Investors 3-, 5-, and 10-year total returns annualized December 31, 2016 15
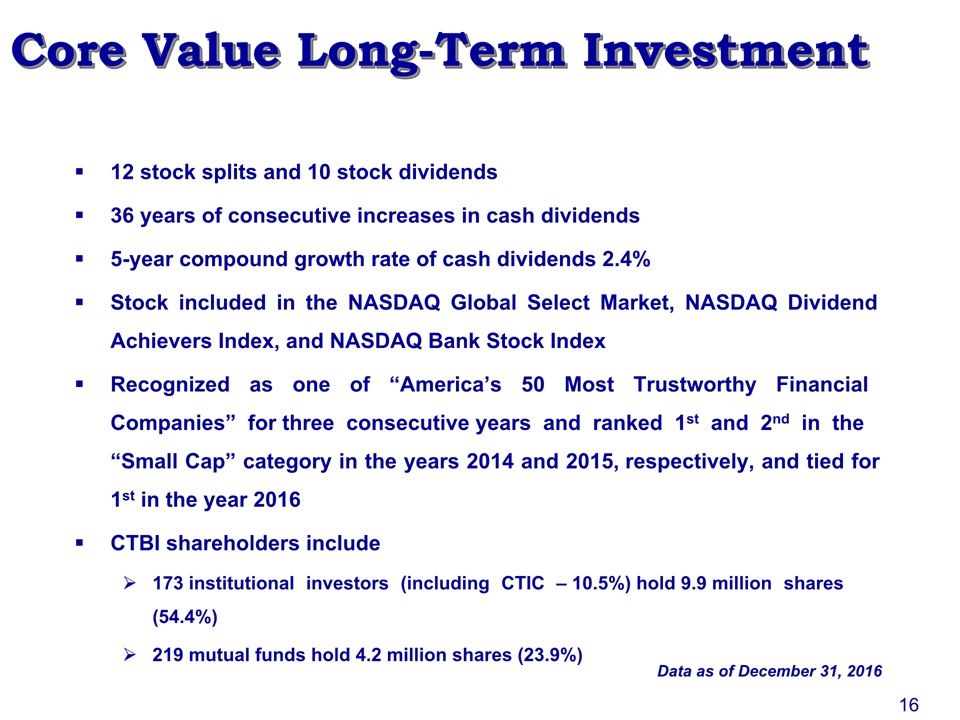
Core Value Long-Term Investment 12 stock splits and 10 stock dividends36 years of consecutive increases in cash dividends5-year compound growth rate of cash dividends 2.4%Stock included in the NASDAQ Global Select Market, NASDAQ Dividend Achievers Index, and NASDAQ Bank Stock IndexRecognized as one of “America’s 50 Most Trustworthy Financial Companies” for three consecutive years and ranked 1st and 2nd in the “Small Cap” category in the years 2014 and 2015, respectively, and tied for 1st in the year 2016CTBI shareholders include173 institutional investors (including CTIC – 10.5%) hold 9.9 million shares (54.4%)219 mutual funds hold 4.2 million shares (23.9%) Data as of December 31, 2016 16
Earnings Review 17
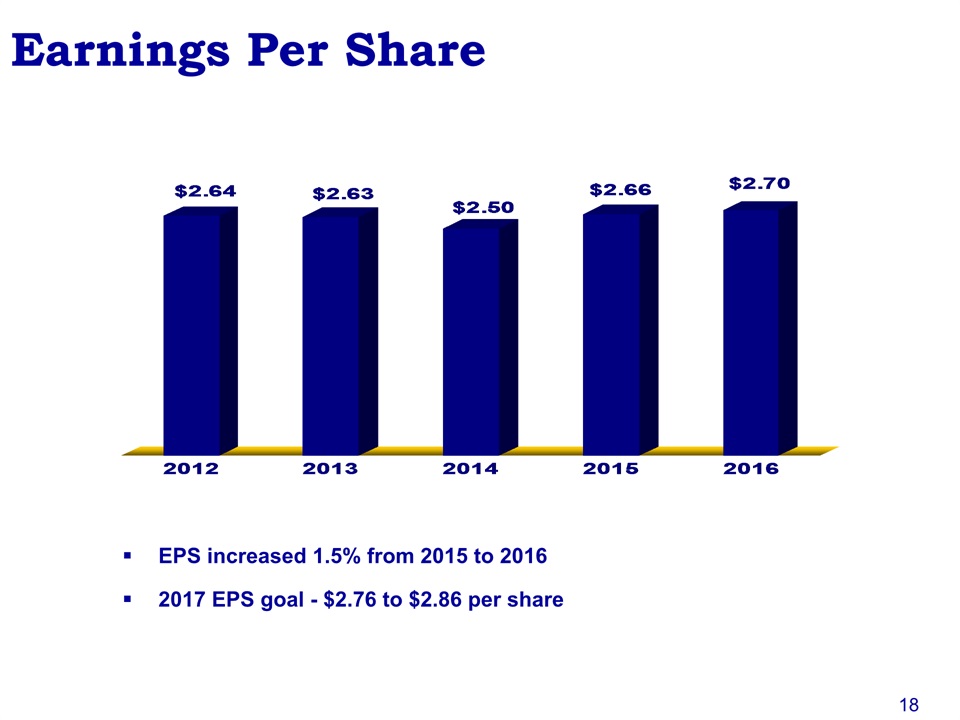
EPS increased 1.5% from 2015 to 20162017 EPS goal - $2.76 to $2.86 per share Earnings Per Share 18
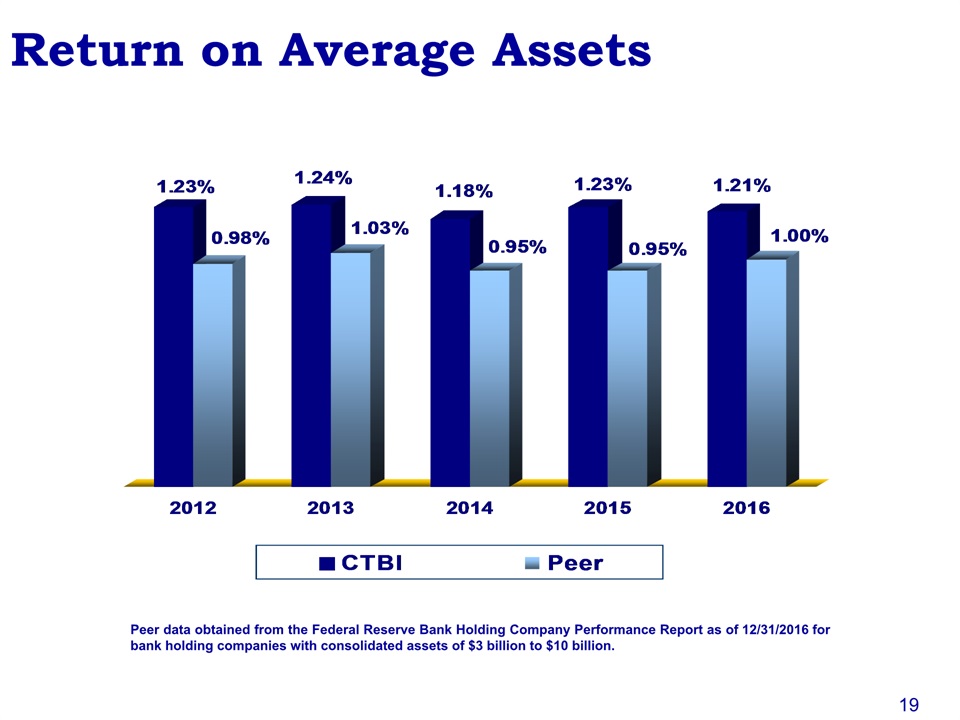
Return on Average Assets Peer data obtained from the Federal Reserve Bank Holding Company Performance Report as of 12/31/2016 for bank holding companies with consolidated assets of $3 billion to $10 billion. 19
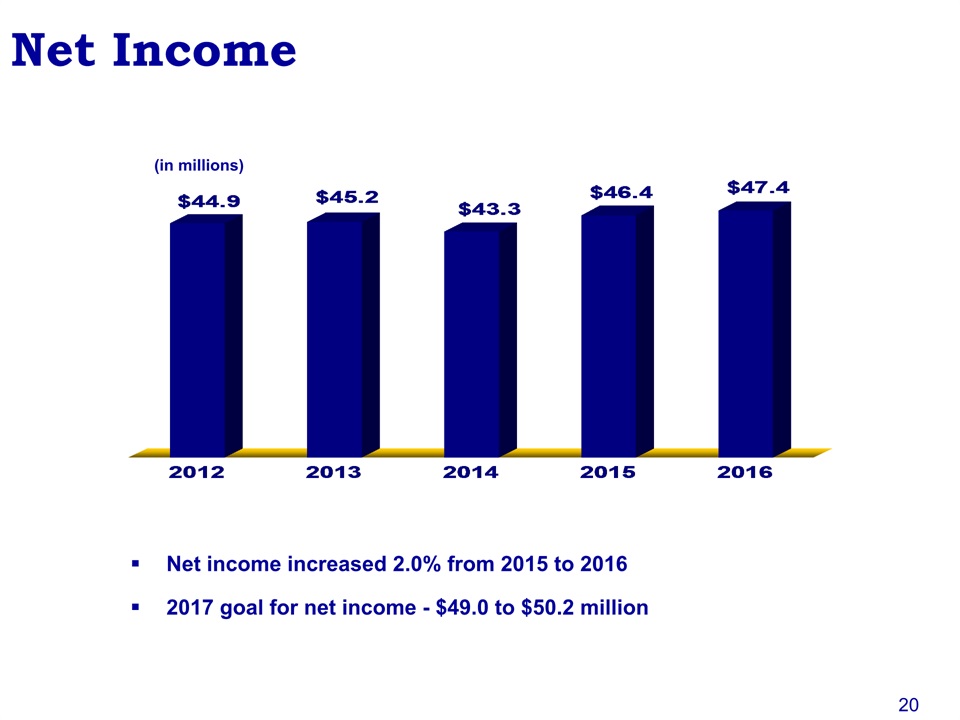
(in millions) Net Income Net income increased 2.0% from 2015 to 20162017 goal for net income - $49.0 to $50.2 million 20
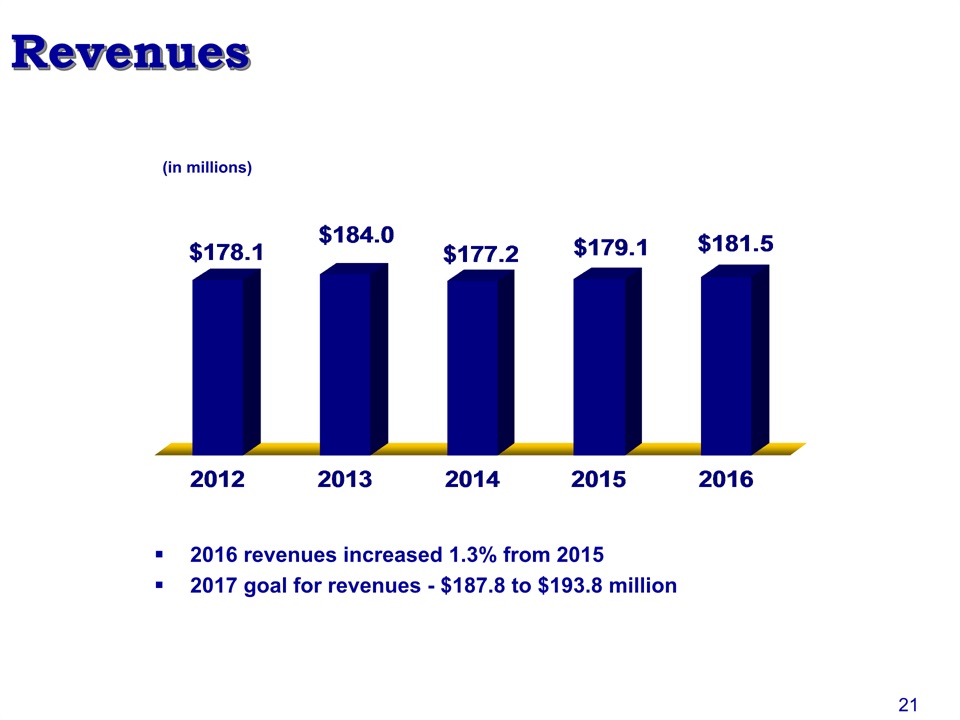
Revenues (in millions) 2016 revenues increased 1.3% from 20152017 goal for revenues - $187.8 to $193.8 million 21
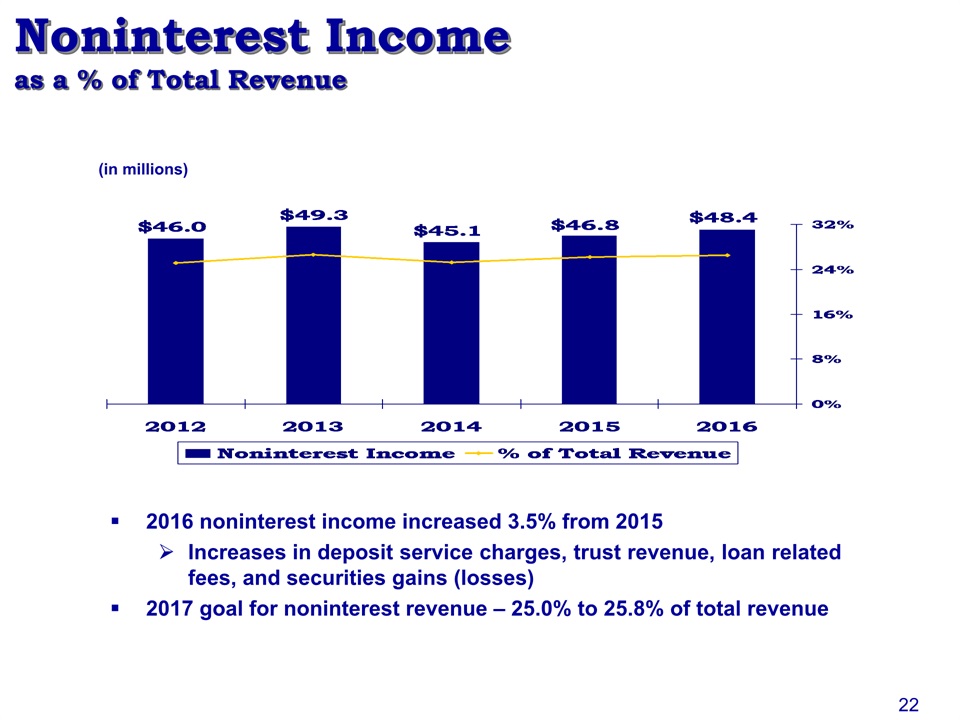
2016 noninterest income increased 3.5% from 2015Increases in deposit service charges, trust revenue, loan related fees, and securities gains (losses)2017 goal for noninterest revenue – 25.0% to 25.8% of total revenue Noninterest Incomeas a % of Total Revenue (in millions) 22
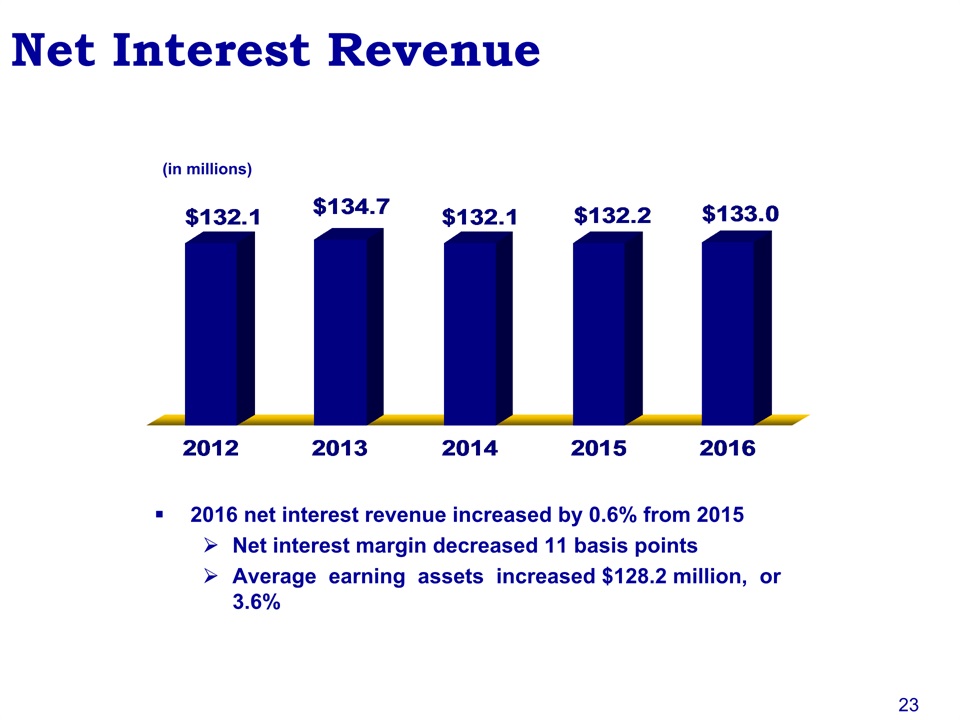
2016 net interest revenue increased by 0.6% from 2015Net interest margin decreased 11 basis pointsAverage earning assets increased $128.2 million, or 3.6% (in millions) Net Interest Revenue 23
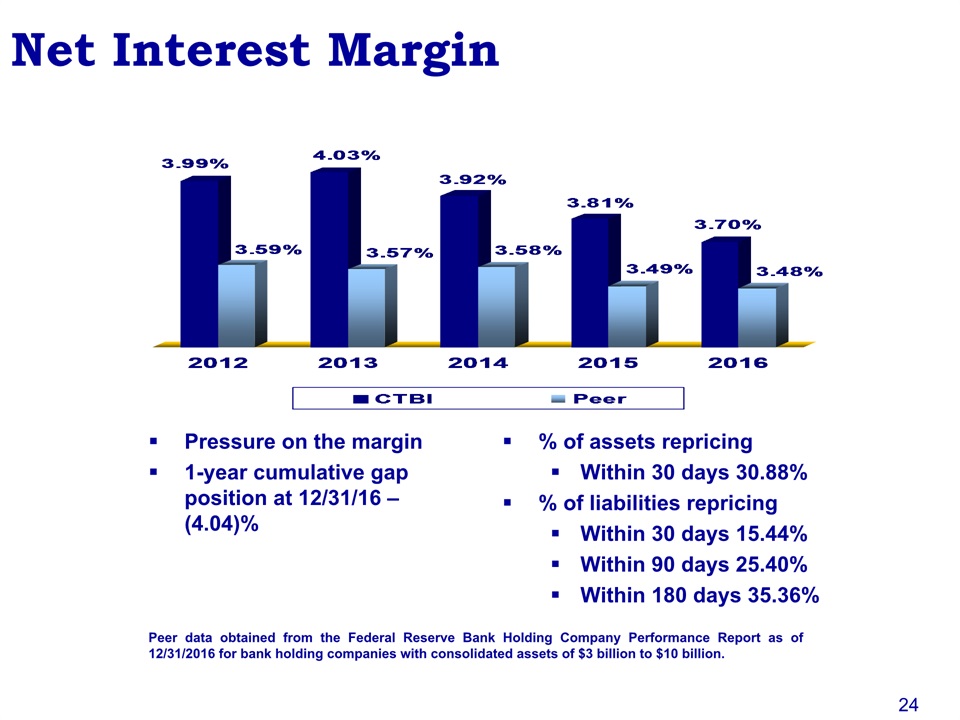
Net Interest Margin Pressure on the margin1-year cumulative gap position at 12/31/16 – (4.04)% % of assets repricingWithin 30 days 30.88%% of liabilities repricing Within 30 days 15.44%Within 90 days 25.40%Within 180 days 35.36% Peer data obtained from the Federal Reserve Bank Holding Company Performance Report as of 12/31/2016 for bank holding companies with consolidated assets of $3 billion to $10 billion. 24
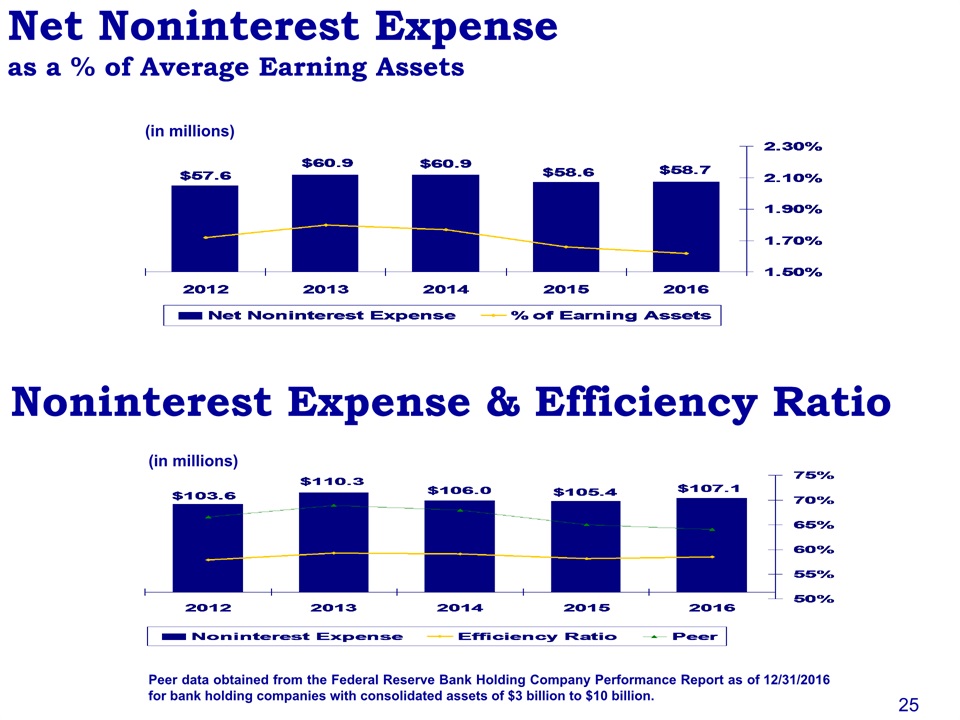
Net Noninterest Expenseas a % of Average Earning Assets Noninterest Expense & Efficiency Ratio (in millions) (in millions) Peer data obtained from the Federal Reserve Bank Holding Company Performance Report as of 12/31/2016 for bank holding companies with consolidated assets of $3 billion to $10 billion. 25

Balance Sheet Review 26
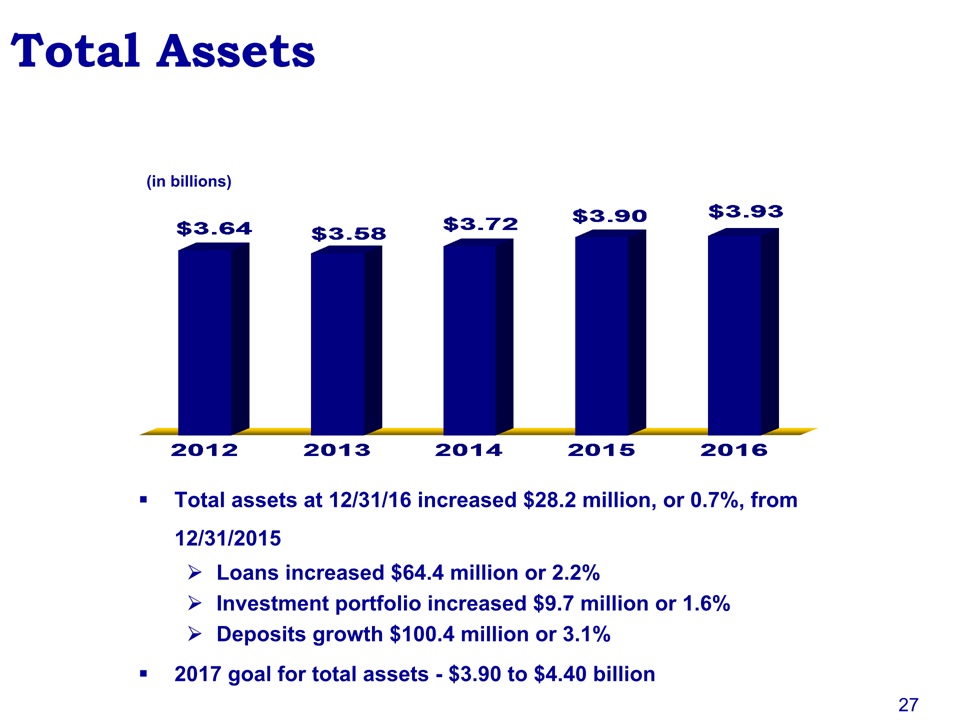
Total assets at 12/31/16 increased $28.2 million, or 0.7%, from 12/31/2015Loans increased $64.4 million or 2.2%Investment portfolio increased $9.7 million or 1.6%Deposits growth $100.4 million or 3.1%2017 goal for total assets - $3.90 to $4.40 billion (in billions) Total Assets 27
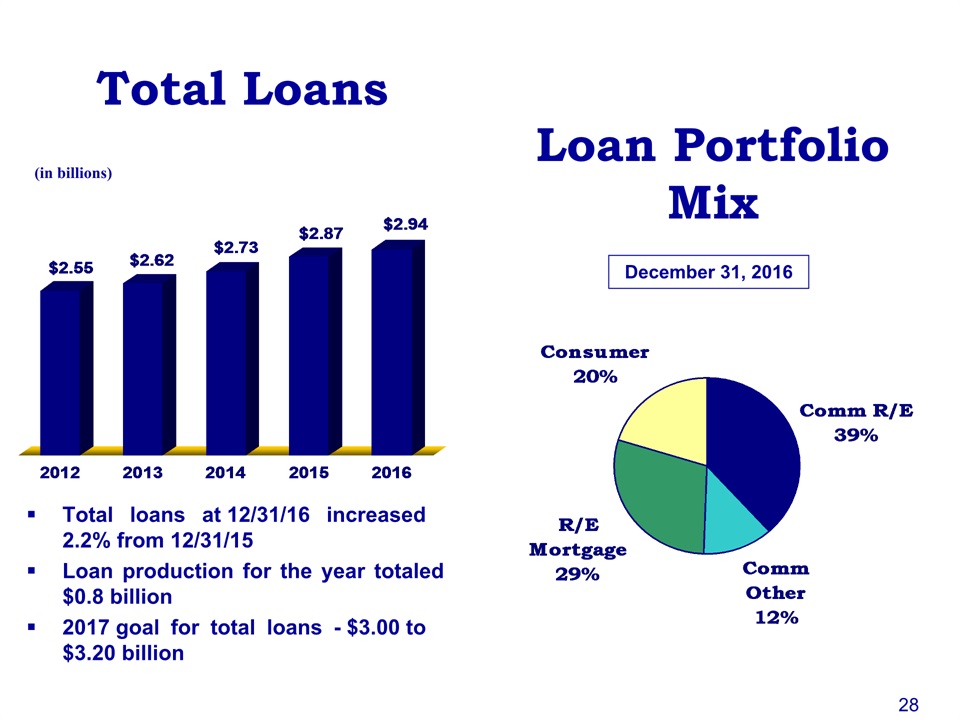
(in billions) Total Loans Total loans at 12/31/16 increased 2.2% from 12/31/15Loan production for the year totaled $0.8 billion2017 goal for total loans - $3.00 to $3.20 billion December 31, 2016 Loan PortfolioMix 28
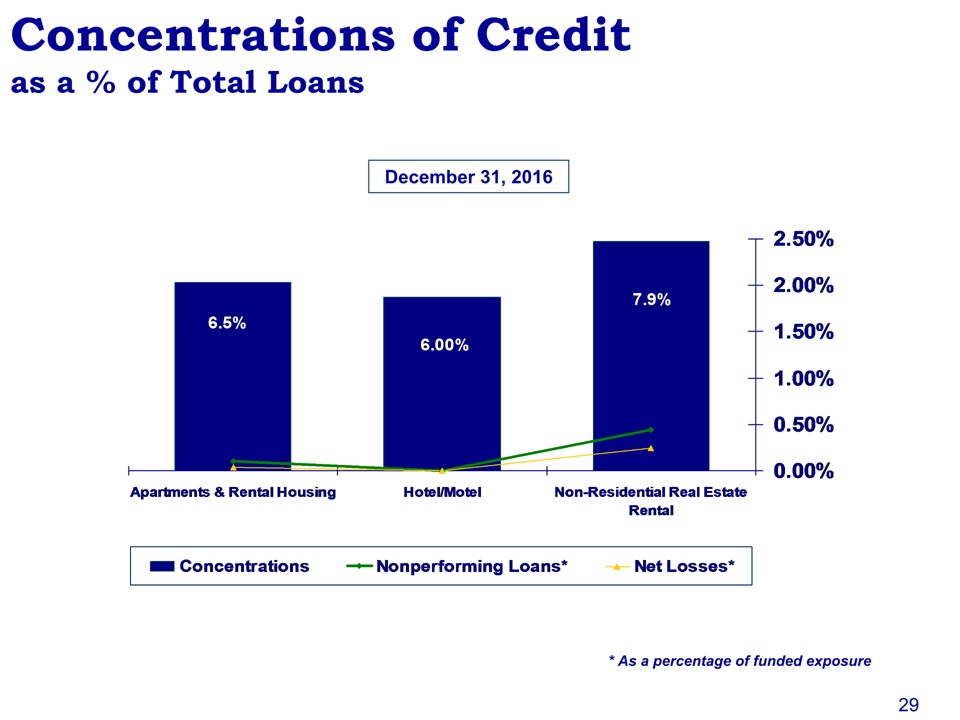
Concentrations of Creditas a % of Total Loans December 31, 2016 * As a percentage of funded exposure 29
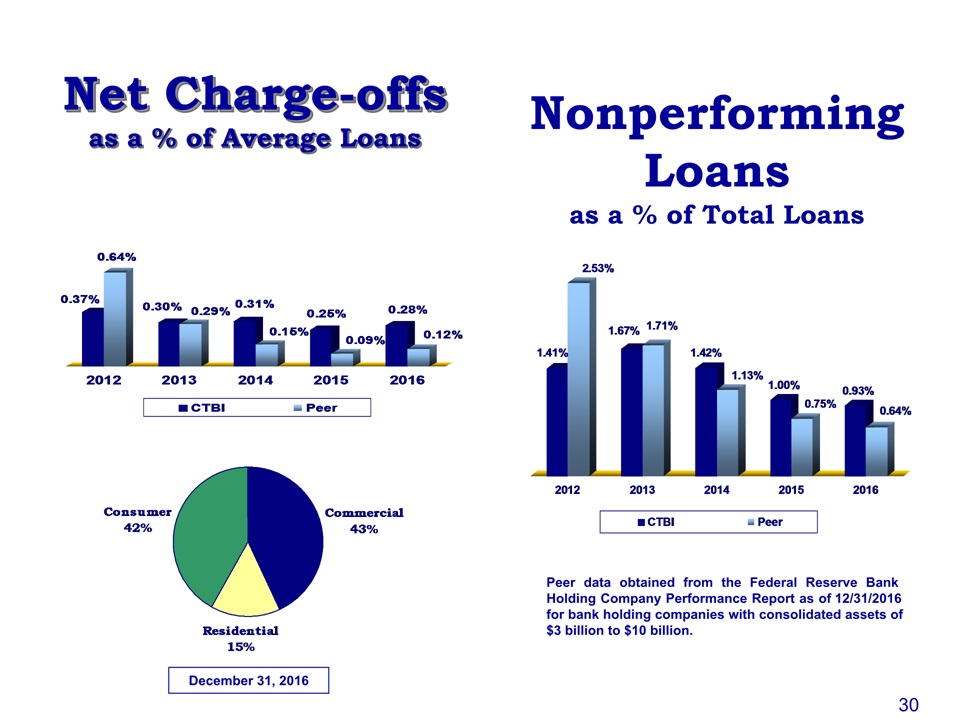
Net Charge-offsas a % of Average Loans NonperformingLoansas a % of Total Loans Peer data obtained from the Federal Reserve Bank Holding Company Performance Report as of 12/31/2016 for bank holding companies with consolidated assets of $3 billion to $10 billion. December 31, 2016 30
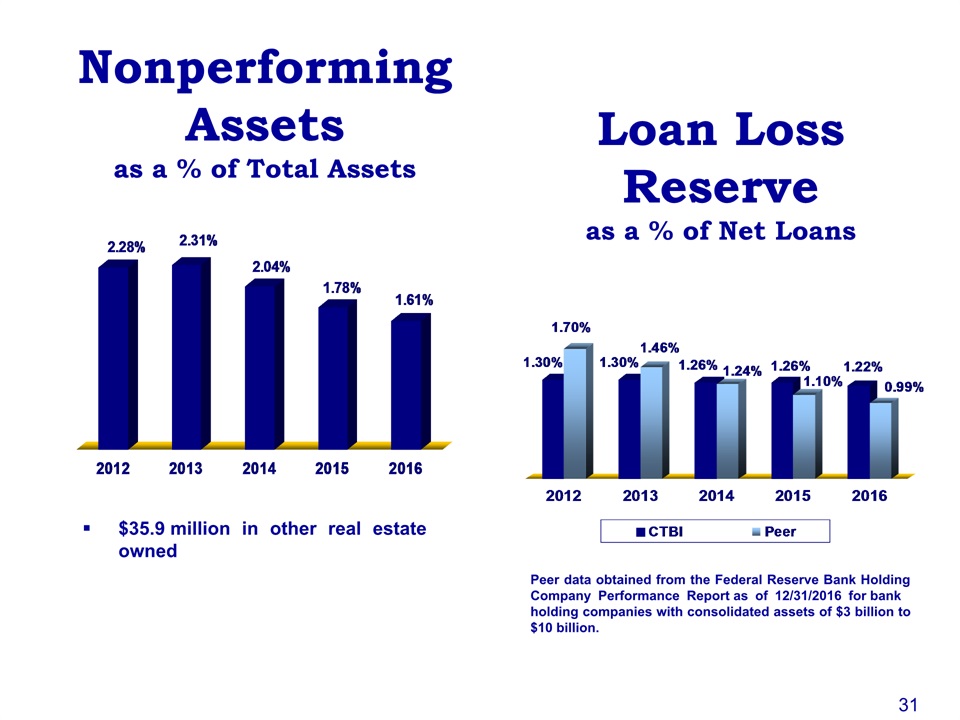
Nonperforming Assetsas a % of Total Assets Loan Loss Reserveas a % of Net Loans $35.9 million in other real estate owned Peer data obtained from the Federal Reserve Bank Holding Company Performance Report as of 12/31/2016 for bank holding companies with consolidated assets of $3 billion to $10 billion. 31
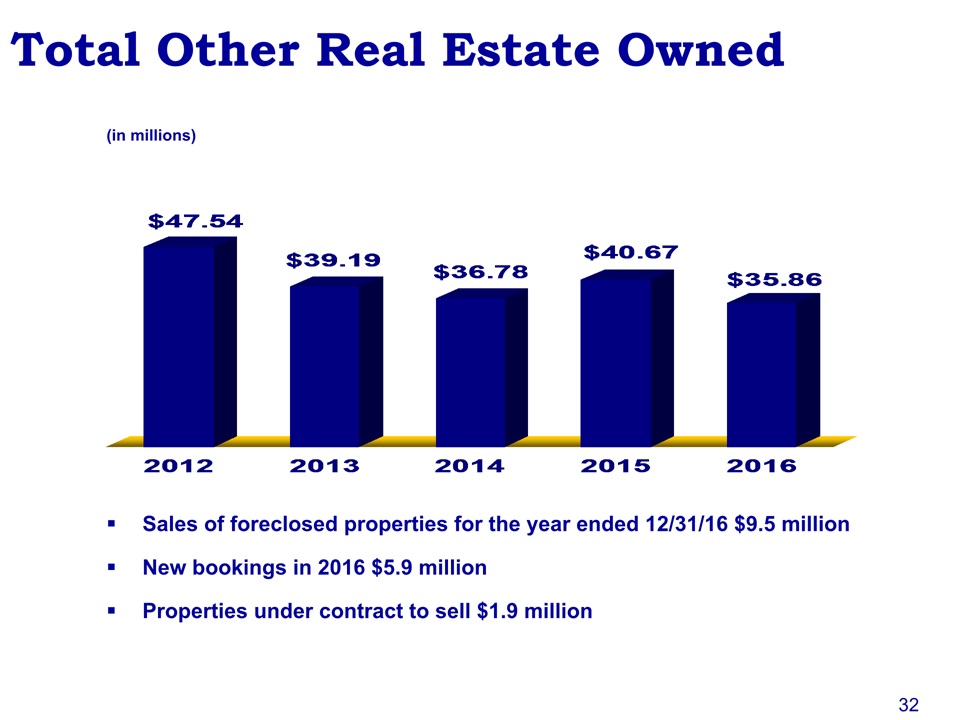
Total Other Real Estate Owned Sales of foreclosed properties for the year ended 12/31/16 $9.5 millionNew bookings in 2016 $5.9 millionProperties under contract to sell $1.9 million (in millions) 32
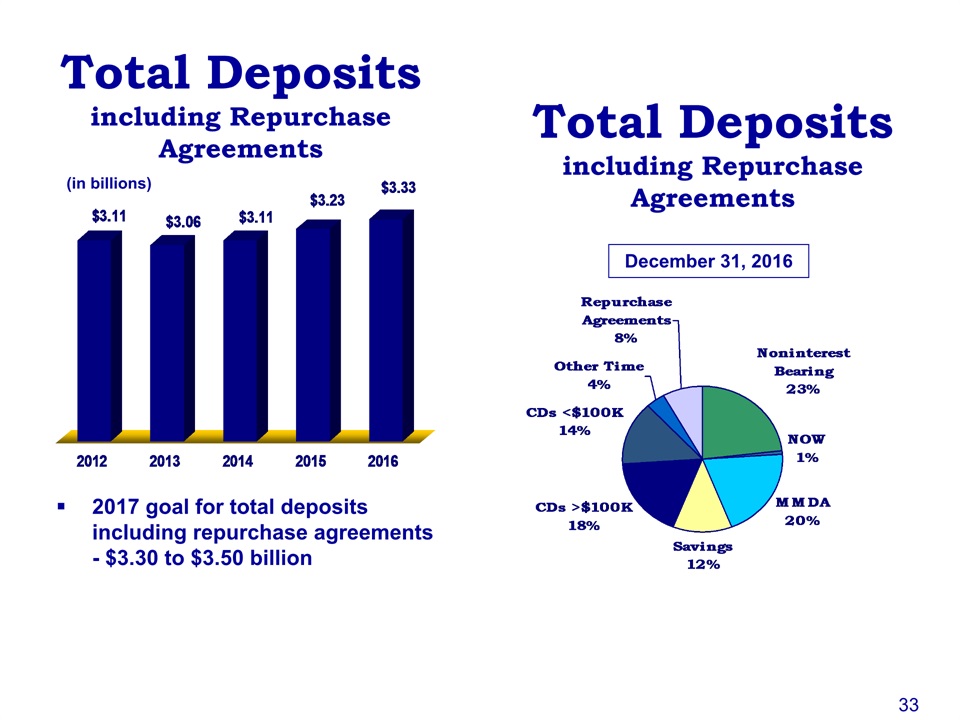
(in billions) Total Depositsincluding Repurchase Agreements 2017 goal for total deposits including repurchase agreements - $3.30 to $3.50 billion Total Depositsincluding Repurchase Agreements December 31, 2016 33
1st Quarter 2017Review 34
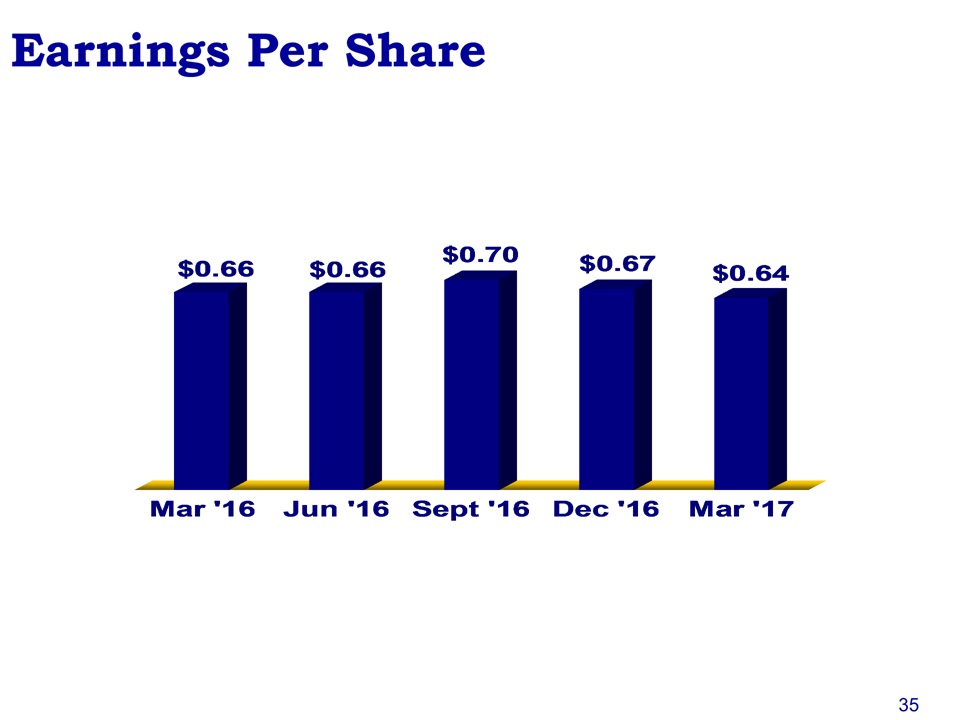
Earnings Per Share 35
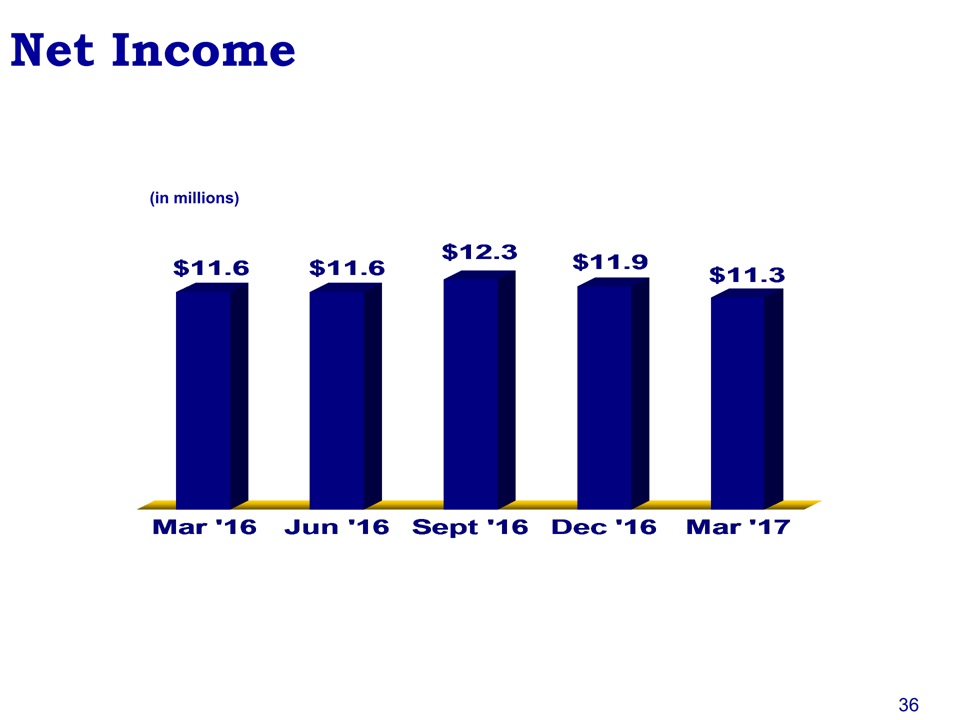
(in millions) Net Income 36
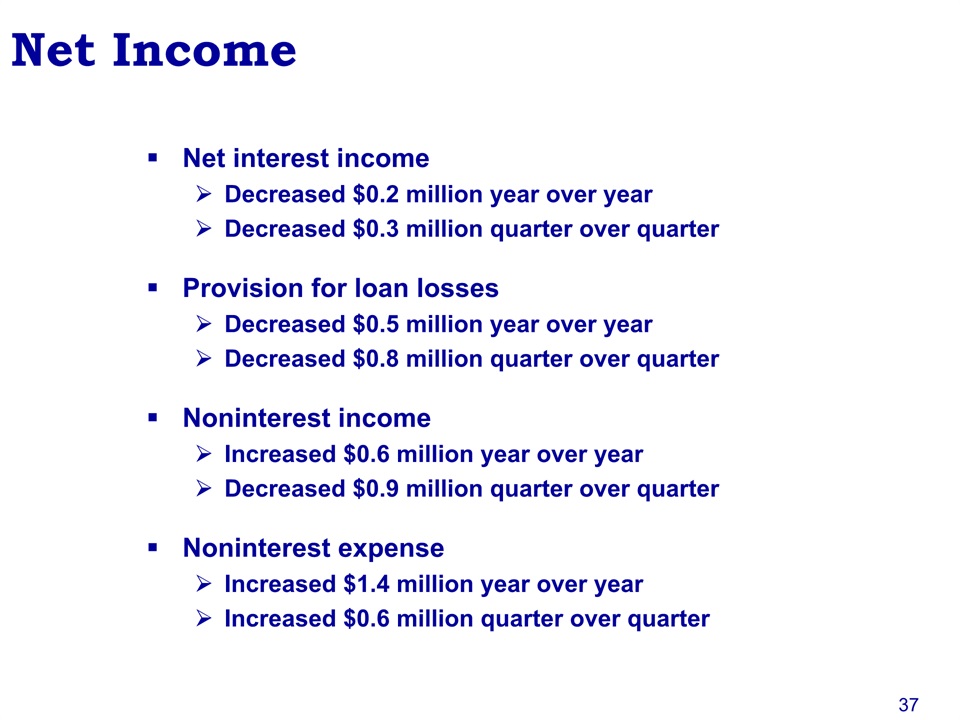
Net interest incomeDecreased $0.2 million year over yearDecreased $0.3 million quarter over quarterProvision for loan lossesDecreased $0.5 million year over yearDecreased $0.8 million quarter over quarterNoninterest incomeIncreased $0.6 million year over yearDecreased $0.9 million quarter over quarterNoninterest expenseIncreased $1.4 million year over yearIncreased $0.6 million quarter over quarter Net Income 37
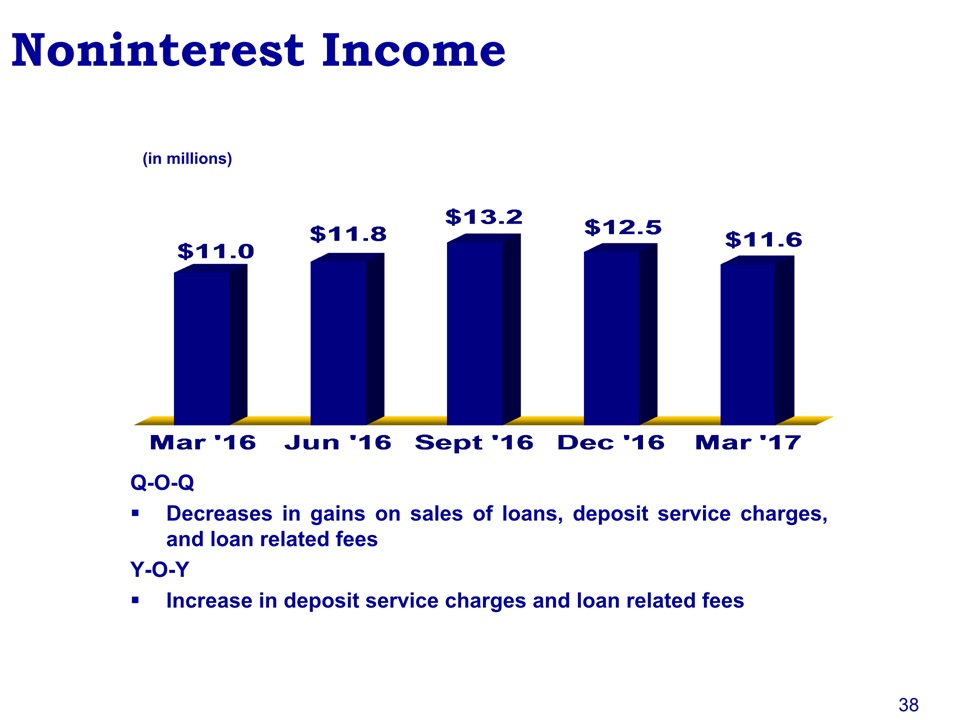
(in millions) Noninterest Income Q-O-QDecreases in gains on sales of loans, deposit service charges, and loan related feesY-O-YIncrease in deposit service charges and loan related fees 38
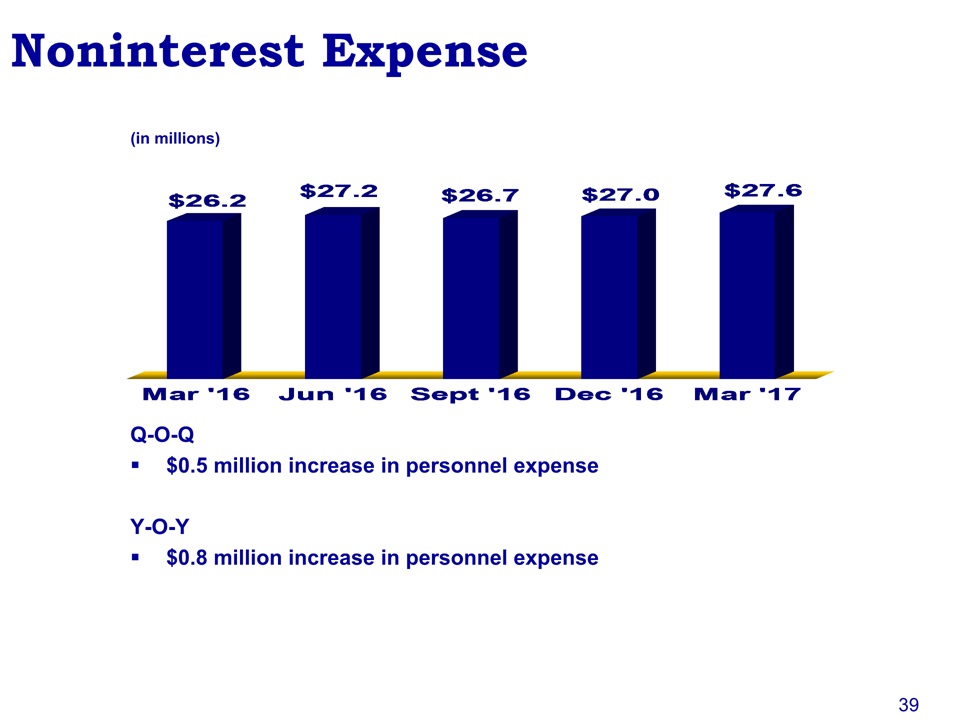
(in millions) Noninterest Expense Q-O-Q$0.5 million increase in personnel expenseY-O-Y$0.8 million increase in personnel expense 39
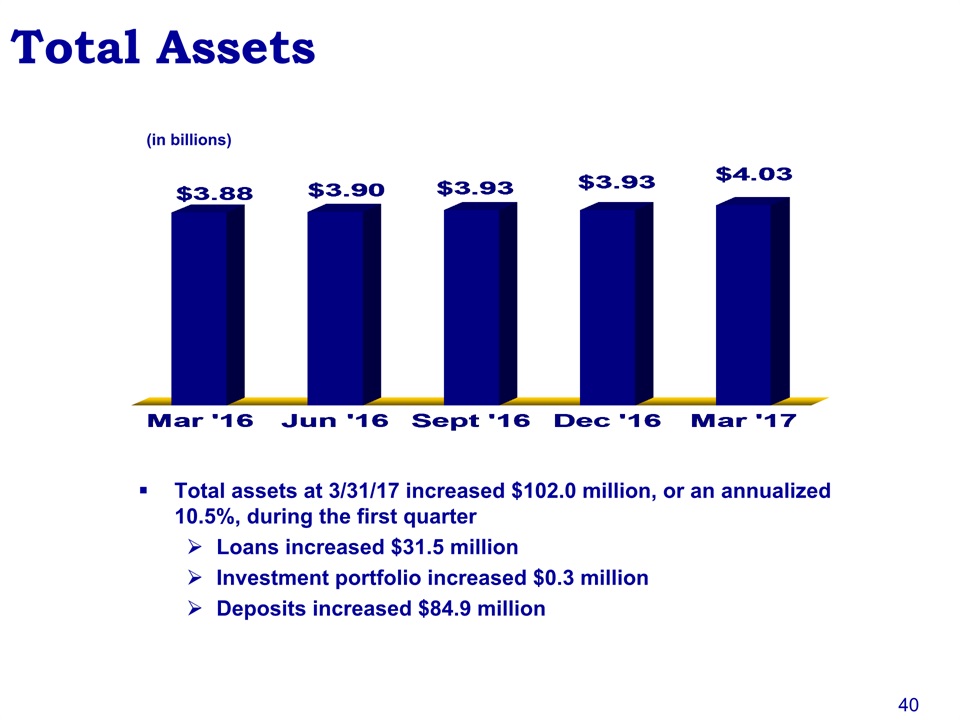
40 (in billions) Total Assets Total assets at 3/31/17 increased $102.0 million, or an annualized 10.5%, during the first quarterLoans increased $31.5 millionInvestment portfolio increased $0.3 millionDeposits increased $84.9 million
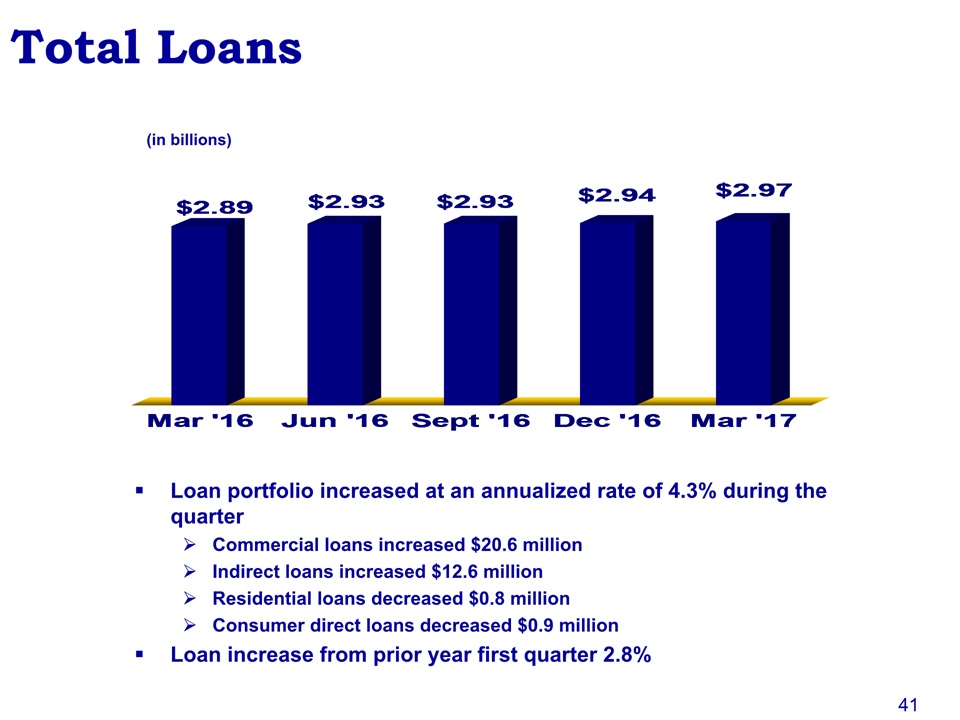
Loan portfolio increased at an annualized rate of 4.3% during the quarterCommercial loans increased $20.6 millionIndirect loans increased $12.6 millionResidential loans decreased $0.8 millionConsumer direct loans decreased $0.9 millionLoan increase from prior year first quarter 2.8% (in billions) Total Loans 41
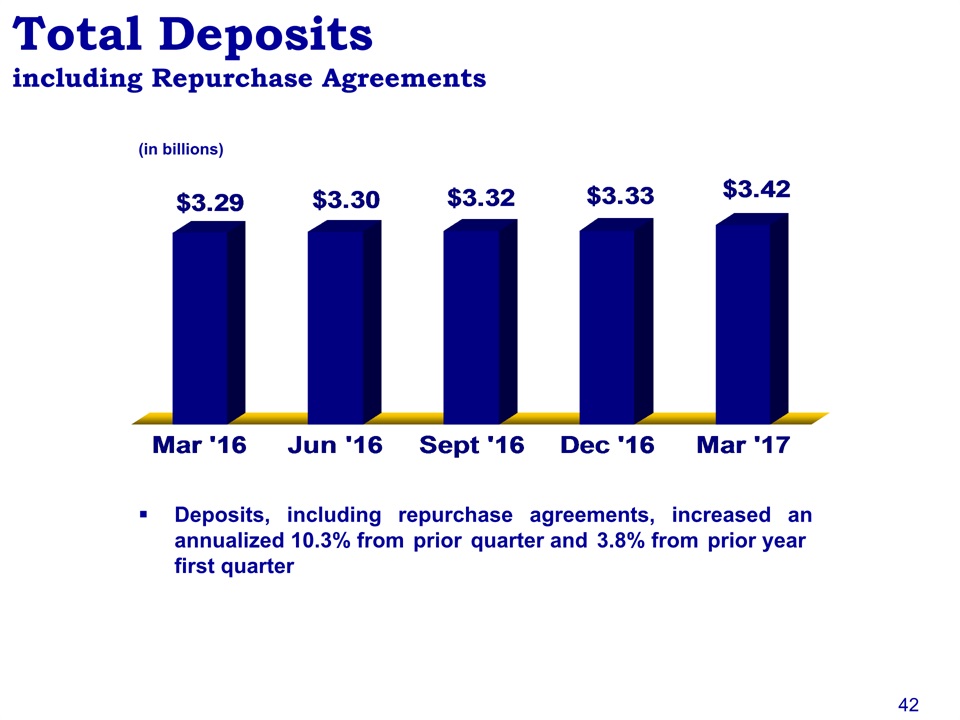
Deposits, including repurchase agreements, increased an annualized 10.3% from prior quarter and 3.8% from prior year first quarter (in billions) Total Depositsincluding Repurchase Agreements 42
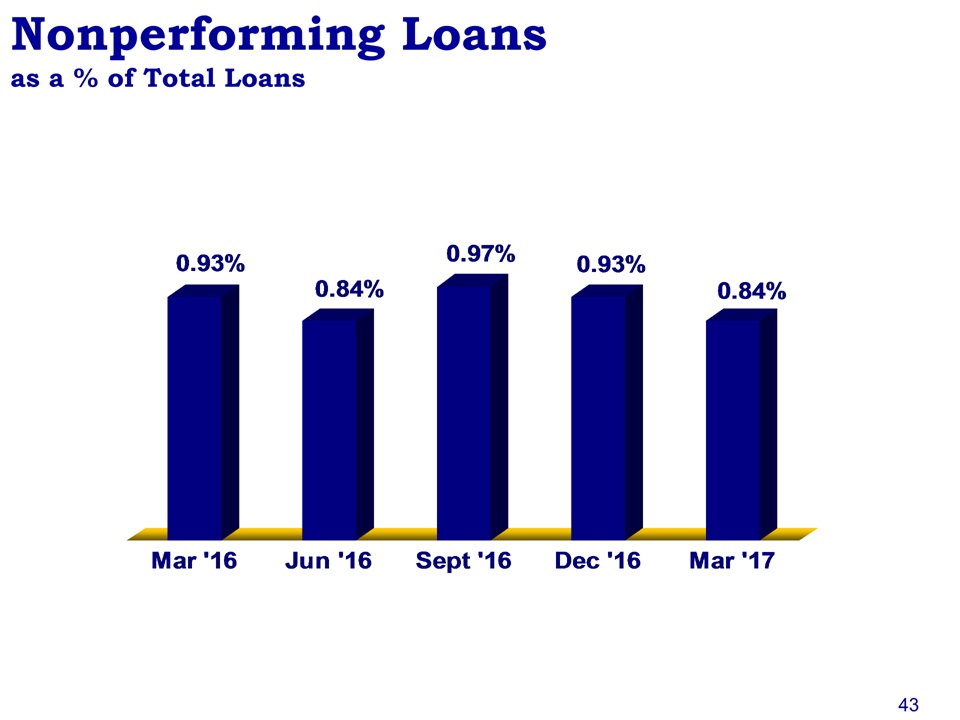
Nonperforming Loansas a % of Total Loans 43
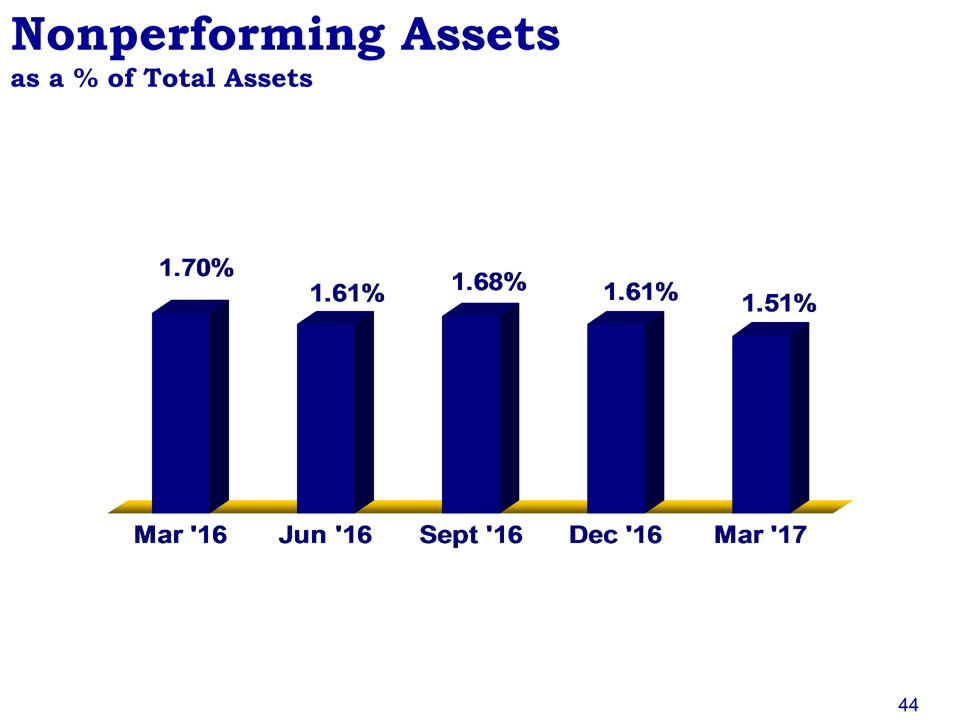
Nonperforming Assetsas a % of Total Assets 44
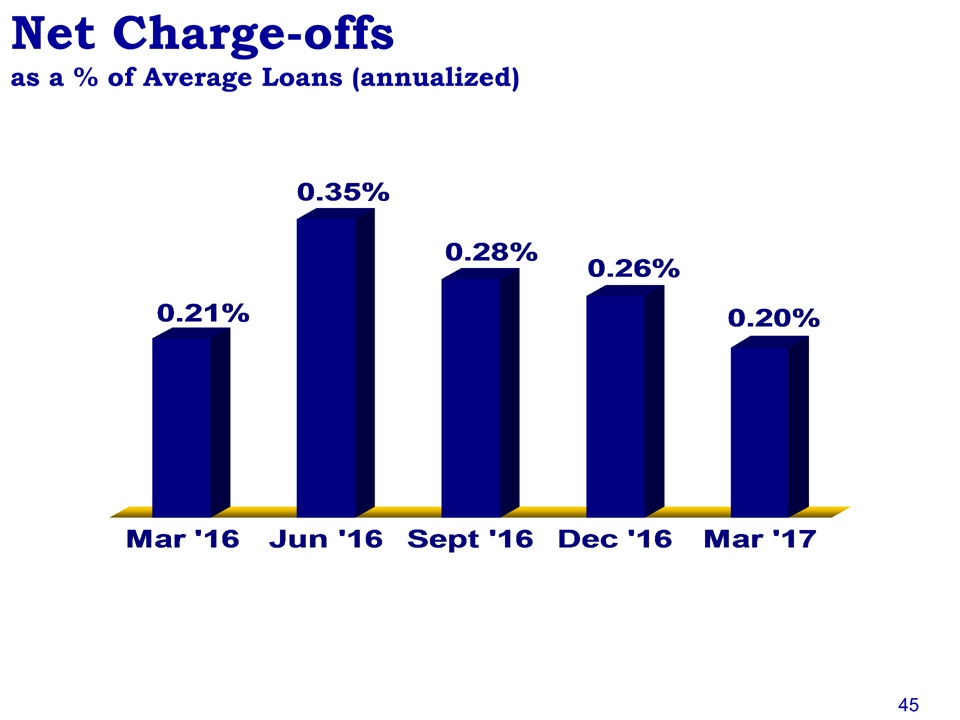
Net Charge-offsas a % of Average Loans (annualized) 45
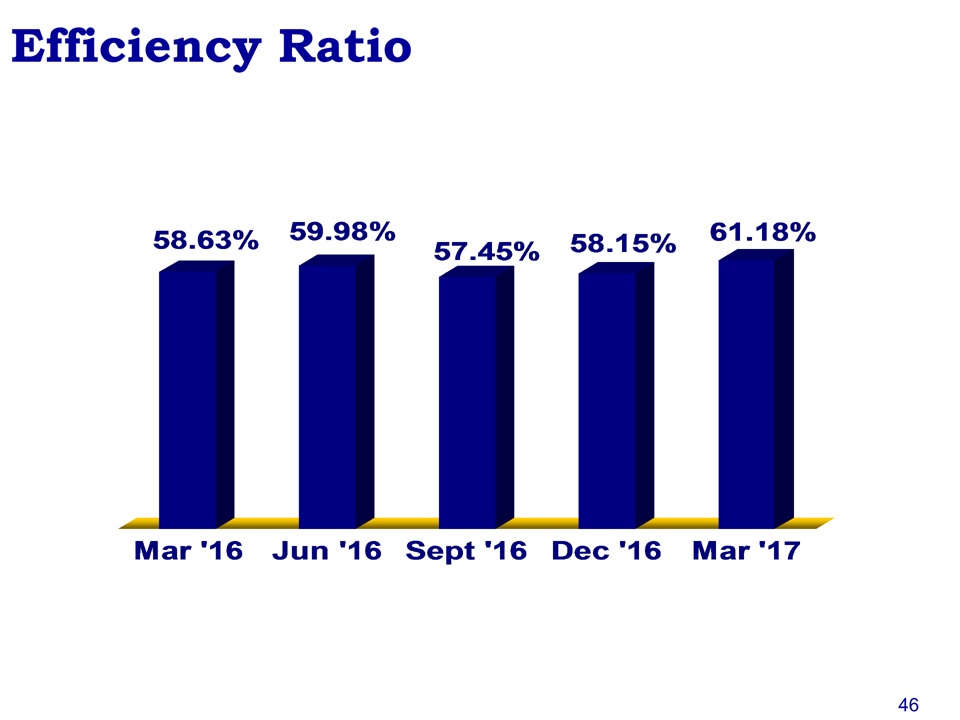
Efficiency Ratio 46
Key Strategic Initiatives 47
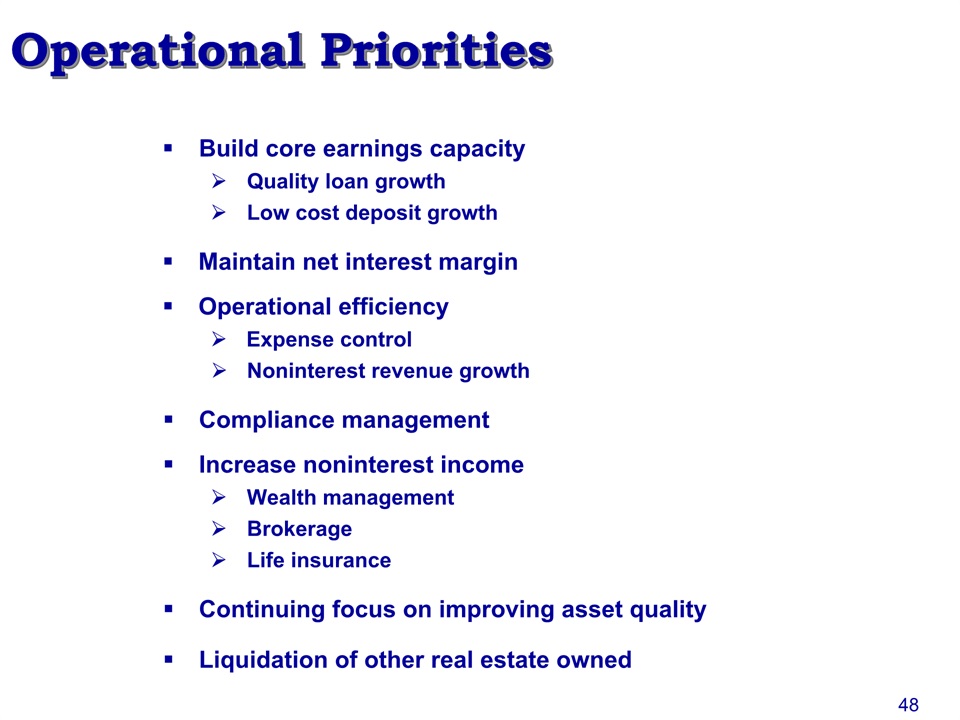
Operational Priorities 48 Build core earnings capacityQuality loan growthLow cost deposit growthMaintain net interest margin Operational efficiencyExpense controlNoninterest revenue growthCompliance managementIncrease noninterest incomeWealth managementBrokerageLife insuranceContinuing focus on improving asset quality Liquidation of other real estate owned
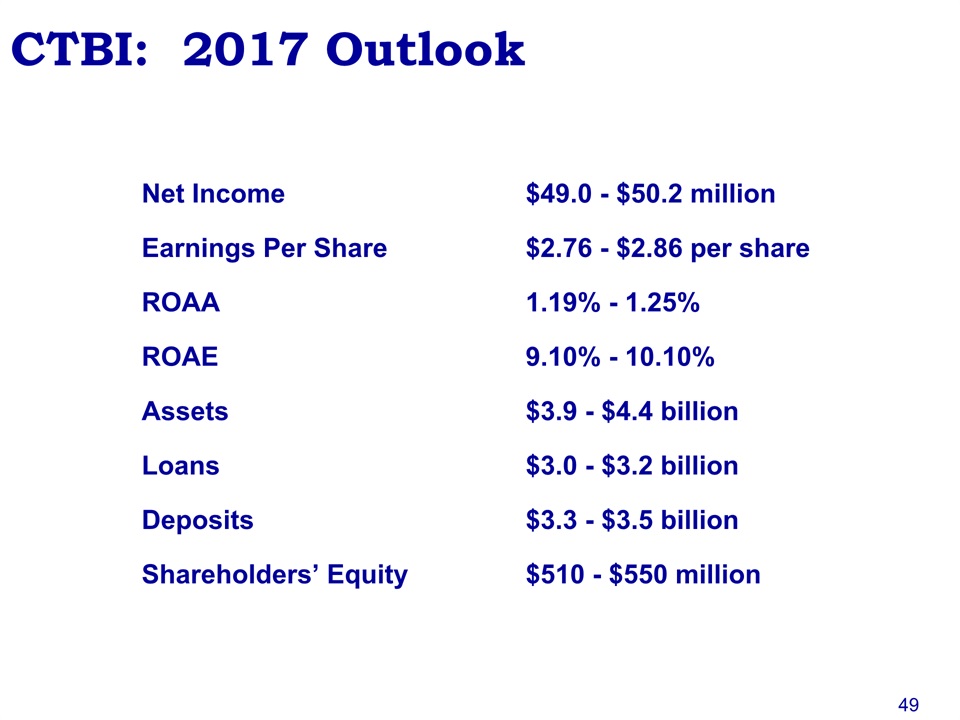
CTBI: 2017 Outlook Net Income $49.0 - $50.2 millionEarnings Per Share $2.76 - $2.86 per shareROAA 1.19% - 1.25% ROAE 9.10% - 10.10% Assets $3.9 - $4.4 billionLoans $3.0 - $3.2 billionDeposits $3.3 - $3.5 billionShareholders’ Equity $510 - $550 million 49
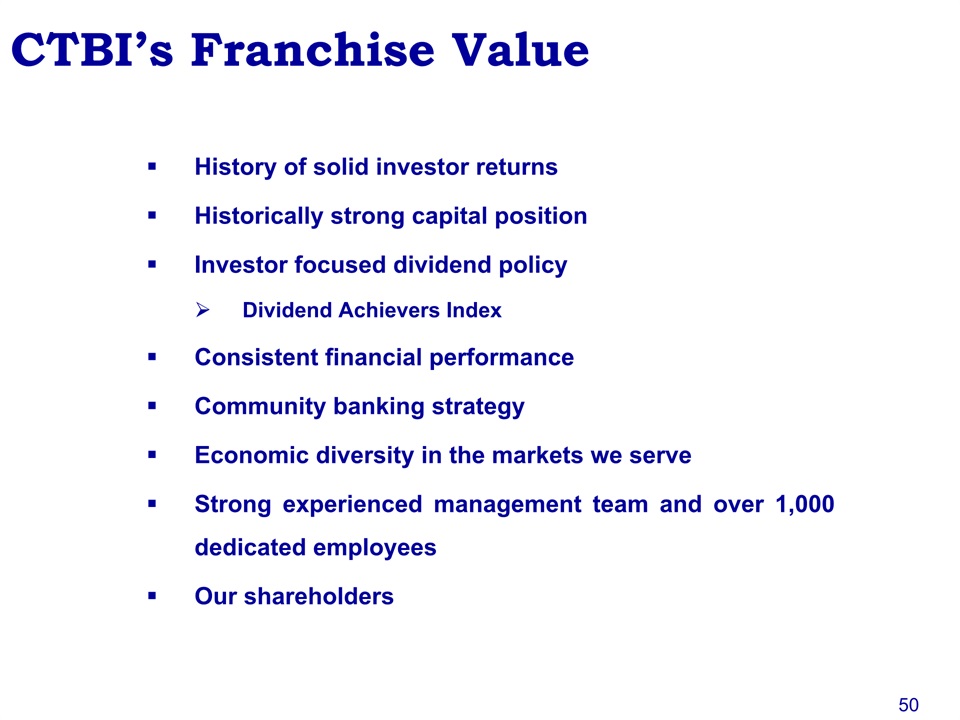
CTBI’s Franchise Value History of solid investor returnsHistorically strong capital positionInvestor focused dividend policyDividend Achievers IndexConsistent financial performanceCommunity banking strategyEconomic diversity in the markets we serveStrong experienced management team and over 1,000 dedicated employeesOur shareholders 50
To Our Shareholders Your management has a Strategic Plan for the performance and operations of your company. Success will be attained by the execution of this plan, not just by management, but by approximately 1,000 employees. The continuing support by you, our shareholders, by referring your friends, neighbors, and business associates to do business with your bank, is invaluable to the execution of our plans for the performance of your Company. 51