Attached files
| file | filename |
|---|---|
| EX-99.2 - EXHIBIT 99.2 - COMERICA INC /NEW/ | ex99204252017.htm |
| 8-K - 8-K - COMERICA INC /NEW/ | a2017annualmeetingpresenta.htm |

Comerica Incorporated Annual Meeting of Shareholders
April 25, 2017Comerica Bank TowerDallas, Texas
Safe Harbor Statement
Any statements in this presentation that are not historical facts are forward-looking statements as defined in the Private Securities Litigation Reform Act of 1995. Words such as “anticipates,” “believes,” “contemplates,” “feels,” “expects,” “estimates,” “seeks,” “strives,” “plans,” “intends,” “outlook,” “forecast,” “position,” “target,” “mission,” “assume,” “achievable,” “potential,” “strategy,” “goal,” “aspiration,” “opportunity,” “initiative,” “outcome,” “continue,” “remain,” “maintain,” “on course,” “trend,” “objective,” “looks forward,” “projects,” “models” and variations of such words and similar expressions, or future or conditional verbs such as “will,” “would,” “should,” “could,” “might,” “can,” “may” or similar expressions, as they relate to Comerica or its management, are intended to identify forward-looking statements. These forward-looking statements are predicated on the beliefs and assumptions of Comerica's management based on information known to Comerica's management as of the date of this presentation and do not purport to speak as of any other date. Forward-looking statements may include descriptions of plans and objectives of Comerica's management for future or past operations, products or services, including the Growth in Efficiency and Revenue initiative (“GEAR Up”), and forecasts of Comerica's revenue, earnings or other measures of economic performance, including statements of profitability, business segments and subsidiaries as well as estimates of the economic benefits of the GEAR Up initiative, estimates of credit trends and global stability. Such statements reflect the view of Comerica's management as of this date with respect to future events and are subject to risks and uncertainties. Should one or more of these risks materialize or should underlying beliefs or assumptions prove incorrect, Comerica's actual results could differ materially from those discussed. Factors that could cause or contribute to such differences are changes in general economic, political or industry conditions; changes in monetary and fiscal policies, including changes in interest rates; whether Comerica may achieve opportunities for revenue enhancements and efficiency improvements under the GEAR Up initiative, or changes in the scope or assumptions underlying the GEAR Up initiative; Comerica's ability to maintain adequate sources of funding and liquidity; the effects of more stringent capital or liquidity requirements; declines or other changes in the businesses or industries of Comerica's customers, in particular the energy industry; unfavorable developments concerning credit quality; operational difficulties, failure of technology infrastructure or information security incidents; changes in regulation or oversight; reliance on other companies to provide certain key components of business infrastructure; changes in the financial markets, including fluctuations in interest rates and their impact on deposit pricing; reductions in Comerica's credit rating; the interdependence of financial service companies; the implementation of Comerica's strategies and business initiatives; damage to Comerica's reputation; Comerica's ability to utilize technology to efficiently and effectively develop, market and deliver new products and services; competitive product and pricing pressures among financial institutions within Comerica's markets; changes in customer behavior; any future strategic acquisitions or divestitures; management's ability to maintain and expand customer relationships; management's ability to retain key officers and employees; the impact of legal and regulatory proceedings or determinations; the effectiveness of methods of reducing risk exposures; the effects of terrorist activities and other hostilities; the effects of catastrophic events including, but not limited to, hurricanes, tornadoes, earthquakes, fires, droughts and floods; potential legislative, administrative or judicial changes or interpretations related to the tax treatment of corporations; changes in accounting standards and the critical nature of Comerica's accounting policies. Comerica cautions that the foregoing list of factors is not exclusive. For discussion of factors that may cause actual results to differ from expectations, please refer to our filings with the Securities and Exchange Commission. In particular, please refer to “Item 1A. Risk Factors” beginning on page 12 of Comerica's Annual Report on Form 10-K for the year ended December 31, 2016. Forward-looking statements speak only as of the date they are made. Comerica does not undertake to update forward-looking statements to reflect facts, circumstances, assumptions or events that occur after the date the forward-looking statements are made. For any forward-looking statements made in this presentation or in any documents, Comerica claims the protection of the safe harbor for forward-looking statements contained in the Private Securities Litigation Reform Act of 1995.
2
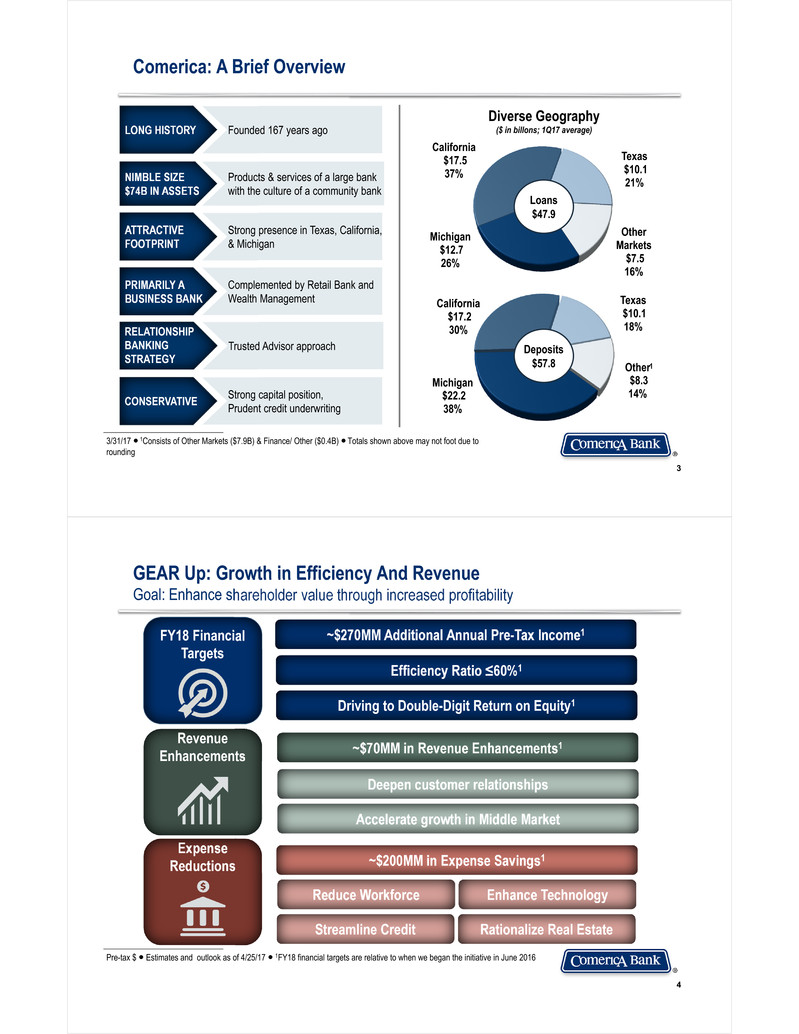
Michigan$12.7 26%
California$17.5 37% Texas$10.1 21%
Other Markets$7.5 16%
Michigan$22.2 38%
California$17.2 30%
Texas$10.1 18%
Other$8.3 14%
Loans $47.9
Deposits $57.8
3
1
LONG HISTORY
NIMBLE SIZE$74B IN ASSETS
ATTRACTIVE FOOTPRINT
PRIMARILY A BUSINESS BANK
RELATIONSHIP BANKING STRATEGY
CONSERVATIVE
Diverse Geography($ in billons; 1Q17 average)LONG HISTORY
NIMBLE SIZE$74B IN ASSETS
ATTRACTIVE FOOTPRINT
PRIMARILY A BUSINESS BANK
CONSERVATIVE
RELATIONSHIP BANKING STRATEGY
3/31/17 ● 1Consists of Other Markets ($7.9B) & Finance/ Other ($0.4B) ● Totals shown above may not foot due to rounding
Comerica: A Brief Overview
Founded 167 years ago
Products & services of a large bank with the culture of a community bank
Strong presence in Texas, California, & Michigan
Complemented by Retail Bank and Wealth Management
Trusted Advisor approach
Strong capital position,Prudent credit underwriting
FY18 Financial Targets
Expense Reductions
Revenue Enhancements ~$70MM in Revenue Enhancements1
Deepen customer relationships
Accelerate growth in Middle Market
~$200MM in Expense Savings1
Enhance TechnologyReduce Workforce
Rationalize Real EstateStreamline Credit
4
Pre-tax $ ● Estimates and outlook as of 4/25/17 ● 1FY18 financial targets are relative to when we began the initiative in June 2016
GEAR Up: Growth in Efficiency And Revenue Goal: Enhance shareholder value through increased profitability
~$270MM Additional Annual Pre-Tax Income1
Efficiency Ratio ≤60%1
Driving to Double-Digit Return on Equity1
GEAR Up: Growth in Efficiency And RevenueExpense achievements & opportunities
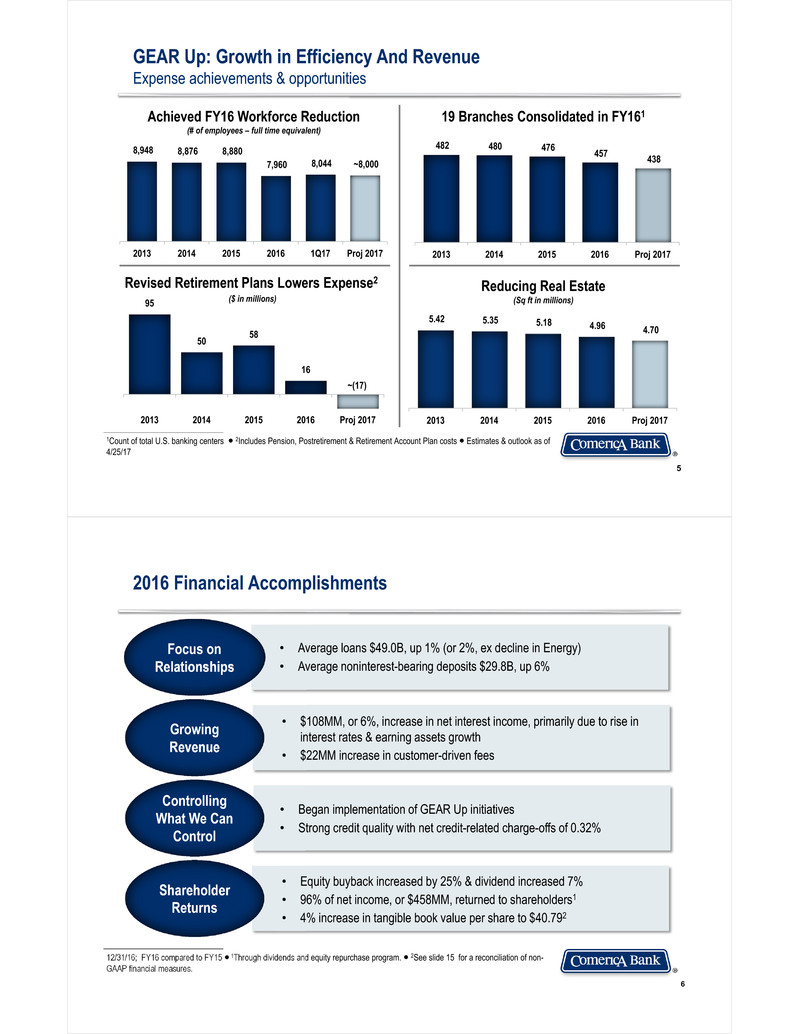
1Count of total U.S. banking centers ● 2Includes Pension, Postretirement & Retirement Account Plan costs ● Estimates & outlook as of 4/25/17
8,948 8,876 8,880 7,960 8,044 ~8,000
2013 2014 2015 2016 1Q17 Proj 2017
Achieved FY16 Workforce Reduction(# of employees – full time equivalent) 482 480 476 457 438
2013 2014 2015 2016 Proj 2017
19 Branches Consolidated in FY161
~(17)
95
50 58
16
2013 2014 2015 2016 Proj 2017
Revised Retirement Plans Lowers Expense2($ in millions)
5.42 5.35 5.18 4.96 4.70
2013 2014 2015 2016 Proj 2017
Reducing Real Estate (Sq ft in millions)
5
12/31/16; FY16 compared to FY15 ● 1Through dividends and equity repurchase program. ● 2See slide 15 for a reconciliation of non-GAAP financial measures.
Focus on Relationships
Shareholder Returns
Growing Revenue
6
2016 Financial Accomplishments
Controlling What We Can Control
• Average loans $49.0B, up 1% (or 2%, ex decline in Energy)• Average noninterest-bearing deposits $29.8B, up 6%
• $108MM, or 6%, increase in net interest income, primarily due to rise in interest rates & earning assets growth• $22MM increase in customer-driven fees
• Began implementation of GEAR Up initiatives • Strong credit quality with net credit-related charge-offs of 0.32%
• Equity buyback increased by 25% & dividend increased 7%• 96% of net income, or $458MM, returned to shareholders1• 4% increase in tangible book value per share to $40.792
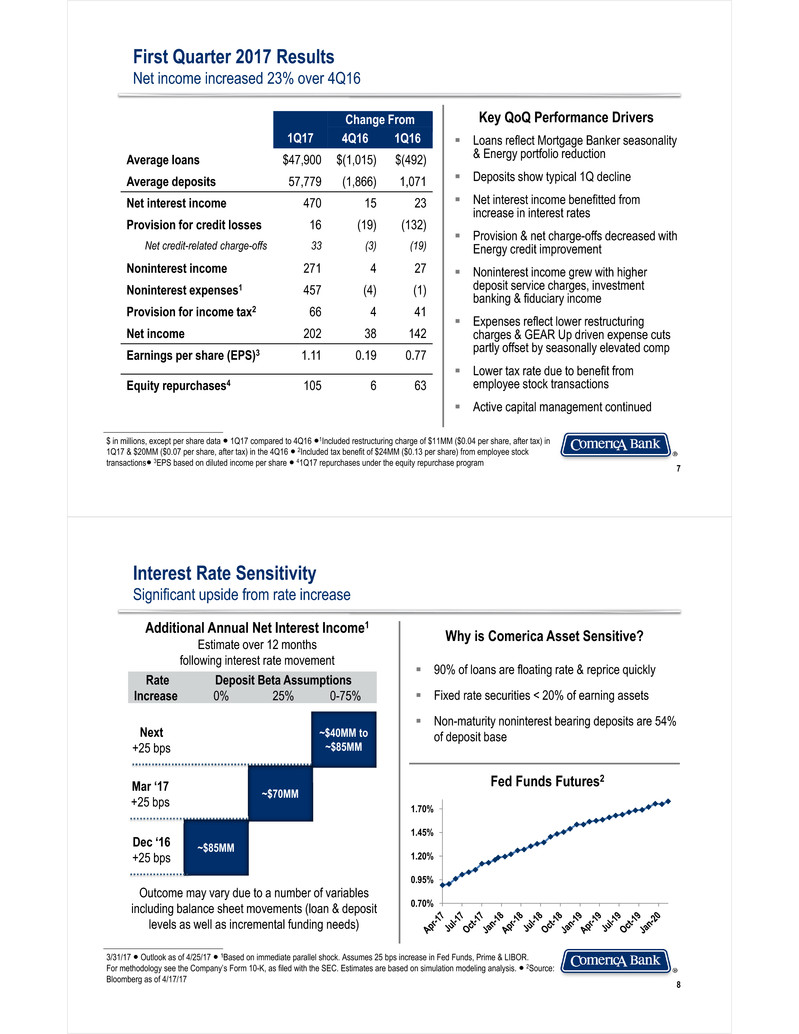
$ in millions, except per share data ● 1Q17 compared to 4Q16 ●1Included restructuring charge of $11MM ($0.04 per share, after tax) in 1Q17 & $20MM ($0.07 per share, after tax) in the 4Q16 ● 2Included tax benefit of $24MM ($0.13 per share) from employee stock transactions● 3EPS based on diluted income per share ● 41Q17 repurchases under the equity repurchase program
1Q17 Change From4Q16 1Q16
Average loans $47,900 $(1,015) $(492)
Average deposits 57,779 (1,866) 1,071
Net interest income 470 15 23
Provision for credit losses 16 (19) (132)
Net credit-related charge-offs 33 (3) (19)
Noninterest income 271 4 27
Noninterest expenses1 457 (4) (1)
Provision for income tax2 66 4 41
Net income 202 38 142
Earnings per share (EPS)3 1.11 0.19 0.77
Equity repurchases4 105 6 63
Key QoQ Performance Drivers
Loans reflect Mortgage Banker seasonality & Energy portfolio reduction
Deposits show typical 1Q decline
Net interest income benefitted from increase in interest rates
Provision & net charge-offs decreased with Energy credit improvement
Noninterest income grew with higher deposit service charges, investment banking & fiduciary income
Expenses reflect lower restructuring charges & GEAR Up driven expense cuts partly offset by seasonally elevated comp
Lower tax rate due to benefit from employee stock transactions
Active capital management continued
7
First Quarter 2017 ResultsNet income increased 23% over 4Q16
90% of loans are floating rate & reprice quickly
Fixed rate securities < 20% of earning assets
Non-maturity noninterest bearing deposits are 54% of deposit base
3/31/17 ● Outlook as of 4/25/17 ● 1Based on immediate parallel shock. Assumes 25 bps increase in Fed Funds, Prime & LIBOR. For methodology see the Company’s Form 10-K, as filed with the SEC. Estimates are based on simulation modeling analysis. ● 2Source: Bloomberg as of 4/17/17
Fed Funds Futures2
Additional Annual Net Interest Income1 Estimate over 12 months following interest rate movement
Mar ‘17+25 bps
Next +25 bps
~$85MM
~$70MM
~$40MM to~$85MM
Interest Rate Sensitivity Significant upside from rate increase
Why is Comerica Asset Sensitive?
Outcome may vary due to a number of variables including balance sheet movements (loan & deposit levels as well as incremental funding needs)
8
RateIncrease Deposit Beta Assumptions 0% 25% 0-75%
0.70%
0.95%
1.20%
1.45%
1.70%
Dec ‘16 +25 bps

Pre-tax $ ● Estimates and outlook as of 4/25/17
9
Enterprise-wide
Rationalize & modernize IT applications
Expand operational process automation
Optimize & modernize infrastructure platforms
Launch new Customer Relationship Management platform
Business Bank
Retail Bank
Enhance mobile platform & alerts
Migrate to new consumer lending platform
Additional Technology Initiatives
Meeting Growing Technology Demands($ in millions)
68 99 115 ~120
189
200 205 ~190
257
299 320 ~310
2014 2015 2016 Proj 2017
Projects On-going Support
Continued Investment in TechnologyCommitted to savings & efficiency
Enhance information reporting tools for customers
Launch sales force productivity tools
GEAR Up: Enhancing Technology
3/31/17 ● 1Shares repurchased under equity repurchase program
2016 Capital Actions
25% increase in equity buyback1
7% increase in dividend
96% of net income, or $458MM, returned to shareholders1CCAR Plan
2016 Plan (3Q16-2Q17): up to $440MM in equity repurchases of which $301MM completed as of 3/31/17
2015 Plan (2Q15-2Q16): $290MM in equity repurchased
10
Share Count(in millions)
188 182 179 176 175 177
2012 2013 2014 2015 2016 1Q17
Common Shares Outstanding (PE)
42 65 97 99
10537
38
40 40 4279 103
137 139 147
1Q16 2Q16 3Q16 4Q16 1Q17
Equity Repurchases Dividends
Dividends Per Share Growth
0.55 0.68
0.79 0.83 0.89 0.92
2012 2013 2014 2015 2016 1Q17Annualized
Increasing Shareholder Payout($ in millions)
Active Capital ManagementContinued to return excess capital to shareholders
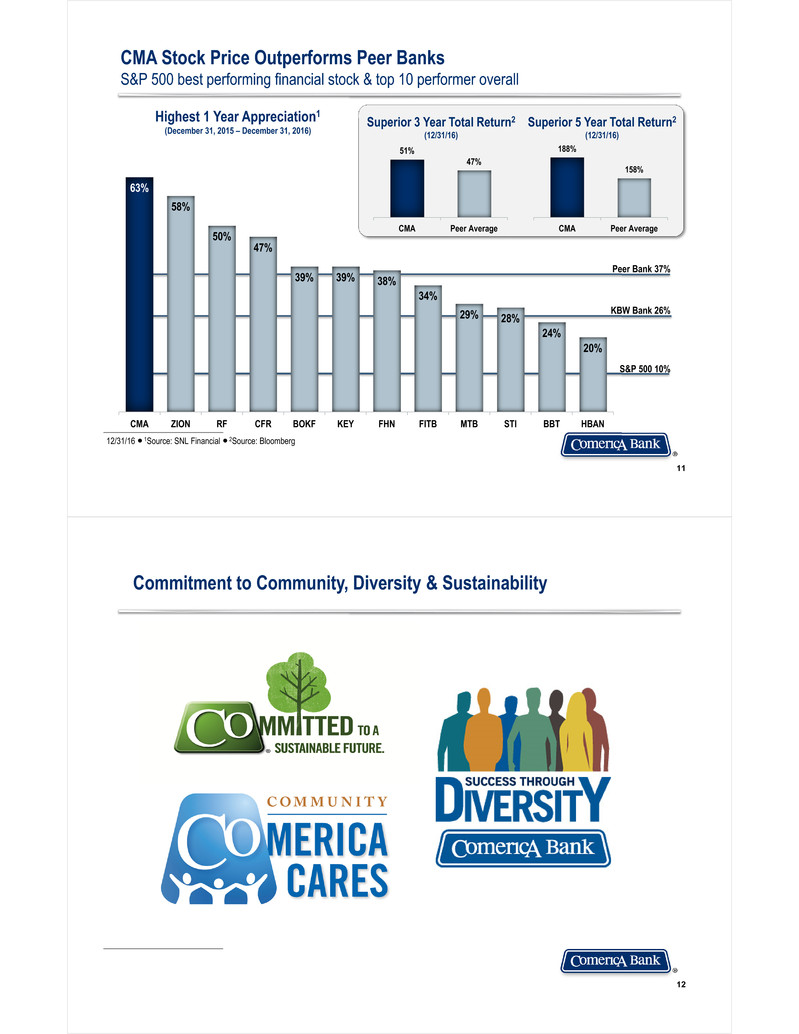
63%
58%
50% 47%
39% 39% 38% 34%
29% 28% 24% 20%
CMA ZION RF CFR BOKF KEY FHN FITB MTB STI BBT HBAN
51% 47%
CMA Peer Average
188%
158%
CMA Peer Average
KBW Bank 26%
Peer Bank 37%
S&P 500 10%
Highest 1 Year Appreciation1(December 31, 2015 – December 31, 2016)
12/31/16 ● 1Source: SNL Financial ● 2Source: Bloomberg
11
CMA Stock Price Outperforms Peer BanksS&P 500 best performing financial stock & top 10 performer overall
Superior 3 Year Total Return2(12/31/16) Superior 5 Year Total Return2(12/31/16)
12
Commitment to Community, Diversity & Sustainability

13
GROWING REVENUE
REDUCING EXPENSES
MANAGING RISK
CAPITAL MANAGEMENT
POSITIONED FOR RISING RATES
3/31/17 ● Outlook as of 4/25/17
Intensely Focused on Enhancing Shareholder Value
Positioned in faster growing markets & industriesFocused on building long-term relationships
Executing GEAR Up initiative to increase efficiencyContinued investment in technology
Fed’s 25 bps increases in December 2016 & March 2017 expected to increase 2017 net interest income by ~$135MM
Solid Capital base; CET1 Capital ratio of 11.54% Continued share buyback & dividend increased twice in 2016
Strong, conservative credit culture leads tosolid credit metrics
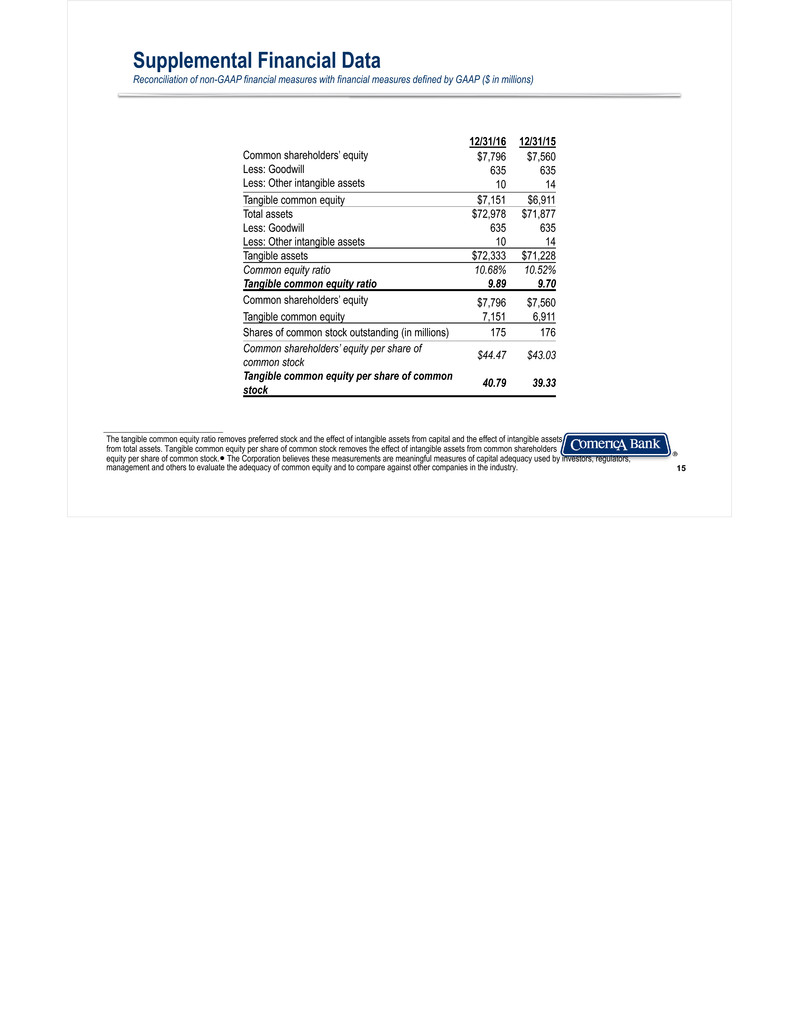
12/31/16 12/31/15Common shareholders’ equityLess: GoodwillLess: Other intangible assets
$7,79663510
$7,56063514Tangible common equity $7,151 $6,911Total assetsLess: GoodwillLess: Other intangible assets
$72,97863510
$71,87763514Tangible assets $72,333 $71,228Common equity ratio 10.68% 10.52%Tangible common equity ratio 9.89 9.70Common shareholders’ equity $7,796 $7,560Tangible common equity 7,151 6,911Shares of common stock outstanding (in millions) 175 176Common shareholders’ equity per share of common stock $44.47 $43.03Tangible common equity per share of common stock 40.79 39.33
15
The tangible common equity ratio removes preferred stock and the effect of intangible assets from capital and the effect of intangible assetsfrom total assets. Tangible common equity per share of common stock removes the effect of intangible assets from common shareholders equity per share of common stock.● The Corporation believes these measurements are meaningful measures of capital adequacy used by investors, regulators, management and others to evaluate the adequacy of common equity and to compare against other companies in the industry.
Supplemental Financial DataReconciliation of non-GAAP financial measures with financial measures defined by GAAP ($ in millions)
