Attached files
| file | filename |
|---|---|
| 8-K - CURRENT REPORT - CIT GROUP INC | e73929_8k.htm |
| EX-99.1 - PRESS RELEASE - CIT GROUP INC | e73929ex99-1.htm |
Exhibit 99.2

First Quarter 2017 Financial Results April 25, 2017

1 Important Notices | 1Q17 Earnings This presentation contains forward - looking statements within the meaning of applicable federal securities laws that are based upon our current expectations and assumptions concerning future events, which are subject to a number of risks and uncertainties that could cause actual results to differ materially from those anticipated . The words “expect,” “anticipate,” “estimate,” “forecast,” “initiative,” “objective,” “plan,” “goal,” “project,” “outlook,” “priorities,” “target,” “intend,” “evaluate,” “pursue,” “commence,” “seek,” “may,” “would,” “could,” “should,” “believe,” “potential,” “continue,” or the negative of any of those words or similar expressions is intended to identify forward - looking statements . All statements contained in this press release, other than statements of historical fact, including without limitation, statements about our plans, strategies, prospects and expectations regarding future events and our financial performance, are forward - looking statements that involve certain risks and uncertainties . While these statements represent our current judgment on what the future may hold, and we believe these judgments are reasonable, these statements are not guarantees of any events or financial results, and our actual results may differ materially . Important factors that could cause our actual results to be materially different from our expectations include, among others, the risk that ( i ) CIT is unsuccessful in implementing its Amended Capital Plan on the timing and terms contemplated, (ii ) the risk that CIT is unsuccessful in implementing its strategy and business plan, (iii ) the risk that CIT is unable to react to and address key business and regulatory issues, ( iv) the risk that CIT is unable to achieve the projected revenue growth from its new business initiatives or the projected expense reductions from efficiency improvements, and (v) the risk that CIT becomes subject to liquidity constraints and higher funding costs . We describe these and other risks that could affect our results in Item 1 A, “Risk Factors,” of our latest Annual Report on Form 10 - K for the year ended December 31 , 2016 , which was filed with the Securities and Exchange Commission . Accordingly, you should not place undue reliance on the forward - looking statements contained in this press release . These forward - looking statements speak only as of the date on which the statements were made . CIT undertakes no obligation to update publicly or otherwise revise any forward - looking statements, except where expressly required by law . This presentation is to be used solely as part of CIT management’s continuing investor communications program . This presentation shall not constitute an offer or solicitation in connection with any securities .

2 Executing on Our 2017 Priorities to Simplify, Strengthen and Grow CIT 1 Focus on Our Core Businesses 3 Maintain Strong Risk Management 2 Improve Profitability and Return Capital ( 1 ) Commercial allowance for loan losses plus principal loss discount as % of commercial finance receivables (before the princi pal loss discount). (2) Capital ratios preliminary as of 3/31/17 and based on fully phased - in Basel III estimates . ▪ Stable operating trends ▪ Commercial Banking Financing & Leasing Assets up 1% ▪ Net Finance Margin remained strong ▪ Credit trends remain stable ▪ Closed sale of CIT Commercial Air business ▪ Initiated actions to reduce almost $6 billion of unsecured debt ▪ Deposits will increase to 78% post the liability management actions; weighted average deposit coupon decreased 5 bps from the prior year ▪ Achieved ~40% of 2018 operating expense save target ▪ Tangible Book Value per share increased to $46.09 ▪ Commercial credit reserve (1) 2.0% of finance receivables ▪ Non - accruals 0.9% of finance receivables ▪ Common Equity Tier 1 ratio (2) 14.3% | 1Q17 Earnings

3 ($ in M, except per share data) 1Q17 4Q16 1Q16 4Q16 1Q16 Interest Income 456 474 483 (18) (27) Net Operating Lease Revenues (1) 124 125 154 (1) (30) Interest Expense 163 178 195 (15) (32) Net Finance Revenue 417 421 442 (4) (25) Other Income 79 (118) 85 197 (6) Provision for Credit Losses 50 37 90 (13) 40 Goodwill Impairment - 354 - (354) - Loss on Debt Extinguishment and Deposit Redemption - 3 2 (3) (2) Operating Expenses 312 341 330 (30) (19) Pre - tax Income (Loss) from Continuing Operations 134 (432) 105 567 29 (Provision) Benefit for Income Taxes (56) 7 (44) 63 (12) Income (Loss) from Continuing Operations 78 (426) 61 504 17 Income from Discontinued Operations 161 172 90 (11) 71 (Provision) Benefit for Income Taxes (73) (889) (5) 815 (68) Gain on sale of discontinued operations 14 - - 14 14 Income (Loss) from Discontinued Operations, net of taxes 102 (717) 85 818 17 Net Income (Loss) 180 (1,143) 146 1,322 34 Diluted income per common share Income (Loss) from Continuing Operations 0.38 (2.10) 0.30 2.48 0.08 Income (Loss) from Discontinued Operations, net of taxes 0.50 (3.55) 0.42 4.05 0.08 Diluted Income (Loss) per common share 0.88 (5.65) 0.72 6.54 0.16 Earnings Summary Certain balances may not sum due to rounding. ( 1) Net of depreciation and maintenance and other operating lease expenses. | 1Q17 Earnings Average Earning Assets 46,639 46,965 48,107 (326) (1,468) After Tax Return on Average Earnings Assets - Continuing 0.67% NM 0.51% NM 0.16 Return on Average Earning Assets

4 Impact of Noteworthy Items from Strategic Initiatives (Non - GAAP) (1) Continuing Operations Discontinued Operations Total Reported GAAP Net Income $78 $102 $180 GAAP EPS $0.38 $0.50 $0.88 Noteworthy Items (After - Tax) Other Strategic Initiatives Restructuring Costs ($10) ($10) Currency Translation Adjustments (2) ($7) ($7) Commercial Air Sale Entity Restructuring ($14) ($14) Suspended Depreciation $69 $69 Secured Debt Pay - off ($34) ($34) TC - CIT Joint Venture Gain $13 $13 Total Noteworthy Items ($31) $48 $17 Non - GAAP Net Income excluding Noteworthy Items $109 $54 $163 Non - GAAP EPS excluding Noteworthy Items $0.54 $0.26 $0.80 ($ in M, except per share data) EPS based on 203.3 million average diluted shares outstanding, $ impacts are rounded . (1) See appendix page 21 for details on Noteworthy Items included in the 1Q17 results. (2) Related to international business exits in NSP. | 1Q17 Earnings Certain balances may not sum due to rounding

5 ($ in M, except per share data) 1Q17 4Q16 1Q16 4Q16 1Q16 Interest Income 456 474 483 (18) (27) Net Operating Lease Revenues (1) 124 125 154 (1) (30) Interest Expense 163 178 195 (15) (32) Net Finance Revenue 417 421 442 (4) (25) Other Income 87 103 76 (16) 12 Provision for Credit Losses 50 37 90 (13) 40 Goodwill Impairment - - - - - Loss on Debt Extinguishment and Deposit Redemption - 3 2 (3) (2) Operating Expenses 297 310 310 (13) (13) Pre - tax Income from Continuing Operations 157 174 117 (16) 41 Provision for Income Taxes (48) (49) (60) (1) (12) Income from Continuing Operations 109 125 57 (16) 52 Income from Discontinued Operations 87 100 90 (13) (3) Provision for Income Taxes (33) (16) (5) (18) (28) Gain on sale of discontinued operations - - - - - Income from Discontinued Operations, net of taxes 54 84 85 (30) (31) Net Income 163 210 142 (47) 21 Diluted income per common share Income from Continuing Operations 0.54 0.62 0.28 (0.08) 0.26 Income from Discontinued Operations, net of taxes 0.26 0.42 0.42 (0.16) (0.16) Diluted Income per common share 0.80 1.04 0.70 (0.24) 0.10 Earnings Summary Excluding Noteworthy Items (Non - GAAP) Certain balances may not sum due to rounding. ( 1) Net of depreciation and maintenance and other operating lease expenses. | 1Q17 Earnings Average Earning Assets 46,639 46,965 48,107 (326) (1,468) After Tax Return on Average Earnings Assets - Continuing 0.94% 1.07% 0.47% (0.13) 0.47 Return on Average Earning Assets
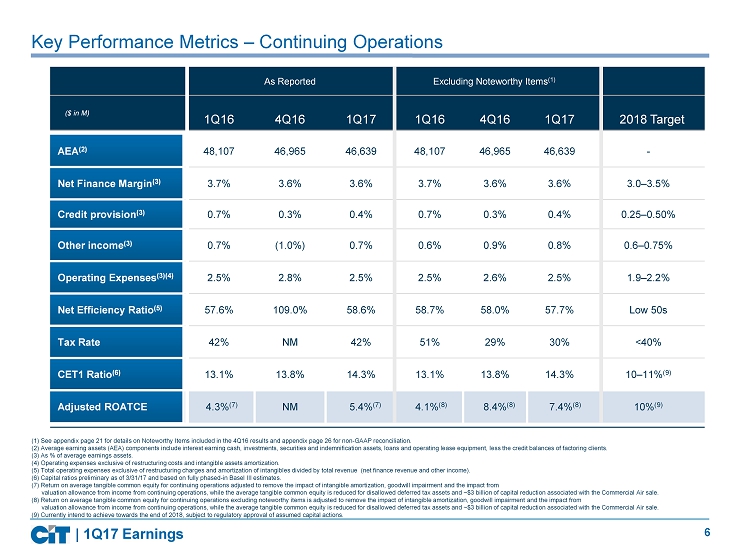
6 Key Performance Metrics – Continuing Operations As Reported Excluding Noteworthy Items (1) ($ in M) 1Q16 4Q16 1Q17 1Q16 4Q16 1Q17 2018 Target AEA (2) 48,107 46,965 46,639 48,107 46,965 46,639 - Net Finance Margin (3) 3.7% 3.6% 3.6% 3.7% 3.6% 3.6% 3.0 – 3.5% Credit provision (3) 0.7% 0.3% 0.4% 0.7% 0.3% 0.4% 0.25 – 0.50% Other income (3) 0.7% (1.0%) 0.7% 0.6% 0.9% 0.8% 0.6 – 0.75% Operating Expenses (3)(4) 2.5% 2.8% 2.5% 2.5% 2.6% 2.5% 1.9 – 2.2% Net Efficiency Ratio (5) 57.6% 109.0% 58.6% 58.7% 58.0% 57.7% Low 50s Tax Rate 42% NM 42% 51% 29% 30% <40% CET1 Ratio (6) 13.1% 13.8% 14.3% 13.1% 13.8% 14.3% 10 – 11% (9) Adjusted ROATCE 4.3% (7) NM 5.4% (7) 4.1% (8) 8.4% (8) 7.4% (8) 10% (9) (1 ) See appendix page 21 for details on Noteworthy Items included in the 4Q16 results and appendix page 26 for non - GAAP reconciliation. (2) Average earning assets (AEA) components include interest earning cash, investments, securities and indemnification assets, loans and ope rating lease equipment, less the credit balances of factoring clients. ( 3 ) As % of average earnings assets . (4) Operating expenses exclusive of restructuring costs and intangible assets amortization. (5) Total operating expenses exclusive of restructuring charges and amortization of intangibles divided by total revenue (net finance revenue and other income). (6) Capital ratios preliminary as of 3/31/17 and based on fully phased - in Basel III estimates. (7) Return on average tangible common equity for continuing operations adjusted to remove the impact of intangible amortization, goo dwill impairment and the impact from valuation allowance from income from continuing operations, while the average tangible common equity is reduced for disall owed deferred tax assets and ~$3 billion of capital reduction associated with the Commercial Air sale . (8) Return on average tangible common equity for continuing operations excluding noteworthy items is adjusted to remove the impac t o f intangible amortization, goodwill impairment and the impact from valuation allowance from income from continuing operations, while the average tangible common equity is reduced for disall owed deferred tax assets and ~$3 billion of capital reduction associated with the Commercial Air sale. ( 9 ) Currently intend to achieve towards the end of 2018, subject to regulatory approval of assumed capital actions. | 1Q17 Earnings

7 Financing & Leasing Assets (FLA) – Continuing Operations Highlights 11.8 11.2 10.7 10.3 10.0 6.9 7.0 7.1 7.2 7.2 5.4 5.7 5.4 5.6 5.7 7.1 7.0 7.3 7.3 7.9 7.2 7.2 7.2 7.0 6.9 1.2 1.1 1.0 0.2 0.2 0 20 40 1Q16 2Q16 3Q16 4Q16 1Q17 ($ in B) Commercial Banking: ▪ Commercial Finance: Decreased resulting from portfolio positioning activities, including the sale of ~$130 million in loans as we emphasize opportunities to build upon our specialty lending expertise and broaden relation ships ▪ Rail: Flat driven by deliveries from the order - book, offset by asset sales and depreciation (~$270 million remaining in the order - book) ▪ Real Estate Finance : Increased driven by new business volume and lower prepayments ▪ Business Capital: Increased driven by growth in Commercial Services Consumer Banking: Legacy Consumer Mortgages annualized run - off of 12% in the quarter and a slight d ecrease in Other Consumer Banking Non - Strategic Portfolios: Slightly down reflecting portfolio run - off $39.5 $38.9 $38.7 $37.7 $37.8 Total Reported Consumer Banking Non - Strategic Portfolios Rail Commercial Finance Real Estate Finance Business Capital Commercial Banking Totals may not sum due to rounding | 1Q17 Earnings

8 ▪ Net Finance Revenue excluding the impact of purchase accounting accretion increased 4% from prior quarter ▪ Stable Net Finance Margin compared to prior quarter primarily reflecting: - ~ 15 bps related to lower purchase accounting accretion, primarily due to prior period prepayments - ~5 bps related to a reduction in other prepayment benefits + ~12 bps related to a reduction in interest expense + ~7 bps related to loan mix, investment securities build out and LIBOR benefits 367 361 347 347 361 75 73 71 74 56 3.67% 3.63% 3.51% 3.58% 3.57% 1Q16 2Q16 3Q16 4Q16 1Q17 Net Finance Revenue and other items PAA NFM Net Finance Margin Trends – Continuing Operations ($ in M) Yield/Cost Analysis (2) 1Q17 4Q16 1Q16 4Q16 1Q16 Interest bearing deposits and investments 1.77% 1.54% 1.24% 0.23 0.53 Loans 5.85 6.07 5.88 (0.22) (0.03) Operating leases (net) 6.61 6.72 8.80 (0.11) (2.19) Indemnification assets (9.50) (9.42) (3.13) (0.08) (6.37 Earning assets 4.97 5.10 5.29 (0.13) (0.32) Deposits 1.21 1.24 1.25 (0.03) (0.04) Borrowings 1.87 2.23 2.37 (0.36) (0.50) Interest - bearing liabilities 1.43 1.56 1.67 (0.13) (0.24) Net Finance Revenue & Net Finance Margin 442 434 (1) Other items include suspended depreciation, interest recoveries/prepayments, other loan and debt FSA. (2) More detail is available in the average balance sheet within the first quarter 2017 earnings release. (1) Highlights 418 421 417 | 1Q17 Earnings
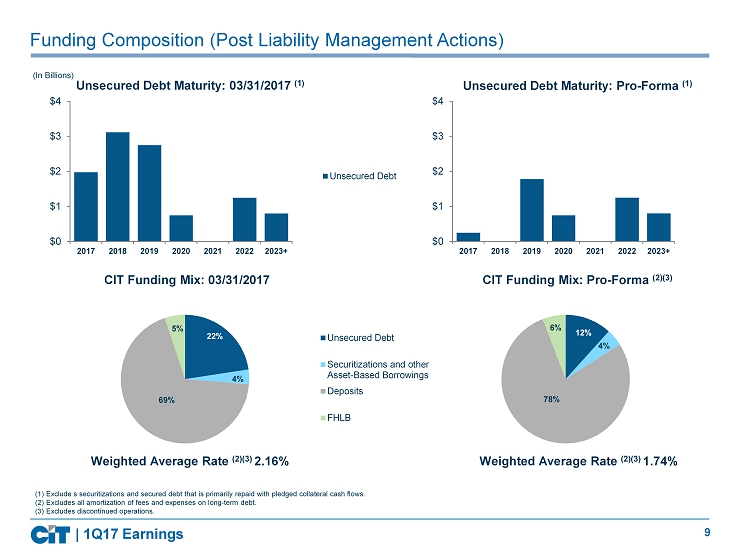
9 Funding Composition (Post Liability Management Actions) Unsecured Debt Maturity: 03/31/2017 (1) Weighted Average Rate (2)(3) 2.16% CIT Funding Mix: 03/31/2017 CIT Funding Mix: Pro - Forma (2)(3) Weighted Average Rate (2)(3) 1 .74% $0 $1 $2 $3 $4 2017 2018 2019 2020 2021 2022 2023+ Unsecured Debt Unsecured Debt Maturity: Pro - Forma (1) (1) E xclude s securitizations and secured debt that is primarily repaid with pledged collateral cash flows . (2) Excludes all amortization of fees and expenses on long - term debt. (3) Excludes discontinued operations. (In Billions) Unsecured Debt Securitizations and other Asset-Based Borrowings Deposits FHLB 69 % 22 % 4 % 5 % 12 % 4% 78% 6 % $0 $1 $2 $3 $4 2017 2018 2019 2020 2021 2022 2023+ | 1Q17 Earnings
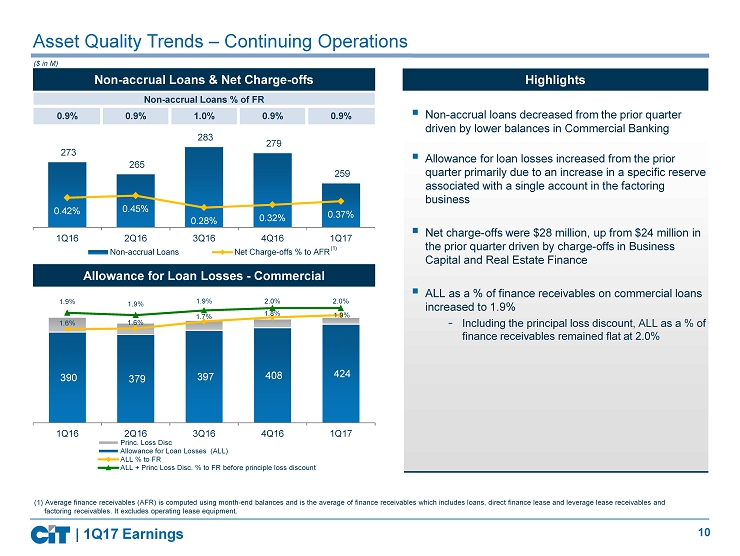
10 Asset Quality Trends – Continuing Operations ($ in M) 273 265 283 279 259 0.42% 0.45% 0.28% 0.32% 0.37% 1Q16 2Q16 3Q16 4Q16 1Q17 Non-accrual Loans Net Charge-offs % to AFR 390 379 397 408 424 1.6% 1.6% 1.7% 1.8% 1.9% 1.9% 1.9% 1.9% 2.0% 2.0% 1Q16 2Q16 3Q16 4Q16 1Q17 Princ. Loss Disc Allowance for Loan Losses (ALL) ALL % to FR ALL + Princ Loss Disc. % to FR before principle loss discount (1) (1) Average finance receivables (AFR) is computed using month - end balances and is the average of finance receivables which includes loans, direct finance lease and leverage lease receivables and factoring receivables. It excludes operating lease equipment . Non - accrual Loans & Net Charge - offs Allowance for Loan Losses - Commercial ▪ Non - accrual loans decreased from the prior quarter driven by lower balances in Commercial Banking ▪ Allowance for loan losses increased from the prior quarter primarily due to an increase in a specific reserve associated with a single account in the factoring business ▪ N et charge - offs were $28 million, u p from $24 million in the prior quarter driven by charge - offs in Business Capital and Real Estate Finance ▪ ALL as a % of finance receivables on commercial loans increased to 1.9% - Including the principal loss discount, ALL as a % of finance receivables remained flat at 2.0% Highlights Non - accrual Loans % of FR 0.9% 0.9% 1.0% 0.9% 0.9% | 1Q17 Earnings

11 26 24 29 26 26 30 26 29 27 29 5 23 13 11 9 24 27 13 16 -55 -30 -5 20 45 70 95 120 145 Other Income Trends – Continuing Operations Factoring commissions Fee revenues Gains on sales of leasing equipment All other income ($ in M) 1Q16 3 Q16 4Q 16 1 Q17 2 Q16 Total Reported ▪ Flat factoring commissions reflecting higher volume and a decline in commission rates primarily due to mix ▪ Higher fee revenues driven by increased capital market fees ▪ Gains on sale of leasing equipment driven by the sale of rail cars ▪ All other income primarily reflects: - Currency translation adjustment charge of approximately $8 million in NSP (noteworthy item) Highlights $85 $100 $84 ($118) $79 (182) | 1Q17 Earnings

12 ▪ Continued progress on operating expense reduction program ▪ Achieved approximately 40% of $150 million annual expense reduction goal; based on $1.2 billion 4Q15 normalized annual run ra te ▪ Reduction from prior quarter reflects absences of noteworthy and elevated costs from OneWest legacy matters as well as a reduction in costs associated with strategic initiatives ▪ Operating expenses in the current quarter also benefited from the timing of technology expenditures All Other Operating Expenses Third Party Costs Amortization of Intangibles Restructuring Charges Operating Expenses Trends – Continuing Operations Certain balances may not sum due to rounding. (1) Total operating expenses exclusive of restructuring charges and amortization of intangibles divided by total revenue (Net finance m arg in and other income ). (2) Net Efficiency ratio excluding noteworthy items, see appendix page 21 for non - GAAP reconciliation. Highlights 58%/59% 55% 59% 109%/58% 59%/58% Net Efficiency Ratio (1) 296 285 286 309 275 330 309 303 341 312 1Q16 2Q16 3Q16 4Q16 1Q17 17 NSP Direct 2 ($ in M) (2) | 1Q17 Earnings 13 (2) (2)

13 ▪ Net Finance Revenue decreased reflecting lower interest expense that was more than offset by lower purchase accounting accretion and lower prepayment benefits ▪ Other Income decreased reflecting a $22 million gain on an investment related to a loan workout in Commercial Finance in the prior quarter ▪ Credit Provision increased reflecting an increase in a specific reserve associated with a single account in the factoring business ▪ Operating Expenses decrease primarily driven by lower compensation expenses ▪ Pre - tax Income increased due to lower credit costs and lower operating expenses, partially offset by lower purchase accounting accretion and a lower margin in Rail Commercial Banking $ Inc/ (Dec) ($ in M) 1Q17 4Q16 1Q16 4Q16 1Q16 Interest Income 308 322 324 (15) (17) Net Rental Income (1) 124 125 150 (1) (26) Interest Expense 120 127 130 (7) (10) Net Finance Revenue 312 320 344 (8) (32) Other Income 72 92 58 (19) 14 Credit Provision 49 31 86 18 (37) Goodwill Impairment - 35 - (35) - Operating Expenses 179 183 197 (5) (19) Pre - tax Income 156 163 118 (7) 38 Key Metrics 1Q17 4Q16 1Q16 4Q16 1Q16 AEA 29,305 29,505 29,967 (200) (662) NFM 4.3% 4.3% 4.6% (0.1%) (0.3%) Net Efficiency Ratio 46.2% 52.6% 48.7% 6.4% 2.6% PTI - ROAEA 2.1% 2.2% 1.6% (0.1%) 0.6% Certain balances may not sum due to rounding. (1) Net of depreciation and maintenance and other operating lease expenses. vs. Prior Quarter vs. Year - ago Quarter Commentary | 1Q17 Earnings

14 ▪ Net Finance Revenue decreased due to lower purchase accounting accretion ▪ Other Income was essentially flat ▪ Credit Provision decreased due to higher reserves on certain Legacy Consumer Mortgage loans in the prior quarter ▪ Operating Expenses decreased absent $27 million in charges from legacy OneWest Bank matters in the prior quarter ▪ Pre - tax Income was essentially flat, primarily driven by higher net finance revenue and lower credit provision, offset by higher operating expenses Commentary $ Inc/ (Dec) ($ in M) 1Q17 4Q16 1Q16 4Q16 1Q16 Interest Income 100 107 105 (7) (5) Interest Expense (7) (4) 8 3 15 Net Finance Revenue 107 110 97 (4) 9 Other Income 8 7 8 1 - Credit Provision 1 6 3 5 3 Goodwill Impairment - 319 - (319) - Operating Expenses 96 123 85 (27) 11 Pre - tax Income (Loss) 18 (331) 17 349 1 Key Metrics 1Q17 4Q16 1Q16 4Q16 1Q16 AEA 7,292 7,458 7,589 (166) (297) NFM 5.8% 5.9% 5.1% (0.1%) 0.7% Net Efficiency Ratio 79.5% 100.5% 76.3% 21.0% (3.2%) PTI - ROAEA 1.0% (17.7%) 0.9% 18.7% 0.1% Consumer Banking Certain balances may not sum due to rounding. vs. Prior Quarter vs. Year - ago Quarter | 1Q17 Earnings

15 Commercial Air Sale – Current Estimated Remaining Financial Impact (1) Item 4Q16 1Q17 2Q17 Total Oct. 6 th Presentation Premium - $410 $410 (2) $600 Suspended Depreciation $110 $110 - $220 - Other Settlement Items - $10 ($210) ($200) ($200) Gain on Sale (Pre - Tax) Total $110 $120 $200 $430 $400 Debt Extinguishment and Transaction Costs (Pre - Tax) ($250) (3) ($40) ($260) ($550) ($550) GAAP Taxes ($770) (4) ($70) ($80) ($920) ($1,100) Net P&L ($910) ($10) ($140) ($1,040) ($1,250) Goodwill & Intangibles - - $140 $140 $150 Total Impact to TBV before capital actions ($910) ($10) - ($900) ($1,100) ($ i n M pre - tax, except GAAP taxes item) ( 1 ) All activity in discontinued operations, except for TRS termination charge in 4Q16 of $243 million and debt extinguishment and transaction costs in 2Q17 estimated to be ~$185 million . (2) Remaining premium of $410 million to be recognized as gain. ( 3 ) Amount of TRS termination charge related to Commercial Air of $125 million assumed in the transaction adjustments assumption on October 6 th . Actual amount of charge was $243 million for termination of entire Canadian facility. In addition, incurred approximately $7 million in costs for terminatio n of secured debt. (4) Updated to reflect tax impact of full Canadian TRS termination and estimated tax rates. Current estimated change in TBV better than original estimate as the cost related to the termination of the Canadian TRS, was partially offset by lower assumed debt costs and taxes Total premium = $630 | 1Q17 Earnings
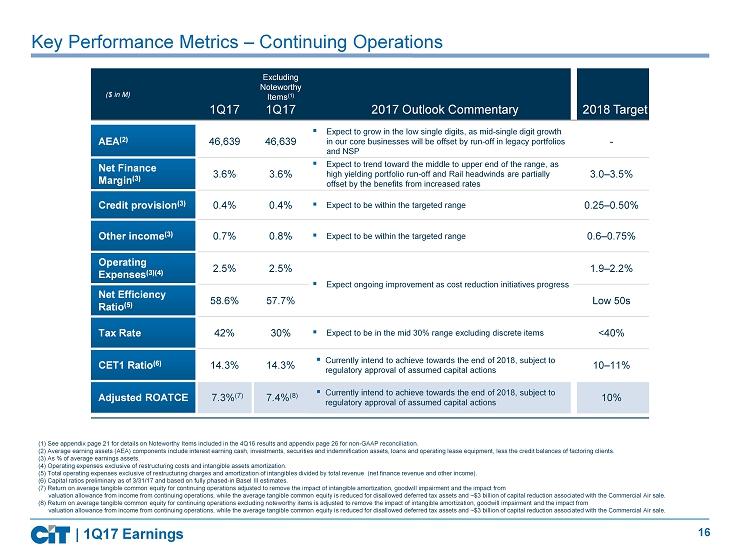
16 Key Performance Metrics – Continuing Operations ($ in M) 1Q17 Excluding Noteworthy Items (1) 1Q17 2017 Outlook Commentary 2018 Target AEA (2) 46,639 46,639 ▪ Expect to grow in the low single digits, as mid - single digit growth in our core businesses will be offset by run - off in legacy portfolios and NSP - Net Finance Margin (3) 3.6% 3.6% ▪ Expect to trend toward the middle to upper end of the range, as high yielding portfolio run - off and Rail headwinds are partially offset by the benefits from increased rates 3.0 – 3.5% Credit provision (3) 0.4% 0.4% ▪ Expect to be within the targeted range 0.25 – 0.50% Other income (3) 0.7% 0.8% ▪ Expect to be within the targeted range 0.6 – 0.75% Operating Expenses (3)(4) 2.5% 2.5% ▪ Expect ongoing improvement as cost reduction initiatives progress 1.9 – 2.2% Net Efficiency Ratio (5) 58.6% 57.7% Low 50s Tax Rate 42% 30% ▪ Expect to be in the mid 30% range excluding discrete items <40% CET1 Ratio (6) 14.3% 14.3% ▪ Currently intend to achieve towards the end of 2018, subject to regulatory approval of assumed capital actions 10 – 11% Adjusted ROATCE 7.3% (7) 7.4% (8) ▪ Currently intend to achieve towards the end of 2018, subject to regulatory approval of assumed capital actions 10% (1) See appendix page 21 for details on Noteworthy Items included in the 4Q16 results and appendix page 26 for non - GAAP reconciliation. (2) Average earning assets (AEA) components include interest earning cash, investments, securities and indemnification assets, loans and ope rating lease equipment, less the credit balances of factoring clients. ( 3 ) As % of average earnings assets . (4) Operating expenses exclusive of restructuring costs and intangible assets amortization. (5) Total operating expenses exclusive of restructuring charges and amortization of intangibles divided by total revenue (net finance revenue and other income). (6) Capital ratios preliminary as of 3/31/17 and based on fully phased - in Basel III estimates. (7) Return on average tangible common equity for continuing operations adjusted to remove the impact of intangible amortization, goo dwill impairment and the impact from valuation allowance from income from continuing operations, while the average tangible common equity is reduced for disall owed deferred tax assets and ~$ 3 billion of capital reduction associated with the Commercial Air sale. (8) Return on average tangible common equity for continuing operations excluding noteworthy items is adjusted to remove the impac t o f intangible amortization, goodwill impairment and the impact from valuation allowance from income from continuing operations, while the average tangible common equity is reduced for disall owed deferred tax assets and ~$ 3 billion of capital reduction associated with the Commercial Air sale. | 1Q17 Earnings

17 | 1Q17 Earnings 2017 Focus Continue to grow our core operations in Commercial Banking and broadening our relationships with existing clients across specialty verticals Leverage our digital platform in Consumer Banking and Small Business Lending Continue to make progress towards our expense targets Reduce our funding costs and grow our deposits with greater efficiency Maintain strong capital and risk management processes Return capital to shareholders Executing on O ur Priorities to Simplify, Strengthen and Grow CIT O perating trends remain stable Completed the Sale of Commercial Air

18 APPENDIX | 1Q17 Earnings

19 13.7% 14.0% 14.3% 14.6% 15.1% 13.1% 13.4% 13.6% 13.8% 14.3% 13.7% 13.8% 14.2% 13.9% 14.6% 1Q16 2Q16 3Q16 4Q16 1Q17 Total Capital Ratio CET1 Ratio Tier 1 Leverage Ratio Strong Capital Position 9.9 9.9 10.0 9.2 9.4 9.1 9.1 9.3 9.0 9.2 1Q16 2Q16 3Q16 4Q16 1Q17 TBV CET1 Capital Tangible Book Value / CET1 Risk Based Capital Ratios (1) ▪ Total capital comprised mostly of CET1 capital ▪ CET1 and Total regulatory capital ratios increased from the previous quarter primarily due to the decrease in RWA and higher stockholders equity - RWA declined primarily driven by a decline in balance sheet assets Highlights (1) Capital ratios preliminary as of 3/31/17 and based on fully phased - in Basel III estimates. ($ in B) 69.2 67.8 67.5 65.1 64.5 1Q16 2Q16 3Q16 4Q16 1Q17 Risk Weighted Assets (RWA) ($ in B) | 1Q17 Earnings
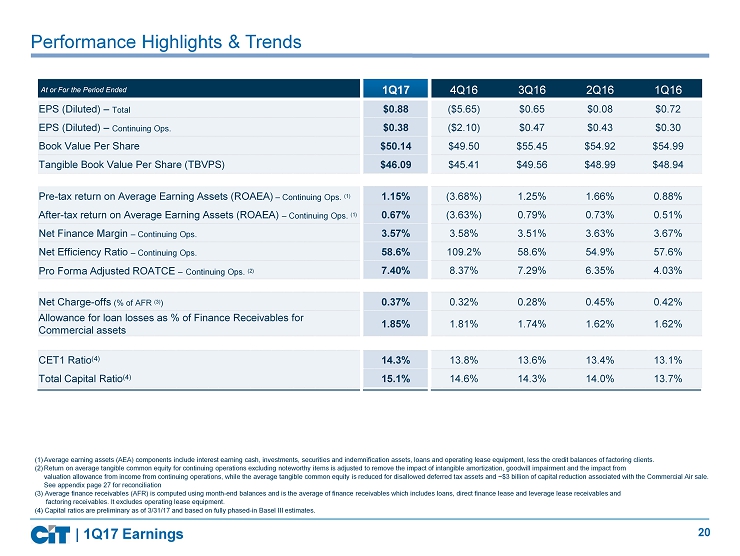
20 (1) Average earning assets (AEA) components include interest earning cash, investments, securities and indemnification assets, loans and operating lease equip men t, less the credit balances of factoring clients . (2) Return on average tangible common equity for continuing operations excluding noteworthy items is adjusted to remove the impact of in tan gible amortization, goodwill impairment and the impact from valuation allowance from income from continuing operations, while the average tangible common equity is reduced for disallowed deferred ta x assets and ~$3 billion of capital reduction associated with the Commercial Air sale. See appendix page 27 for reconciliation ( 3 ) Average finance receivables (AFR) is computed using month - end balances and is the average of finance receivables which include s loans, direct finance lease and leverage lease receivables and factoring receivables. It excludes operating lease equipment. (4) Capital ratios are preliminary as of 3/31/17 and based on fully phased - in Basel III estimates. At or For the Period Ended 1Q17 4Q16 3Q16 2Q16 1Q16 EPS (Diluted) – Total $0.88 ($5.65) $0.65 $0.08 $0.72 EPS (Diluted) – Continuing Ops. $0.38 ($2.10) $0.47 $0.43 $0.30 Book Value Per Share $50.14 $49.50 $55.45 $54.92 $54.99 Tangible Book Value Per Share (TBVPS) $46.09 $45.41 $49.56 $48.99 $48.94 Pre - tax r eturn on Average Earning Assets (ROAEA) – Continuing Ops. (1) 1.15% (3.68%) 1.25% 1.66% 0.88% After - tax r eturn on Average Earning Assets (ROAEA) – Continuing Ops. (1) 0.67% (3.63%) 0.79% 0.73% 0.51% Net Finance Margin – Continuing Ops. 3.57% 3.58% 3.51% 3.63% 3.67% Net Efficiency Ratio – Continuing Ops. 58.6% 109.2% 58.6% 54.9% 57.6% Pro Forma Adjusted ROATCE – Continuing Ops. (2) 7.40% 8.37% 7.29% 6.35% 4.03% Net Charge - offs (% of AFR (3) ) 0.37% 0.32% 0.28% 0.45% 0.42% A llowance for loan losses as % of Finance Receivables for Commercial assets 1.85% 1.81% 1.74% 1.62% 1.62% CET1 Ratio (4) 14.3% 13.8% 13.6% 13.4% 13.1% Total Capital Ratio (4) 15.1% 14.6% 14.3% 14.0% 13.7% Performance Highlights & Trends | 1Q17 Earnings
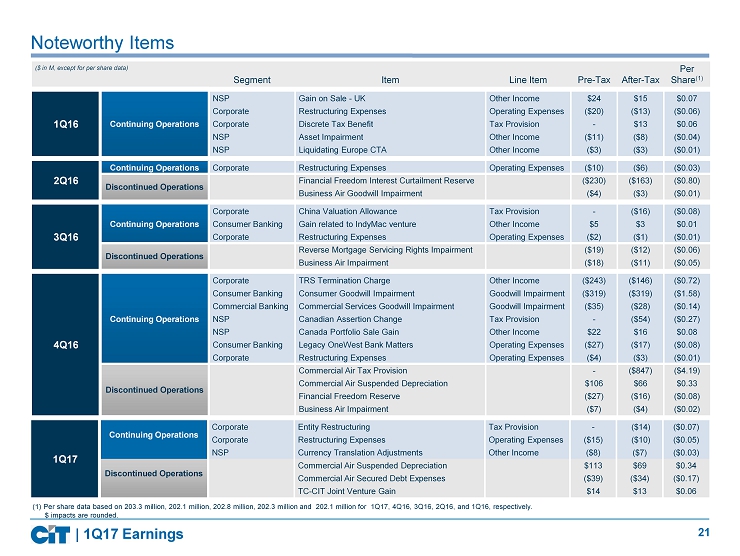
21 Segment Item Line Item Pre - Tax After - Tax Per Share (1) 1Q16 Continuing Operations NSP Gain on Sale - UK Other Income $24 $15 $0.07 Corporate Restructuring Expenses Operating Expenses ($20) ($13) ($0.06) Corporate Discrete Tax Benefit Tax Provision - $13 $0.06 NSP Asset Impairment Other Income ($11) ($8) ($0.04) NSP Liquidating Europe CTA Other Income ($3) ($3) ($0.01) 2Q16 Continuing Operations Corporate Restructuring Expenses Operating Expenses ($10) ($6) ($0.03) Discontinued Operations Financial Freedom Interest Curtailment Reserve ($230) ($163) ($0.80) Business Air Goodwill Impairment ($4) ($3) ($0.01) 3Q16 Continuing Operations Corporate China Valuation Allowance Tax Provision - ($16) ($0.08) Consumer Banking Gain related to IndyMac venture Other Income $5 $3 $0.01 Corporate Restructuring Expenses Operating Expenses ($2) ($1) ($0.01) Discontinued Operations Reverse Mortgage Servicing Rights Impairment ($19) ($12) ($0.06) Business Air Impairment ($18) ($11) ($0.05) 4Q16 Continuing Operations Corporate TRS Termination Charge Other Income ($243) ($146) ($0.72) Consumer Banking Consumer Goodwill Impairment Goodwill Impairment ($319) ($319) ($1.58) Commercial Banking Commercial Services Goodwill Impairment Goodwill Impairment ($35) ($28) ($0.14) NSP Canadian Assertion Change Tax Provision - ($54) ($0.27) NSP Canada Portfolio Sale Gain Other Income $22 $16 $0.08 Consumer Banking Legacy OneWest Bank Matters Operating Expenses ($27) ($17) ($0.08) Corporate Restructuring Expenses Operating Expenses ($4) ($3) ($0.01) Discontinued Operations Commercial Air Tax Provision - ($847) ($4.19) Commercial Air Suspended Depreciation $106 $66 $0.33 Financial Freedom Reserve ($27) ($16) ($0.08) Business Air Impairment ($7) ($4) ($0.02) Noteworthy Items ($ in M, except for per share data) | 1Q17 Earnings 1Q17 Continuing Operations Corporate Entity Restructuring Tax Provision - ($14) ($0.07) Corporate Restructuring Expenses Operating Expenses ($15) ($10) ($0.05) NSP Currency Translation Adjustments Other Income ($8) ($7) ($0.03) Discontinued Operations Commercial Air Suspended Depreciation $113 $69 $0.34 Commercial Air Secured Debt Expenses ($39) ($34) ($0.17) TC - CIT Joint Venture Gain $14 $13 $0.06 (1) Per share data based on 203.3 million, 202.1 million, 202.8 million, 202.3 million and 202.1 million for 1Q17, 4Q16 , 3Q16, 2Q16, and 1Q16, respectively. $ impacts are rounded.

22 Commercial Banking Divisional Performance Key Metrics ($ in M) 1Q17 4Q16 1Q16 4Q16 1Q16 FLA 9,970 10,275 11,777 (305) (1,807) AEA 10,217 10,647 11,892 (430) (1,675) Net Finance Revenue 97.8 110.4 113.5 (12.6) (15.7) Gross Yield 5.2% 5.5% 5.2% (0.4%) - NFM 3.8% 4.2% 3.8% (0.3%) - 11,892 11,543 11,085 10,647 10,217 5.17% 5.39% 5.35% 5.54% 5.16% 3.82% 3.99% 3.92% 4.15% 3.83% 1Q16 2Q16 3Q16 4Q16 1Q17 AEA Gross Yield Net Finance Margin Commercial Finance Real Estate Finance | 1Q17 Earnings Key Metrics ($ in M) 1Q17 4Q16 1Q16 4Q16 1Q16 FLA 7,226 7,221 6,897 5 329 AEA 7,320 7,287 6,882 33 438 Net Finance Revenue 81.8 78.1 100.2 3.7 (18.4) Gross Yield 12.0% 12.2% 13.7% (0.2%) (1.8%) NFM 4.5% 4.3% 5.8% 0.2% (1.4%) 6,882 7,037 7,164 7,287 7,320 13.73% 13.16% 12.38% 12.22% 11.98% 5.82% 5.35% 4.33% 4.29% 4.47% 1Q16 2Q16 3Q16 4Q16 1Q17 AEA Gross Yield Net Finance Margin Rail

23 Commercial Banking Divisional Performance (Continued ) Commercial Finance Key Metrics ($ in M) 1Q17 4Q16 1Q16 4Q16 1Q16 FLA 5,655 5,567 5,374 89 282 AEA 5,565 5,502 5,345 64 220 Net Finance Revenue 48.2 52.2 54.5 (4.0) (6.3) Gross Yield 4.9% 5.2% 5.4% (0.3%) (0.5%) NFM 3.5% 3.8% 4.1% (0.3%) (0.6%) Real Estate Finance 5,345 5,461 5,507 5,502 5,565 5.44% 5.17% 5.13% 5.24% 4.90% 4.08% 3.78% 3.74% 3.80% 3.46% 1Q16 2Q16 3Q16 4Q16 1Q17 AEA Gross Yield Net Finance Margin | 1Q17 Earnings Business Capital Key Metrics ($ in M) 1Q17 4Q16 1Q16 4Q16 1Q16 FLA 7,880 7,343 7,064 537 816 AEA 6,202 6,070 5,847 133 355 Net Finance Revenue 83.9 79.3 75.6 4.6 8.3 Gross Yield 9.0% 8.7% 8.3% 0.3% 0.7% NFM 5.4% 5.2% 5.2% 0.2% 0.2% 5,847 5,861 6,021 6,070 6,202 8.32% 8.38% 8.54% 8.71% 9.01% 5.17% 5.16% 5.07% 5.23% 5.41% 1Q16 2Q16 3Q16 4Q16 1Q17 AEA Gross Yield Net Finance Margin

24 Consumer Banking Divisional Performance Legacy Consumer Mortgages Other Consumer Banking (1) Key Metrics ($ in M) 1Q17 4Q16 1Q16 4Q16 1Q16 FLA 4,734 4,863 5,345 (129) (611) AEA 5,126 5,304 5,806 (178) (680) Net Finance Revenue 59.9 63.9 63.6 (4.0) (3.7) Gross Yield 6.3% 6.6% 6.1% (0.2%) 0.2% NFM 4.7% 4.8% 4.4% (0.1%) 0.3% 5,806 5,647 5,481 5,304 5,126 6.12% 6.10% 6.35% 6.56% 6.34% 4.38% 4.36% 4.66% 4.82% 4.67% 1Q16 2Q16 3Q16 4Q16 1Q17 AEA Gross Yield Net Finance Margin Key Metrics ($ in M) 1Q17 4Q16 1Q16 4Q16 1Q16 FLA 2,143 2,179 1,871 (36) 271 AEA 2,166 2,154 1,783 12 383 Net Finance Revenue 46.6 46.6 33.7 - 12.9 Gross Yield 3.5% 3.7% 3.7% (0.2%) (0.2%) NFM 8.6% 8.7% 7.6% - 1.0% 1,783 1,921 2,035 2,154 2,166 3.62% 3.62% 3.54% 3.70% 3.46% 7.57% 7.72% 7.92% 8.66% 8.61% 1Q16 2Q16 3Q16 4Q16 1Q17 AEA Gross Yield Net Finance Margin ( 1 ) Other Consumer Banking offers mortgage lending, deposits and private banking services. | 1Q17 Earnings

25 Petroleum and gas, 46% Rail, 18% Agriculture, 14% Cement and Building Products, 6% Petrochemicals, 6% Coal and Utilities, 3% Chemicals (non petrochemical), 3% Other, 2% Steel and Metals, 1% Mining, 1% Covered Hopper - Other, 33% Covered Hopper - O&G Related, 7% Tank Cars - Other, 14% Tank Cars - O&G Related, 13% Mill/Coil Gondolas, 10% Coal, 9% Boxcars, 7% Flatcars, 4% Other, 3% Locomotives, 0.3% Total Cars: ~117k Diversified North American Rail Fleet Operating Leases by Industry Fleet by Type Diversified fleet serving a broad range of customers and industries - Approximately 500 clients - ~75% shippers and ~25% railroads - Strong credit profile (~50% investment grade) - Young, well maintained equipment ( avg. age: 12 yrs.) Utilization and lease rate trends coming off peak levels across multiple commodity types - Tank cars: ~16,000 for the transportation of crude - Sand c ars: ~9,000 supporting crude and natural gas drilling - Coal cars: ~11,000 for the transportation of coal - ~$390 million in net investment supporting the oil & gas and coal industries up for renewal in 2017 Portfolio management strategies - Shorten lease terms while lease rates are weaker - Bank funding on new deliveries - Selective disposal of non - performing assets - Divert cars from energy to alternative services (e.g. sand to cement, tank cars to ethanol and other refined products, etc.) Total Net Investment:~$6.3B Commentary O&G = Oil and Gas | 1Q17 Earnings Includes Operating Leases only; based on unit count
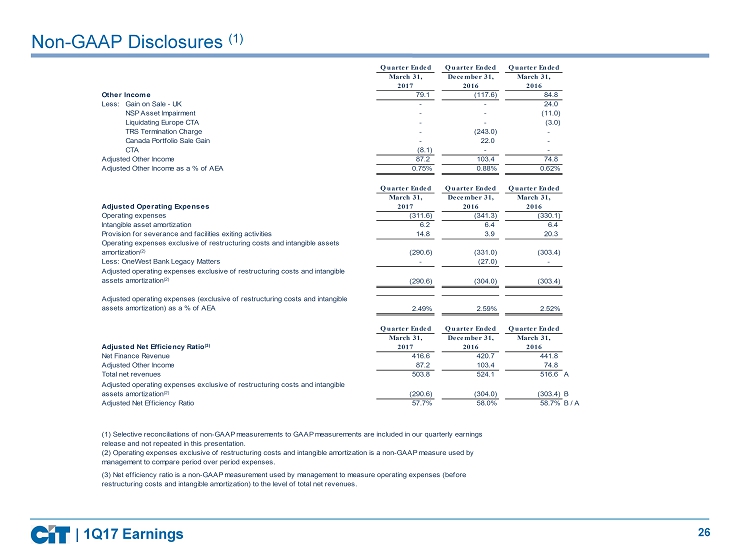
26 Non - GAAP Disclosures (1) | 1Q17 Earnings Quarter Ended Quarter Ended Quarter Ended March 31, December 31, March 31, 2017 2016 2016 Other Income 79.1 (117.6) 84.8 Less: Gain on Sale - UK - - 24.0 NSP Asset Impairment - - (11.0) Liquidating Europe CTA - - (3.0) TRS Termination Charge - (243.0) - Canada Portfolio Sale Gain - 22.0 - CTA (8.1) - - Adjusted Other Income 87.2 103.4 74.8 Adjusted Other Income as a % of AEA 0.75% 0.88% 0.62% Quarter Ended Quarter Ended Quarter Ended March 31, December 31, March 31, Adjusted Operating Expenses 2017 2016 2016 Operating expenses (311.6) (341.3) (330.1) Intangible asset amortization 6.2 6.4 6.4 Provision for severance and facilities exiting activities 14.8 3.9 20.3 Operating expenses exclusive of restructuring costs and intangible assets amortization(2) (290.6) (331.0) (303.4) Less: OneWest Bank Legacy Matters - (27.0) - Adjusted operating expenses exclusive of restructuring costs and intangible assets amortization(2) (290.6) (304.0) (303.4) Adjusted operating expenses (exclusive of restructuring costs and intangible assets amortization) as a % of AEA 2.49% 2.59% 2.52% Quarter Ended Quarter Ended Quarter Ended March 31, December 31, March 31, Adjusted Net Efficiency Ratio(3) 2017 2016 2016 Net Finance Revenue 416.6 420.7 441.8 Adjusted Other Income 87.2 103.4 74.8 Total net revenues 503.8 524.1 516.6 A Adjusted operating expenses exclusive of restructuring costs and intangible assets amortization(2) (290.6) (304.0) (303.4) B Adjusted Net Efficiency Ratio 57.7% 58.0% 58.7%B / A (2) Operating expenses exclusive of restructuring costs and intangible amortization is a non-GAAP measure used by management to compare period over period expenses. (3) Net efficiency ratio is a non-GAAP measurement used by management to measure operating expenses (before restructuring costs and intangible amortization) to the level of total net revenues. (1) Selective reconciliations of non-GAAP measurements to GAAP measurements are included in our quarterly earnings release and not repeated in this presentation.

27 Non - GAAP Disclosures (1) | 1Q17 Earnings Certain balances may not sum due to rounding Capital numbers for current quarter are preliminary ( 1 ) Selective reconciliations of non - GAAP measurements to GAAP measurements are included in our quarterly earnings release and not r epeated in this presentation . Quarter Ended Quarter Ended Quarter Ended Quarter Ended Quarter Ended March 31, December 31, September 30, June 30, March 31, 2017 2016 2016 2016 2016 Net Income from Continuing Operations 78 (426) 94 88 61 A Less: Restructuring Expenses 10 3 1 6 13 CTA 7 - - - 3 Gain on Sale UK - - - - (15) Discrete Tax Benefit - - - - (13) Asset Impairment - - - - 8 China Valuation Allowance - - 16 - - Gain Related to Indymac Venture - - (3) - - Consumer Goodwill Impairment - 319 - - - Commercial Services Goodwill Impairment - 28 - - - TRS Termination Charge - 146 - - - Canada Assertion Change - 54 - - - Canada Portfolio Sale Gain - (16) - - - OneWest Bank Legacy Matters - 17 - - - Entity Restructuring 14 - - - - Total Noteworthy Adjustments 31 551 14 6 (4) Plus: Intangible asset amortization (net of tax) 4 5 5 3 3 B Adjusted Net Income from Continuing Operations 114 131 113 97 60 C Quarter Ended Quarter Ended Quarter Ended Quarter Ended Quarter Ended March 31, December 31, September 30, June 30, March 31, Tangible Common Equity 2017 2016 2016 2016 2016 Average Tangible Common Equity 9,296 9,886 9,984 9,939 9,826 Less: Disallowed DTA - Average (177) (665) (831) (862) (893) Adjusted Tangible Common Equity 9,119 9,221 9,153 9,077 8,932 Less: Capital Reduction Associated with Commercial Air Sale 2,975 2,975 2,975 2,975 2,975 Adjusted TCE for Capital Reduction 6,144 6,246 6,178 6,102 5,957 D ROATCE Adjusted for Capital Reduction 5.36% NM 6.38% 5.96% 4.30% A + B / D ROATCE Adjusted for Noteworthy Items and Capital Reduction 7.40% 8.37% 7.29% 6.35% 4.03% C / D

28