Attached files
| file | filename |
|---|---|
| EX-99.1 - EX-99.1 - SOUTH STATE Corp | ssb-20170421ex99105f716.htm |
| 8-K - 8-K - SOUTH STATE Corp | ssb-20170421x8k.htm |
Exhibit 99.2
|
|
1st Quarter 2017 Earnings Call April 21, 2017 |

|
|
Forward Looking Statements Statements included in this communication which are not historical in nature are intended to be, and are hereby identified as, forward looking statements for purposes of the safe harbor provided by Section 27A of the Securities Act of 1933 and Section 21E of the Securities Exchange Act of 1934. The words “may,” “will,” “anticipate,” “should,” “would,” “believe,” “contemplate,” “expect,” “estimate,” “continue,” “may,” and “intend,” as well as other similar words and expressions of the future, are intended to identify forward looking statements. South State Corporation (“SSB”) cautions readers that forward looking statements are subject to certain risks and uncertainties that could cause actual results to differ materially from anticipated results. Such risks and uncertainties, include, among others, the following possibilities: the possibility that the anticipated benefits of the transaction (between SSB and SBFC) are not realized when expected or at all, including as a result of the impact of, or problems arising from the strength of the economy and competitive factors in the areas where SSB and SBFC do business; including as a result of unexpected factors or events; diversion of management’s attention from ongoing business operations and opportunities; potential adverse reactions or changes to business or employee relationships, including those resulting from the completion of the transaction; credit risk associated with an obligor’s failure to meet the terms of any contract with the bank or otherwise fail to perform as agreed; interest risk involving the effect of a change in interest rates on both the bank’s earnings and the market value of the portfolio equity; liquidity risk affecting the bank’s ability to meet its obligations when they come due; price risk focusing on changes in market factors that may affect the value of traded instruments in “mark-to-market” portfolios; transaction risk arising from problems with service or product delivery; compliance risk involving risk to earnings or capital resulting from violations of or nonconformance with laws, rules, regulations, prescribed practices, or ethical standards; strategic risk resulting from adverse business decisions or improper implementation of business decisions; reputation risk that adversely affects earnings or capital arising from negative public opinion; terrorist activities risk that results in loss of consumer confidence and economic disruptions; cybersecurity risk related to SSB’s dependence on internal computer systems and the technology of outside service providers, as well as the potential impacts of third-party security breaches, subjects the company to potential business disruptions or financial losses resulting from deliberate attacks or unintentional events; economic downturn risk resulting changes in the credit markets, greater than expected noninterest expenses, excessive loan losses and other factors and the implementation of federal spending cuts currently scheduled to go into effect; and other factors that may affect future results of SSB. Additional factors that could cause results to differ materially from those described above can be found in SSB’s Annual Report on Form 10-K for the year ended December 31, 2016, is on file with the Securities and Exchange Commission (the “SEC”) and available in the “Investor Relations” section of SSB’s website, http://www.southstatebank.com, under the heading “SEC Filings” and in other documents SSB files with the SEC. All forward-looking statements speak only as of the date they are made and are based on information available at that time. SSB does not assume any obligation to update forward-looking statements to reflect circumstances or events that occur after the date the forward-looking statements were made or to reflect the occurrence of unanticipated events except as required by federal securities laws. As forward-looking statements involve significant risks and uncertainties, caution should be exercised against placing undue reliance on such statements. 2 |
|
|
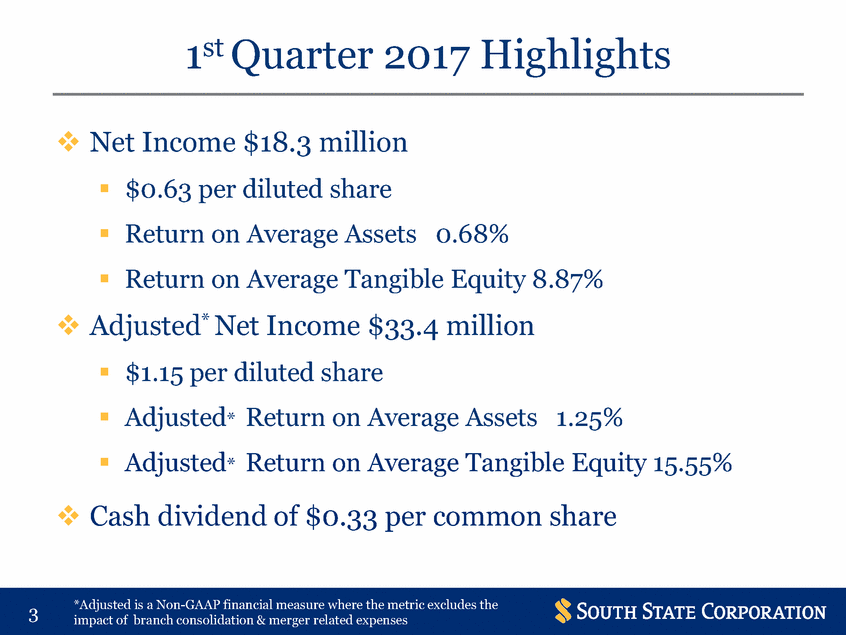
1st Quarter 2017 Highlights Net Income $18.3 million $0.63 per diluted share Return on Average Assets 0.68% Return on Average Tangible Equity 8.87% Adjusted* Net Income $33.4 million $1.15 per diluted share Adjusted* Return on Average Assets 1.25% Adjusted* Return on Average Tangible Equity 15.55% Cash dividend of $0.33 per common share *Adjusted is a Non-GAAP financial measure where the metric excludes the impact of branch consolidation & merger related expenses 3 |
|
|
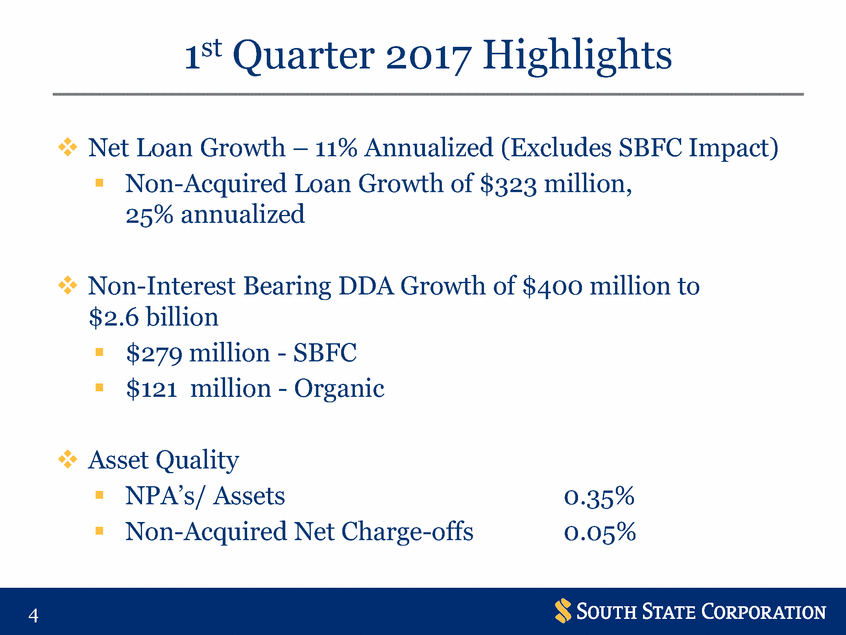
1st Quarter 2017 Highlights Net Loan Growth – 11% Annualized (Excludes SBFC Impact) Non-Acquired Loan Growth of $323 million, 25% annualized Non-Interest Bearing DDA $2.6 billion Growth of $400 million to $279 million - SBFC $121million - Organic Asset Quality NPA’s/ Assets Non-Acquired 0.35% 0.05% Net Charge-offs 4 |
|
|
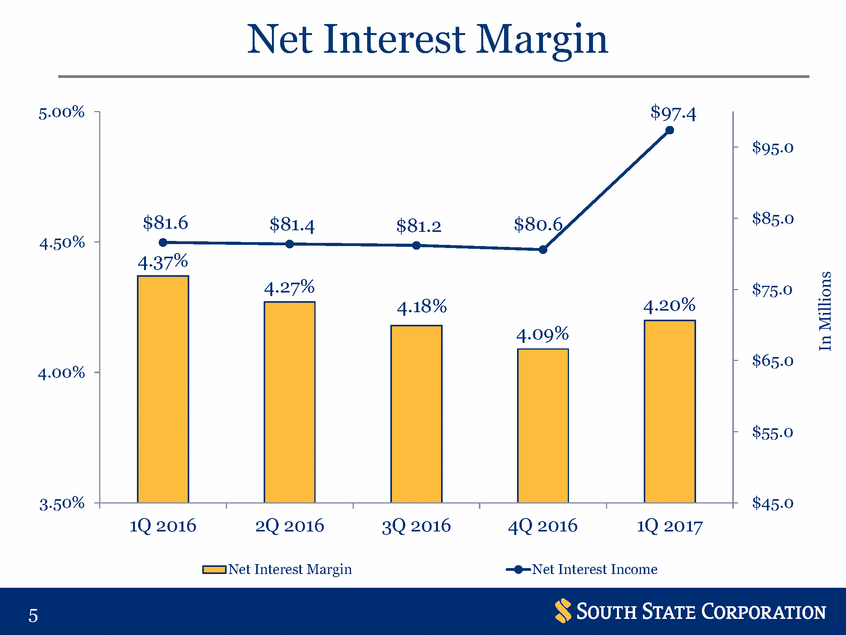
Net Interest Margin $97.4 5.00% $95.0 $85.0 4.50% $75.0 $65.0 4.00% $55.0 3.50% $45.0 1Q 2016 2Q 2016 3Q 2016 4Q 2016 1Q 2017 Net Interest Margin Net Interest Income 5 In Millions $81.6$81.4$81.2$80.6 4.37% 4.27% 4.18%4.20% 4.09% |
|
|
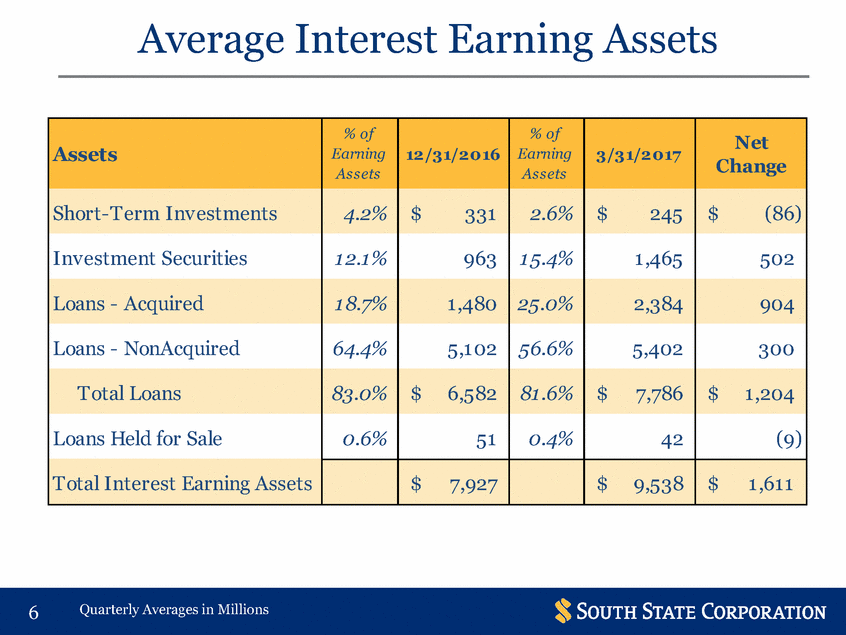
Average Interest Earning Assets Change Quarterly Averages in Millions 6 Assets % of Earning Assets 12 /3 1/2 0 16 % of Earning Assets 3 /3 1/2 0 17 Net Short-T erm Inv estments 4.2% $331 2.6% $245 $(86) Inv estment Securities 1 2.1% 963 1 5.4% 1 ,465 502 Loans - Acquired 1 8.7% 1 ,480 25.0% 2,384 904 Loans - NonAcquired 64.4% 5,1 02 56.6% 5,402 300 T otal Loans 83.0% $6,582 81 .6% $7,786 $1 ,204 Loans Held for Sale 0.6% 51 0.4% 42 (9) T otal Interest Earning Assets $7,927 $9,538 $1 ,611 |
|
|
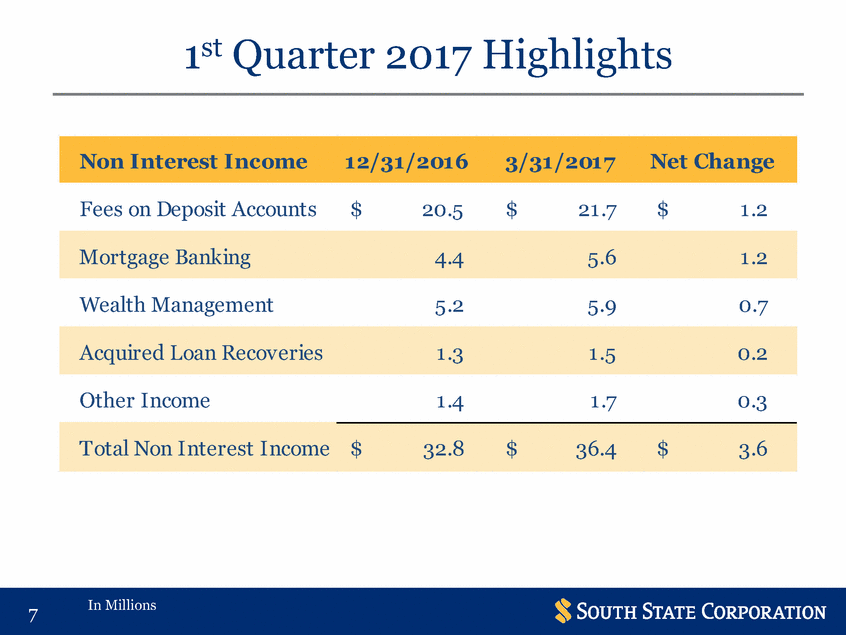
1st Quarter 2017 Highlights Fees on Deposit Accounts $ 20.5 $ 21 .7 $ 1 .2 Wealth Management 5.2 5.9 0.7 Other Income 1 .4 1 .7 0.3 In Millions 7 T otal Non Interest Income$32.8$36.4$3.6 Acquired Loan Recov eries1 .31 .50.2 Mortgage Banking4.45.61 .2 Non Interest Income1 2/31 /201 63/31 /201 7Net Change |
|
|
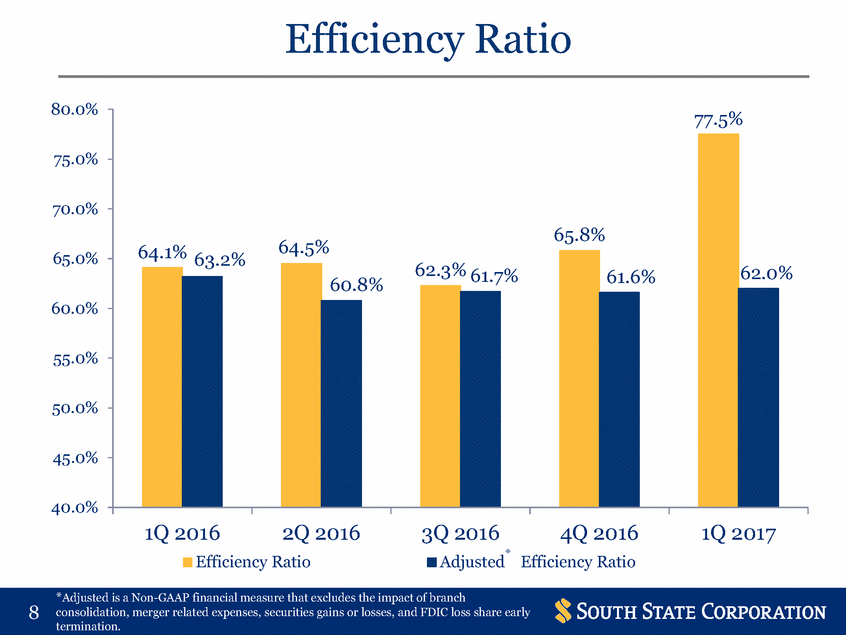
Efficiency Ratio 80.0% 75.0% 70.0% 64.5% 64.1% 65.0% 63.2% 61.7% 60.8% 60.0% 55.0% 50.0% 45.0% 40.0% 1Q 2016 2Q 2016 3Q 2016 4Q 2016 1Q 2017 Adjusted* Efficiency Ratio Efficiency Ratio *Adjusted is a Non-GAAP financial measure that excludes the impact of branch consolidation, merger related expenses, securities gains or losses, and FDIC loss share early termination. 8 77.5% 65.8% 62.0% 61.6% 62.3% |
|
|
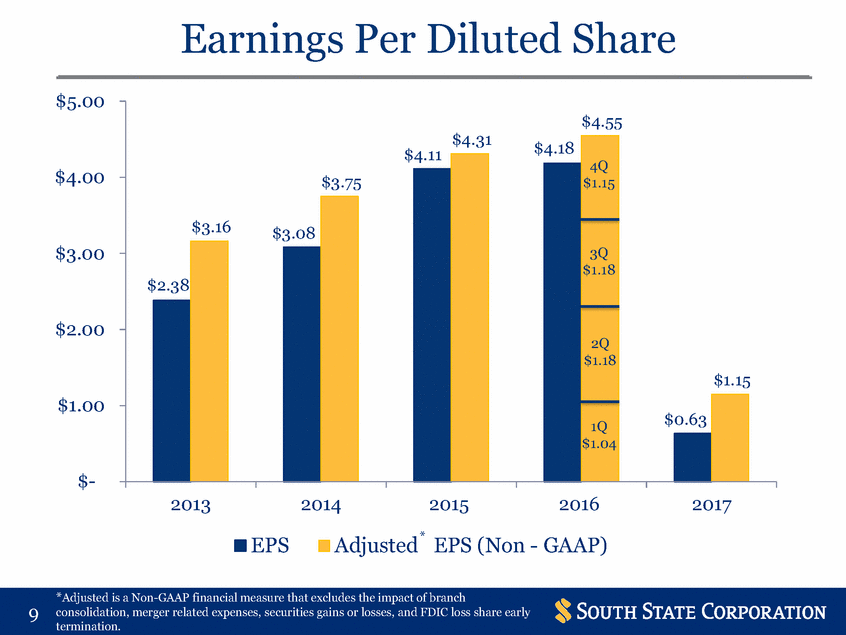
Earnings Per Diluted Share $5.00 $4.31 $4.18 $4.11 $4.00 $3.00 $2.00 $1.00 $-2013 2014 2015 2016 2017 Adjusted * EPS (Non - GAAP) EPS *Adjusted is a Non-GAAP financial measure that excludes the impact of branch consolidation, merger related expenses, securities gains or losses, and FDIC loss share early termination. 9 $4.55 4Q $1.15 $1.15 $3.75 $3.16$3.08 3Q $1.18 $2.38 2Q $1.18 $0.63 1Q $1.04 |
|
|
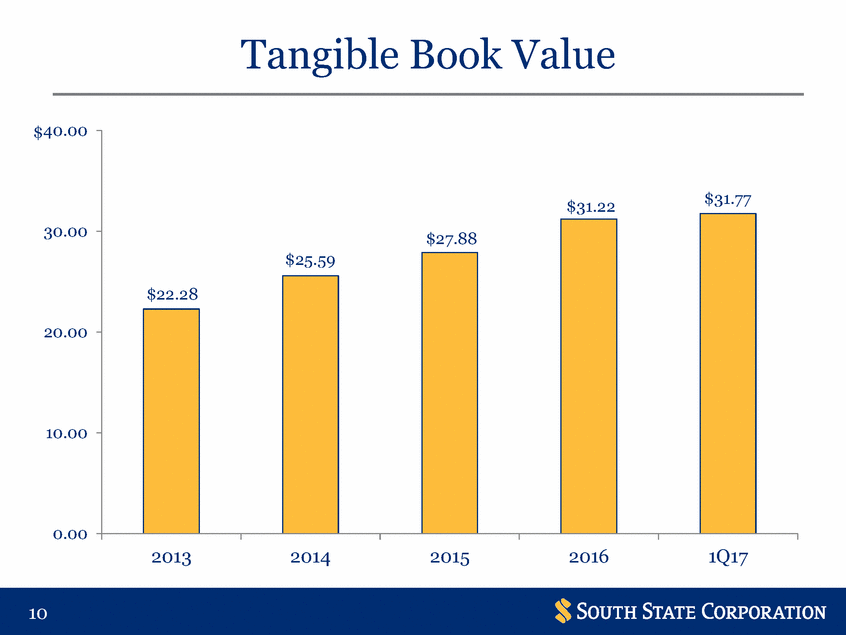
Tangible Book Value $40.00 30.00 20.00 10.00 0.00 2013 2014 2015 2016 1Q17 10 $31.22$31.77 $27.88 $25.59 $22.28 |