Attached files
| file | filename |
|---|---|
| 8-K - 8-K - Virtu Financial, Inc. | a17-11616_18k.htm |
| EX-99.2 - EX-99.2 - Virtu Financial, Inc. | a17-11616_1ex99d2.htm |
Exhibit 99.1
Virtu Financial Agrees to Acquire KCG Holdings Creating the Leading Global Electronic Market Making and Agency Execution Firm April 20, 2017 CONFIDENTIAL
2 CAUTIONARY STATEMENT REGARDING FORWARD LOOKING STATEMENTS This presentation may contain “forward-looking statements” made pursuant to the safe harbor provisions of the Private Securities Litigation Reform Act of 1995. Statements regarding Virtu Financial, Inc.’s (“Virtu’s,” the “Company’s” or “our”) business that are not historical facts are forward-looking statements. Forward-looking statements should not be read as a guarantee of future performance or results, and will not necessarily be accurate indications of the times at, or by which, such performance or results will be achieved. The Company assumes no obligation to update forward-looking statements to reflect actual results, changes in assumptions or changes in other factors affecting forward-looking information, and if the Company does update one or more forward-looking statements, no inference should be drawn that the Company will make additional updates with respect thereto or with respect to other forward-looking statements. Forward-looking statements (which include, without limitation, the Company’s beliefs, expectations, guidance, focus and/or plans regarding future events, including the Company’s plans to consummate the acquisition of KCG Holdings, Inc. (“KCG Holdings”) described herein and the related financing transactions, as well as the terms and conditions of such transactions and the timing thereof) are based on information available at the time and/or management’s good faith belief with respect to future events, and is subject to risks and uncertainties, some or all of which are not predictable or within Virtu’s control, that could cause actual performance or results to differ materially from those expressed in the statements. Those risks and uncertainties include, without limitation: the acquisition of KCG Holdings not being timely completed, if completed at all; risks associated with the financing of the transaction; prior to the completion of such acquisition, our or respective businesses experiencing disruptions due to transaction-related uncertainty or other factors making it more difficult to maintain relationships with employees, business partners or governmental entities; and the parties being unable to successfully implement integration strategies or realize the anticipated benefits of the acquisition, including the possibility that the expected synergies and cost reductions from the proposed acquisition will not be realized or will not be realized within the expected time period. Factors other than those referred to above could also cause the Company’s results to differ materially from expected results, including, without limitation, fluctuations in trading volume and volatilities in the markets in which we operate; the ability of our trading counterparties and various clearing houses to perform their obligations to us; the performance and reliability of our customized trading platform; the risk of material trading losses from our market making activities; swings in valuations in securities or other instruments in which we hold positions; increasing competition and consolidation in our industry; our belief that cash flow from our operations and other available sources of liquidity will be sufficient to fund our various ongoing obligations, including operating expenses, capital expenditures, debt service and dividend payments; regulatory and legal uncertainties and potential changes associated with our industry, particularly in light of increased attention from media, regulators and lawmakers to market structure and related issues; potential adverse results form legal or regulatory proceedings; our ability to remain technologically competitive and to ensure that the technology we utilize is not vulnerable to security risks, hacking and cyber-attacks; risks associated with third party software and technology infrastructure. For a discussion of the risks and uncertainties which could cause actual results to differ from those contained in forward-looking statements, see Virtu’s Securities and Exchange Commission filings, including but not limited to Virtu’s Annual Report on Form 10-K. Disclaimer
3 GAAP AND NON-GAAP RESULTS This presentation includes certain non-GAAP financial measures, including Adjusted Net Trading Income, EBITDA, Adjusted EBITDA, Normalized Adjusted Net Income, Normalized Adjusted Pre-Tax Net Income, Normalized Adjusted Free Cash Flow, Net Cash and Trading Capital (collectively, the “Non-GAAP Measures”), which are used by management in evaluating operating performance and in making strategic decisions. In addition, the Non-GAAP Measures or similar non-GAAP financial measures are used by research analysts, investment bankers and lenders to assess the Company’s operating performance. Management believes that the presentation of the Non-GAAP Measures provide useful information to investors regarding the Company’s results of operations because they assist both investors and management in analyzing and benchmarking the performance and value of the Company’s business. The Non-GAAP Measures provide indicators of general economic performance that are not affected by fluctuations in certain costs or other items. Accordingly, management believes that these measurements are useful for comparing general operating performance from period to period. Moreover, our senior secured credit facility contains covenants and other tests based on metrics similar to Adjusted EBITDA. Other companies may define the Non-GAAP Measures differently, and as a result the Non-GAAP Measures may not be directly comparable to those of other companies. Although we use the Non-GAAP Measures as financial measures to assess the performance of the Company’s business, such use is limited because they do not include certain material costs necessary to operate our business. Non-GAAP financial measures should be considered only as supplemental to, and not as superior to, financial measures prepared in accordance with GAAP. Other companies may use similarly titled non-GAAP financial measures that are calculated differently from the way the Company calculates such measures. Accordingly, the Non-GAAP Measures may not be comparable to similar measures used by other companies. We caution investors not to place undue reliance on the Non-GAAP Measures, but instead to consider them with the most directly comparable GAAP measure. Non-GAAP financial measures have limitations as analytical tools, and should not be considered in isolation, or as a substitute for our results as reported under GAAP. A reconciliation of the Non-GAAP Measures to the most directly comparable financial measure prepared in accordance with GAAP is included in Appendix hereto. Disclaimer (Continued)
Virtu Leverages its Core Strengths in KCG Acquisition 4 Benefits of Combination Combines KCG’s wholesale market making and independent agency execution franchises with Virtu’s extensive liquidity and order routing capabilities Greater scale and cost efficiencies in an increasingly competitive environment Significant Growth Opportunities Provide KCG’s extensive institutional client base with direct access to Virtu’s liquidity in multiple asset classes and geographies Potential for meaningful revenue enhancement not included in base model Upside from natural cycle of volume and volatilities 1 Cost savings net of foregone revenues from rationalized business lines Meaningful Value Creation Over 25% accretion to Virtu earnings per share with fully-phased cost savings and capital synergies Significant value creation: $208mm1 in identified net cost savings and $440mm in capital synergies Combines Virtu's scale, efficiency and operational excellence with KCG's leading client franchises
Transaction Summary 5 $20.00 per share, or approximately $1.4bn equity value1 100% cash consideration Offer represents 1.08x KCG’s tangible book value of $18.61 at 03/31/2017 Terms and conditions Virtu has entered into a commitment with J.P. Morgan Securities LLC to provide up to $1.65 billion of debt financing for the transaction $750mm will be financed through the issuance of Virtu common stock at $15.60 per share Commitments from Temasek and North Island (managed by Robert Greifeld and Glenn Hutchins) with investments from GIC and PSP Strategic Financing Robert Greifeld, former CEO of NASDAQ, and Glenn Hutchins, founder of Silver Lake to join Virtu’s Board Board of Directors In the third quarter of 2017 following receipt of KCG stockholder approval and all applicable regulatory clearances and approvals Anticipated Closing 1 Fully diluted share count of 68.7mm Extensive due diligence, including a comprehensive and detailed review of each KCG business, function and legal entity Due Diligence

Expand Virtu’s access to new order flow KCG Acquisition is Aligned with Virtu’s Strategic Initiatives 6 Virtu’s Strategic Growth Initiatives 1 Expand Virtu’s agency client base 2 Leverage existing scale 3 Impact of Transaction Allows Virtu to access new sources of attractive order flow Introduces Virtu’s enhanced trading and analytic capabilities to KCG’s extensive institutional relationships Increased margin will improve competitive position
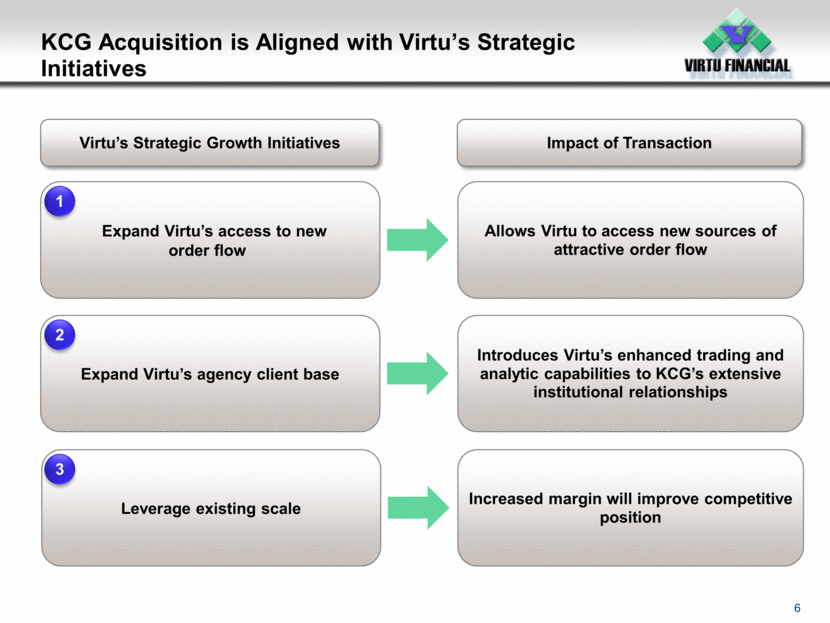
Combination Benefits Both Market-Making and Agency Businesses 7 Wholesale Market Making Principal Market Making Agency Offering Access to wholesale customer order flow Extensive client relationships Superior algorithms Efficient market access and hedging Enhanced internalization Customized liquidity offering across many asset classes Automated and scaled, global ETF market making Algorithms optimized for market micro-structure Unique real-time, post trade analytic platform Dealer to customer liquidity provision in Fixed Income
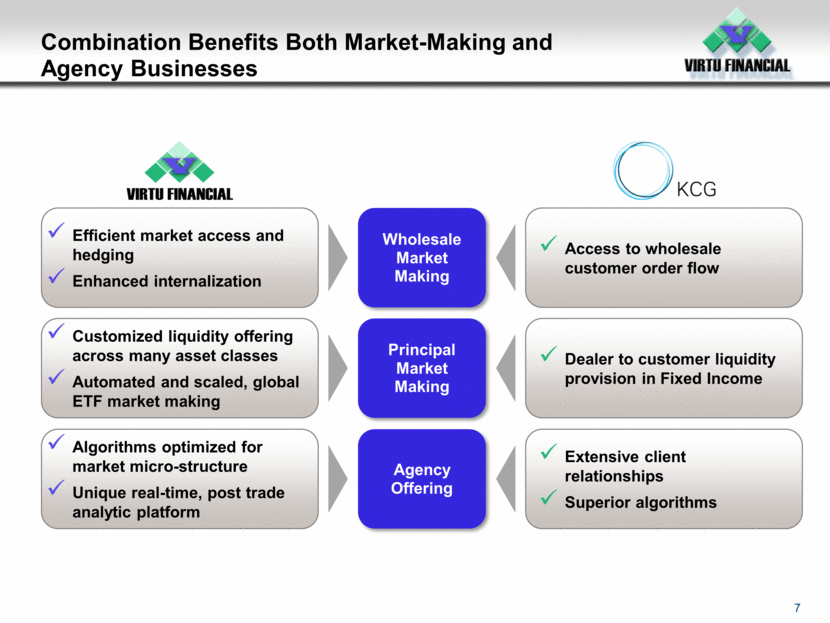
Combination Creates the Leading, Global, Electronic Market Maker on a Single Global Infrastructure 8 1 Represents sum of 2016A adjusted net trading income as reported of $414mm and technology services revenue of as reported of $10mm for Virtu and 2016A net revenues as reported by KCG Market Making 98% Pro-forma Market Making 78% Net revenues (%)1 Americas equities 22% Non - U.S. equities 42% Global FICC 34% Technology and execution 2% Americas equities 47% Non - U.S. equities 11% Global FICC 20% Technology and execution 19% Other 3% Market making 66% Execution 29% Other 5%
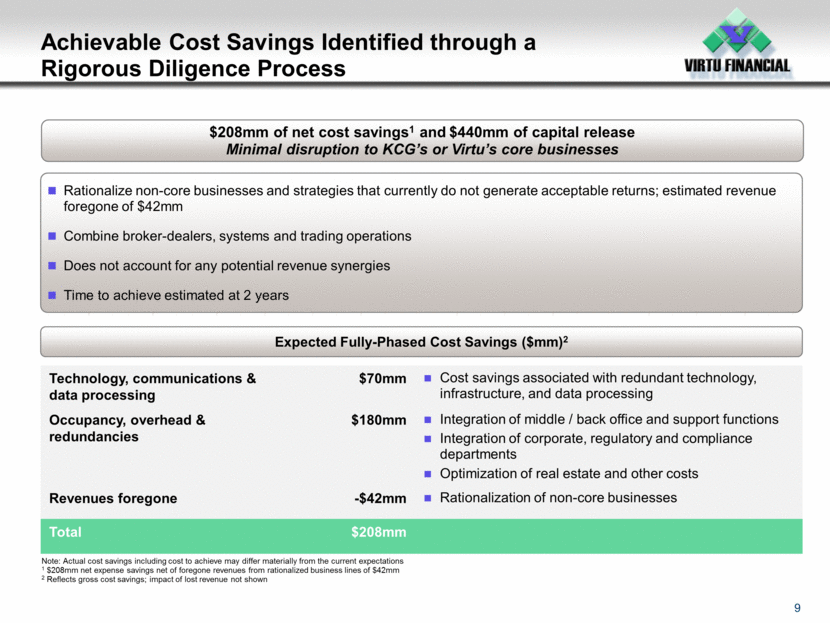
Achievable Cost Savings Identified through a Rigorous Diligence Process 9 Rationalize non-core businesses and strategies that currently do not generate acceptable returns; estimated revenue foregone of $42mm Combine broker-dealers, systems and trading operations Does not account for any potential revenue synergies Time to achieve estimated at 2 years Expected Fully-Phased Cost Savings ($mm)2 Note: Actual cost savings including cost to achieve may differ materially from the current expectations 1 $208mm net expense savings net of foregone revenues from rationalized business lines of $42mm 2 Reflects gross cost savings; impact of lost revenue not shown $208mm of net cost savings1 and $440mm of capital release Minimal disruption to KCG’s or Virtu’s core businesses Technology, communications & data processing $70mm Cost savings associated with redundant technology, infrastructure, and data processing Occupancy, overhead & redundancies $180mm Integration of middle / back office and support functions Integration of corporate, regulatory and compliance departments Optimization of real estate and other costs Revenues foregone -$42mm Rationalization of non-core businesses Total $208mm
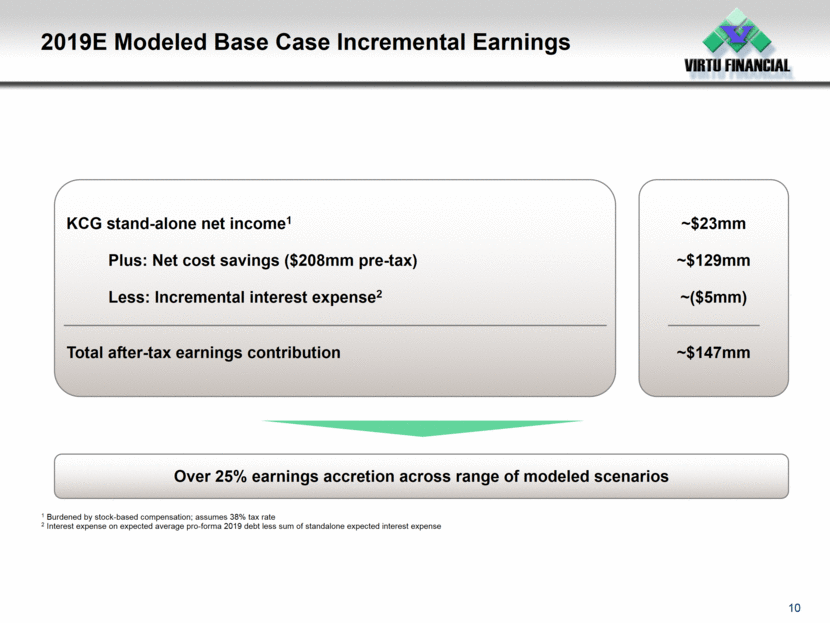
2019E Modeled Base Case Incremental Earnings 10 Over 25% earnings accretion across range of modeled scenarios ~$23mm ~$129mm ~($5mm) ~$147mm KCG stand-alone net income1 Plus: Net Cost savings ($208mm pre-tax) Less: Incremental interest expense2 Total after-tax earnings contribution 1 Burdened by stock-based compensation; assumes 38% tax rate 2 Interest expense on expected average pro-forma 2019 debt less sum of standalone expected interest expense
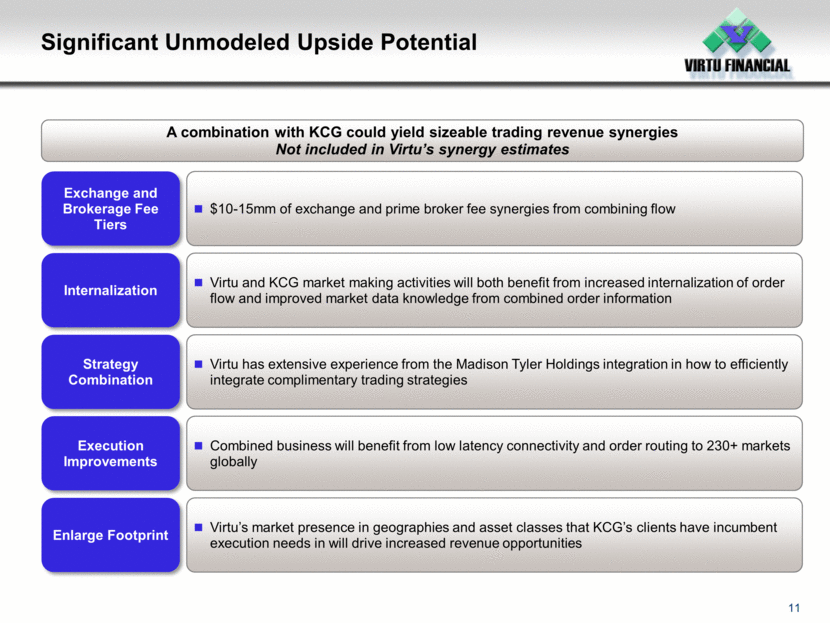
Significant Unmodeled Upside Potential 11 A combination with KCG could yield sizeable trading revenue synergies Not included in Virtu’s synergy estimates $10-15mm of exchange and prime broker fee synergies from combining flow Exchange and Brokerage Fee Tiers Virtu and KCG market making activities will both benefit from increased internalization of order flow and improved market data knowledge from combined order information Internalization Virtu has extensive experience from the Madison Tyler Holdings integration in how to efficiently integrate complimentary trading strategies Strategy Combination Combined business will benefit from low latency connectivity and order routing to 230+ markets globally Execution Improvements Virtu’s market presence in geographies and asset classes that KCG’s clients have incumbent execution needs in will drive increased revenue opportunities Enlarge Footprint
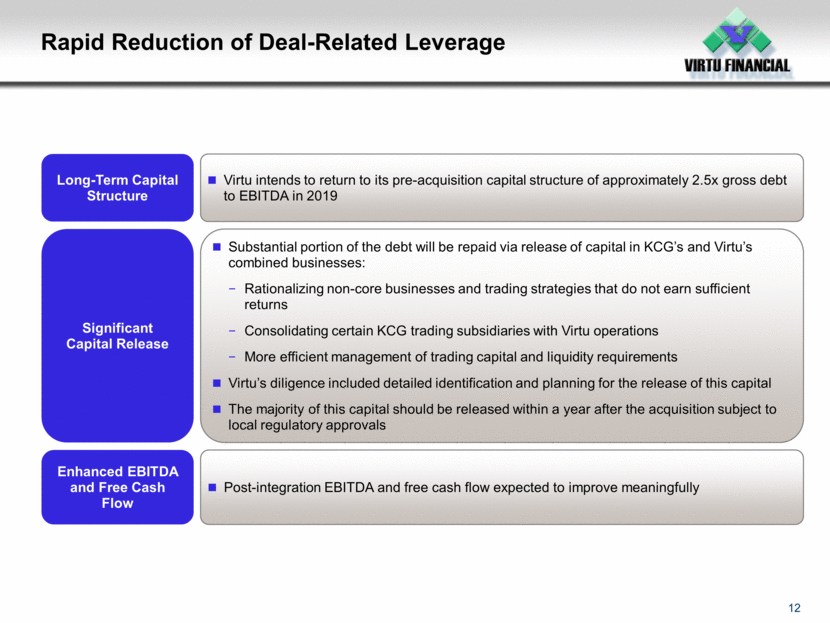
Rapid Reduction of Deal-Related Leverage 12 Long-Term Capital Structure Virtu intends to return to its pre-acquisition capital structure of approximately 2.5x gross debt to EBITDA in 2019 Significant Capital Release Enhanced EBITDA and Free Cash Flow Substantial portion of the debt will be repaid via release of capital in KCG’s and Virtu’s combined businesses: Rationalizing non-core businesses and trading strategies that do not earn sufficient returns Consolidating certain KCG trading subsidiaries with Virtu operations More efficient management of trading capital and liquidity requirements Virtu’s diligence included detailed identification and planning for the release of this capital The majority of this capital should be released within a year after the acquisition subject to local regulatory approvals Post-integration EBITDA and free cash flow expected to improve meaningfully
Appendix

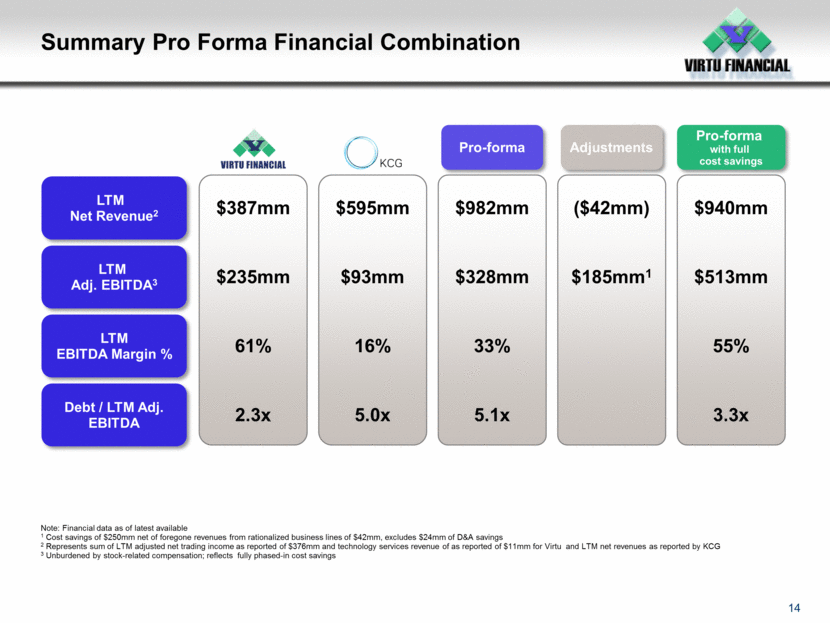
Summary Pro Forma Financial Combination 14 LTM Net Revenue2 LTM Adj. EBITDA3 LTM EBITDA Margin % Debt / LTM Adj. EBITDA Pro-forma Pro-forma with full cost savings $387mm $235mm 61% 2.3x $595mm $93mm 16% 5.0x $982mm $328mm 33% 5.1x $940mm $513mm 55% 3.3x Note: Financial data as of latest available 1 Cost savings of $250mm net of foregone revenues from rationalized business lines of $42mm, excludes $24mm of D&A savings 2 Represents sum of LTM adjusted net trading income as reported of $376mm and technology services revenue of as reported of $11mm for Virtu and LTM net revenues as reported by KCG 3 Unburdened by stock-related compensation; reflects fully phased-in cost savings Adjustments ($42mm) $185mm1
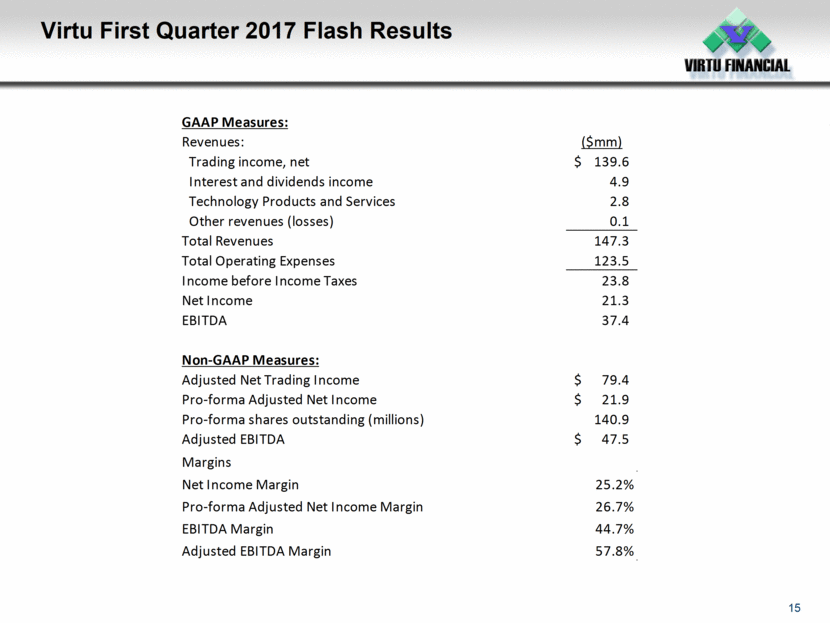
Virtu First Quarter 2017 Flash Results 15 GAAP Measures: Revenues: ($mm) Trading income, net 139.6 $ Interest and dividends income 4.9 Technology Products and Services 2.8 Other revenues (losses) 0.1 Total Revenues 147.3 Total Operating Expenses 123.5 Income before Income Taxes 23.8 Net Income 21.3 EBITDA 37.4 Non-GAAP Measures: Adjusted Net Trading Income 79.4 $ Pro-forma Adjusted Net Income 21.9 $ Pro-forma shares outstanding (millions) 140.9 Adjusted EBITDA 47.5 $ Margins Net Income Margin 25.2% Pro-forma Adjusted Net Income Margin 26.7% EBITDA Margin 44.7% Adjusted EBITDA Margin 57.8%
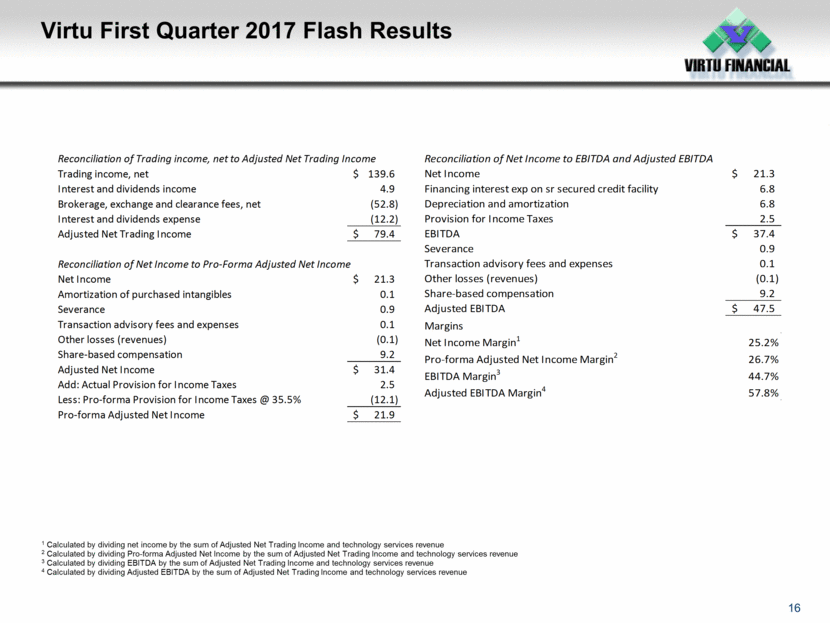
Virtu First Quarter 2017 Flash Results 16 1 Calculated by dividing net income by the sum of Adjusted Net Trading Income and technology services revenue 2 Calculated by dividing Pro-forma Adjusted Net Income by the sum of Adjusted Net Trading Income and technology services revenue 3 Calculated by dividing EBITDA by the sum of Adjusted Net Trading Income and technology services revenue 4 Calculated by dividing Adjusted EBITDA by the sum of Adjusted Net Trading Income and technology services revenue Reconciliation of Trading income, net to Adjusted Net Trading Income Trading income, net 139.6 $ Interest and dividends income 4.9 Brokerage, exchange and clearance fees, net (52.8) Interest and dividends expense (12.2) Adjusted Net Trading Income 79.4 $ Reconciliation of Net Income to Pro-Forma Adjusted Net Income Net Income 21.3 $ Amortization of purchased intangibles 0.1 Severance 0.9 Transaction advisory fees and expenses 0.1 Other losses (revenues) (0.1) Share-based compensation 9.2 Adjusted Net Income 31.4 $ Add: Actual Provision for Income Taxes 2.5 Less: Pro-forma Provision for Income Taxes @ 35.5% (12.1) Pro-forma Adjusted Net Income 21.9 $ Reconciliation of Net Income to EBITDA and Adjusted EBITDA Net Income 21.3 $ Financing interest exp on sr secured credit facility 6.8 Depreciation and amortization 6.8 Provision for Income Taxes 2.5 EBITDA 37.4 $ Severance 0.9 Transaction advisory fees and expenses 0.1 Other losses (revenues) (0.1) Share-based compensation 9.2 Adjusted EBITDA 47.5 $ Margins Net Income Margin 1 25.2% Pro-forma Adjusted Net Income Margin 2 26.7% EBITDA Margin 3 44.7% Adjusted EBITDA Margin 4 57.8%
