Attached files
| file | filename |
|---|---|
| 8-K - 8-K - REPUBLIC BANCORP INC /KY/ | rbca-20170420x8k.htm |
Exhibit 99.1
|
|
THURSDAY, APRIL 20, 2017 ANNUAL MEETING OF SHAREHOLDERS Republic Bancorp Republic bank it’s just easier here rbcaa nasdaq listed
|

|
|
It’s just easier here.® HARBOR During the course of this presentation, we will be providing you with a discussion of some of the factors we currently anticipate may influence the future results of Republic Bancorp, Inc. (“Republic” or the “Company”), as well as certain financial projections. We want to emphasize that these forward-looking statements involve judgment, and that individual judgments may vary. Moreover, these statements are based on limited information available to us now, which is subject to change. Actual results may differ substantially from what we say today and no one should assume later that the comments we provide today are still valid. They speak only as of today. Specific risk factors that could change causing our projections not to be achieved are discussed in the “Risk Factors” section of our Form 10-K filed with the Securities and Exchange Commission (“SEC”) on March 10, 2017, and other reports filed with the SEC from time to time. 1 SAFE Republic bank
|

|
|
It’s just easier here.® STEVE TRAGER Chairman and Chief Executive Officer 2 OPENI NG REMARKS Republic bank
|

|
|
It’s just easier here.® EPUBLIC BANKING CENTERS Louisville, KY ............................. 17 Lexington, KY ............................. 5 Owensboro, KY ........................... 2 Covington, KY ............................. 1 Crestwood, KY ............................ 1 Elizabethtown, KY ....................... 1 Florence, KY ................................ 1 Frankfort, KY................................ 1 Georgetown, KY ......................... 1 Independence, KY ...................... 1 Shelbyville, KY ............................. 1 Shepherdsville, KY ...................... 1 Floyds Knobs, IN......................... 1 Jeffersonville, IN ......................... 1 New Albany, IN ........................... 1 Largo, FL...................................... 1 Port Richey, FL............................. 1 Seminole, FL................................ 1 St. Petersburg, FL ....................... 2 Temple Terrace, FL ..................... 1 Norwood, OH ............................. 1 Franklin, TN ................................. 1 Nashville, TN ............................... 1 3 R Republic bank
|
|
|
It’s just easier here.® STOCK OVERVIEW 4 1998 – IPO completed2.6million shares issued (adjusted) NASDAQ SymbolRBCAA Shares Outstanding – 12/31/1620.9million Market Capitalization – 12/31/16$825 million Average Daily Volume 21,276 shares (trailing 12 months at 12/31/16) Stock Price – 3/31/17$34.39 Stock Price – 12/31/16$39.54 Stock Price - 12/31/15$26.41 Book Value Per Share – 3/31/17$29.76 Book Value Per Share – 12/31/16$28.97 Tangible Book Value Per Share – 3/31/17$28.68 Tangible Book Value Per Share – 12/31/16$27.89 Diluted Earnings per Class A Common Stock (2016)$2.22 Price / Tangible Book Value Per Share - 12/31/16123.3% Price / Earnings Ratio 15.5 X (trailing 12 months as of 12/31/16) Class A Common Stock Dividend Yield – 12/31/162.09% Number of stock dividends since IPO in 19984 Quarterly Cash Dividend increases since IPO in 1998 17 5 year compound growth rate of quarterly cash dividends 6.40% Republic bank
|
|
|
$1.10 $0.80 $0.74 $0.52 $0.31 $0.21 $0.21 $0.20 $0.12 $0.14 It’s just easier here.® DIVIDENDS PER CLASS A COMMON SHARE $1.20 Ordinary DividendSpecial Dividend $1.00 $0.83 $0.78 $0.65 $0.69 $0.61 $0.60 $0.56 $0.47 $0.42 $0.40 $0.36 $0.25 $0.17 $0.09 $0.09 $0.09 $0.10 $-5 1996-2016 1996 1997 1998 1999 2000 2001 2002 2003 2004 2005 2006 2007 2008 2009 2010 2011 2012 2013 2014 2015 2016Republic bank |
|
|
It’s just easier here.® REPUBLIC BANCORP HIGHLIGHTS Year ended December 31, 2016 6 Republic bank |

|
|
It’s just easier here.® HIGHLIGHTS Net income of $45.9 million, an increase of 31% over 2015, resulting in Diluted Earnings per Class A Common share of $2.22 Return On Average Assets of 1.02% Return On Average Equity of 7.68% Capital ratios continued to exceed “well capitalized” with a total risk based capital ratio of 16.37% at year end Increased quarterly cash dividend by 6%, representing the 17th increase since 1999 7 2016 Republic bank |
|
|
Republic Processing Group Core Banking $45.9 $2.00 $1.70 $28.8 $1.38 $30.0 $20.0 2014 2015 2016 $5.0 9 It’s just easier here.® HIGHLIGHTS In Millions Earnings Per Share $50.0 $45.0 $40.0 $35.2$2.50 $2.22 $35.0 $34.9 $1.50 $25.0 $29.9 $1.00 $24.3 $15.0 $0.50 $10.0 $-$11.0 $4.5 $5.3 $-201420152016 8 EARNINGS PER SHARE NeNtE ITnINcCoOmMEe 2016 Net Income Earnings Per Shar Republic bank |
|
|
It’s just easier here.® HIGHLIGHTS On May 17, 2016, the Company completed its acquisition of Cornerstone Bancorp, Inc. (“Cornerstone”), and its wholly-owned bank subsidiary Cornerstone Community Bank (“CCB”), for approximately $32 million in cash. As of May 17, 2016, Cornerstone maintained total assets of $238M, gross loans of $190M and total deposits of $205M. Acquired operations contributed approximately $4.9 million of net interest income and $491,000 of net income during 2016 to the Company’s operating results. 9 2016 Cornerstone Acquisition Republic bank |
|
|
Total Loans Total Deposits $189.6 It’s just easier here.® HIGHLIGHTS Annualized Growth of 9% in both Loans and Deposits for 20A1nn6usailnizceed Garcoqwutihs iotfi o9%n. in both Loans and Deposits for 2016 since acquisition. In Millions $220.0 $216.6 $215.0 $210.0 $205.3 $205.0 $200.1 $200.0 $195.0 $190.0 $185.0 $180.0 $175.0 May 17, 2016 (Acquisition Date) 31-Dec-16 10 2016 Growth from former Cornerstone Operations Republic bank |
|
|
It’s just easier here.® HIGHLIGHTS Exclusive of the Cornerstone acquisition, gross Core Bank loans grew by $252 million, or 8%, during 2016 Mortgage Warehouse loan portfolio grew $199 million, or 21%, to $585M Exclusive of the Cornerstone acquisition and all brokered deposits, organic Core Bank deposit balances grew $312M, or 14% Core Banking credit metrics continued to outperform peers 11 2016 Core Republic bank |
|
|
$140.0 $104.0 It’s just easier here.® HIGHLIGHTS Net Interest Income (Excluding FDIC-assisted transactions(1)) In Millions $136.1 $116.7 $120.0 $100.0 $80.0 $60.0 $40.0 $20.0 $-201420152016 (1) See Appendix A for a reconciliation to net interest income in accordance with Generally Accepted Accounting Principles (“GAAP”). 12 2016 Core Republic bank |
|
|
2014 2015 2016 $15.0 $7.5 $10.0 $6.0 $4.4 $1.7 $2.0 Service Charges on Mortgage Banking Interchange Fee Other 2014 2015 2016 It’s just easier here.® HIGHLIGHTS Noninterest Income In Millions $35.0 $33.4 $30.0 $28.4 In Millions $24.6 $25.0 $13.8 $14.0 $13.0 $13.2 $20.0 $12.0 $10.0 $8.9 $8.0 $6.9 $6.2 $4.4 $4.0 $2.9 $3.5 $5.0 $-$-Deposits Income* Income *Includes $1.1 million gain on bulk sale of $71 million in Correspondent loans in 2016. 13 NONINTEREST INCOME COMPONENTS TOTAL 2016 Core Republic bank |
|
|
$96.5 71.0% $100.0 68% 68% $20.0 by the sum of net interest income and noninterest income. The It’s just easier here.® HIGHLIGHTS Noninterest Expense and Efficiency Ratio In Millions $120.0 $116.2 $101.2 70% 70.0% $80.0 69.0% 68.0% $60.0 67.0% 66.0% $40.0 201420152016 The efficiency ratio equals total noninterest expense divided ratio excludes net gain (loss) on sales, calls and impairment of investment securities, if applicable. $-201420152016 14 NonNinOtNeINreTEsRtE ESTxEpXePnENsSeEsS EffiEcFiFeICnIEcNyC RY aRAtiToIO 2016 Core Republic bank |
|
|
It’s just easier here.® HIGHLIGHTS Staffing and Infrastructure Investments Core Bank invested in 143 additional full-time-equivalent employees (“FTEs”) during 2016 to service current year growth and also help implement our strategic goals. The following are the areas where we added the most FTEs during 2016: • Retained from our Cornerstone acquisition – 36 FTEs • Loan Operations – 23 FTEs • Call Center – 16 FTEs • MemoryBank® operations – 11 FTEs • Business Intelligence and Data Services – 7 FTEs 15 2016 Core Republic bank |
|
|
It’s just easier here.® HIGHLIGHTS Republic Credit Solutions Line-of-credit product – Originated and sold $331 million in loans during 2016 Credit Card product – Originated and sold $6 million in loans during 2016 Installment Loan product – Originated and sold $43 million in loans during 2016 Healthcare Receivables product – Originated and acquired $12 million in loans during 2016 Maintained $32 million in RPG loans held for investment as of December 31, 2016 for all programs Tax Refund Solutions Introduced the Easy Advance (“EA”) product and originated $123 million, earning $2.2 million in net revenues after provisions for loan loss. Net Refund Transfers (“RT”) revenue increased $1.9 million, or 11%, during 2016 compared to 2015. 16 2016 RPG |
|
|
It’s just easier here.® HIGHLIGHTS Net Refund Transfer Revenues In Millions$19.2 $20.0 $17.4 $16.1 $15.0 $10.0 $5.0 $0.0 2014 2015 2016 17 2016 RPG |
|
|
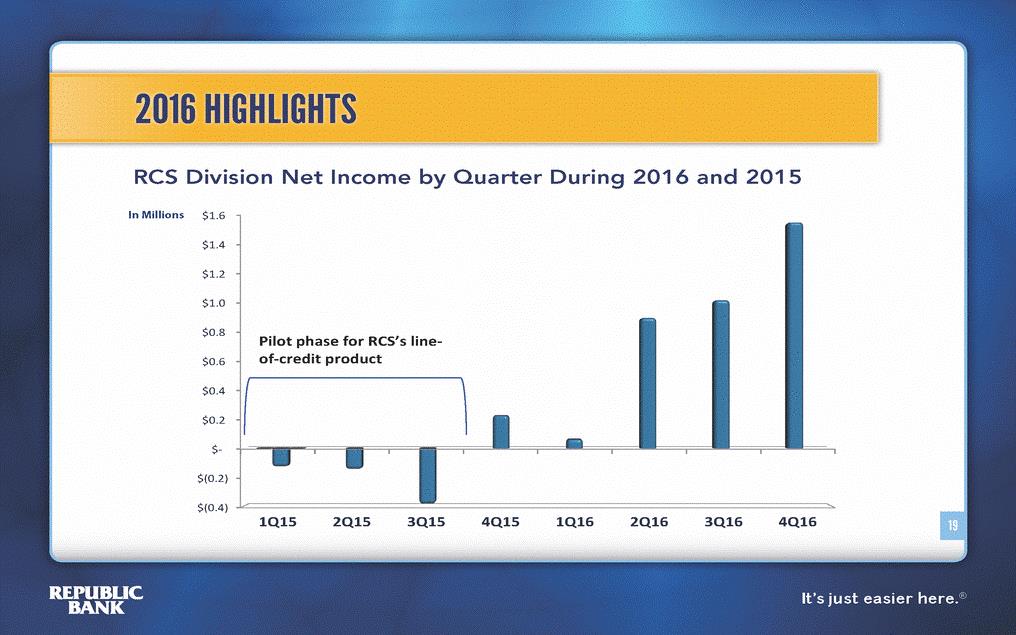
It’s just easier here.® HIGHLIGHTS Change in Divisional Contribution to RPG Net Income TRS Tax-refund products $ 8,899 $ 6,590 81% 124% $ 2,309 35% RPS Prepaid cards (1,397) (861) -13% -16% (536) -62% 18 Total RPG $ 11,044 $ 5,309 100% 100% $ 5,735 108% RCS Consumer loans 3,542 (420) 32% -8% 3,962 943% Net Income (Loss) % Contribution ($ in thousands) Primary Products 2016 2015 2016 2015 Year over Year $ Change % Change 2016 RPG |
|
|
Pilot phase for RCS’s line-It’s just easier here.® HIGHLIGHTS RCS Division Net Income by Quarter During 2016 and 2015 In Millions$1.6 $1.4 $1.2 $1.0 $0.8 $0.6 of-credit product $0.4 $0.2 $-$(0.2) $(0.4) 1Q15 2Q15 3Q15 4Q15 1Q16 2Q16 3Q16 4Q16 19 2016 |
|
|
It’s just easier here.® REPUBLIC BANCORP BALANCESHEET 20 Republic bank |

|
|
(2) Based on prompt corrective action thresholds for FDIC supervised financial institutions - see 12 CFR Part 324, subpart H. It’s just easier here.® BANK (1) Peer data obtained from the December 31, 2016 Uniform Bank Performance Report (“UBPR”). 21 Capital Ratio 12/31/2016 Republic Banc orp Well Capitalized Minimum Peer (1) Requirement (2) Tier 1 Leverage 13.54% 9.77% 5.00% CET 1 Risk Based 14.59% 12.51% 6.50% Tier 1 Risk Based 15.55% 15.59% 8.00% Total Risk Based 16.37% 13.67% 10.00% CORE ong Capital |
|
|
It’s just easier here.® BANK 5 Year History $3,000 $ In Millions $2,500 $2,000 Traditional Network $1,500 Warehouse Lending Correspondent Lending $1,000 Business Acquisitions $500 $-Dec 12 Dec 13 Dec 14 Dec 15 Dec 16 22 CORE Portfolio |
|
|
Estate Lines of Credit Residential Commercial & Consumer 2% 46% 5% 8% It’s just easier here.® BANK 2012 versus 2016 Loan Portfolio Dec. 31, 2012 Loan Portfolio Dec. 31, 2016 Warehouse Residential Real Warehouse Lines of Consumer 35% Industrial Credit1% Real Estate 16% Home Equity 9% Commercial & Industrial 7% Construction & Development Home Equity 3% 9% Construction & Development Commercial 3% Real EstateCommercial 28% Real Estate 28% Total Loans: $2.7 Billion Total Loans: $3.8 Billion 23 CORE Loan Mix |
|
|
It’s just easier here.® BANK 2012-2016 In Millions Outstanding BalanceTotal Commitments $1,200 $1,013 $1,000 $800 $670 $585 $600 $528 $387 $400 $331 $358 $319 $217 $150 $200 $-Dec 12Dec 132Dec 14Dec 15Dec 16 25 24 CORE Warehouse Lending |
|
|
It’s just easier here.® BANK Quarterly Averages (Excludes Institutional Brokered Deposits & CDs) Quarter EndedQuarter Ended (in thousands)Dec 31, 2016Dec 31, 2015Change Now & Passbook Sav ings1,026,015882,195143,820 Liquid CDs25,89830,647(4,749) Money Market Sav ings41,10341,905(802) 25 Total Core Deposits$2,489,544$2,004,972$484,572 Money Market CDs19,15418,785369 Money Market Accounts470,546391,97378,573 Non Interest Bearing$906,828$639,467$267,361 CORE Core Deposits |
|
|
$900 It’s just easier here.® BANK 5 Year History Non-Interest Bearing Interest-Bearing DDA MMDA/SAV Time Deposits Brokered Deposits $1,000 In Millions $800 $700 $600 $500 $400 $300 $200 $100 $-Dec 12Dec 13Dec 14Dec 15Dec 16 26 CORE Deposits |
|
|
CREDIT QUALITY It’s just easier here.® REPUBLIC BANCORP INDUSTRY STRONG 27 |
|
|
It’s just easier here.® BANK Includes Acquired Banks 28 Ratio As of and for the Years Ended 12/31/2012 12/31/2013 12/31/2014 12/31/2015 12/31/2016 Nonperforming Loans / Total Loans 0.82% 0.81% 0.78% 0.66% 0.42% Nonperforming Assets / Total Assets 1.41% 1.13% 0.93% 0.55% 0.36% Delinquent Loans / Total Loans 0.79% 0.63% 0.52% 0.35% 0.18% Allowance / Nonperforming Loans 109% 109% 103% 118% 175% Allowance / Total Loans 0.90% 0.89% 0.80% 0.78% 0.74% Net Charge-offs / Average Loans 0.34% 0.18% 0.08% 0.05% 0.05% CORE Credit Quality Trends |
|
|
MANAGEMENT It’s just easier here.® REPUBLIC BANCORP INTEREST RATE STRATEGY 29 |

|
|
It’s just easier here.® REPUBLIC BANCORP Asset Repricing 89% of our total loan portfolio reprices within 5yrs as of December 31, 2016 91% of the Commercial Real Estate portfolio reprices within 5 years 96% of the Commercial & Industrial portfolio reprices within 5 years Mortgage Warehouse balances, which reprice immediately, have averaged $452.6 million year-to-date Liability Repricing Growth in core, non-maturity deposits (“NMD”) has reduced the Bank’s need for term FHLB advances, which has resulted in a lower cost of funds Non interest-bearing deposits accounted for 33% of retail funding at December 31, 2016 The Bank expects to follow a prudent pricing strategy for NMD as rates rise, which would positively impact both net interest income and market value of equity 30 Inter Rate Sensitivity |
|
|
It’s just easier here.® REPUBLIC BANCORP HIGHLIGHTS First Quarter 2017 31 |

|
|
It’s just easier here.® 2017 HIGHLIGHTS Net income of $20.0 million, an increase of 13% over the first quarter of 2016 Return On Average Assets of 1.65% Return On Average Equity of 13.12% Capital ratios continued to exceed “well capitalized” 32 1Q |
|
|
$0.96 $20.0 $5.0 It’s just easier here.® 2017 HIGHLIGHTS Net Income and Earnings Per Share In Millions Republic Processing Group Core Banking $25.0 $20.0 $17.7 $1.00 $0.85 $0.90 $13.8 $8.5 $0.80 $0.66 $15.0 $8.1 $0.70 $6.6 $0.60 $0.50 $10.0 $0.40 $0.30 $9.7 $11.5 $0.20 $7.2 $0.10 $-$- 1Q2015 1Q2016 1Q2017 1Q 2015 1Q 2016 1Q 2017 *Due to rounding, parts may not sum to total 35 33 EaErAnRiNnINgGsS PPeERr SSHhARaEre NeNtE TInINcCoOmMEe* * 1Q |
|
|
It’s just easier here.® 2017 HIGHLIGHTS Net income of $8.5 million, an increase of 5% over the first quarter of 2016 Net interest income of $36.6 million, a 17% increase over the first quarter of 2016 Credit metrics continue to outperform peer Noninterest income of $7.7 million, a 3% increase over the first quarter of 2016 MemoryBank® continues to gain traction, raising $28 million in deposits during the first quarter of 2017 34 1Q Core |
|
|
It’s just easier here.® MEMORYBANK® MemoryBank® Accounts by State: California ................................... 75 Texas .......................................... 37 New York ................................... 28 Florida........................................ 27 New Jersey ................................ 18 Other States ............................ 215 TOTAL .................................... 400 Map as of 3/13/17 35 |
|
|
It’s just easier here.® 2017 HIGHLIGHTS Opened new Vine Street location in downtown Lexington, Kentucky Opened new loan production office in Brentwood (Nashville), Tennessee Expanded contact center hours from 7 a.m. to midnight, seven days a week Introduced four additional interactive teller machines (“ITMs”) 36 1Q Core |
|
|
It’s just easier here.® 2017 HIGHLIGHTS Net Interest Income (Excluding FDIC-assisted transactions(1)) In Millions $40.0 $36.2 $35.0 $30.2 $30.0 $27.8 $25.0 $20.0 $15.0 1Q151Q161Q17 (1) See Appendix A for a reconciliation to net interest income in accordance with GAAP. 37 1Q Core |
|
|
$7.0 $6.0 $3.0 $1.6 $1.2 $1.0 $0.8 $1.0 1Q2015 1Q2016 1Q2017 Service Charges on Mortgage Banking Interchange Fee Other It’s just easier here.® 2017 HIGHLIGHTS Noninterest Income In Millions $8.0 $7.5 $7.7 $6.8 1Q2015 1Q2016 1Q2017 In Millions $5.0 $3.5 $3.1 $3.3 $4.0 $3.0 $3.0 $2.5 $2.1 $2.2 $2.0 $2.0 $1.5 $1.4 $1.3 $1.0 $1.0 $0.5 $-$- Deposits Income Income 38 NONINTEREST INCOME COMPONENTS TOTAL 1Q Core |
|
|
$32.1 $30.0 72% 71% $26.8 $5.0 by the sum of net interest income and noninterest income. The It’s just easier here.® 2017 HIGHLIGHTS Noninterest Expense and Efficiency Ratio In Millions $35.0 72% 72% $25.3 $25.0 70% 69% $20.0 69% 68% $15.0 67% $10.0 1Q2015 1Q2016 1Q2017 The efficiency ratio equals total noninterest expense divided ratio excludes net gain (loss) on sales, calls and impairment of $-investment securities, if applicable. 1Q151Q161Q17 39 EffiEcFiFeICnIENcCyY RRAaTtIOio N oninNOteNIrNeTEsRtE SETxEpXPeENnSsEeS 1Q Core |
|
|
It’s just easier here.® 2017 HIGHLIGHTS Loan Growth 40 (dollars in thousands) Origination Channel Ending Ending BalanceBalance$ 3/31/2017 3/31/2016 Change Average Average Quarterly Quarterly BalanceBalance$ 3/31/2017 3/31/2016 Change Warehouse Lending $495,165 $393,986 $101,179 $436,459 $292,574 $143,885 Correspondent Lending 141,375 242,902 (101,527) 145,068 247,862 (102,794) 2012-FDIC Acquired Loans 14,078 22,383 (8,305) 14,371 23,699 (9,328) Traditional Network 3,017,051 2,677,360 339,691 3,033,392 2,678,984 354,408 Total $3,667,669 $ 3,336,631 $331,038 $3,629,290 $3,243,119 $386,171 1Q Core |
|
|
It’s just easier here.® 2017 HIGHLIGHTS Increased Easy Advance (“EA”) credit program volume by $205 million driving a $4.0 million increase in EA fee income net of estimated provision for EA losses Additional EA revenues helped to offset a 10% reduction in net Refund Transfer revenues Sales of RCS short-term consumer loan products grew to $126 million, a 187% increase from 1Q2016 RCS balances remaining on balance sheet grew to $32 million at March 31, 2017 from $23 million at March 31, 2016 41 1Q RPG |
|
|
It’s just easier here.® 2017 HIGHLIGHTS Refund Transfers (RT) and Easy Advances (EA) 42 YTDYTD (dol l a rs i n thousa nds)Mar. 2017Mar. 2016$ Change% Change RT Product Volume$8,004,650$8,768,036$(763,386)-9% Ne t RT Re ve nue$15,382$17,078$(1,696)-10% EAs Originate d$328,582$123,231$205,351167% EA Fees$14,216$ 5,209$9,007173% Ne t EA Loan Los s Provis on(8,601)(3,574)(5,027)141% Ne t EA Re ve nue$5,615$1,635$3,980243% 1Q RPG |
|
|
It’s just easier here.® 2017 HIGHLIGHTS Loan Growth 43 (dollars in thousands) Origination Channel Ending Ending BalanceBalance$ 3/31/2017 3/31/2016 Change Average Average QuarterlyQuarterly BalanceBalance$ 3/31/2017 3/31/2016 Change Tax Refund Solutions $10,686 $6,310 $4,376 $87,714 $41,871 $45,843 Republic Credit Solutions 32,021 9,028 22,993 30,049 7,699 22,350 Total $42,707 $15,338 $27,369 $117,763 $49,570 $68,193 1Q RPG Republic bank |
|
|
It’s just easier here.® INITIATIVES Continue to grow the MemoryBank® brand Additional investment in mortgage-related personnel, processes and systems in order to expand market share Grow Dealer Floor Plan Lending, which had $8 million of loans outstanding at March 31, 2017 Implementation of a new client relationship management system 44 2017 Republic bankRepublic bank |
|
|
It’s just easier here.® REPUBLIC BANCORP THANK YOU 45 |

|
|
meaningful measure of the Bank’s performance. It’s just easier here.® REPUBLIC BANCORP Appendix A Non-GAAP Disclosures Net Interest Income and Non-Interest Income (in thousands)Years Ended Dec. 31,Three Months Ended Mar. 31, 201420152016201520162017 Net interest income on loans acquired in the Company's 2012 FDIC-assisted transactions8,4824,0032,3485981,051380 (1) Management believes that excluding the impact of the Company’s 2012 FDIC-assisted transactions provides a more 46 Net interest income - GAAP$112,443$120,731$138,421$28,355$31,295$36,628 Net interest income excluding the impact of the Company's 2012 FDIC-assisted transactions(1)$103,961$116,728$136,073$27,757$30,244$36,248 Republic bank |