Attached files
| file | filename |
|---|---|
| EX-99.1 - EXHIBIT 99.1 - BENCHMARK ELECTRONICS INC | ex99_1.htm |
| 8-K - FORM 8-K - BENCHMARK ELECTRONICS INC | form8k.htm |
Exhibit 99.2

design develop deliver advanced technology Q1 2017 Earnings Presentation April 19, 2017

design develop deliver advanced technology 2 Forward - Looking Statements This document contains forward - looking statements within the scope of the Securities Act of 1933 and the Securities Exchange Act of 1934. The words “expect,” “estimate,” “anticipate,” “predict” and similar expressions, and the negatives thereof, often identify forward - looking statements, which are not limited to historical facts. F orward - looking statements include, among other things: guidance for the second quarter of 2017 relating to sales; statements , express or implied, concerning future operating results or margins, the ability to generate sales and income or cash flow; and Benchmark’s business and growth strategies and expected growth and performance. Although Benchmark believes these statements are based upon reasonable assumptions, they involve risks and uncertainties relating to operations , markets and the business environment generally. If one or more of these risks or uncertainties materializes, or underlying assumptions prove incorrect, actual outcomes may vary materially from those indicated. All forward - looking statements included in this document are based upon information available to the Company as of the date of this document, and it assumes no obligation to update them. Readers are advised to consult further disclosures on related subjects, particularly in Item 1A, “Risk Factors”, of the Company’s annual report on Form 10 - K for the year ended December 31, 2016, in its other filings with the Securities and Exchange Commission and in its press releases. Non - GAAP Financial Information This document includes certain financial measures, such as operating margin, that exclude items and therefore are not in accordance with generally accepted accounting principles (“GAAP”). A detailed reconciliation between GAAP results and results excluding special items (“non - GAAP”) is included in the Appendix of this document. Management discloses non - GAAP information to provide investors with additional information to analyze the Company’s performance and underlying trends. Management uses non - GAAP measures of net income and earnings per share that exclude certain items in order to better assess operating performance and help investors compare results with our previous guidance. This document also references “free cash flow”, which the Company defines as cash flow from operations less additions to property, plant and equipment and purchased software.

design develop deliver advanced technology 3 CEO Update

design develop deliver advanced technology 4 First Quarter 2017 Summary Revenue and non - GAAP operating margins exceeded the high end of guidance ▪ Revenues up 3 %, the first year - over - year growth in 11 quarters ▪ Gross margins at 9.3%, a 10 bps year - over - year improvement ▪ Non - GAAP operating margins at 3.8% and EPS at $0.34 Exceeded working capital expectations ▪ Achieved cash conversion cycle of 67 days ▪ Quarter - over - quarter improvement of 7 days ▪ Year - over - year improvement of 32 days Strong cash flow ▪ Operating cash flow of $78 million ▪ F ree cash flow of $70 million ▪ ROIC of 9%, up 60 bps quarter - over - quarter

design develop deliver advanced technology 5 2017 New Business Wins by Segment ▪ 27 manufacturing and 21 engineering project awards ▪ Estimated annual revenue run rate between $118 – $149 million ▪ Continued new business wins in targeted markets Estimated Annual Revenue from New Business Wins New Business Wins Q1 New Business Wins Highlights : $120 $120 $125 $125 $118 $123 $128 $134 $- $10 $20 $30 $40 $50 $60 $70 $80 $90 $100 $110 $120 $130 $140 $150 $160 Q2-15 Q3-15 Q4-15 Q1-16 Q2-16 Q3-16 Q4-16 Q1-17 $ (USD M)
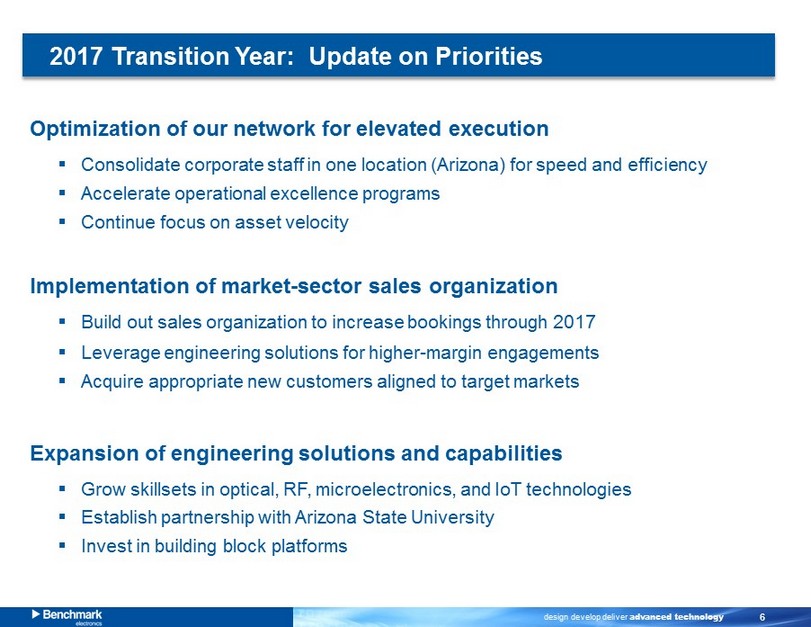
design develop deliver advanced technology 6 2017 Transition Year: Update on Priorities Optimization of our n etwork for elevated e xecution ▪ Consolidate corporate staff in one location (Arizona) for speed and efficiency ▪ Accelerate operational excellence programs ▪ Continue focus on asset velocity Implementation of market - sector sales organization ▪ Build out sales organization to increase bookings through 2017 ▪ Leverage engineering solutions for higher - margin engagements ▪ Acquire appropriate new customers aligned to target markets Expansion of engineering solutions and capabilities ▪ Grow skillsets in optical, RF, microelectronics, and IoT technologies ▪ Establish partnership with Arizona State University ▪ Invest in building block platforms

design develop deliver advanced technology 7 Current Progress Milestones

design develop deliver advanced technology 8 Q1 2017 Financial Highlights
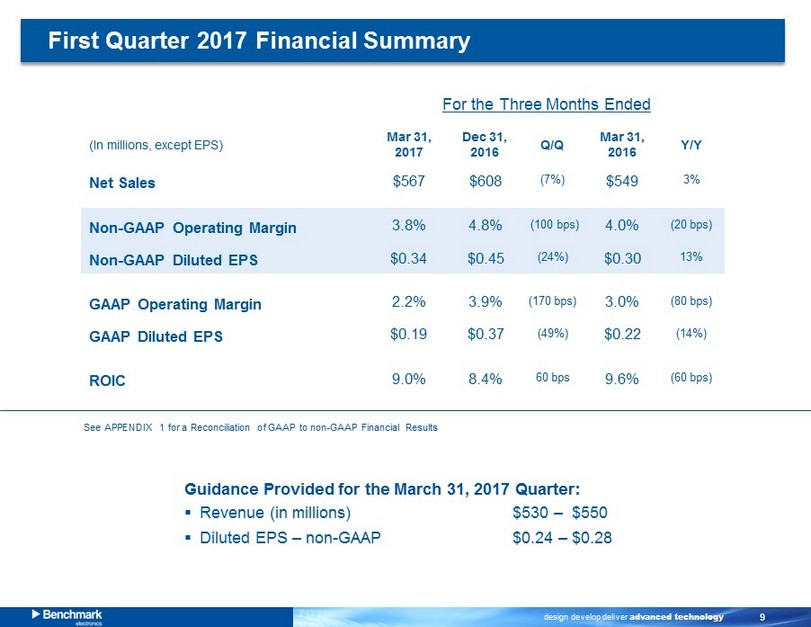
design develop deliver advanced technology 9 (In millions, except EPS) Mar 31 , 2017 Dec 31 , 2016 Q/Q Mar 31 , 2016 Y/Y Net Sales $567 $608 (7%) $549 3% Non - GAAP Operating Margin 3.8% 4.8% (100 bps) 4.0% (20 bps) Non - GAAP Diluted EPS $0.34 $0.45 (24%) $0.30 13% GAAP Operating Margin 2.2% 3.9% (170 bps) 3.0% (80 bps) GAAP Diluted EPS $0.19 $0.37 (49%) $0.22 (14%) ROIC 9.0% 8.4% 60 bps 9.6% (60 bps) For the Three Months Ended Guidance Provided for the March 31, 2017 Quarter: ▪ Revenue (in millions) $530 – $550 ▪ Diluted EPS – non - GAAP $0.24 – $0.28 First Quarter 2017 Financial Summary See APPENDIX 1 for a Reconciliation of GAAP to non - GAAP Financial Results

design develop deliver advanced technology 10 Higher - Value Markets Mar 31 , 2017 Dec 31 , 2016 Q/Q Industrials 21% $118 20% $120 (2%) Aerospace & Defense 18% $104 17% $102 2% Medical 15% $86 14% $86 -- Test & Instrument. 14% $77 11% $65 17% Total Revenue $385 $373 3% Traditional Markets Mar 31 , 2017 Dec 31 , 2016 Q/Q Computing 18% $101 22% $136 (26%) Telecommunication s 14% $81 16% $99 (18%) Total Revenue $182 $235 (22%) Revenue by Market Sector For the Three Months Ended Aerospace & Defense, Medical, Test & Instrument. and Computing Up in Q1 - 17 (1) (1) (1) In millions (1) (1) Mar 31 , 2016 Y/Y 25% $138 (14%) 16% $91 14% 15% $83 4% 10% $53 43% $365 5% Mar 31 , 2016 Y/Y 17% $91 10% 17% $93 (13%) $184 (1%) (1) (1)

design develop deliver advanced technology 11 21.9 24.3 24.7 29.1 21.5 4.0% 4.2% 4.3% 4.8% 3.8% 0.0% 1.0% 2.0% 3.0% 4.0% 5.0% 6.0% 7.0% 0.0 10.0 20.0 30.0 40.0 50.0 60.0 Q1-16 Q2-16 Q3-16 Q4-16 Q1-17 549 579 574 608 567 9.2% 9.1% 9.2% 9.5% 9.3% 1.0% 3.0% 5.0% 7.0% 9.0% 11.0% 13.0% 15.0% 0 200 400 600 800 1,000 1,200 1,400 Q1-16 Q2-16 Q3-16 Q4-16 Q1-17 9.6% 9.1% 8.6% 8.4% 9.0% 0.0% 2.0% 4.0% 6.0% 8.0% 10.0% 12.0% 14.0% 16.0% 18.0% 20.0% Q1-16 Q2-16 Q3-16 Q4-16 Q1-17 Revenue & Gross Margin ($ M ) Key Business Trends Return on Invested Capital (LTM) ROIC = [(Non - GAAP income from operations plus stock compensation )*( 1 - Tax Rate )] ÷ [ Average Invested Capital less Average Cash for last 5 quarters] Non - GAAP Operating Margin ($M) 28.5 28.5 28.1 28.4 31.0 5.2% 4.9% 4.9% 4.7% 5.5% 0.0% 1.0% 2.0% 3.0% 4.0% 5.0% 6.0% 7.0% 8.0% 0.0 10.0 20.0 30.0 40.0 50.0 60.0 70.0 Q1-16 Q2-16 Q3-16 Q4-16 Q1-17 SG&A ($M) (1) Excludes the impact of customer insolvency. (1) (1) (1) (1)

design develop deliver advanced technology 12 SG&A Investments Continued Investments for Future Growth ▪ SG&A savings reinvested for long - term revenue growth ▪ Investments vary between fixed expenses and variable & non - cash expenses ▪ Benchmark includes stock compensation expense in SG&A

design develop deliver advanced technology 13 (In millions) Mar 31 , 2017 Dec 31 , 2016 Mar 31, 2016 Cash Flow from Operations $78 $44 $77 FCF $70 $38 $69 Cash $752 $681 $519 International $659 $626 $477 US $93 $55 $42 Inventory $404 $381 $390 Accounts Receivable $381 $441 $414 Accounts Payable $344 $326 $218 Cash Flow / Working Capital Highlights For the Three Months Ended (1) Free cash flow (FCF) defined as net cash provided by operations (GAAP) less capex 1 Generated $78 million of Cash from Operations in Q1 2017

design develop deliver advanced technology 14 Working Capital Update Exceeded 73 - day target for Q1 2017 99 83 80 74 67 0 20 40 60 80 100 120 Q1-16 Q2-16 Q3-16 Q4-16 Q1-17 Accounts Receivable Days Accounts Payable Days Inventory Days Deposits Q1-16 Q2-16 Q3-16 Q4-16 Q1-17 Accounts Receivable Days 68 66 65 65 61 Accounts Payable Days 39 47 53 53 60 Inventory Days 70 64 68 62 70 Deposits - - - - 4 Cash Conversion Cycle 99 83 80 74 67
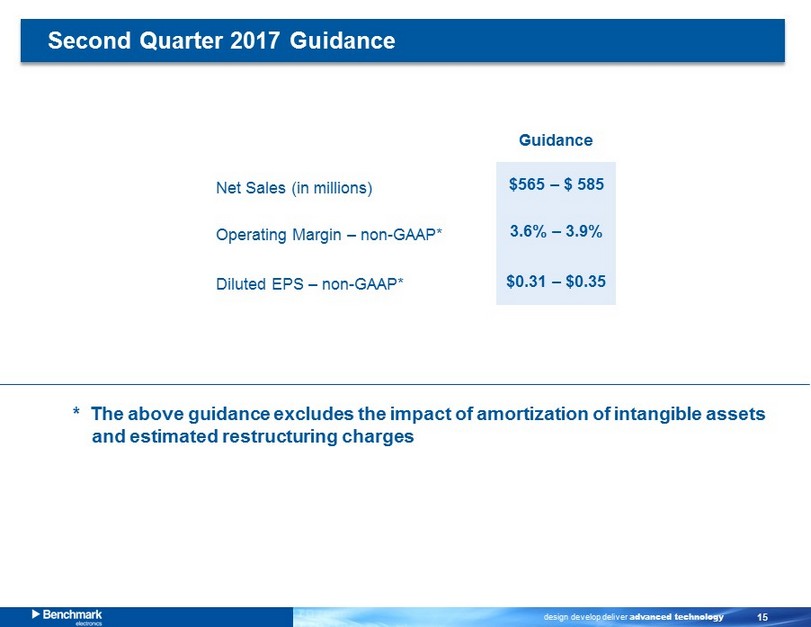
design develop deliver advanced technology 15 Guidance Net Sales (in millions) $565 – $ 585 Operating Margin – non - GAAP* 3.6% – 3.9% Diluted EPS – non - GAAP* $0.31 – $0.35 * The above guidance excludes the impact of amortization of intangible assets and estimated restructuring charges Second Quarter 2017 Guidance

design develop deliver advanced technology 16 Higher - Value Markets Q2 - 17 Outlook (%) Industrials Aerospace & Defense Down Low - Singles Up Low - Singles Medical Up Low - Singles Test & Instrumentation Up Low - Singles Traditional Markets Q2 - 17 Outlook (%) Computing Up ~20% Telecommunication s Down >10% Modeling Information Expected sequential growth in Higher - Value and Traditional Markets (1) Q2 - 17 Guidance Interest Expense (in millions) $2.3 Effective Tax Rate 18% - 19% Weighted Average Shares (m) 50.5

design develop deliver advanced technology 17 Appendix

design develop deliver advanced technology 18 APPENDIX 1 - Reconciliation of GAAP to non - GAAP Financial Results (Amounts in Thousands, Except Per Share Data) – (UNAUDITED) March 31, December 31, March 31, 2017 2016 2016 $ 12,417 $ 23,548 $ 16,268 1,511 2,663 2,789 5,120 - - 2,481 2,893 2,804 $ 21,529 $ 29,104 $ 21,861 $ 9,687 $ 18,568 $ 11,052 1,511 2,663 2,789 5,120 - - 2,481 2,893 2,804 (1,580) (1,781) (1,642) $ 17,219 $ 22,343 $ 15,003 Basic $ 0.20 $ 0.38 $ 0.22 Diluted $ 0.19 $ 0.37 $ 0.22 Basic $ 0.35 $ 0.46 $ 0.30 Diluted $ 0.34 $ 0.45 $ 0.30 Basic 49,511 49,063 49,848 Diluted 50,080 49,544 50,287 in calculating earnings per share: Income from operations (GAAP) Net income (GAAP) Weighted-average number of shares used Earnings per share: (Non-GAAP) Non-GAAP income from operations Income tax adjustments (1) Non-GAAP net income Earnings per share: (GAAP) Restructuring charges and other costs Restructuring charges and other costs Amortization of intangible assets Amortization of intangible assets Customer insolvency Customer insolvency Three Months Ended

design develop deliver advanced technology 19 APPENDIX 2 - Reconciliation of GAAP to non - GAAP Financial Measures (Amounts in Thousands, Except Per Share Data) – (UNAUDITED) Mar 31, 2017 Mar 31, 2016 GAAP gross profit 49,060$ 50,317$ Customer Insolvency 3,423 - Non-GAAP gross profit 52,483$ 50,317$ GAAP SG&A Expenses 32,651$ 28,456$ Customer Insolvency 1,697 - Non-GAAP SG&A Expenses 30,954$ 28,456$ Three Months Ended