Attached files
| file | filename |
|---|---|
| EX-99.1 - EXHIBIT 99.1 - ALLIANCE DATA SYSTEMS CORP | exhibit_99-1.htm |
| 8-K - FORM 8-K - ALLIANCE DATA SYSTEMS CORP | form_8k.htm |

Alliance Data NYSE: ADS Q1, 2017 ResultsApril 20, 2017 Exhibit 99.2

Forward-Looking StatementsThis presentation contains forward-looking statements within the meaning of Section 27A of the Securities Act of 1933 and Section 21E of the Securities Exchange Act of 1934. Forward-looking statements give our expectations or forecasts of future events and can generally be identified by the use of words such as “believe,” “expect,” “anticipate,” “estimate,” “intend,” “project,” “plan,” “likely,” “may,” “should” or other words or phrases of similar import. Similarly, statements that describe our business strategy, outlook, objectives, plans, intentions or goals also are forward-looking statements. Examples of forward-looking statements include, but are not limited to, statements we make regarding our expected operating results, future economic conditions including currency exchange rates, future dividend declarations and the guidance we give with respect to our anticipated financial performance. We believe that our expectations are based on reasonable assumptions. Forward-looking statements, however, are subject to a number of risks and uncertainties that could cause actual results to differ materially from the projections, anticipated results or other expectations expressed in this presentation, and no assurances can be given that our expectations will prove to have been correct. These risks and uncertainties include, but are not limited to, factors set forth in the Risk Factors section in our Annual Report on Form 10-K for the most recently ended fiscal year, which may be updated in Item 1A of, or elsewhere in, our Quarterly Reports on Form 10-Q filed for periods subsequent to such Form 10-K. Our forward-looking statements speak only as of the date made, and we undertake no obligation, other than as required by applicable law, to update or revise any forward-looking statements, whether as a result of new information, subsequent events, anticipated or unanticipated circumstances or otherwise. 1

Agenda Speakers: Ed Heffernan President and CEO Charles Horn EVP and CFO First Quarter 2017 Consolidated ResultsSegment ResultsFull Year 2017 Outlook 1 2
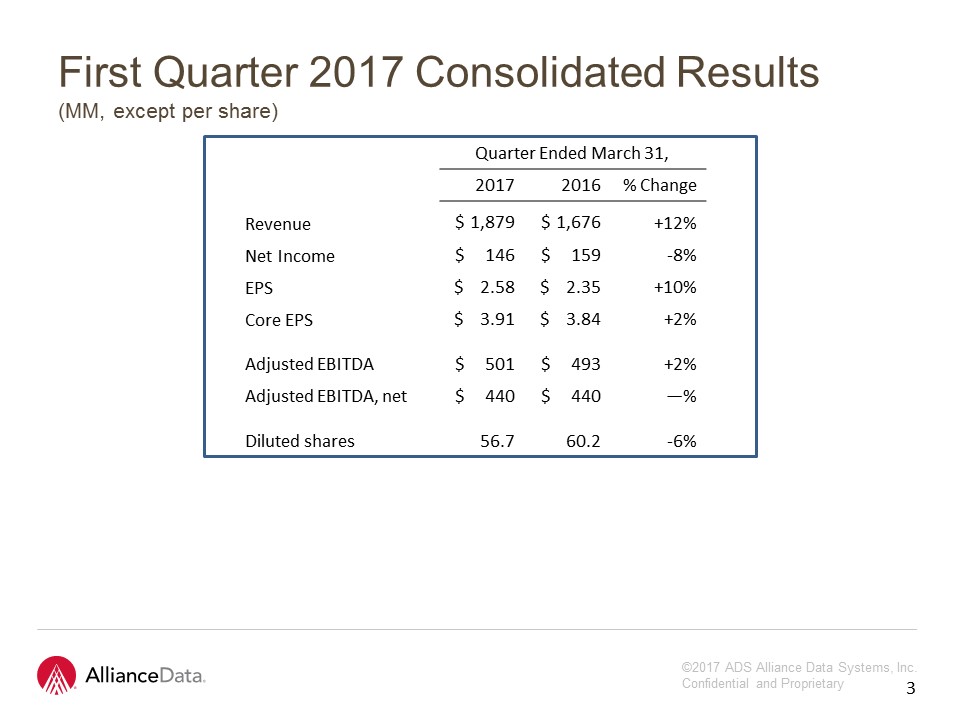
First Quarter 2017 Consolidated Results(MM, except per share) Quarter Ended March 31, 2017 2016 % Change Revenue $ 1,879 $ 1,676 +12% Net Income $ 146 $ 159 -8% EPS $ 2.58 $ 2.35 +10% Core EPS $ 3.91 $ 3.84 +2% Adjusted EBITDA $ 501 $ 493 +2% Adjusted EBITDA, net $ 440 $ 440 —% Diluted shares 56.7 60.2 -6% 2 3

LoyaltyOne® (MM) Soft quarter for AIR MILES® operating results, but adjustments to program are on track. Collector activity and engagement are improving. BrandLoyalty’s results down for the quarter due to program timing differences between years. Quarter Ended March 31, 2017 2016 % Change Revenue $ 333 $ 355 -6% Adjusted EBITDA $ 59 $ 79 -26% Non-controlling interest — -5 nm Adjusted EBITDA, net $ 59 $ 74 -20% Adjusted EBITDA % 18% 22% -4% 3 4

Epsilon® (MM) Best organic revenue growth since fourth quarter of 2015.Cost controls working.Conversant Agency (referred to as Conversant Audience going forward) stabilizing. Quarter Ended March 31, 2017 2016 % Change Revenue $ 529 $ 493 +7% Adjusted EBITDA $ 85 $ 81 +5% Adjusted EBITDA % 16% 16% —% 4 5
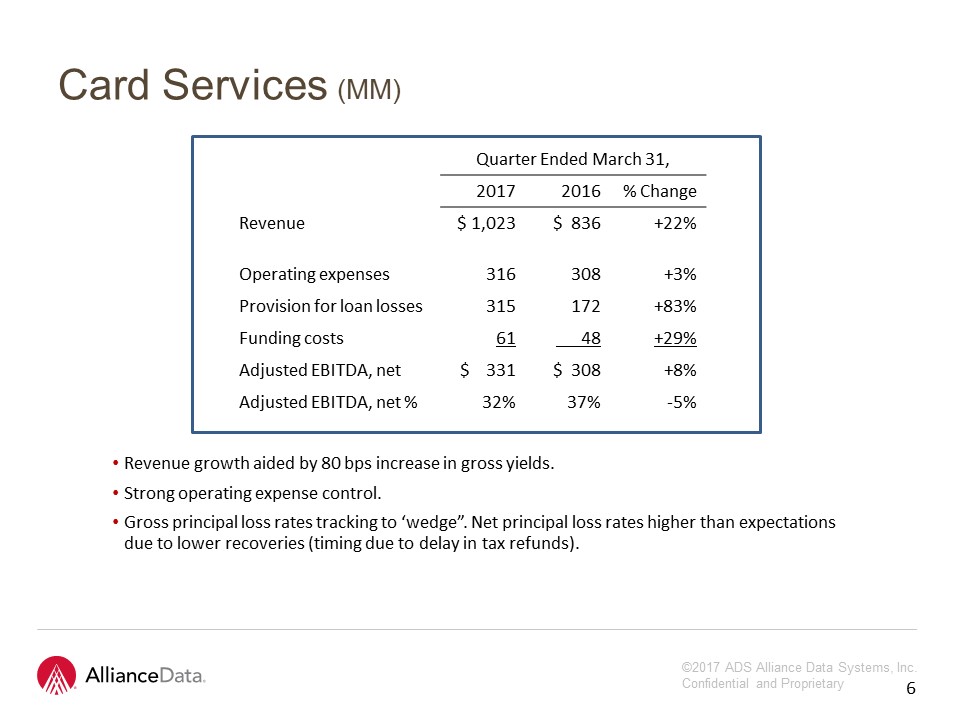
Card Services (MM) Quarter Ended March 31, 2017 2016 % Change Revenue $ 1,023 $ 836 +22% Operating expenses 316 308 +3% Provision for loan losses 315 172 +83% Funding costs 61 48 +29% Adjusted EBITDA, net $ 331 $ 308 +8% Adjusted EBITDA, net % 32% 37% -5% 5 Revenue growth aided by 80 bps increase in gross yields. Strong operating expense control. Gross principal loss rates tracking to ‘wedge”. Net principal loss rates higher than expectations due to lower recoveries (timing due to delay in tax refunds). 6

Card Services (MM) Allowance for loan loss reserve is 6.6 percent of $15.4 billion in reservable card receivables at March 31.Equivalent to 12 months forward coverageDelinquency rate of 4.8 percent consistent with guidance. Quarter Ended March 31, Key metrics: 2017 2016 Change Credit sales $ 6,579 $ 6,178 +6% Average card receivables $ 15,685 $ 13,537 +16% Total gross yield 25.5% 24.7% +0.8% Operating expenses as % of average card receivables 7.9% 9.1% -1.2% Principal loss rates 6.3% 5.2% +1.1% Delinquency rate 4.8% 4.3% +0.5% 6 7
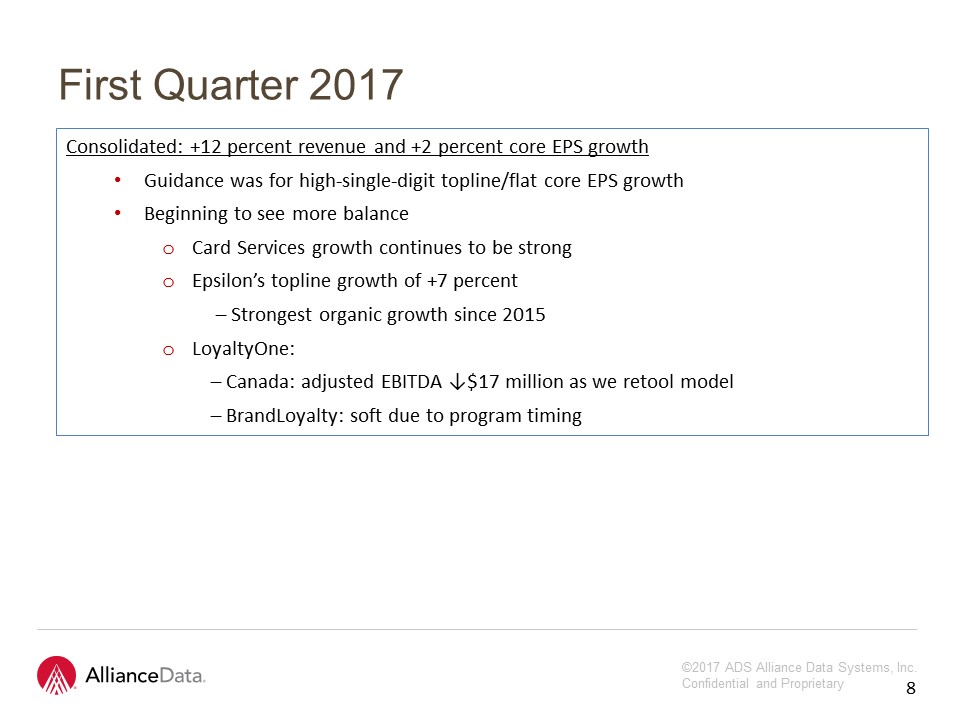
9 First Quarter 2017 Consolidated: +12 percent revenue and +2 percent core EPS growthGuidance was for high-single-digit topline/flat core EPS growthBeginning to see more balanceCard Services growth continues to be strongEpsilon’s topline growth of +7 percent Strongest organic growth since 2015LoyaltyOne: Canada: adjusted EBITDA ↓$17 million as we retool model BrandLoyalty: soft due to program timing 8

10 Epsilon:Strong first quarter: +7 percent topline; +5 percent adjusted EBITDA growthFull year guidance remains unchanged:$2.24 billion in revenue, +4 percent$500 million in adjusted EBITDA, +4 percentTechnology platform (25 percent of Epsilon revenue)Goal: move from negative revenue growth to flat by year-end Client pricing/cost structure fixedSell standardized product to market in second quarter Full Year 2017 Outlook Loyalty One:Canada: full year guidance remains unchanged$760 million in revenue, $180 million in adjusted EBITDAModel fully re-tooled by third quarter 25 percent adjusted EBITDA margin starting third quarter, compared to 20 percent this quarterAIR MILES issued +3 percent for yearBrandLoyalty: major programs launch in third and fourth quarters 9

Full Year 2017 Outlook Card Services:Card receivables growth of $2.4 billion, +15 percentPipeline robust: expect another $2 billion vintageGross yields stable; 20 bps of operating leverage (operating expenses/average receivables) Credit normalization on-trackDelinquencies tracking to wedge:Q1: 50 bps over last year (4.8 percent v. 4.3 percent) – doneQ2 – Q3: gap narrows year-over-yearQ4: flat to prior year → loss rates to followPrincipal loss rates:Approximately 6 percent in 1st half, below 5.5 percent by Q3Slowing card receivable growth rates (denominator effect) and soft recovery market (timing) negatively impacting first-halfFull Year Guidance: double-digit revenue growth; approximately 10 percent adjusted EBITDA, net growth (high end of original guidance) 10

Delinquency Wedge 11

2017 Outlook Consolidated Guidance Revenue $7.7 bn, ~5 percent Core EPS $18.50, ~10 percent 2017 Growth Rates Q1 Q2 Q3 Q4 Guidance Actual Guidance Revenue High-single +12% Mid-single Mid-single Low-teens Core EPS Flat +2% Flat Mid-teens Mid-teens 2018 “Slingshot” on-track 12

13 13 Financial MeasuresIn addition to the results presented in accordance with generally accepted accounting principles, or GAAP, the Company may present financial measures that are non-GAAP measures, such as constant currency financial measures, adjusted EBITDA, adjusted EBITDA margin, adjusted EBITDA, net of funding costs and non-controlling interest, core earnings and core earnings per diluted share (core EPS). Constant currency excludes the impact of fluctuations in foreign exchange rates. The Company calculates constant currency by converting our current period local currency financial results using the prior period exchange rates. The Company uses adjusted EBITDA and adjusted EBITDA, net as an integral part of internal reporting to measure the performance and operational strength of reportable segments and to evaluate the performance of senior management. Adjusted EBITDA eliminates the uneven effect across all reportable segments of non-cash depreciation of tangible assets and amortization of intangible assets, including certain intangible assets that were recognized in business combinations, and the non-cash effect of stock compensation expense. Similarly, core earnings and core EPS eliminate non-cash or non-operating items, including, but not limited to, stock compensation expense, amortization of purchased intangibles, amortization of debt issuance and hedging costs, mark-to-market gains or losses on interest rate derivatives, changes to the expiry policy and regulatory settlements. The Company believes that these non-GAAP financial measures, viewed in addition to and not in lieu of the Company’s reported GAAP results, provide useful information to investors regarding the Company’s performance and overall results of operations. Reconciliations to comparable GAAP financial measures are available in the Company’s earnings release, which is posted in both the News and Investors sections on the Company’s website (www.alliancedata.com). The financial measures presented are consistent with the Company’s historical financial reporting practices. Core earnings and core EPS represent performance measures and are not intended to represent liquidity measures. The non-GAAP financial measures presented herein may not be comparable to similarly titled measures presented by other companies, and are not identical to corresponding measures used in other various agreements or public filings.

Q & A 14