Attached files
| file | filename |
|---|---|
| 8-K - FORM 8-K - MidWestOne Financial Group, Inc. | a2017annualmeetingpresenta.htm |

Annual Shareholders Meeting
APRIL 20, 2017
IOWA CITY, IOWA
4/17/2017 1

4/17/2017 *Non-GAAP; excludes merger related expenses 2
$0
$5,000
$10,000
$15,000
$20,000
$25,000
$30,000
2012 2013 2014 2015 2016
Net Income
$19,472*
$28,091*
$18,522
$25,118
$18,607
$16,534
$ In Thousands
$20,391
$25,118
$23,277*

4/17/2017
# Non-GAAP; excludes goodwill impairment charge;
* EPS excludes merger-related costs; $2.19 in 2014, $2.41 in 2015, $1.78 in 2016
3
$2.70*
$0.00
$0.50
$1.00
$1.50
$2.00
$2.50
$3.00
2
0
0
0
2
0
0
1
2
0
0
2
2
0
0
3
2
0
0
4
2
0
0
5
2
0
0
6
2
0
0
7
2
0
0
8
#
2
0
0
9
2
0
1
0
2
0
1
1
2
01
2
2
0
1
3
2
0
1
4
*
2
0
1
5
*
2
0
1
6
*
$1.04
$1.47
$1.95
$2.19
$2.32*
Basic Earnings Per Share 2000 - 2016
ISB Financial Corp. MOFG
$2.03*
$1.78*
$2.42*
$2.20*

4/17/2017 *$39.6 million in deposits combined at the time of sale of the Barron, Rice Lake, and Davenport offices. 4
($ in thousands)
$1,399,733 $1,374,942 $1,408,542
$2,463,521
$2,480,448
$0
$500,000
$1,000,000
$1,500,000
$2,000,000
$2,500,000
$3,000,000
2012 2013 2014 2015 2016
MOFG Total Deposits
$2,520,048*

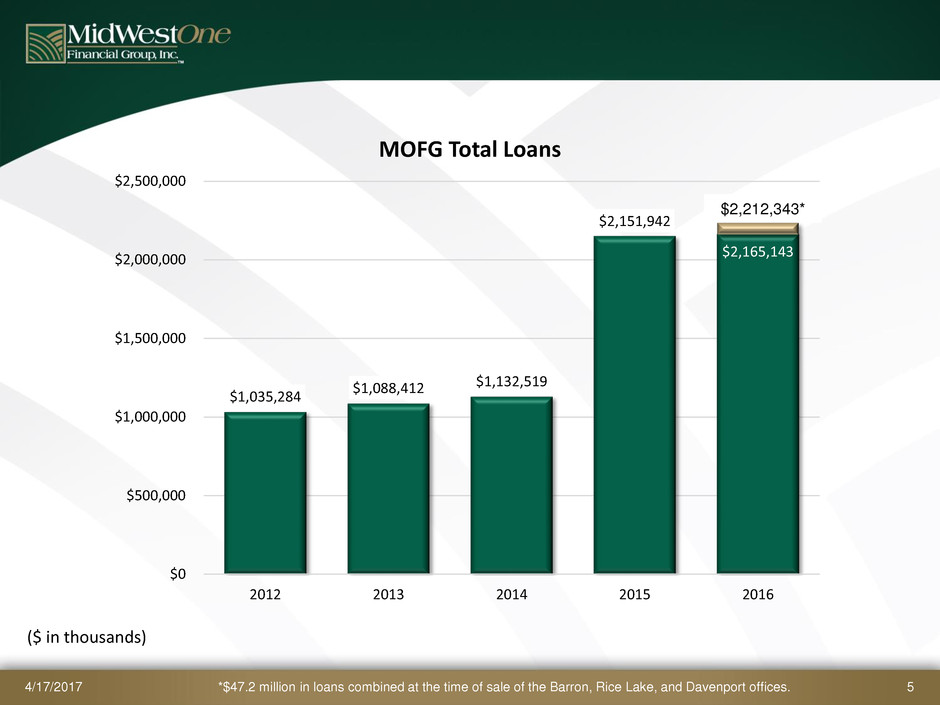
4/17/2017 *$47.2 million in loans combined at the time of sale of the Barron, Rice Lake, and Davenport offices. 5
($ in thousands)
$1,035,284
$1,088,412 $1,132,519
$2,151,942
$2,165,143
$0
$500,000
$1,000,000
$1,500,000
$2,000,000
$2,500,000
2012 2013 2014 2015 2016
MOFG Total Loans
$2,212,343*

4/17/2017 6
73.96%
79.16%
80.40%
87.35% 87.30%
65.00%
70.00%
75.00%
80.00%
85.00%
90.00%
2012 2013 2014 2015 2016
MOFG Loans to Deposit Ratio

9.22%
9.69%
10.29%
7.51% 7.62%
8.36%
0.00%
2.00%
4.00%
6.00%
8.00%
10.00%
12.00%
2012 2013 2014 2015 2016 03.31.2017
Tangible Common Equity to Tangible Asset Ratio
4/17/2017 7
MOFG’s Stated
Target: 8.00%

4/17/2017 8
10.95%
11.43%
10.61%
14.29%
10.13%
8.00%
9.00%
10.00%
11.00%
12.00%
13.00%
14.00%
15.00%
2012 2013 2014 2015 2016
Return on Average Tangible Equity

4/17/2017 9
FACTORS CONTRIBUTING TO REDUCTION
IN 2016 NET INCOME
1.35%
1.43%
1.32%
0.95%
1.41%
0.00%
0.20%
0.40%
0.60%
0.80%
1.00%
1.20%
1.40%
1.60%
2012 2013 2014 2015 2016
Nonperforming Assets/Total Loans

4/17/2017 10
FACTORS CONTRIBUTING TO REDUCTION
IN 2016 NET INCOME
0.21%
0.11%
0.09%
0.11%
0.26%
0.00%
0.05%
0.10%
0.15%
0.20%
0.25%
0.30%
2012 2013 2014 2015 2016
Net Loans Charged Off to Average Loans

4/17/2017 11
FACTORS CONTRIBUTING TO REDUCTION
IN 2016 NET INCOME
$2,379
$1,350 $1,200
$5,132
$7,983
$0
$1,000
$2,000
$3,000
$4,000
$5,000
$6,000
$7,000
$8,000
$9,000
2012 2013 2014 2015 2016
Provision for Loan Loses

4/17/2017 12
FACTORS CONTRIBUTING TO REDUCTION
IN 2016 NET INCOME
$87,806
$84,595
$82,000
$83,000
$84,000
$85,000
$86,000
$87,000
$88,000
$89,000
Non-Interest Expense
2016
Non-Interest Expense
2016 Budget
Increased Non-Interest Expenses
$4,568
$1,768
$0
$500
$1,000
$1,500
$2,000
$2,500
$3,000
$3,500
$4,000
$4,500
$5,000
Merger Related Expenses
2016
Merger Related Expenses
2016 Budget
Increased Merger Expenses
$ in Thousands

4/17/2017 13
MOFG BY REGION
Twin Cities (MN) Iowa
2015 2016 % + or - 2015 2016 % + or -
Deposits $706,654 $719,615 +1.83% $1,390,936 $1,435,703 +3.22%
Loans $760,356 $823,397 +8.29% $1,134,110 $1,132,789 -0.12%
SW Florida Wisconsin
2015 2016 % + or - 2015 2016 % + or -
Deposits $84,890 $93,693 +10.37% $231,722 $232,444 +0.31%
Loans $118,442 $130,003 +9.76% $105,555 $94,454 -10.52%

4/17/2017 14
2017 OUTLOOK
• Strong Economy
• Iowa City, Twin Cities, and SW Florida
• Rural Iowa and Wisconsin in
Slow Growth / No Growth Stage
• Minimize Credit Problems
• Deposit and Loan Growth
• Continue to Improve Efficiency
• Capitalize on the Denver Opportunity

4/17/2017 15
WORK AS ONE TEAM

4/17/2017 16
SERVING OUR COMMUNITIES

4/17/2017 17
DENVER

4/17/2017 18
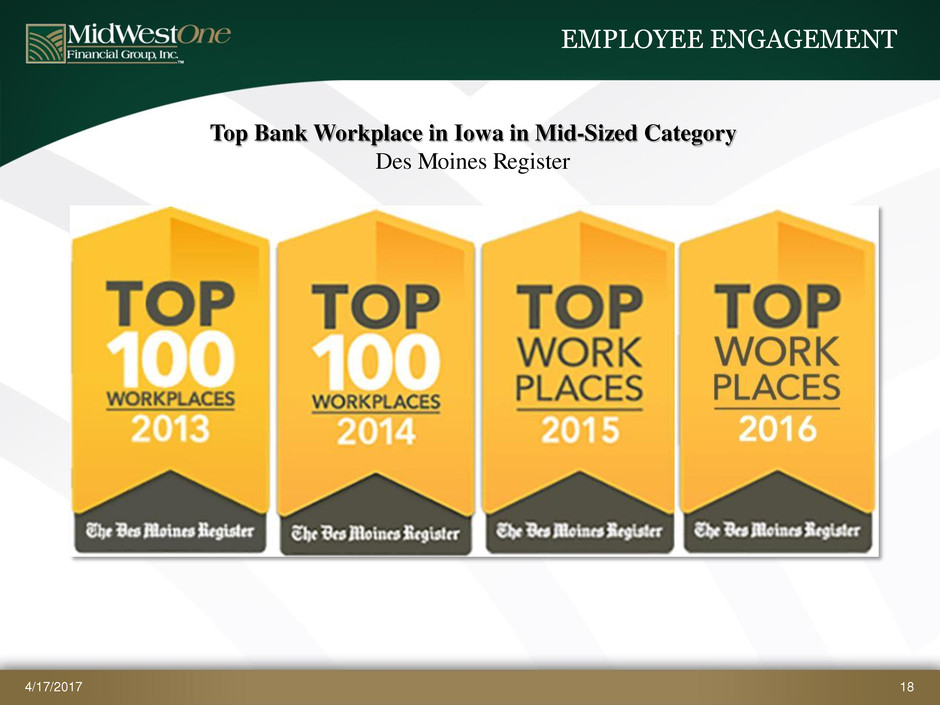
EMPLOYEE ENGAGEMENT
Top Bank Workplace in Iowa in Mid-Sized Category
Des Moines Register

4/17/2017 19
OUR OPERATING PRINCIPLES
1. Take good care of our customers
2. Hire and retain excellent employees
3. Always conduct yourself with the
utmost integrity
4. Work as one team
5. Learn constantly so we can
continually improve

4/17/2017 *Susan Evans announced a phased retirement in July 2016, which will be effective in late 2017.
20
SENIOR MANAGEMENT TEAM
Position
Banking
Experience
Years with
Company
Charles N. Funk President & CEO 38 Years 17 Years
Kevin E. Kramer Chief Operating Officer 22 Years First Year
Kent L. Jehle EVP, Chief Credit Officer 36 Years 31 Years
Katie A. Lorenson SVP, Chief Financial Officer 17 Years 6 Years
Susan L. Armbrecht Senior Retail Regional Officer, Twin Cities
and Cedar Valley Regional President
42 Years 8 Years
James M. Cantrell SVP, Chief Risk Officer 31 Years 8 Years
Mitchell W. Cook Senior Regional President, Twin Cities 15 Years 15 Years
Susan R. Evans* SVP, Special Projects 41 Years 16 Years
Barbara A. Finney SVP, Operations 25 Years 20 Years
Sondra J. Harney SVP, Director of Human Resources 38 Years 38 Years
John J. Henk SVP, Chief Information Officer 30 Years 11 Years
Karin M. Taylor SVP, Chief Risk Officer 27 Years 8 Years
Gregory W. Turner SVP, Wealth Management 20 Years 9 Years

4/17/2017 Data provided by SNL Financial. 21
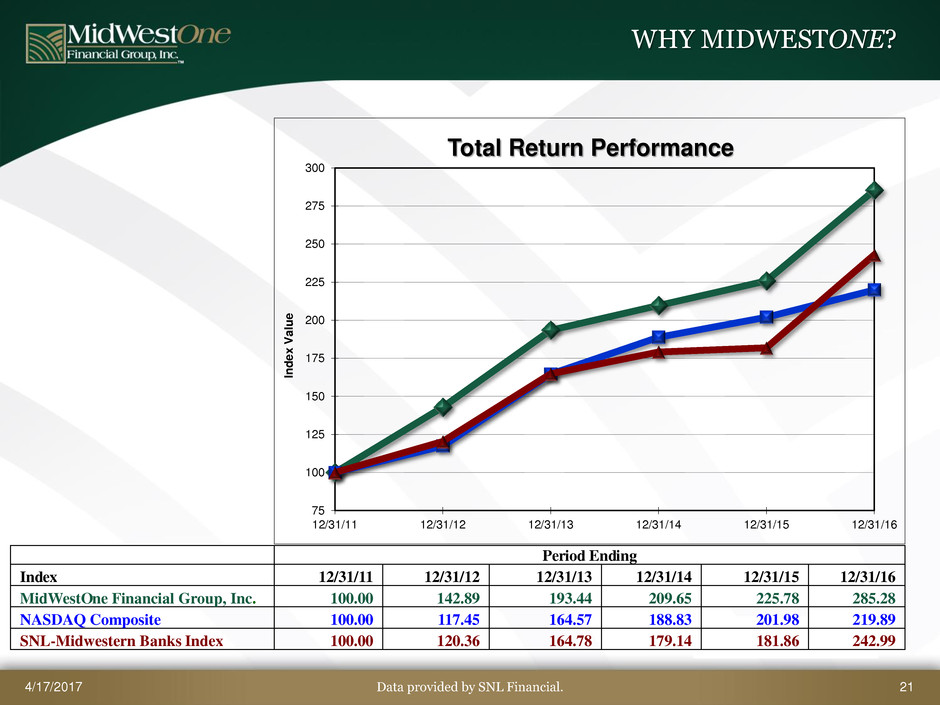
WHY MIDWESTONE?
Period Ending
Index 12/31/11 12/31/12 12/31/13 12/31/14 12/31/15 12/31/16
MidWestOne Financial Group, Inc. 100.00 142.89 193.44 209.65 225.78 285.28
NASDAQ Composite 100.00 117.45 164.57 188.83 201.98 219.89
SNL-Midwestern Banks Index 100.00 120.36 164.78 179.14 181.86 242.99
75
100
125
150
175
200
225
250
275
300
12/31/11 12/31/12 12/31/13 12/31/14 12/31/15 12/31/16
In
d
e
x
V
a
lu
e
Total Return Performance

4/17/2017
# Non-GAAP; excludes goodwill impairment charge;
* EPS excludes merger-related costs; $2.19 in 2014, $2.41 in 2015, $1.78 in 2016
22
$2.70*
$0.00
$0.50
$1.00
$1.50
$2.00
$2.50
$3.00
2
0
0
0
2
0
0
1
2
0
0
2
2
0
0
3
2
0
0
4
2
0
0
5
2
0
0
6
2
0
0
7
2
0
0
8
#
2
0
0
9
2
0
1
0
2
0
1
1
2
01
2
2
0
1
3
2
0
1
4
*
2
0
1
5
*
2
0
1
6
*
$1.04
$1.47
$1.95
$2.19
$2.32*
Basic Earnings Per Share 2000 - 2016
ISB Financial Corp. MOFG
$2.03*
$1.78*
$2.42*
$2.20*

4/17/2017 23
PORTFOLIO LENDING TICKS DOWN IN 2016
Source: ABA Real Estate Lending Survey. Chart provided by ABA Banking Journal.

4/17/2017 24
THE MIDWESTONE FOOTPRINT

