Attached files
| file | filename |
|---|---|
| EX-99.1 - FIRST COMMUNITY CORP /SC/ | e17197_ex99-1.htm |
| EX-3.1 - FIRST COMMUNITY CORP /SC/ | e17197_ex3-1.htm |
| EX-2.1 - FIRST COMMUNITY CORP /SC/ | e17197_ex2-1.htm |
| 8-K - FIRST COMMUNITY CORP /SC/ | e17197_fcco-8k.htm |

NASDAQ: FCCO Acquisition Announcement of Cornerstone Bancorp Investor Presentation April 12, 2017
Forward Looking Statement 2 This presentation contains forward - looking statements made pursuant to the safe - harbor provisions of the Private Securities Litigation Reform Act of 1995 . Such forward - looking statements can often, but not always, be identified by the use of words like “believe”, “continue”, “pattern”, “estimate”, “project”, “intend”, “anticipate”, “expect” and similar expressions or future or conditional verbs such as “will”, would”, “should”, “could”, “might”, “can”, “may”, or similar expressions . These forward - looking statements include, but are not limited to, statements relating to the expected timing and benefits of the proposed merger (the “Merger”) between First Community Corporation (“First Community” or “FCCO”) and Cornerstone Bancorp (“Cornerstone” or “CTOT”), including future financial and operating results, cost savings, enhanced revenues, and accretion/dilution to reported earnings that may be realized from the Merger, as well as other statements of expectations regarding the Merger, and other statements of FCCO’s goals, intentions and expectations ; statements regarding the FCCO’s business plan and growth strategies ; statements regarding the asset quality of FCCO’s loan and investment portfolios ; and estimates of FCCO’s risks and future costs and benefits, whether with respect to the Merger or otherwise . These forward - looking statements are subject to significant risks, assumptions and uncertainties that may cause actual results to differ materially from those anticipated by such forward - looking statements, including, among other things : the risk that the businesses of First Community Corporation and Cornerstone Bancorp will not be integrated successfully or such integration may be more difficult, time - consuming or costly than expected ; expected revenue synergies and cost savings from the Merger may not be fully realized or realized within the expected time frame ; revenues following the Merger may be lower than expected ; customer and employee relationships and business operations may be disrupted by the Merger ; the ability to obtain required governmental and shareholder approvals, and the ability to complete the Merger on the expected timeframe or at all ; possible changes in economic and business conditions ; the existence or exacerbation of general geopolitical instability and uncertainty ; the ability of First Community to integrate recent or other acquisitions and attract new customers ; possible changes in monetary and fiscal policies, and laws and regulations ; the effects of easing restrictions on participants in the financial services industry ; the cost and other effects of legal and administrative cases ; possible changes in the credit worthiness of customers and the possible impairment of collectability of loans ; fluctuations in market rates of interest ; competitive factors in the banking industry ; changes in the banking legislation or regulatory requirements of federal and state agencies applicable to bank holding companies and banks like FCCO’s affiliate bank ; continued availability of earnings and excess capital sufficient for the lawful and prudent declaration of dividends ; changes in market, economic, operational, liquidity, credit and interest rate risks associated with the FCCO’s business ; and other risks and factors identified in FCCO’s annual report of Form 10 - K filed with the Securities and Exchange Commission on March 13 , 2017 or in its subsequent filings with the Securities and Exchange Commission . All subsequent written and oral forward - looking statements concerning FCCO, CTOT or the proposed Merger by FCCO, CTOT or any person acting on either company’s behalf are expressly qualified in their entirety by the cautionary statements above . Neither First Community nor Cornerstone Bancorp undertake any obligation to update any forward - looking statement, whether written or oral, relating to the matters discussed in this presentation or press release or in subsequent written or oral communications . In addition, FCCO’s and CTOT’s past results of operations do not necessarily indicate either of their anticipated future results, whether the Merger is effectuated or not . Annualized, pro forma, projected and estimated numbers are used for illustrative purpose only, are not forecasts, and may not reflect actual results .

Additional Information 3 Additional Information In connection with the proposed merger with Cornerstone Bancorp, First Community intends to file with the Securities and Exchange Commission (the “SEC”) a Registration Statement on Form S - 4 (the “Registration Statement”) to register the shares of FCCO common stock to be issued to shareholders of Cornerstone in connection with the transaction . The Registration Statement will include a Proxy Statement of Cornerstone and a Prospectus of First Community, as well as other relevant materials regarding the proposed merger transaction involving First Community and Cornerstone . SECURITY HOLDERS OF CORNERSTONE ARE ADVISED TO READ THE PROXY STATEMENT/PROSPECTUS WHEN IT BECOMES AVAILABLE AND ANY OTHER DOCUMENTS FILED WITH THE SEC IN CONNECTION WITH THE MERGER OR INCORPORATED BY REFERENCE IN THE PROXY STATEMENT/PROSPECTUS BECAUSE THEY WILL CONTAIN IMPORTANT INFORMATION REGARDING THE PROPOSED MERGER TRANSACTION . Investors and security holders may obtain free copies of these documents, once they are filed, and other documents filed with the SEC on the SEC's website at http : //www . sec . gov . Investors and security holders may also obtain free copies of the documents filed with the SEC by First Community on First Community’s website at http : //www . firstcommunitysc . com/ (which website is not incorporated herein by reference), Investor Relations, or by contacting Mike Crapps, President and CEO, at First Community Corporation, 5455 Sunset Boulevard, Lexington, SC 29072 , or by telephone at ( 803 ) 951 - 0501 . Non-GAAP Measures Statements included in this presentation include certain non-GAAP measures and should be read along with the accompanying tables to the January 18 , 2017 earnings release which provides a reconciliation of non-GAAP measures to GAAP measures . Management believes that these non-GAAP measures provide additional useful information that allows readers to evaluate the ongoing performance of the Company . Non-GAAP measures should not be considered as an alternative to any measure of performance or financial condition as promulgated under GAAP, and investors should consider the Company's performance and financial condition as reported under GAAP and all other relevant information when assessing the performance or financial condition of the Company . Non-GAAP measures have limitations as analytical tools, and investors should not consider them in isolation or as a substitute for analysis of the Company's results or financial condition as reported under GAAP .
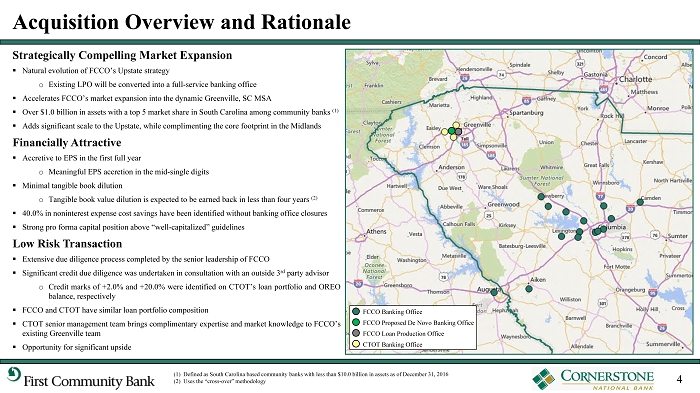
Acquisition Overview and Rationale Strategically Compelling Market Expansion ▪ Natural evolution of FCCO’s Upstate strategy o Existing LPO will be converted into a full - service banking office ▪ Accelerates FCCO’s market expansion into the dynamic Greenville, SC MSA ▪ Over $ 1 . 0 billion in assets with a top 5 market share in South Carolina among community banks ( 1 ) ▪ Adds significant scale to the Upstate, while complimenting the core footprint in the Midlands Financially Attractive ▪ Accretive to EPS in the first full year o Meaningful EPS accretion in the mid - single digits ▪ Minimal tangible book dilution o Tangible book value dilution is expected to be earned back in less than four years ( 2 ) ▪ 40 . 0 % in noninterest expense cost savings have been identified without banking office closures ▪ Strong pro forma capital position above “well - capitalized” guidelines Low Risk Transaction ▪ Extensive due diligence process completed by the senior leadership of FCCO ▪ Significant credit due diligence was undertaken in consultation with an outside 3 rd party advisor o Credit marks of + 2 . 0 % and + 20 . 0 % were identified on CTOT’s loan portfolio and OREO balance, respectively ▪ FCCO and CTOT have similar loan portfolio composition ▪ CTOT senior management team brings complimentary expertise and market knowledge to FCCO’s existing Greenville team ▪ Opportunity for significant upside (1) Defined as South Carolina based community banks with less than $10.0 billion in assets as of December 31, 2016 (2) Uses the “cross - over” methodology 4 FCCO Banking Office FCCO Proposed De Novo Banking Office FCCO Loan Production Office CTOT Banking Office

Cornerstone Bancorp Meets Acquisition Target Criteria Creates Significant Value for FCCO Shareholders Low Risk to Business Model Enhances Market Presence in Dynamic Markets 5

Overview of Transaction Terms (1) Based on FCCO’s closing stock price of $20.60 as of April 10, 2017 and a cash payment of $11.00 per share; Aggregate value includes the intrinsic value of options cashed out based on the indicative value per common share of $11.09 (2) Based on 6,713,335 FCCO common shares outstanding and 2,320,991 CTOT common shares outstanding and a fixed exchange rati o o f 0.5400x (3) FCCO currently has three board members that reside in the Greenville MSA Transaction Cornerstone Bancorp to be merged with and into First Community Corporation Acquirer First Community Corporation (NASDAQ: FCCO) Target Cornerstone Bancorp (OTC Pink: CTOT) Stock Consideration Fixed exchange ratio of 0.5400x shares of FCCO common stock for each share of CTOT stock, for 70.0% of CTOT shares Cash Consideration $11.00 per common share for 30.0% of CTOT shares Treatment of Options Cashed out Indicative Value (1) $11.09 per common share or approximately $25.8 million in aggregate value Pro Forma Ownership (2) 88.4% FCCO / 11.6% CTOT Board Composition (3) FCCO (15) / CTOT (None) Required Approvals Customary closing conditions, including regulatory and CTOT shareholder approvals Expected Closing Early 4 th Quarter of 2017 6

(1) Transaction multiples above are based on the indicative value per common share of $11.09 (2) Based on 40.0% of noninterest expense cost savings and a corporate tax rate of 35.0% (3) Core deposits defined as total deposits less time deposit accounts greater than $100,000 Transaction Multiples (1) 7 Price / TBV Price / LTM EPS Core Deposit Premium (3) Price / 2018E EPS + Cost Savings (2) 138.8% 39.7x 14.1x 6.50%
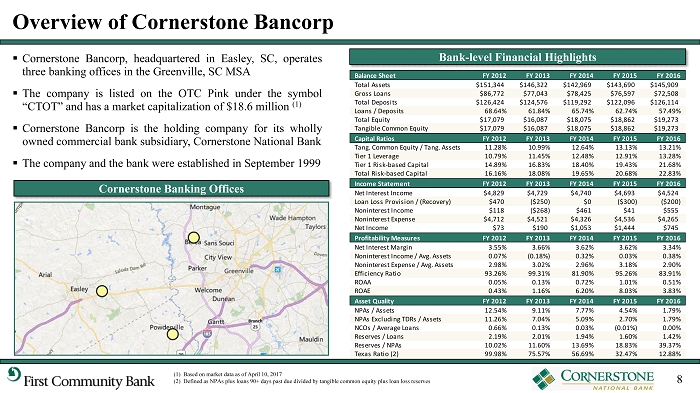
Balance Sheet FY 2012 FY 2013 FY 2014 FY 2015 FY 2016 Total Assets $151,344 $146,322 $142,969 $143,690 $145,909 Gross Loans $86,772 $77,043 $78,425 $76,597 $72,508 Total Deposits $126,424 $124,576 $119,292 $122,096 $126,114 Loans / Deposits 68.64% 61.84% 65.74% 62.74% 57.49% Total Equity $17,079 $16,087 $18,075 $18,862 $19,273 Tangible Common Equity $17,079 $16,087 $18,075 $18,862 $19,273 Capital Ratios FY 2012 FY 2013 FY 2014 FY 2015 FY 2016 Tang. Common Equity / Tang. Assets 11.28% 10.99% 12.64% 13.13% 13.21% Tier 1 Leverage 10.79% 11.45% 12.48% 12.91% 13.28% Tier 1 Risk-based Capital 14.89% 16.83% 18.40% 19.43% 21.68% Total Risk-based Capital 16.16% 18.08% 19.65% 20.68% 22.83% Income Statement FY 2012 FY 2013 FY 2014 FY 2015 FY 2016 Net Interest Income $4,829 $4,729 $4,740 $4,693 $4,524 Loan Loss Provision / (Recovery) $470 ($250) $0 ($300) ($200) Noninterest Income $118 ($268) $461 $41 $555 Noninterest Expense $4,712 $4,521 $4,326 $4,536 $4,265 Net Income $73 $190 $1,053 $1,444 $745 Profitability Measures FY 2012 FY 2013 FY 2014 FY 2015 FY 2016 Net Interest Margin 3.55% 3.66% 3.62% 3.62% 3.34% Noninterest Income / Avg. Assets 0.07% (0.18%) 0.32% 0.03% 0.38% Noninterest Expense / Avg. Assets 2.98% 3.02% 2.96% 3.18% 2.90% Efficiency Ratio 93.26% 99.31% 81.90% 95.26% 83.91% ROAA 0.05% 0.13% 0.72% 1.01% 0.51% ROAE 0.43% 1.16% 6.20% 8.03% 3.83% Asset Quality FY 2012 FY 2013 FY 2014 FY 2015 FY 2016 NPAs / Assets 12.54% 9.11% 7.77% 4.54% 1.79% NPAs Excluding TDRs / Assets 11.26% 7.04% 5.09% 2.70% 1.79% NCOs / Average Loans 0.66% 0.13% 0.03% (0.01%) 0.00% Reserves / Loans 2.19% 2.01% 1.94% 1.60% 1.42% Reserves / NPAs 10.02% 11.60% 13.69% 18.83% 39.37% Texas Ratio (2) 99.98% 75.57% 56.69% 32.47% 12.88% Overview of Cornerstone Bancorp 8 ▪ Cornerstone Bancorp, headquartered in Easley, SC, operates three banking offices in the Greenville, SC MSA ▪ The company is listed on the OTC Pink under the symbol “CTOT” and has a market capitalization of $ 18 . 6 million ( 1 ) ▪ Cornerstone Bancorp is the holding company for its wholly owned commercial bank subsidiary, Cornerstone National Bank ▪ The company and the bank were established in September 1999 (1) Based on market data as of April 10, 2017 (2) Defined as NPAs plus loans 90+ days past due divided by tangible common equity plus loan loss reserves Cornerstone Banking Offices Bank - level Financial Highlights

Pro Forma Loan Portfolio Note: Financial data as of December 31, 2016 per regulatory filings; Excludes purchase accounting adjustments Source: SNL Financial; Company Documents Loans ($000s) Loans ($000s) Loans ($000s) Construction & Land 57,772$ 10.5% Construction & Land 11,460$ 15.8% Construction & Land 69,232$ 11.1% 1-4 Family 136,303 24.7% 1-4 Family 9,796 13.5% 1-4 Family 146,099 23.4% Multifamily 8,631 1.6% Multifamily 2,304 3.2% Multifamily 10,935 1.7% CRE - Income Producing 130,829 23.7% CRE - Income Producing 17,766 24.5% CRE - Income Producing 148,595 23.8% CRE - Owner-Occupied 164,335 29.7% CRE - Owner-Occupied 24,055 33.2% CRE - Owner-Occupied 188,390 30.1% C&I 42,704 7.7% C&I 5,777 8.0% C&I 48,481 7.8% Consumer & Other 11,842 2.1% Consumer & Other 1,350 1.9% Consumer & Other 13,192 2.1% Total 552,416$ 100.0% Total 72,508$ 100.0% Total 624,924$ 100.0% 37.5% 41.1% 37.9% 61.2% 65.6% 61.7% 4.60% 5.00% 4.65%LTM Yield on Loans: LTM Yield on Loans: LTM Yield on Loans: First Community Corporation (FCCO) Cornerstone Bancorp (CTOT) Pro Forma Company C&I + CRE - Owner-Occupied Loans: Total Commercial Loans: C&I + CRE - Owner-Occupied Loans: Total Commercial Loans: C&I + CRE - Owner-Occupied Loans: Total Commercial Loans: 10.5% 24.7% 1.6% 23.7% 29.7% 7.7% 2.1% 15.8% 13.5% 3.2% 24.5% 33.2% 8.0% 1.9% 11.1% 23.4% 1.7% 23.8% 30.1% 7.8% 2.1% 9
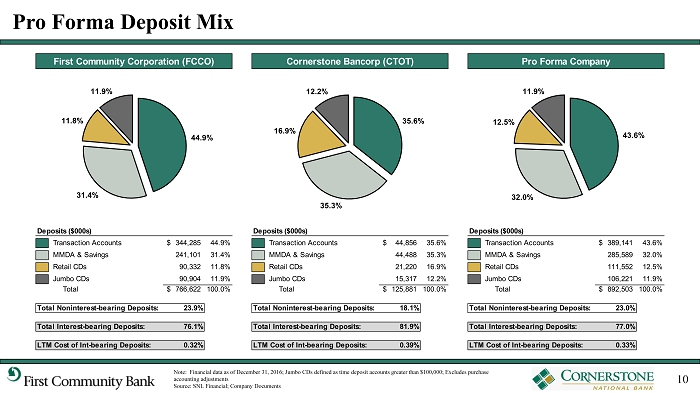
Pro Forma Deposit Mix Deposits ($000s) Deposits ($000s) Deposits ($000s) Transaction Accounts 344,285$ 44.9% Transaction Accounts 44,856$ 35.6% Transaction Accounts 389,141$ 43.6% MMDA & Savings 241,101 31.4% MMDA & Savings 44,488 35.3% MMDA & Savings 285,589 32.0% Retail CDs 90,332 11.8% Retail CDs 21,220 16.9% Retail CDs 111,552 12.5% Jumbo CDs 90,904 11.9% Jumbo CDs 15,317 12.2% Jumbo CDs 106,221 11.9% Total 766,622$ 100.0% Total 125,881$ 100.0% Total 892,503$ 100.0% 23.9% 18.1% 23.0% 76.1% 81.9% 77.0% 0.32% 0.39% 0.33%LTM Cost of Int-bearing Deposits: LTM Cost of Int-bearing Deposits: LTM Cost of Int-bearing Deposits: Total Interest-bearing Deposits: Total Interest-bearing Deposits: Total Interest-bearing Deposits: First Community Corporation (FCCO) Cornerstone Bancorp (CTOT) Pro Forma Company Total Noninterest-bearing Deposits: Total Noninterest-bearing Deposits: Total Noninterest-bearing Deposits: 44.9% 31.4% 11.8% 11.9% 35.6% 35.3% 16.9% 12.2% 43.6% 32.0% 12.5% 11.9% Note: Financial data as of December 31, 2016; Jumbo CDs defined as time deposit accounts greater than $100,000; Excludes pur cha se accounting adjustments Source: SNL Financial; Company Documents 10

Greenville, SC MSA Market Overview 11 Greenville Market Overview Top Universities and Corporate Leaders in Market Demographically Accretive (2) 6.06% 8.20% FCCO CTOT 5.08% 6.10% FCCO CTOT 2010 – 2017 Actual Pop. Growth 2017 – 2022 Proj. Pop. Growth ▪ Largest MSA in South Carolina ( 1 ) with a total population of 891 , 702 , which represents ~ 17 . 9 % of South Carolina ▪ Total deposits of $ 15 . 4 billion, which represents ~ 19 . 4 % of South Carolina ▪ Located halfway between Atlanta and Charlotte, Greenville has grown into a large metropolitan area and is home to a diverse range of business and industry o Primary economic drivers are automotive manufacturing, aviation machining, healthcare, pharmaceutical, textiles and services industries ▪ Considered to be the economic engine of South Carolina, Greenville has more corporate headquarters than any other region in the state o Including the North American headquarters for Michelin, AVX Corporation, Ameco and Scansource ▪ Ranked # 2 Best City in America to Start a Business by Xome in 2016 o “With average revenue of $ 1 , 874 , 514 , Greenville businesses make twice as much as the average business in South Carolina . The “Upstate” region of South Carolina boasts $ 1 . 1 billion in new capital investments and has created more than 6 , 000 jobs in the last five years alone . ” ▪ Listed in the “Top 10 Small Cities Where Business is Thriving” by Nerdwallet and Entrepreneur’s 2016 study ▪ Ranked as # 1 Micro City of the Future, # 1 City for Economic Potential, and # 2 City for Business Friendliness by fDi Intelligence’s “American Cities of the Future 2015 / 16 ” Note: MSA information sourced from the Greenville Chamber of Commerce and SNL Financial (1) Excluding the Charlotte - Concord - Gastonia NC - SC MSA that is primarily located in North Carolina (2) Demographic data is estimated as of January 1, 2017 based on 2010 U.S. Census data and annual surveys performed by Niels en; FCCO data based on the weighted average values for its existing MSAs; CTOT data reflects the Greenville MSA

Overview of Pro Forma Franchise 12 FCCO Banking Office FCCO Proposed De Novo Banking Office FCCO Loan Production Office CTOT Banking Office Greenville MSA Comm. Bank Rank: #10 Deposits: $128.6M Market Total: $15.4B Pop. Growth: 6.10% Newberry MSA Comm. Bank Rank: #1 Deposits: $141.6M Market Total: $482.6M Pop. Growth: 3.36% Columbia MSA Comm. Bank Rank: #1 Deposits: $488.8M Market Total: $18.3B Pop. Growth: 5.68% Augusta MSA Comm. Bank Rank: #4 Deposits: $102.1M Market Total: $8.0B Pop. Growth: 5.87% Note: MSA deposits data and ranks as of June 30, 2016; Projected population growth from 2017 to 2022; Community Bank defined as an institution with less than $25.0 billion in total assets (1) Based on financial data as of December 31, 2016; Total banking offices includes FCCO’s proposed de novo banking office; Mar ket capitalization based on FCCO’s closing price of $20.60 as of April 10, 2017 Banking Offices: 19 Assets: $1.1 Billion Gross Loans: $622.3 Million Deposits: $892.5 Million Market Cap: $156.4 Million Pro Forma Financial Highlights (1) Leverage Ratio: 9.64% TCE / TA: 7.97%
Transaction Summary 13 x Combination is a natural next step in FCCO’s Upstate strategy x Combination creates a more geographically diversified franchise with greater ability to accelerate growth in the dynamic Greenville, SC market x Adds significant scale to the Upstate, while complimenting the core footprint in the Midlands x Combined FCCO Greenville team and CTOT senior management team brings complimentary expertise and market knowledge x Pro forma company exceeds the $ 1 . 0 billion in assets threshold and will have top 5 market share in South Carolina among community banks x Low cost of deposits is retained with expected pick up in yield on loans x Accretive to earnings per share in the first year x Pro forma company remains well - capitalized with the ability to support enhanced growth potential x Continued management focus on maximizing shareholder value First Community Corporation and Cornerstone Bancorp are joining forces

Non - GAAP Reconciliation Footnotes Tangible Common Equity Disclosure Tangible common equity to tangible assets (“the tangible common equity ratio”) and tangible book value per common share are non - GAAP financial measures derived from GAAP - based amounts . The Company calculates the tangible common equity ratio by excluding the balance of intangible assets from common shareholders’ equity and dividing by total assets . The Company calculates tangible book value per common share by dividing tangible common equity by common shares outstanding, as compared to book value per common share, which the Company calculates by dividing common shareholders’ equity by common shares outstanding . The Company considers this information important to shareholders’ as tangible equity is a measure that is consistent with the calculation of capital for bank regulatory purposes, which excludes intangible assets from the calculation of risk based ratios and as such is useful for investors, regulators, management, and others to evaluate capital adequacy and to compare against other financial institutions . 14