Attached files
| file | filename |
|---|---|
| EX-32.1 - EXHIBIT 32.1 - QAD INC | ex32-1.htm |
| EX-31.2 - EXHIBIT 31.2 - QAD INC | ex31-2.htm |
| EX-31.1 - EXHIBIT 31.1 - QAD INC | ex31-1.htm |
| EX-23.1 - EXHIBIT 23.1 - QAD INC | ex23-1.htm |
| EX-21.1 - EXHIBIT 21.1 - QAD INC | ex21-1.htm |
| EX-10.10 - EXHIBIT 10.10 - QAD INC | ex10-10.htm |
UNITED STATES
SECURITIES AND EXCHANGE COMMISSION
Washington D.C. 20549
FORM 10-K
|
☒ |
ANNUAL REPORT PURSUANT TO SECTION 13 OR 15(d) OF THE SECURITIES EXCHANGE ACT OF 1934 |
For the fiscal year ended January 31, 2017
OR
|
☐ |
TRANSITION REPORT PURSUANT TO SECTION 13 OR 15(d) OF THE SECURITIES EXCHANGE ACT OF 1934 |
Commission File Number: 0-22823
QAD Inc.
(Exact name of Registrant as specified in its charter)
|
Delaware |
77-0105228 |
|
(State or Other Jurisdiction of Incorporation or Organization) |
(I.R.S. Employer Identification No.) |
100 Innovation Place
Santa Barbara, California 93108
(Address of principal executive offices and zip code)
Registrant’s telephone number, including area code (805) 566-6000
Securities registered pursuant to Section 12(g) of the Act:
|
Title of Each Security |
Name of Each Exchange on Which Registered |
|
Class A Common Stock, $.001 par value |
The NASDAQ Stock Market LLC |
|
Class B Common Stock, $.001 par value |
(NASDAQ Global Select Market) |
Securities registered pursuant to Section 12(b) of the Act: None
Indicate by check mark if the Registrant is a well-known seasoned issuer, as defined in Rule 405 of the Securities Act. ☐ YES ☒ NO
Indicate by check mark if the Registrant is not required to file reports pursuant to Section 13 or Section 15(d) of the Act. ☐ YES ☒ NO
Indicate by check mark whether the Registrant (1) has filed all reports required to be filed by Section 13 or 15(d) of the Securities Exchange Act of 1934 during the preceding 12 months (or for such shorter period that the Registrant was required to file such reports), and (2) has been subject to such filing requirements for the past 90 days. ☒ YES ☐ NO
Indicate by checkmark whether the registrant has submitted electronically and posted on its corporate website, if any, every Interactive Data File required to be submitted and posted pursuant to Rule 405 of Regulation S-T (§ 232.405 of this chapter) during the preceding 12 months (or for such shorter period that the registrant was required to submit and post such files). ☒ YES ☐ NO
Indicate by check mark if disclosure of delinquent filers pursuant to Item 405 of Regulation S-K is not contained herein, and will not be contained, to the best of Registrant’s knowledge, in definitive proxy or information statements incorporated by reference in Part III of this Form 10-K or an amendment to this Form 10-K. ☐
Indicate by check mark whether the Registrant is a large accelerated filer, an accelerated filer, or a non-accelerated filer. See definition of “accelerated filer and large accelerated filer” in Rule 12b-2 of the Exchange Act. (Check one):
|
☐ Large accelerated filer |
☒ Accelerated filer |
☐ Non-accelerated filer |
☐ Smaller reporting company |
|
|
(Do not check if a smaller reporting company) | ||
Indicate by check mark whether the registrant is a shell company (as defined in Rule 12b-2 of the Exchange Act). ☐ YES ☒ NO
As of July 31, 2016, the last business day of the Registrant’s most recently completed second fiscal quarter, there were 15,763,584 shares of the Registrant’s Class A common stock outstanding and 3,205,831 shares of the Registrant’s Class B common stock outstanding, and the aggregate market value of such shares held by non-affiliates of the Registrant (based on the closing sale price of such shares on the NASDAQ Global Market on July 31, 2016) was approximately $182 million. Shares of the Registrant’s common stock held by each executive officer and director and by each entity that owns 5% or more of the Registrant’s outstanding common stock have been excluded in that such persons may be deemed to be affiliates. This determination of affiliate status is not necessarily a conclusive determination for other purposes.
As of March 31, 2017, there were 15,808,803 shares of the Registrant’s Class A common stock outstanding and 3,210,285 shares of the Registrant’s Class B common stock outstanding.
DOCUMENTS INCORPORATED BY REFERENCE
Items 10 through 14 of Part III incorporate information by reference from the Definitive Proxy Statement for the Registrant’s Annual Meeting of Stockholders to be held on June 13, 2017.
QAD INC.
FISCAL YEAR 2017 FORM 10-K ANNUAL REPORT
TABLE OF CONTENTS
|
|
Page | ||
|
PART I |
|
|
|
|
ITEM 1. BUSINESS |
|
4 |
|
|
ITEM 1A. RISK FACTORS |
|
16 |
|
|
ITEM 1B. UNRESOLVED STAFF COMMENTS |
|
28 |
|
|
ITEM 2. PROPERTIES |
|
28 |
|
|
ITEM 3. LEGAL PROCEEDINGS |
|
28 |
|
|
ITEM 4. MINE SAFETY DISCLOSURES |
|
28 |
|
|
PART II |
|
|
|
|
ITEM 5. MARKET FOR REGISTRANT’S COMMON EQUITY, RELATED STOCKHOLDER MATTERS AND ISSUER PURCHASES OF EQUITY SECURITIES |
|
28 |
|
|
ITEM 6. SELECTED FINANCIAL DATA |
|
31 |
|
|
ITEM 7. MANAGEMENT’S DISCUSSION AND ANALYSIS OF FINANCIAL CONDITION AND RESULTS OF OPERATIONS |
|
32 |
|
|
ITEM 7A. QUANTITATIVE AND QUALITATIVE DISCLOSURES ABOUT MARKET RISK |
|
55 |
|
|
ITEM 8. FINANCIAL STATEMENTS AND SUPPLEMENTARY DATA |
|
56 |
|
|
ITEM 9. CHANGES IN AND DISAGREEMENTS WITH ACCOUNTANTS ON ACCOUNTING AND FINANCIAL DISCLOSURE |
|
56 |
|
|
ITEM 9A. CONTROLS AND PROCEDURES |
|
57 |
|
|
ITEM 9B. OTHER INFORMATION |
|
59 |
|
|
PART III |
|
|
|
|
ITEM 10. DIRECTORS, EXECUTIVE OFFICERS AND CORPORATE GOVERNANCE |
|
59 |
|
|
ITEM 11. EXECUTIVE COMPENSATION |
|
60 |
|
|
ITEM 12. SECURITY OWNERSHIP OF CERTAIN BENEFICIAL OWNERS AND MANAGEMENT AND RELATED STOCKHOLDER MATTERS |
|
60 |
|
|
ITEM 13. CERTAIN RELATIONSHIPS AND RELATED TRANSACTIONS, AND DIRECTOR INDEPENDENCE |
|
60 |
|
|
ITEM 14. PRINCIPAL ACCOUNTANT FEES AND SERVICES |
|
60 |
|
|
PART IV |
|
|
|
|
ITEM 15. EXHIBITS, FINANCIAL STATEMENT SCHEDULES |
|
61 |
|
|
ITEM 16. FORM 10-K SUMMARY |
61 | ||
|
SIGNATURES |
|
91 |
|
NOTE REGARDING FORWARD-LOOKING STATEMENTS
In addition to historical information, this Annual Report on Form 10-K contains forward-looking statements within the meaning of Section 27A of the Securities Act of 1933, Section 21E of the Securities Exchange Act of 1934 and the Private Securities Litigation Reform Act of 1995. Any statements contained herein that are not statements of historical fact should be construed as forward-looking statements, including statements that are preceded or accompanied by such words as “may,” “believe,” “could,” “anticipate,” “projects,” “estimates,” “will likely result,” “should,” “would,” “might,” “plan,” “expect,” “intend” and words of similar meaning or the negative of these terms or other comparable terminology. Forward-looking statements are based on the Company’s current expectations and assumptions regarding its business, the economy and future conditions. A number of risks and uncertainties could cause actual results to differ materially from those expressed or implied in the forward-looking statements. Factors that might cause such a difference include, but are not limited to, those discussed in Item 1A entitled “Risk Factors” which are incorporated herein by reference, and as may be updated in filings we make from time to time with the Securities and Exchange Commission. Readers are cautioned not to place undue reliance on these forward-looking statements, which reflect management’s opinions, expectations and projections only as of the date of this Annual Report on Form 10-K and are subject to risks, uncertainties and assumptions about our business. We undertake no obligation to revise or update or publicly release the results of any revision or update to these forward-looking statements except as required by applicable securities laws. Readers should carefully review the risk factors and other information described in this Annual Report on Form 10-K and the other documents we file from time to time with the Securities and Exchange Commission, including the Quarterly Reports on Form 10-Q to be filed by QAD in fiscal year 2018.
PART I
|
ITEM 1. |
BUSINESS |
OVERVIEW
QAD is a leader in cloud-based enterprise software solutions for global manufacturing companies across the automotive, life sciences, consumer products, food and beverage, high technology and industrial products industries. We offer full-featured, secure and flexible enterprise and supply chain solutions built for global manufacturing companies which can be delivered in the cloud, on premise or via a blended combination of cloud and on premise, where certain sites are on premise and others are in the cloud. Our mission is to provide best-in-class software that enables our customers to operate as an effective enterprise where their business processes are running at peak efficiency and are perfectly aligned to their strategic goals. Our solutions, called QAD Enterprise Applications, enable measurement and control of key business processes and support operational requirements, including financials, manufacturing, demand and supply chain planning, customer management, business intelligence and business process management.
Over 2,000 manufacturing companies have deployed QAD solutions to run their businesses across approximately 4,000 sites globally. Today, our solutions are used by over 300,000 active users, of which our cloud and subscription users have grown to 22,000 from 15,000 in the prior year. We were founded in 1979 and our principal executive offices are located in Santa Barbara, California. Our principal website address is www.qad.com. Our office address is 100 Innovation Place, Santa Barbara, CA 93108. We employ more than 1,700 employees throughout our direct operations in 23 countries across the North America, Europe, Middle East and Africa (“EMEA”), Asia Pacific and Latin America regions.
OUR TARGET VERTICAL MARKETS
We focus our efforts on delivering mission-critical software solutions to enterprise customers in six core vertical markets within global manufacturing – automotive, life sciences, consumer products, food and beverage, high technology and industrial products. Within these vertical markets we focus on 24 segments where our customers can receive the greatest benefit from our solutions. For each segment we offer solutions designed to overcome the business challenges within that segment, based on our in-depth knowledge of the segment and best practices.
Automotive: QAD focuses on the automotive tier supplier segment of companies who must meet critical industry standards such as the Materials Management Operations Guideline/Logistics Evaluation (MMOG/LE) and IATF 16949:2016 (previously ISO/TS 16949). QAD’s automotive-specific processes and built-in industry best practices help automotive tier suppliers reduce costs, mitigate supply chain risk and improve supply chain planning and visibility. Our customer base includes companies serving the global automotive marketplace, especially the tier-1 suppliers in the supply chains of worldwide automotive original equipment manufacturers. We deliver unique capabilities to support the collaboration requirements of the automotive tier suppliers, including the strict quality requirements of Advanced Product Quality Process (“APQP”) and Production Part Approval Process (“PPAP”). Many of our customers use QAD Cloud EDI because it provides a scalable solution which standardizes Electronic Data Interchange (“EDI”) across their global enterprise. QAD Supplier Portal, which allows for electronic communication with other suppliers, is another product commonly used by our automotive customers. QAD also helps customers manage supply chain risk in accordance with MMOG/LE and the emerging requirements of IATF 16949:2016. QAD solutions are in use at many of the market-leading automotive parts companies throughout the world that manufacture a broad range of components used in interiors, electrical components, safety systems, bodies and drivetrains.
Life Sciences: Life sciences manufacturers are dedicated to innovation, product quality and patient safety; however, the regulatory environment, cost pressures and supply chain complexities are challenges. Emerging markets, quality initiatives, and mergers and acquisitions activity also add to the complexity of life sciences manufacturing and distribution. QAD focuses on the following five segments in the life sciences industry: contract manufacturing and packaging; surgical medical devices; orthopedic medical devices; diagnostic medical devices; and pharmaceutical/biotechnology companies. QAD solutions help global life sciences companies manufacture products in accordance with current Good Manufacturing Practices (“cGMP”) and other standards required by regulators around the world. In addition to cGMP, QAD solutions support many business and regulatory processes specific to the life sciences industry, such as automated quality management, supply chain planning and serialization in support of requirements for Unique Device Identification and the Drug Quality and Security Act. Our customers’ products include such items as defibrillators, ventricular assist systems, artificial joints, prescription medications, surgical instruments and packaging for the life sciences industry. QAD’s enterprise applications for life sciences provides our customers with a qualified IT infrastructure as a key building block to help them ensure that they have a solid foundation upon which to base their software validation requirements.
Consumer Products: It is vital for consumer products manufacturers to stay ahead of constant changes as product development and replenishment life-cycles can shrink; supply chains may feel the impact of buying pattern shifts; and manufacturers can face tightening margins. In order to gain share and increase profit, consumer products companies must anticipate and meet customer demand while managing their margins and complying with ever-evolving safety and environmental regulations. QAD focuses on the following four segments in the consumer products industry: household and personal packaged products; consumer electronics; assembled and discrete products; and jewelry. The manufacturing process for those items varies and depends on the nature of the item; however, the fulfillment and distribution requirements have significant commonality. Major retailers manage agile supply chains and are typically very demanding of their suppliers, as they strive to service growing demand from consumers for speed of delivery and variety of products. QAD solutions address the complex replenishment requirements of companies supplying the retail supply chain, including promotional pricing, demand planning, quality compliance and product configuration.
Food and Beverage: Food and beverage manufacturing is complex with constant adjustments to product, packaging and pricing, and a lack of uniformity in the supply chain, which challenges food and beverage manufacturers to excel at inventory and supply chain management. At the same time, they must comply with evolving safety and environmental regulations. QAD focuses on the following five segments in the food and beverage industry: shelf stable bottling, canning and packaging; distilleries, wineries and brewing; frozen foods; creameries and fresh foods; and candy and confections. Our solutions support regulatory and quality initiatives, such as the U.S. Food Safety Modernization Act and hazard analysis and critical control point analysis, which address the management of biological, chemical and physical hazards. Our solutions support the product cycle of the food and beverage industry from raw material production, procurement and handling to manufacturing, distribution and consumption of the finished product. QAD’s software is standards-focused to help companies ensure food safety and meet the regulatory requirements in the global markets where our customers operate. QAD provides solutions for food and beverage companies that manufacture a broad range of products and manage many of the world’s well-known brands.
High Technology: The success of manufacturers in the high tech industry relies on innovation and the ability to manage change. There is constant pressure on margins, fluidity to global supply chains, challenges with cross border shipments, strains on material availability and imperatives around controlling cost. All of these challenges need to be met while complying with standards and industry regulations. QAD solutions are used by many high-technology companies that manufacture a diverse range of products. QAD focuses on the following three segments in the high technology industry: standalone devices and test equipment; batteries, power supplies and lighting; and cable, wiring and connectors. High-tech companies often face the challenges of very complex product structures with a need for traceability of parts and processes throughout their entire supply chain, as well as tight control of engineering changes. Many high-tech companies providing complex systems also face the challenge of managing installation and support of equipment after sale, in addition to managing field engineering resources. A high-tech manufacturer can use QAD’s solutions to configure product based on customers’ input; manufacture and assemble product according to a customized specification; and schedule, install and support equipment throughout its lifecycle.
Industrial Products: Today’s global customers are demanding more configure-to-order, make-to-order, and assemble-to-order products. The modern, agile industrial manufacturer must be responsive and able to deliver with the highest quality and timeliness. Our customers manufacture products as diverse as machine tools; specialist ceramic materials used in aerospace and defense; and equipment used in the oil and gas industries. Fluctuating demand leads to significant challenges in managing the internal supply chain, coordinating the extended vendor ecosystem, controlling costs, ensuring quality, tracking production, and optimizing inventory levels. Companies in this broad vertical market have requirements to maintain many manufacturing methodologies, often within the same enterprise. QAD focuses on the following six segments in the industrial products industry: flexible packaging; engineered materials; contract manufacturing; standalone equipment; remanufacturing; and roll stock and wire cable. Our solutions support multiple manufacturing methodologies in parallel, including lean manufacturing. The need for traceability of materials from source through to the finished product is often important to our customers, and QAD’s capabilities in traceability and serialization support this feature. QAD’s solutions are also used to support our customers’ environmental compliance needs.
Our focus on these six vertical markets gives us a competitive advantage by providing a solution developed specifically for our target customers, without the complexity and distraction of functionality they don’t want and don’t need. While some enterprise applications vendors provide broader solutions built for many industries, our narrow vertical focus allows our customers to implement with fewer configurations and customizations than our competitors require, which we believe typically results in less complex, and therefore lower cost and faster implementations. We leverage our vertical market expertise in research and development to meet specific industry needs: in sales, to understand our customer’s unique requirements; in presales, to demonstrate how these requirements are handled in the software; and in services, to apply best practices in optimization of business processes and implementation of the software. Our options to sell our product in the cloud or as on-premise licenses enable customers operating in multiple countries to choose a deployment option that best meets their unique needs.
QAD SOLUTIONS
QAD products and services support the business processes of global manufacturing companies in our target industries. We continually monitor emerging business requirements and practices as well as regulatory changes and incorporate them into our product and solutions strategies. Our development focus emphasizes user experience. We strive to deliver solutions that offer comprehensive capabilities while being easy to learn and use. Our goal is to make all capabilities that a particular user needs available with only a few clicks, giving our end users significant gains in efficiency as well as making the user experience more enjoyable.
Our Channel Islands program to develop a new user experience with enhanced usability for QAD Enterprise Applications is a new user interface (“UI”) written in HTML5 and accessible to the user with any standard browser. The new UI provides seamless access across desktops and mobile devices and has the ability to co-exist with our existing .NET UI. As part of the initiative to update the user experience, we restructured the underlying architecture of our solutions so the business logic and the user interface are separate layers. All business logic is now addressable through standard, documented application program interfaces (“APIs”), which provide the ability to integrate with third-party applications or to easily change the UI.
One important advantage of the Channel Islands program has been a focus on modularity, providing the ability to upgrade the solution by suite, rather than upgrading the entire solution at one time. This makes upgrades smaller, faster and easier; helping customers stay on the most current version of our software which reduces the gap between their business needs and what our enterprise applications provide. The modularity allows us to improve the efficiency of our cloud operations using a simplified upgrade process. The Channel Islands program also supports the Internet of Things (“IoT”) where machines communicate with machines. An example of the power of the IoT is when our customers’ manufacturing equipment automatically updates our solution when products are completed, increasing accuracy and efficiency for the customer.
Smart phones and tablets continue to play an ever-increasing role in our day-to-day life, and our customers are embracing mobile computing to support more facets of their businesses. QAD delivers components of our solution for a variety of mobile platforms. Currently our mobile specific suite includes a requisition approval solution, a mobile business intelligence solution, mobile browse capability and mobile application monitoring tools to support system administrators. Our mobile browse capability allows users to view, filter and sort all data accessible through QAD browses within QAD Enterprise Applications using mobile devices.
In support of our focus on business process efficiency, we have integrated the ability to generate business process maps for common business processes into our software using the QAD Process Editor tool. This tool simplifies implementations, maps common business processes and facilitates navigation throughout the entire product suite. Within our suite, we have also embedded business process management (“QAD BPM”). QAD BPM allows customers to visualize their business processes; monitor transactional throughput by user, role or stage; and modify those processes to make them more efficient. Using QAD BPM, companies can create business process models, assign task responsibilities, monitor and re-direct workflow, all of which reduce process execution time, improve visibility of active processes, identify bottlenecks and support process improvement.
QAD developed its solutions to allow simple integration with other systems our customers use within their organizations. For example, we enable seamless integration between QAD Enterprise Applications and common browser applications and spreadsheets. QAD solutions also integrate easily with other web applications and web services. Using our Q-Xtend toolset, customers can connect to different software, even when remote, and they can use industry-standard middleware products such as the IBM MQ™ series or the standard connectors built on the Dell Boomi AtomSphere integration platform. Robust APIs along with QAD Automation Solutions provide additional capability for integration.
QAD Enterprise Applications
QAD Enterprise Applications is an integrated suite of software applications, which supports the core business processes of global manufacturing companies, and provides specific functionality to support the requirements of our targeted industries and the geographies in which our customers conduct business. QAD Enterprise Applications allows customers to monitor, control and support their operations, whether operating a single plant or multiple sites, wherever they are located around the world.
QAD Enterprise Applications has strong capabilities for addressing global complexities in customers’ business models, such as compliance with local accounting practices and legislation, as well as internal reporting on global performance. QAD Enterprise Applications includes full support for multiple currencies, multiple languages and complex corporate structures such as multiple companies or divisions.
QAD Enterprise Applications is available on premise, in the cloud and in a blended model combining both of these deployment alternatives by having certain sites on-premise and others in the cloud. Blended deployment enables users to transact easily across business entities with a consistent interface and consistent functionality since our cloud and on-premise technology is compatible. Companies that have chosen the cloud as a strategic direction but who cannot, or do not want to, move all locations at one time, find a blended deployment model allows them to transition to the cloud with less risk. The finance function can view individual business unit results and run consolidations that cross both cloud and on premise sites seamlessly, while other users can transact and view inventory in multiple locations irrespective of whether any specific business entity is operating in the cloud or on premise.
QAD Enterprise Applications is comprised of the following software solutions:
QAD Financials
QAD Financials provides comprehensive capabilities to manage and control finance and accounting processes at a local, regional and global level. The suite supports multi-company, multi-currency, multi-language and multi-tax jurisdictions, as well as consolidated reporting and budgeting controls. These capabilities give cross-functional stakeholders access to financial results, enabling faster, more informed decision making while providing robust internal controls. Enterprise Financials includes IFRS and multi-GAAP support, as well as extensive local tax capture, reporting capabilities and segregation of duties enforcement.
QAD Customer Management
QAD Customer Management enables global manufacturing companies to acquire new customers efficiently, grow revenue through multiple channels and retain customers through superior service and support. QAD Customer Management helps our customers measure the efficacy of marketing campaigns, manage the sales opportunity lifecycle and optimize order and fulfillment processes. QAD Configurator has the ability to create unique products specified to customer requirements, enabling simple and cost effective controls for mass customization of products. The suite includes the ability to centralize sales order entry, including orders for configured items, and to ship the items from any facility or business entity. QAD Customer Self Service provides a web storefront for our customers to transact sales, which is fully and securely integrated with the rest of QAD Enterprise Applications.
QAD Manufacturing
QAD Manufacturing delivers comprehensive capabilities to support manufacturing business processes, from planning through execution, and provides visibility and control of materials and labor. The suite has capabilities in the areas of planning and scheduling, cost management, material control, shop floor control, quality management and reporting in various mixed-mode manufacturing environments. The manufacturing models supported include Discrete, Repetitive, Kanban (particularly relevant in lean manufacturing practices), Flow, Batch/Formula, Process, Co-products/By-products and Configured Products. The system also includes flexible item attributes that customers can use to track lot characteristics or test results. The Lot Trace Workbench provides insight into any products component genealogy and greatly simplifies product recalls. QAD Manufacturing supports companies deployment of business processes consistent with their industry’s best practices. The integration between scheduling, planning, execution, quality and materials allows tight control and simple management of processes.
QAD Automation Solutions
QAD Automation Solutions improves manufacturers’ material transaction processing accuracy and efficiency by aligning QAD Enterprise Applications with material and production processes.
There are two primary components to QAD Automation Solutions:
|
● |
Data Collection captures material and production data through simplified transactions using a mobile device such as a radio frequency (RF) scanner, tablet or a stationary shop floor personal computer or terminal. |
|
● |
Label Printing Services routs and prints labels associated with material and production transactions based on manufacturer, supplier, customer and industry specified formats and rules. |
These capabilities help manufacturers better align their material logistics processes in a timely fashion while ensuring inventory accuracy through process compliance.
QAD Demand and Supply Chain Planning
QAD Demand and Supply Chain Planning (“QAD DSCP”) is a comprehensive group of applications built on a single unified model to fulfill the materials planning and logistics requirements of global companies. QAD DSCP is supported and developed by our DynaSys operating division. This solution set delivers functionality and capabilities that help enterprises optimize their supply chains to enhance customer satisfaction through timely deliveries. Enterprises can align supply and demand to support the delivery of the right product, to the right place, at the right time and at the most efficient cost. The suite utilizes the DynaSys Single Click Collaborative platform, with the entire planning model running in a memory-resident database supporting real-time planning. The suite supports planning for demand, production, procurement, distribution and global sales and operations. Customers have used this solution with data sets that exceed a million SKUs. QAD Demand and Supply Chain Planning addresses both simple and complex networks and customers have the ability to add more advanced functionality as the enterprise grows. Collaborative portals are available for both demand and supply sides to help ensure rapid communication of demand or supply fluctuations and to enable collaborative planning.
QAD Supply Chain Execution
QAD's Supply Chain Execution suite includes tools to support inventory and warehouse management in either simple or complex warehousing environments. For example, the QAD Warehousing tool supports complex warehouse-management techniques such as bulk, batch and wave picking, as well as multiple put away methods including calculations based on required space. It manages reusable packaging and containers to help eliminate waste and reduce costs. Additionally, QAD Enterprise Applications manages consignment inventory for both consignors and consignees, and supports strategic sourcing and purchasing. The system manages distribution requirements planning to optimize and balance inventories at multiple distribution centers which enables quick and cost effective demand fulfillment. QAD offers QAD Supplier Portal and QAD EDI for facilitation of communication and collaboration with members of a supply chain. These two solutions are offered on a subscription basis only.
QAD Transportation Management
QAD markets transportation solutions directly to our existing customers as part of QAD Enterprise Applications, and to the general market through our Precision division. QAD Transportation Management facilitates correct documentation and control for moving shipments across borders. Transportation Management allows companies to manage and optimize outside carriers for shipments including parcel, less than truckload, full truckload and container shipments whether using land, sea or air carriers. Compliance and risk management enables companies to comply with regulations concerning denied parties and controls of dangerous substances.
QAD Service and Support
QAD Service and Support enables exceptional after-sale customer service and support for companies who commission and support complex systems. The integration from customer demand through manufacturing to installation and support provides companies with great efficiencies when managing their business processes. QAD Service and Support handles service calls, manages service queues and organizes mobile field resources. It also provides extensive project management support, helping organizations track materials and labor against warranty and service work; compares actual costs to budget, and generates appropriate invoicing.
QAD Enterprise Asset Management
QAD Enterprise Asset Management (“EAM”) helps companies manage maintenance and installation of capital equipment. The solution supports both planned and unplanned equipment maintenance based on elapsed time or completed quantities. It includes the ability to track calibrations, labor and required parts used for maintenance. In addition, it has project accounting capabilities to plan, track and control detailed project budget and spending data for capital expense projects such as refits or building and commissioning new plants. EAM includes functionality to manage rotable (renewable) inventory. EAM helps manufacturers achieve a balance between having the right equipment available and minimizing their equipment investment. It ensures critical spare parts are on hand as needed and monitors company expense and approval policies with regard to capital plant and equipment.
Action Centers with Embedded Analytics
Action Centers are designed to provide the data and information users need in order to do their jobs efficiently in an easy to grasp visual format. Users can drill down into more detail or take quick action based on the insight the solution provides. Action Centers provide built-in analytics and operational metrics as well as more than 400 browses and nearly 450 reports. All information can be accessed from a tablet to support users who are not at their desk or in the office.
QAD Analytics
QAD Enterprise Applications provides decision makers and company stakeholders with key data to measure performance against company and strategic goals. QAD Analytics helps customers perform complex analyses, make informed decisions and improve performance management by highlighting areas that need improvement and enabling drill down to source data. The QAD Analytics suite consists of multiple analysis and data extraction tools all working in harmony to provide user-defined analysis such as consolidated reporting or reporting by geography, product line or cost center.
The solution consists of QAD Reporting Framework, which provides powerful, yet simple, reporting and real-time visibility with ad hoc inquiries; Operational Metrics, which enables companies to define and monitor key performance indicators and QAD Business Intelligence, which allows for dynamic analysis and trend reporting across multiple data sources. Customers can also access QAD Business Intelligence using mobile devices, which allows users to view, filter and sort all data accessible to QAD Browses using mobile devices.
QAD Enterprise Quality Management
QAD provides enterprise quality management and regulatory compliance solutions to global companies in many market segments, including QAD’s target markets. The suite supports customers’ compliance with industry specific quality standards. In the automotive vertical, QAD’s solution delivers automation of Advanced Product Quality Planning (“APQP”) methodologies, including Production Part Approval Process (“PPAP”), process flow and approvals. In the life sciences vertical, customers benefit from critical functionality supporting corrective and preventative action and non conformance reporting. The suite also features manufacturing quality solutions for audit, risk management, document control, gage calibration, inspection and statistical process control. Our CEBOS division supports and develops QAD’s Enterprise Quality Management suite.
QAD Interoperability
QAD Enterprise Applications uses a services-oriented architecture, allowing customers to easily integrate QAD Enterprise Applications with other non-QAD core business applications. Through our QAD Q-Xtend toolset, we promote open interoperability with comprehensive application program interfaces (“APIs”) and published events. These offer QAD customers a choice of solutions in their operating environments. In addition, we resell the Dell Boomi integration platform as QAD Boomi AtomSphere. This provides a comprehensive platform for managing integrations to many cloud and on premise products, making whole enterprise integration easier for QAD customers.
QAD Internationalization
QAD supports companies that manufacture and distribute their products around the world. When a global company expands its operations, it often needs to accommodate local languages, local accounting standards and local business practices. Operating in different countries also requires access to specific local software, such as that used to interface to banks in their country of operation. QAD supports the requirements of 60 different countries with its internationalization capabilities.
Customer Support and Product Updates Provided via Our Cloud and Maintenance Offerings
Customer support services and product enhancements are provided to our cloud customers as part of their monthly subscription fee and to on-premise customers via our maintenance offering. Customer support services include internet and telephone access to technical support personnel located in our global support centers. Through our support service, we provide the resources, tools and expertise needed to maximize the use of QAD Enterprise Applications. Customers active on maintenance or the cloud are also entitled to receive product upgrades and enhancements on a when-and-if available basis.
As part of our maintenance and cloud offerings, our online support site also provides access to an extensive knowledge database, online training materials, a virtual training environment, remote diagnostics and our software download center. Our support professionals in our global support centers focus on quickly resolving customers’ issues, maintaining optimal system performance and providing uninterrupted service for complete customer satisfaction. In addition, we provide other products, including operational metrics, workbenches and monitoring tools. Customers have access to these products at no additional fee, provided they have a current maintenance or cloud agreement in place with QAD.
Our cloud customers are able to enjoy Internet access to their solutions in a scalable, reliable and secure environment anywhere in the world. This environment is managed by our Cloud Operations group with infrastructure operated by us, but located within third-party data center facilities or from cloud computing platform providers. The cloud operations group is dedicated to supporting our cloud solutions. Located primarily in the U.S. and India, they manage the day-to-day operations of our cloud computing solutions, act as the control point for activities related to elements of the cloud and maintain our cloud environment, including customizations, conversions and upgrades to QAD Enterprise Applications.
Generally, our on-premise customers purchase maintenance when they acquire new licenses and our maintenance retention rate is more than 90%. Our maintenance and other revenue represented 47%, 48% and 48% of our total revenues in fiscal 2017, 2016 and 2015, respectively. Our maintenance revenue is negatively impacted by customers on maintenance converting to our cloud solutions. When maintenance customers convert to the cloud, they no longer contract for maintenance as those support services and unspecified updates are included as a component of the subscription offering. Our cloud revenue represented approximately 17%, 11% and 8% of our total revenues in fiscal 2017, 2016 and 2015, respectively, and our cloud customer retention rate is also in excess of 90%. We track our retention rate of cloud and maintenance by calculating the annualized revenue of customer sites with contracts up for renewal during the period compared to the annualized revenue associated with the customer sites that have canceled during the period. The percentage of revenue not canceled is our retention rate. Conversions to the cloud are not considered cancellations for purposes of the maintenance retention rate calculation.
QAD Global Services
QAD offers professional services including consulting, deployment, training and integration to facilitate adoption of our Enterprise Applications solution and enable customer success.
QAD Global Services engages with our customers across the entire enterprise application life cycle through planning, design, implementation and management. Whether in the cloud or on-premise, our Global Services group assists our customers with initial deployments, upgrades to more current product versions, migration of on-premise deployments to the cloud, conversion and transfer of historical data, ongoing system and process optimization, and user training and education.
QAD’s Global Services group includes 450 consultants located throughout the world, augmented by a global network of certified partners. Our consulting ecosystem spans over 70 countries. QAD consultants and partners are trained on our best practice implementation methodologies and have obtained certifications of proficiency in many areas. We offer a complete portfolio of services, delivered to consistent standards across the globe. Working in tandem with our partners, we support national, multi national and global projects on behalf of QAD customers.
In support of QAD’s vision of all customers becoming Effective Enterprises, QAD has developed a framework of Key Performance Indicators (“KPIs”) used by QAD Global Services to measure pre- and post- implementation performance of business processes and to aid in the diagnosis of opportunities for continuous improvement. The QAD KPI framework is made available to all customers and is monitored using the QAD analytics suite.
QAD’s principal methodology for deployment of solutions is called QAD Easy On Boarding (“EOB”). EOB has been designed to make deployment of QAD solutions on-premise or in the cloud standardized and efficient. EOB features predefined industry process models built into the products themselves as well as implementation guides and scripts, all based on our experience with best practice standards. With EOB, implementation can be faster than more traditional approaches.
QAD Global Services focuses on assisting customers in the following activities:
Implementations and Migrations – QAD Global Services supports customers with the initial implementation of QAD Enterprise Applications. QAD Global Services has particular expertise in global implementations, harnessing the entire QAD Global Services ecosystem to provide local or in country support wherever customers need. QAD Global Services deploys our applications both on-premise and in the cloud. In addition, QAD Global Services has the experience to assist new customers with migration from other enterprise application systems. This service includes data conversions as well as process design change management.
Upgrades – QAD Global Services assists customers in the process of upgrading their QAD Enterprise Applications to the latest version, accelerating time to benefit, increasing new functionality and applying usability best practices.
Conversions – QAD Global Services employs standardized process for converting from on-premise solutions to the cloud.
Integration – QAD Global Services has the expertise and experience to quickly integrate QAD solutions with other systems.
Systems Management – QAD Global Services delivers a range of services to support technical management of systems and performance monitoring for those customers who choose on-premise deployment.
Training and Education – QAD Global Services offers a full range of services leveraging QAD’s learning management system. Users can access multimedia training on all QAD offerings and take advantage of pre-defined learning plans for all of the roles that QAD users typically perform. Global Services also provides customized courses that are taught on-site to meet specific customer needs and are available to end users, IT professionals, department managers, partners and consultants.
Application Management – QAD Global Services is available to manage customer systems and, through our Application Management Services, supports customers’ system management, administration and performance needs.
Business Process Improvement – QAD has developed a range of predefined diagnostic offerings called Q-Scans. QAD Global Services utilizes Q-Scans to engage in highly efficient diagnosis of key business processes and functional areas and provide recommendations to customers for continuous improvement.
Pre-Defined Consulting Engagements – QAD Global Services performs diagnostic and prescriptive consultations that cover many areas including customization, analytics and various areas of compliance such as FDA, MMOG/LE and SOX.
QAD Global Service’s network of employees, consultants and partners knows QAD software best. They diagnose issues preventing businesses from running efficiently and prescribe steps to maximize the benefits of QAD Enterprise Applications. These QAD experts offer what outside consultants cannot - a combination of a deep understanding of the industries in which our customers operate, the in-depth knowledge of functionality of the QAD solution portfolio and the proven experience of helping customers leverage our software to become more Effective Enterprises. QAD Global Services offers a full range of program management, project management, industry consulting and technical services certified in our products and methodologies.
QAD GLOBAL PARTNER NETWORK
QAD establishes strategic relationships with our partners to expand our sales reach, improve our market impact, provide technological advantages and strengthen our strategic position in the industries that we serve. QAD and our partners are constantly evolving, broadening our expertise and our footprint in order to meet the diverse needs of our customers around the world. Today we have approximately 130 companies partnering with us to deliver innovative solutions, services and technology that help to enable our customers to build their Effective Enterprise.
OUR STRATEGY
All aspects of our solutions, from software to services to our customer engagement, are architected to support our vision for the Effective Enterprise where every business process is running at peak efficiency and perfectly aligned to our customers’ strategic goals. In an ever changing world, continuous improvement is a fundamental requirement for achieving this vision. In support of our vision, we focus on providing complete solutions and expertise that help our customers improve the effectiveness of their business processes. In addition, our software is designed to support global regulatory and business practice requirements that enable our customers to satisfy governmental and industry regulations, while incorporating industry best practices and providing real-time visibility and measurement in support of continuous business process improvement initiatives.
We build solutions in 24 specific industry segments across six manufacturing verticals to provide our customers the capabilities they need to run their enterprises effectively without the complexity and excess resource consumption associated with generalist solutions. We focus on those areas, within the segments we target, where we see potential for increased growth due to manufacturing expansion, cloud adoption or emerging requirements that we can address.
Our goal is to enhance our position as a leading provider of cloud-based enterprise applications for global manufacturing companies. The key elements of our strategy, which we believe will support the achievement of our vision and help drive continued growth, are as follows:
Grow Our Cloud Business. We provide full-featured vertically-focused cloud and on-premise solutions which work well together and independently. Cloud is not simply a deployment option; it is a strategic choice that allows our customers to focus on their customers and products without the distraction of administering their enterprise applications or maintaining their infrastructure. We intend to expand our position in the cloud-based applications market by continuing to provide high quality offerings that encompass the enterprise class functionality our customers require. We believe new manufacturing companies, or companies created through divestiture from a larger entity, that do not have an existing legacy enterprise platform are more likely to adopt our cloud computing solutions when choosing and implementing a new enterprise system to run their business. We also believe that QAD Enterprise Applications is well positioned as a full-strength, secure and flexible solution delivered in the cloud to support global manufacturing companies. QAD was named the 2016 Enterprise Cloud Company of the Year in the Stratus Awards for cloud computing conducted by the Business Intelligence Group. The Stratus Awards identify and acknowledge distinguished companies, products and people offering unique solutions that take advantage of cloud technologies.
Grow our customer base and expand our footprint within existing customers. We believe there is substantial opportunity to increase the presence of cloud-based enterprise solutions within our global manufacturing customer base and that our expertise in the core vertical markets we serve is well suited to meet the growing needs of global manufacturing companies. Our industry-specific solutions, combined with our cloud and on-premise deployment options, enable our manufacturing businesses to continue to manage their own growth in the manner that best meets their needs and strategy. Within our current customer base, opportunities exist to deliver value through a wider use of the QAD product portfolio to address business challenges. With over 2,000 customers across our core vertical markets and over 300,000 active users, we have many opportunities to increase revenue and deliver additional value to our existing installed base. As the global manufacturing economy grows, our existing customers' businesses will grow and our solutions are designed to help them manage this growth in an effective and efficient manner. We intend to continue to invest aggressively in our direct sales and marketing capabilities to highlight these advantages for prospective new customers.
Continued product development and rapid response to change. Our ability to successfully compete depends in part on our continuous product development and rapid introduction of new technologies, features and functionality. Manufacturers are facing a swiftly changing business environment fueled by exponential growth in underlying technologies. Industry 4.0, IoT, Artificial Intelligence (AI), Additive Manufacturing (3D Printing) and Digital Transformation are all examples of evolving technologies that can impact the markets in which our customers operate. Adopting these technologies, as well as responding to changes in customer demands and the competitive landscape, can require changes in our customer's business processes. Delivering agile systems that support changes in business process are a key focus of our Channel Islands program. The technologies that we have developed to provide this flexibility include: Personalization, Embedded Analytics, Modularization and Extensibility. We are committed to continuous investment in product development to ensure our products have the necessary capabilities to meet the needs of our global customers and enhance our competitive position in the vertical markets we serve. In particular, as our industry has shifted from on-premise to cloud-based solutions, we have expanded our cloud offerings to provide our customers with more value and flexibility.
Focus on global manufacturing and leverage expertise within key vertical markets. Many manufacturers operate globally, requiring a provider that can tailor solutions to the unique needs of their markets, deliver local and global services resources and support local languages. Solutions must be cost effective and easy to implement and use. Our solutions offer many benefits to customers with global operations, including capabilities that support operations in multiple geographies with a variety of languages, and currencies, as well as compliance with complex local regulations and business practices. Our existing global footprint is a key leverage point for meeting these needs, utilizing offices, personnel and partnerships in many countries around the world. We also employ staff with specific knowledge and experience in the industries in which our customers operate. We provide our solutions to 24 segments across six vertical manufacturing markets and we actively participate in several leading industry associations and pride ourselves on the deep expertise of our staff. Our industry knowledge continues to deepen through regular interaction with our customers. This collective experience and customer interaction allows QAD to develop solutions with specific capabilities that address our customers’ needs.
Enhance customer experience to deliver continuous value and maximize customer retention. Through award winning customer engagement, recognized by Consumer Goods Technology Magazine for the 4th straight year, QAD delivers a continuous improvement process to ensure continued alignment for the long term between our customers’ business strategy, people, processes, and best practices and the technology that supports it. We strive to engage with every customer every year, frequently conducting reviews of their business processes and presenting opportunities for improvement. Our deep vertical segment focus and strong, ongoing customer relationships drive continuous development of industry-specific functionality. As a result, we have maintained retention rates in excess of 90% annually.
TECHNOLOGY
QAD Enterprise Applications was designed to achieve our vision for global manufacturing companies to effectively run their business processes at peak efficiency, in alignment with their company strategic goals. We have chosen the best technologies to achieve our vision, focusing on user experience, integration, business services, analytics, databases and deployment flexibility. We embrace ‘openness’ as a core principle of our designs, aiming to allow customers freedom of choice with regard to device, operating systems and hardware platforms when deploying their software applications. The core of QAD Enterprise Applications is built on a services-oriented architecture, which allows QAD Enterprise Applications’ components to communicate with one another through industry-standard messaging techniques like Representation State Transfer services. This allows customers to exploit the full benefit of QAD’s open architecture for their businesses.
QAD Enterprise Applications core business logic has been developed in the OpenEdge programming environment and relational database provided by Progress Software Corporation. Our solutions also include components of Oracle’s Java environment for providing web, mobile and integration infrastructure. We offer a rich user experience using HTML5 technologies, iOS, Android and Microsoft .NET frameworks. QAD Enterprise Applications supports most commercial operating systems, including most common LINUX-derived operating systems, Windows Server System and most proprietary versions of UNIX including Hewlett Packard’s HP/UX and IBM’s AIX. Where practical, QAD uses open industry standards to collaborate and integrate QAD Enterprise Applications with other systems.
QAD’s enterprise architecture provides significant flexibility for global companies in deploying QAD Enterprise Applications. Our enterprise architecture allows companies to separate the legal structure of their business from physical operating locations or to separate both of these from the software instances and computer hardware that support them. With QAD enterprise architecture, customers can choose which sites are a part of which companies, which sites are supported on any instance of the application, or which sites operate as one instance. Customers can also choose centralized, decentralized or hybrid computing architectures with parts of their enterprise running from both central resources and local resources.
QAD combines our technologies to provide a comprehensive cloud solution for our customers. Our cloud architecture encompasses infrastructure provisioning and application deployment, management, monitoring and security; providing a world class development operations practice built around Information Technology Infrastructure Library standards. Our cloud delivery centers are certified under the ISO 9001:2008 standard for quality management, the ISO 20,000:2011 standard for service management (SMS), the ISO 27001:2013 standard for information security management (ISMS), the FDA 21 CFR Part 11 requirements for electronic records and signatures, and the SSAE 16 (SOC I-Type II) requirements for reporting and compliance controls.
PRODUCT DEVELOPMENT
The technology industry is characterized by rapid technological change in computer hardware, mobile devices, operating systems, applications, and the rapid expansion of the IoT. In addition, our customers and the industries that we support are continually evolving, as do their expectations of the performance and user experience of our software. We maintain a global research and development organization that provides new product enhancements to the market on a semiannual basis in order to swiftly respond to these changes.
The enterprise software industry is continuing its transition from selling on-premise licenses to selling cloud-based solutions which include more integration to IoT devices, social, mobile computing and platform services capabilities. In fiscal 2017, we continued to transition our business model to cloud-based offerings and we rolled out of our latest user experience in the sales, service and purchasing areas of the product suite to our cloud customers. Our latest release supports mobile applications for decision making and providing insights into the health of our customers businesses. This offering is designed to give our customers even more value and flexibility to use our product suite with a secure browser from anywhere the user has connectivity. We take security very seriously and with every new release we have our software verified by an outside firm through software scanning and penetration testing to ensure we have no security breaches. With our web services and rich set of API’s, our customers can connect our product suite to other applications with ease.
We dedicate considerable technical and financial resources to research and development to continually enhance and expand our product suite in support of the vertical markets that we serve. For example, in fiscal 2017, we continued our internationalization program in support of the expansion of our global customers. As we ended fiscal 2017 we were supporting our customers in over 70 countries with a single solution managed and maintained by QAD’s research and development organization. We added functionality in all areas of the product and have introduced a new Revenue Recognition Module in support of new accounting standards, ASC 606 and IFRS 15.
We operate a global research and development organization comprised of 380 R&D employees located in offices in the United States, India, China, Ireland, Australia, France, Belgium, Spain, Brazil and Great Britain. Our research and development expenses totaled $43.6 million, $41.2 million and $42.3 million in fiscal years 2017, 2016 and 2015, respectively. Our software is primarily developed internally; however, we also use independent firms and contractors to perform some of our product development activities when we require additional resources or specific skills or knowledge. All outside development is managed by our internal Research and Development organization. As needed, we acquire products or technology developed by others by purchasing or licensing products and technology from third parties. We continually review these investments in an effort to ensure that we are generating sufficient revenue or gaining a competitive advantage to justify their costs. We routinely translate our product suite into fourteen languages and through our internationalization program we support mandatory governmental regulations and reporting requirements for over 70 countries. This is all accomplished through a single offering for our customers in the cloud or on premise, allowing them to run their businesses using a consistent core business model with a deployment model of their choice.
We plan to continue to manage significant product development operations internationally over the next several years. We believe that our ability to conduct research and development at various locations throughout the world allows us to optimize product development, lower costs, and integrate local market knowledge into our development activities. We continually assess the significant costs and challenges, including intellectual property protection, against the benefits of our international development activities.
DIRECT AND INDIRECT SALES
QAD sells its products and services through direct and indirect sales channels located throughout the regions of North America, Latin America, EMEA and Asia Pacific. Each region leverages global standards and systems to enhance consistency when interacting with global customers. Additionally, we have a global strategic accounts team, which is responsible for managing QAD’s largest global customers across regions.
Our direct sales organization includes approximately 70 commissioned sales people. Incentive pay is a significant portion of the total compensation package for our sales staff. We continually align our sales organization and business strategies with market conditions to maintain an effective sales process. We cultivate the industries we serve within each territory through marketing, local product development and sales training.
Our indirect sales channel consists of approximately 40 distributors and sales agents worldwide. We do not grant exclusive rights to any of our distributors or sales agents. Our distributors and sales agents primarily sell independently to companies within their geographic territory, but may also work in conjunction with our direct sales organization. We also identify global sales opportunities through our relationships with implementation service providers, hardware vendors and other third parties.
MARKETING
Our marketing strategy is to differentiate our offering by focusing on our role in providing value by helping our customers achieve the vision of the Effective Enterprise. Our main marketing objective is to leverage the measurable success in business outcomes our customers have achieved to increase awareness and drive leads. We do this by openly and consistently communicating with QAD customers, prospects, partners, investors and other key audiences. Our primary marketing activities include: press and industry analyst relations to garner third-party validation and generate positive coverage for our company, offerings and value proposition; user conferences and events, such as Explore, as well as participation in other industry events, to create customer and prospect awareness; content marketing and engagement on social channels like Facebook, Twitter, LinkedIn and YouTube; search engine optimization, retargeting and pay per click advertising to drive traffic to our web properties; web site development and gamification to engage and educate prospects and generate interest through product information and demonstrations, case studies, white papers, and marketing collateral; customer testimonials, references, and referrals; and sales tools and field marketing events to enable our sales organization to more effectively convert leads into customers.
We recognize the changing buying dynamics and are focused on engaging with prospects early in the sales cycle in order to help set the buying criteria and specifications in a way that uniquely leads to QAD. We seek to accelerate prospects through the buying journey by answering questions and removing roadblocks.
COMPETITION
Every aspect of our business is affected by strong competition from both enterprise software application vendors and cloud computing application services providers. The markets for our on-premise and cloud offerings continue to rapidly evolve due to constant changes in technology. New products and services are frequently introduced as new companies emerge and expand. Our customers demand greater performance and reliability with lower complexity. Cost of implementation or conversion to the cloud and cost of ongoing maintenance are constant concerns when our customers make decisions about how best to deploy their resources.
In the on-premise space, we compete primarily with larger enterprise application vendors, such as SAP, Oracle and Infor, who hold significant market share in the traditional marketplace. These companies have considerable financial resources and name recognition and have established broad market solutions by developing applications targeted at many industries, not just manufacturing. They often focus heavily on positioning their size as an advantage. We typically differentiate against these companies based on the specific industry focus of our solutions as well as our customer focus. Internationally, we face competition from local companies, as well as the large enterprise application competitors, many of which have products tailored for those local markets.
In addition, our industry has shifted focus from on-premise to cloud and mobile computing. Most enterprise application vendors today have some focus on cloud solutions, in addition to on-premise sales, which creates an environment in which we face competition from a variety of vendors that address one or more of our applications. As a result, our cloud solutions compete with both large software vendors and cloud computing application service providers. Smaller cloud computing vendors have so far targeted the lower end of the manufacturing supply chain market where companies operate in a single plant or single currency environment focusing mainly in the U.S. domestic market. Adding to this, other vendors that provide services in different markets may develop solutions in our target markets and some potential customers may elect to develop their own internal solutions.
We believe the key competitive factors in our markets are:
|
● |
Customer focus |
|
● |
Customer outcomes |
|
● |
Flexibility to meet changing business requirements |
|
● |
Total cost of ownership |
|
● |
Performance and reliability |
|
● |
Security |
|
● |
Solution breadth and functionality |
|
● |
Technological innovation |
|
● |
Usability |
|
● |
Ability to tailor and customize series for a specific company, vertical or industry |
|
● |
Compatibility between products and services deployed within on-premise IT environments and public cloud IT environments |
|
● |
Speed and ease of deployment, use and maintenance; and |
|
● |
Financial resources and reputation of the vendor. |
We believe that we compete favorably on the basis of these factors. Our ability to remain competitive will depend on our efforts in the areas of product development and sales, services and support operations.
EMPLOYEES
As of January 31, 2017, we had 1,710 full-time employees, including 810 in support, subscription and professional services, 380 in research and development, 300 in sales and marketing and 220 in administration. Generally, our employees are not represented by collective bargaining agreements. However, certain employees in our Netherlands, France and Belgium subsidiaries are represented by statutory works councils as required under local law. Employees of our Brazilian subsidiary are represented by a collective bargaining agreement with the Data Processing Union.
INTELLECTUAL PROPERTY
We rely on a combination of trademark, copyright, trade secret and patent laws in the United States and other jurisdictions, as well as confidentiality procedures and contractual provisions to protect our proprietary technology and our brands and we maintain programs to protect and grow our rights. We also enter into confidentiality and proprietary rights agreements with our employees, consultants and other third parties and control access to software, services, documentation and other proprietary information.
SEASONALITY
Our fourth quarter has historically been our strongest quarter for new business and maintenance renewals. For a more detailed discussion, see the “Seasonal Nature of Deferred Revenue, Accounts Receivable and Operating Cash Flow” discussion in Management’s Discussion and Analysis.
SEGMENT REPORTING
We operate in a single reporting segment. Geographical financial information for fiscal years 2017, 2016 and 2015 is presented in Note 12 within the Notes to Consolidated Financial Statements included in Item 15 of this Annual Report on Form 10-K.
AVAILABLE INFORMATION
Our Annual Report on Form 10-K, Quarterly Reports on Form 10-Q, Current Reports on Form 8-K and amendments filed or furnished pursuant to Section 13(a) or 15(d) of the Securities Exchange Act of 1934, as amended, are available free of charge on our website at www.qad.com, as soon as reasonably practicable after such reports have been electronically filed or otherwise furnished to the Securities and Exchange Commission. We are not including the information contained on our website as part of, or incorporating it by reference into, this annual report on Form 10-K.
|
ITEM 1A. |
RISK FACTORS |
The environment in which we operate involves significant risks and is subject to factors beyond our control. You should consider the risk factors described below before investing in our stock as such risks may have a material adverse effect on our business, results of operations and financial condition and could cause the price of our stock to decline. Please note that the risk factors described below are not exhaustive.
Risks associated with our cloud service offerings
Defects and disruptions in our services could diminish demand for our services and subject us to liability.
Our cloud service offerings are complex and incorporate a variety of hardware and proprietary and third-party software, and may have errors or defects that could result in unanticipated downtime for our customers and harm to our reputation and our business. We have from time to time found defects in our services and new defects may be discovered in the future, especially in connection with the integration of new technologies and the introduction of new services. As a result, we could lose future sales and existing customers could elect to cancel or make warranty or other claims against us and potentially expose us to the expense and risk of litigation.
Our revenue and profitability will be adversely affected if we do not properly manage our cloud service offerings.
The pricing and other terms of some of our cloud agreements require us to make estimates and assumptions at the time we enter into these contracts that could differ from actual results. Early termination, increased costs or unanticipated delays could have a material adverse effect on our profit margin and generate negative cash flow. Further, if we experience delays in implementing new cloud customers (whether due to product defects, system complexities or other factors) then customers may delay the deployment of additional users and sites, which could adversely affect our revenue growth. If we fail to meet our system availability commitments or other customer obligations then we may be required to give credits or refund fees, and we may be subject to litigation and loss of customer business. For example, if we were to miss our system availability commitments then we are obligated under our customer contracts to issue one day’s credit against future fees for each hour of system unavailability. We expend significant resources to improve the reliability and security of our cloud offerings and the cost of these investments could reduce our operating margins.
Our cloud retention rate is dependent upon a number of factors that may impact our ability to accurately predict growth in our cloud business.
Our cloud customers typically enter into subscription agreements with a term of 12 to 60 months. Our customers have no obligation to renew their subscriptions after the expiration of their initial subscription period, and some customers may elect not to renew, or may elect to renew at a lower subscription level. Growth in our cloud business may be affected by our ability to maintain high retention rates and sell additional features and services to our current customers, which could depend on a number of factors, including customers’ satisfaction with our products and services, the prices of our offerings and general economic conditions. We cannot provide assurance that our subscriptions will be renewed at the same or higher levels of service, for the same number of users or for the same duration of time, if at all, or that we will be able to accurately predict future customer retention rates. If our customers do not renew their subscriptions or if they renew on terms less favorable to us, the rate at which our cloud business grows may decline and our revenue may be reduced.
We rely on third-party hosting and other service providers.
We currently serve our cloud customers from third-party data center hosting facilities located in the United States and other countries. We do not control the operation of any of these facilities, and they are vulnerable to damage or interruption from earthquakes, floods, fires, power loss, telecommunications failures and similar events. They may also be subject to breaches of computer hardware and software security, break-ins, sabotage, intentional acts of vandalism and similar misconduct. Despite precautions taken at these facilities, the occurrence of a natural disaster or an act of terrorism, a decision to close the facilities without adequate notice or other unanticipated problems at these facilities could result in lengthy interruptions in our service. Even with our disaster recovery precautions, our services could be interrupted. Any loss or interruption of these services could significantly increase our expenses and/or result in errors or a failure of our services which could adversely affect our business. In addition, these vendor services may not continue to be available at reasonable prices or on commercially reasonable terms, or at all.
We may be exposed to liability and loss from cyber security breaches.
Our cloud services involve the storage and transmission of customers’ proprietary information, and security breaches could expose us to a risk of loss of this information, litigation and possible liability. Security breaches may also include “denial-of-service” attacks, which can potentially disrupt our operations and our customers’ operation. Security measures may be breached in numerous ways, including remote or on-site break-ins by computer hackers, disgruntled employees or employee error during transfer of data to additional data centers or at any time, and result in unauthorized access to our own and our customers’ data, intellectual property and other confidential business information. Additionally, third parties may attempt to induce employees or customers into disclosing sensitive information such as user names, passwords or other information in order to gain access to our own and our customers’ data, intellectual property and other confidential business information. Because the techniques used to obtain unauthorized access, or to sabotage systems, change frequently and generally are not recognized until launched against a target, we may be unable to anticipate these techniques or to implement adequate preventative measures. A security breach could result in a loss of confidence in the security of our service, damage our reputation, disrupt our business, lead to legal liability and severely and potentially irreparably impact our business.
Our solutions could be used to collect and store personal information of our customers’ employees or customers, and therefore privacy concerns could result in additional cost and liability to us or inhibit sales of our solutions.
Regulatory focus on privacy issues continues to increase and worldwide laws and regulations concerning the handling of personal information are expanding and becoming more complex. Many federal, state and foreign government bodies and agencies have adopted, or are considering adopting, laws and regulations regarding the collection, use, disclosure and retention of personal information. These and other requirements could reduce demand for our products and solutions or restrict our ability to store and process data or, in some cases, impact our ability to offer our products and solutions in certain locations or our customers' ability to deploy our solutions globally. This impact may be more significant in countries with legislation that requires data to remain localized “in country”, as this could require us or our customers to establish data storage in other jurisdictions or apply local operational processes that are difficult and costly to integrate with global processes.
Internationally, virtually every jurisdiction in which we operate has established its own data security and privacy legal framework with which we or our customers must comply, including the Data Protection Directive established in the European Union and the Federal Data Protection Act passed in Germany. The costs of compliance with such international laws, regulations and standards may limit the use and adoption of, and reduce overall demand for, our solutions, lead to significant fines, penalties or liabilities for noncompliance, or slow the pace at which we close sales, thereby harming our business.
The market for cloud services may not develop as quickly as we expect.
The market for enterprise cloud computing application services is not as mature as the market for traditional enterprise software, and it is uncertain whether these services will achieve and sustain high levels of demand and market acceptance. Our success will depend on the willingness of customers to increase their use of enterprise cloud computing application services in general, and for enterprise applications in particular. Some enterprises may be unwilling to use enterprise cloud computing application services because they have concerns regarding security risks, international transfers of data, evolving regulation, government or other third-party access to data, use of outsourced services providers, and unwillingness to abandon past infrastructure investments. If the market for enterprise cloud computing application services does not evolve in the way we anticipate or if customers do not recognize the benefits of our cloud solutions over traditional on-premise enterprise software products, and as a result we are unable to increase sales of subscriptions to our cloud offerings, then our revenues may not grow or may decline and our operating results would be harmed.
Our focus on cloud services may result in the loss of other business opportunities and negatively impact our revenue growth.
We have focused our sales force, management team and other personnel toward growing our cloud business. This strategic direction and redirection of resources could potentially result in the loss of sales opportunities in our traditional license, maintenance and services businesses. If our cloud business does not grow in accordance with our expectations and we are not able to cover the shortfall with other sales opportunities, then our business could be harmed. Although the subscription model used for our cloud business is designed to create a recurring revenue stream that is more predictable, the shift to this model may reduce our license sales, spread revenue over a longer period and negatively affect future license, maintenance and services revenue.
Risks associated with rapid technological change and complexity
The market for our products and services is characterized by rapid technological change.
Customer requirements for products can change rapidly as a result of innovation or change within the computer hardware and software industries, the introduction of new products and technologies and the emergence of, adoption of, or changes to, industry standards. Our future success, including our cloud service offerings, will depend upon our ability to continue to enhance our current product line and to develop and introduce new products and services that keep pace with technological developments, satisfy increasingly sophisticated customer requirements, keep pace with industry and compliance standards and achieve market acceptance. Our failure to successfully develop or acquire and market product enhancements or new products could have a material adverse effect on our business. Developing software and cloud offerings is expensive. We will continue to make significant investments in research and development, and we may not realize significant new revenue from these investments for several years, if at all.
New software releases and enhancements may adversely affect our software sales.
The actual or anticipated introduction of new products, technologies and industry standards can render existing products obsolete or unmarketable or result in delays in the purchase of those products. Significant delays in launching new products may also jeopardize our ability to compete. Failure by us to anticipate or respond to developments in technology or customer requirements, significant delays in the introduction of new products or failure by us to maintain overall customer satisfaction could have a material adverse effect on our business.
Services engagements are increasingly complex and pose additional risks.
Services engagements may involve increased technological complexity, customer customization requests and other challenges, including in connection with our cloud environments, and demand a significant number of specialized technical resources. Our failure to successfully address these issues could have a material adverse effect on our business.
Changes in laws and regulations related to the Internet may negatively impact our business.
Federal, state or foreign government bodies or agencies have in the past adopted, and may in the future adopt, laws or regulations relating to Internet usage. Changes in these laws or regulations could require us to modify our applications in order to comply with these laws or regulations. In addition, government agencies or private organizations may begin to impose taxes, fees or other charges for accessing the Internet or commerce conducted via the Internet. These laws or charges could limit the growth of Internet-related commerce or communications, or negatively impact demand for Internet-based applications such as ours.
Risks associated with our revenue, expenses and pricing
Because of significant fluctuations in our revenue, period-to-period comparisons of our revenue or profit may not be meaningful.
Our quarterly and annual operating results have fluctuated in the past and may do so in the future. Such fluctuations have resulted from the seasonality of our customers’ manufacturing businesses and budget cycles and other factors. Moreover, there can be no assurance that our revenue will grow in future periods or that we will be profitable on a quarterly or annual basis.
A significant portion of our revenue in any quarter may be derived from a limited number of large, non-recurring license sales.
We may experience large individual license sales, which may cause significant variations in license fees being reported on a quarterly basis. We also believe that the purchase of our products is discretionary and may involve a significant commitment of a customer’s capital resources. Therefore, a downturn in any significant customer’s business could have a significant adverse impact on our revenue and profit. Further, we have historically recognized a substantial portion of our license revenue from sales booked and shipped in the last month of a quarter and, as a result, the magnitude of quarterly fluctuations in license fees may not become evident until the end of a particular quarter. Our revenue from license fees in any quarter is substantially dependent on orders booked and shipped in that quarter. We are unlikely to be able to generate revenue from alternative sources if we discover a shortfall near the end of a quarter.
Our financial forecasts are subject to uncertainty to the extent they are based on estimated sales forecasts.
Our revenues, and particularly our new software license revenue, are difficult to forecast, and, as a result, our financial forecasts are subject to uncertainty. Specifically, our sales forecasts are based on estimates that our sales personnel make regarding the likelihood of potential sales, including their expected closing date and fee amounts. If these estimates are inaccurate then our financial forecasts may also be inaccurate.
The margins in our services business may fluctuate.
Services revenue is dependent upon the timing and size of customer orders to provide the services, as well as upon our related license and subscription sales. In addition, certain engagements may involve fixed price arrangements and significant staffing which require us to make estimates and assumptions at the time we enter into these contracts. Variances between these estimates and assumptions and actual results could have an adverse effect on our profit margin and generate negative cash flow and negative services margins. To the extent that we are not successful in securing orders from customers to provide services, or to the extent we are not successful in achieving the expected margin on such services, our results of operations may be adversely affected.
The margins in our cloud service offerings may fluctuate.
Our cloud service offerings may involve fixed price arrangements, fixed and up-front costs and significant staffing which require us to make estimates and assumptions at the time we enter into these contracts. Variances between these estimates and assumptions and actual results could have an adverse effect on our profit margin and/or generate negative cash flow. To the extent that we are not successful in securing orders from customers to provide cloud services, or to the extent we are not successful in achieving the expected margin on such solutions, our results may be adversely affected.
Because we recognize revenue from cloud services over the term of the subscription, downturns or upturns in new business may not be immediately reflected in our operating results.
We generally recognize revenue from customers ratably over the terms of their subscription agreements. As a result, most of the revenue we report in each quarter is the result of subscription agreements entered into during previous quarters. Consequently, a decline in new or renewed subscriptions in any one quarter may not be reflected in our revenue results for that quarter. Any such decline, however, will negatively affect our revenue in future quarters. Accordingly, the effect of significant downturns in sales and market acceptance of our service, and potential changes in our attrition rate may not be fully reflected in our results of operations until future periods. Our subscription model also makes it difficult for us to rapidly increase our revenue through additional sales in any period, as revenue from new customers must be recognized over the applicable subscription term.
A significant portion of our revenue is derived from maintenance renewals with our existing installed base of customers.
Significant portions of our maintenance revenues are generated from our installed base of customers. Maintenance and support agreements with these customers are traditionally renewed on an annual basis at the customer’s discretion, and there is normally no requirement that a customer renew or that a customer pay new license or service fees to us following the initial purchase. Further, it is our strategy to convert existing customers to our cloud services offering, which, if successful, will reduce maintenance renewals. If our existing customers do not renew their maintenance agreements or fail to purchase new user licenses or product enhancements or additional services at historical levels, our revenues and results of operations could be adversely affected.
Our maintenance retention rate is dependent upon a number of factors such as our ability to continue to develop and maintain our products, our ability to continue to recruit and retain qualified personnel to assist our customers, and our ability to promote the value of maintenance for our products to our customers.
Our maintenance retention rate is also dependent upon factors beyond our control such as technology changes and their adoption by our customers, budgeting decisions by our customers, changes in our customers’ strategy or ownership and plans by our customers to replace our products with competing products. If our maintenance retention rate were to decrease, our revenue and results of operations would be adversely affected.
We encounter pressure to make concessions on our pricing and pricing models.
We are occasionally obliged to offer deep discounts and other favorable terms in order to match or exceed the product and service offerings of our competitors. If we do not adapt our pricing models to reflect changes in customer demand, for example, changes resulting from rapid technological advances leading to alternative hosting and cloud service delivery offering, our revenues could decrease. Further, broad-based changes to our pricing models could adversely affect our revenues and operating results as our sales force implements, and our customers and accounting practices adjust to, the new pricing models.
We may have exposure to additional tax liabilities.
As a multinational organization, we are subject to income taxes as well as non-income taxes in the United States and in various foreign jurisdictions. Significant judgment is required in determining our worldwide income tax provision and other tax liabilities. Although we believe that our tax estimates are reasonable, the final determination of tax audits or tax disputes may differ from what is reflected in our historical income tax provisions and accruals.
Our tax rate could be adversely affected by several factors, many of which are outside of our control, including:
|
|
• |
Changes in jurisdictional revenue mix; |
|
|
• |
Changing tax laws, regulations and interpretations thereof; |
|
|
• |
Changes in tax rates; |
|
|
• |
Changes to the valuation allowance on deferred tax assets; and |
|
|
• |
Assessments and any related tax, interest or penalties. |
If we are deemed to owe additional taxes, our results of operations may be adversely affected.
We report our results based on the amount of taxes owed in the various tax jurisdictions in which we operate.
Periodically, we may receive notices that a tax authority in a particular jurisdiction believes that we owe a greater amount of income tax than we have reported, in which case we may engage in discussions or possible dispute resolutions with these tax authorities. If the ultimate determination of our income taxes owed in any of these jurisdictions is for an amount in excess of the tax provision we have recorded or reserved for, our operating results, cash flows, and financial condition could be adversely affected. We are also subject to non-income taxes, such as payroll, sales, use, value-added, net worth, property and goods and services taxes, in the United States and in various foreign jurisdictions. Audits or disputes relating to non-income taxes may result in additional liabilities that could negatively affect our operating results, cash flows and financial condition.
Our personnel restructurings may incur significant expense and be disruptive.
We have in the past restructured our workforce on a company-wide, business function or geographic basis in connection with strategic changes, cost containment and other purposes. Such restructurings, and in particular reductions in the workforce, may result in significant severance and other expenses and may also reduce productivity.
Initiatives to upgrade our internal information technology systems involve risks which could disrupt our operations, increase our costs or harm our business.
We rely on our internal information technology systems for development, marketing, support, sales, accounting and financial reporting and other operations. We regularly implement business process improvements to optimize the performance of these systems. Such improvements require significant capital investments and personnel resources. Difficulties in implementation could disrupt our operations, increase our costs or otherwise harm our business. In particular, we are in the process of implementing upgrades to our internal information technology systems supporting financial operations, which we expect will have a pervasive impact on our business processes and information systems across a significant portion of our operations. As a result, we may experience significant changes in our operational processes and internal controls as our implementation progresses. If we are unable to successfully implement these upgrades, including harmonizing our systems, processes and data, our ability to conduct routine business functions could be negatively impacted and significant disruptions to our business could occur. In addition, such difficulties could cause us to incur material unanticipated expenses, including additional costs of implementation or costs of conducting business, or result in errors and delays in invoicing customers, collecting cash, paying vendors and financial reporting.
Risks associated with our sales cycle
Our products involve a long sales cycle and the timing of sales is difficult to predict. Because the licensing or subscription of our primary products generally involves a significant commitment of capital or a long-term commitment by our customers, the sales cycle associated with a purchase of our products is generally lengthy.
This cycle varies from customer to customer and is subject to a number of significant risks over which we have little or no control. The evaluation process that our customers follow generally involves many of their personnel and requires complex demonstrations and presentations to satisfy their needs. Significant effort is required by us to support this approach, whether we are ultimately successful or not. If sales forecasted for a particular quarter are not realized in that quarter, then we are unlikely to be able to generate revenue from alternative sources in time to compensate for the shortfall. As a result, a lost or delayed sale could have a material adverse effect on our quarterly and annual operating results.
Risks associated with our solutions
We may experience defects in our solutions.
Our solutions, including licensed software, cloud services and other services, may contain defects, including security flaws, especially when first introduced or when new versions are released. The detection and correction of defects can be time consuming and costly. Defects in our solutions, including third-party software, could affect the ability of our products to work with other hardware or software products. Defects could delay the development or release of new products or new versions of products and could adversely affect market acceptance of our products and our ability to conduct our cloud operations. Defects may also impair our ability to complete services implementations on time and within budget. Customers who rely on our solutions for applications that are critical to their businesses may have a greater sensitivity to such defects than customers for software products generally. Defects could expose us to product liability, performance and warranty claims as well as harm our reputation, which could adversely impact our future sales of offerings.
Dependence on third-party suppliers
We are dependent on Progress Software Corporation.
The majority of QAD Enterprise Applications are written in a programming language that is proprietary to Progress Software Corporation, or “Progress.” These QAD Enterprise Applications do not run within programming environments other than Progress and therefore our customers must acquire rights to Progress software in order to use these QAD Enterprise Applications. We have an agreement with Progress under which Progress licenses us to distribute and use Progress software related to our products. This agreement remains in effect unless terminated either by a written ten-year advance notice or due to a material breach that is not remedied. If Progress were to provide notice that it was terminating its agreement with us, this could have a material adverse effect on our business and prospects.
Our success is dependent upon our continuing relationship with Progress.
Our success is also dependent upon Progress continuing to develop, support and enhance its programming language, its toolset and its database, as well as the continued market acceptance of Progress products. A change in Progress’ control, management or direction may adversely impact our relationship with Progress and our ability to rely on Progress products in our business. We have in the past, and may in the future, experience product release delays because of delays in the release of Progress products or product enhancements. Any of these delays could have a material adverse effect on our business. In its January 16, 2017 report of year end results Progress announced a new strategic plan involving an executive departure and a 20% reduction in workforce. We do not believe these changes will adversely affect our relationship with Progress.
We are dependent on other third-party suppliers.
We resell certain software which we license from third parties other than Progress. There can be no assurance that these third-party software arrangements and licenses will continue to be available to us on terms that provide us with the third-party software we require, provide adequate functionality in our products on terms that adequately protect our proprietary rights or are commercially favorable to us.
Certain QAD Enterprise Applications are developed using embedded programming tools from Microsoft and Sun Microsystems (owned by our competitor Oracle) for the Microsoft .NET framework and Java Programming environments, respectively. We rely on these environments’ continued compatibility with customers’ desktop and server operating systems. In the event that this compatibility is limited, some of our customers may not be able to easily upgrade their QAD software. If the present method of licensing the .NET framework as part of Microsoft’s Desktop Operating systems is changed and a separate price were applied to the .NET framework, our expenses could increase substantially. Similarly, if Oracle decided to charge fees or otherwise change the historical licensing terms for Java technology, our expenses could increase substantially. For both of the .Net and Java elements, we rely on market acceptance and maintenance of these environments and we may be adversely affected if these were withdrawn or superseded in the market.
Our partner agreements, including development, product acquisition and reseller agreements, contain confidentiality, indemnity and non-disclosure provisions for the third party and end user. Failure to establish or maintain successful relationships with these third parties or failure of these parties to develop and support their software, provide appropriate services and fulfill confidentiality, indemnity and non-disclosure obligations could have an adverse effect on us. We have been in the past, and expect to be in the future, party to disputes about ownership, license scope and royalty or fee terms with respect to intellectual property. Failure to prevail in any such dispute could have a material adverse effect on our business.
Risks associated with our proprietary rights and customer contracts
Our intellectual property may be at risk as a result of a variety of different factors.
We rely on a combination of protections provided by applicable copyright, trademark, patent and trade secret laws, as well as on confidentiality procedures and licensing arrangements, to establish and protect our rights in our software and related materials and information. We enter into licensing agreements with each of our on-premise customers and these agreements provide for the non-exclusive use of QAD Enterprise Applications. Our license contracts contain confidentiality and non-disclosure provisions, a limited warranty covering our applications and indemnification for the customer from infringement actions related to our applications. In addition, we generally license our software to end-users in both object code (machine-readable) and source code (human-readable) formats. While this practice facilitates customization, making software available in source code also makes it possible for others to copy or modify our software for impermissible purposes.
Despite our efforts, it may be possible for others to copy portions of our products, reverse engineer them or obtain and use information that we regard as proprietary, all of which could adversely affect our competitive position. Furthermore, there can be no assurance that our competitors will not independently develop technology similar to ours. In addition, the laws of certain countries do not protect our proprietary rights to the same extent as the laws of the United States.
The success of our business is highly dependent on maintenance of intellectual property rights.
The unauthorized use of our intellectual property rights may increase the cost of protecting these rights or reduce our revenues. We may initiate, or be subject to, claims or litigation for infringement of proprietary rights or to establish the validity of our proprietary rights, which could result in significant expense to us, cause product shipment delays, require us to enter royalty or licensing agreements and divert the efforts of our technical and management personnel from productive tasks, whether or not such litigation were determined in our favor.
We may be exposed to claims for infringement of intellectual property rights and breach of contract, and we may experience impairment of our own intellectual property rights.
Third parties may initiate proceedings against us claiming infringement or other misuse of their intellectual property rights and/or breach of our agreements with them. Further, while we actively monitor the adoption of open source software in our software development process, it is possible that our use of open source software may inadvertently subject our proprietary software to public disclosure and impairment of our intellectual property rights. The likelihood of such instances may increase as the use of open source and other third-party code becomes more prevalent in the industry. Any such instances, regardless of validity, may cause us to:
|
|
• |
Pay license fees or monetary damages; |
|
|
• |
Incur high legal fees in defense of such claims; |
|
|
• |
Alter or stop selling our products; |
|
|
• |
Satisfy indemnification obligations to our customers; |
|
|
• |
Release source code to third parties, possibly under open source license terms; and |
|
|
• |
Divert management’s time and attention from operating our business. |
We may be exposed to product liability claims and other liability.
While our customer agreements typically contain provisions designed to limit our exposure to product liability claims and other liability, we may still be exposed to liability in the event such provisions may not apply.
We have an errors and omissions insurance policy which may not totally protect us.
The Company has an errors and omissions insurance policy. However, this insurance may not continue to be available to us on commercially reasonable terms or at all, or a claim otherwise covered by our insurance may exceed our coverage limits, or a claim may not be covered at all. We may be subject to product liability claims or errors or omissions claims that could have an adverse effect on us. Moreover, defending a suit, regardless of its merits, could entail substantial expense and require the time and attention of key management personnel.
Risks associated with our market and the economy
The market in which we participate is highly competitive and if we do not compete effectively our operating results could be harmed.
The market for enterprise software solutions is highly competitive and subject to changing technology, shifting customer needs and introductions of new products and services. Many of our current and potential competitors enjoy substantial competitive advantages, such as greater name recognition, larger marketing budgets and substantially greater financial, technical and other resources. In addition, many of our current and potential competitors have established marketing relationships and access to larger customer bases. A number of companies offer products that are similar to our products and target the same markets. Any of these competitors may be able to respond more quickly to new or changing opportunities, technologies and market trends, and devote greater resources to the development, promotion and sale of their products. Our competitors may also offer extended payment terms or price reductions for their products and services, either of which could materially and adversely affect our ability to compete successfully. There can be no assurance that we will be able to compete successfully against current and future competitors or that the competitive pressures that we may face will not materially adversely affect our business, revenue and results of operations.
We are dependent upon achieving success in certain concentrated markets.
We have made a strategic decision to concentrate our product development, as well as our sales and marketing efforts, in certain vertical manufacturing industry segments: automotive, life sciences, consumer products, food and beverage, high technology and industrial products. We also concentrate our efforts on certain geographies, where costs to stay in compliance with local requirements could be extensive and require a large amount of resources. An important element of our strategy is the achievement of technological and market leadership recognition for our software products in these segments and geographies. The failure of our products to achieve or maintain substantial market acceptance in one or more of these segments or geographies could have an adverse effect on us. If any of these targeted industry segments or geographies experience a material slowdown or reduced growth, those conditions could adversely affect the demand for our products.
Unfavorable economic conditions may adversely impact our business, operating results and financial condition.
Our operations and performance are subject to the risks arising from worldwide economic conditions, which are themselves impacted by other events, such as financial crises, natural disasters and political turmoil. In particular, the negative impact of economic conditions on manufacturing companies could have a substantial adverse effect on our sales, because our products are focused on supporting manufacturing companies. Ongoing uncertainty about current global economic conditions may result in reductions in sales of our products, longer sales cycles, slower adoption of new technologies and increased price competition as manufacturing companies may delay, reduce or forego spending in response to declining asset values, tight credit, high unemployment, natural disasters, political unrest and negative financial news. Such economic conditions may also result in our customers extending their payment periods or experiencing reduced ability to pay amounts owed to us. Uncertainty about current global economic conditions could also increase the volatility of our stock price. If any of the foregoing occurs, our results of operations may be adversely affected.
Risks associated with our third-party relationships
We are dependent upon the development and maintenance of sales, services and marketing channels.
We sell and support our products through direct and indirect sales, services and support organizations throughout the world. We also maintain relationships with a number of consulting and systems integration organizations that we believe are important to our worldwide sales, marketing, service and support activities and to the implementation of our products. We believe this strategy allows for additional flexibility in ensuring our customers’ needs for services are met in a cost effective, timely and high quality manner. Our services providers generally do not receive fees for the sale of our software products unless they participate actively in a sale as a sales agent or a distributor. We are aware that these third-party service providers do not work exclusively with our products and in many instances have similar, and often more established, relationships with our principal competitors. If these third parties exclusively pursue products or technology other than QAD software products or technology, or if these third parties fail to adequately support QAD software products and technology or increase support for competitive products or technology, we could be adversely affected.
Risks associated with acquisitions we may make
We may make acquisitions or investments in new businesses, products or technologies that involve additional risks.
As part of our business strategy, we have made, and expect to continue to make, acquisitions of businesses or investments in companies that offer complementary products, services and technologies. Such acquisitions or investments involve a number of risks which could adversely affect our business or operating results, including:
|
|
• |
Our business strategy may not be furthered by an acquisition as we planned; |
|
|
• |
We may be unable to retain customers, vendors, distributors, business partners or other relationships associated with the acquired business; |
|
|
• |
Our due diligence may not identify significant liabilities or deficiencies associated with the business, assets, products, financial condition or accounting practices of an acquired company; |
|
|
• |
We may have difficulty integrating an acquired business due to incompatible business cultures; |
|
|
• |
We may incur significant integration costs related to assimilating the operations and personnel of acquired companies; |
|
|
• |
Acquisition costs may result in charges in a particular quarter, increasing variability in our quarterly earnings; |
|
|
• |
We may not realize the anticipated revenue increase from an acquisition; |
|
|
• |
We may be unable to realize the value of the acquired assets relative to the acquisition cost; and |
|
|
• |
Acquisitions may distract management from our existing businesses. |
These factors could have a material adverse effect on our business, financial condition and operating results. In addition such acquisitions may cause our future quarterly financial results to fluctuate due to costs related to an acquisition, such as the elimination of redundant expenses or write-offs of impaired assets recorded in connection with acquisitions. Also, consideration paid for any future acquisitions could include our stock. As a result, future acquisitions could cause dilution to existing stockholders and to earnings per share, though the likelihood of voting dilution is limited by the ability of the Company to use low-vote Class A common stock as consideration for potential acquisitions. Furthermore, we may incur significant debt to pay for future acquisitions or investments or our use of cash to pay for acquisitions may limit other potential uses of our cash, including stock repurchases, dividend payments and retirement of outstanding indebtedness.
Risks associated with our international operations
Our operations are international in scope, exposing us to additional risk.
We derive over half of our total revenue from sales outside the United States. A significant aspect of our strategy is to focus on developing business in emerging markets. Our operating results could be negatively impacted by a variety of factors affecting our foreign operations, many of which are beyond our control. These factors include currency fluctuations, economic, political or regulatory conditions in a specific country or region, trade protection measures and other regulatory requirements. Additional risks inherent in international business activities generally include, among others:
|
|
• |
Longer accounts receivable collection cycles; |
|
|
• |
Costs and difficulties of managing international operations and alliances; |
|
|
• |
Greater difficulty enforcing intellectual property rights; |
|
|
• |
Import or export requirements; |
|
|
• |
Natural disasters; |
|
|
• |
Changes in political or economic conditions; |
|
|
• |
Changes in regulatory requirements or tax law; and |
|
|
• |
Operating in geographies with a higher inherent risk of corruption, which could adversely affect our ability to maintain compliance with domestic and international laws, including, but not limited to, the U.S. Foreign Corrupt Practices Act and other anti-corruption laws. |
We may experience foreign currency gains and losses.
We conduct a portion of our business in currencies other than the United States dollar. Our revenues and operating results may be negatively affected by fluctuations in foreign currency exchange rates. Changes in the value of major foreign currencies, including the euro, Brazilian real, Mexican peso, British pound and Swiss franc relative to the United States dollar can significantly and adversely affect our revenues, expenses and operating results.
Changes in accounting principles, or interpretations thereof, could have a significant impact on our financial position and results of operations.
We prepare our Consolidated Financial Statements in accordance with accounting principles generally accepted in the United States of America (“GAAP”). A change in these principles can have a significant impact on our reported results and may even retroactively affect previously reported transactions. The adoption of new or revised accounting principles may require that we make significant changes to our systems, processes and controls.
The U.S.-based Financial Accounting Standards Board (“FASB”) is currently working together with the International Accounting Standards Board (“IASB”) on several projects to further align accounting principles and facilitate more comparable financial reporting between companies who are required to follow GAAP under SEC regulations and those who are required to follow International Financial Reporting Standards outside of the United States. These efforts by the FASB and IASB may result in different accounting principles under GAAP that may result in materially different financial results for us in areas including, but not limited to, principles for recognizing revenue and lease accounting. Additionally, significant changes to GAAP resulting from the FASB’s and IASB’s efforts may require that we change how we process, analyze and report financial information and that we change financial reporting controls.
We are exposed to fluctuations in the market values of our investments
Given the global nature of our business, we have investments both domestically and internationally. Credit ratings and market values of these investments can be negatively impacted by liquidity, credit deterioration or losses, financial results, foreign exchange rates, or other factors. As a result, the value or liquidity of our cash equivalents and marketable securities could decline, thus adversely affecting our financial condition and operating results.
The market for our Class A and Class B common stock is volatile
Our stock price could become more volatile and investments could lose value.
The market price of our common stock and the number of shares of each class traded each day has experienced significant fluctuations and may continue to fluctuate significantly. The market price for our common stock may be affected by a number of factors, including, but not limited to:
|
|
• |
Shortfalls in our expected net revenue, earnings or key performance metrics; |
|
|
• |
Changes in recommendations or estimates by securities analysts; |
|
|
• |
The announcement of new products by us or our competitors; |
|
|
• |
Quarterly variations in our or our competitors’ results of operations; |
|
|
• |
A change in our dividend or stock repurchase activities; |
|
|
• |
Developments in our industry or changes in the market for technology stocks; |
|
|
• |
Changes in rules or regulations applicable to our business; and |
|
|
• |
Other factors, including economic instability and changes in political or market conditions. |
The dual class structure of our common stock as contained in our charter documents could adversely impact the market for our common stock.
Our dual-class stock structure could adversely impact the market for our stock. The liquidity of our common stock may be adversely impacted by our dual-class structure because each class has less of a public float than it would if we had a single class of common stock. In addition, there are fewer Class B shares than Class A shares and Class B shares may be less desirable to the public due to the 20% higher dividend on Class A shares. Also, the holding of lower voting Class A common stock may not be permitted by the investment policies of certain institutional investors or may be less attractive to managers of certain institutional investors.
If research analysts do not publish research about our business or if they issue unfavorable commentary or downgrade our common stock, our stock price and trading volume could decline.
The trading market for our common stock depends in part on the research and reports that research analysts publish about us and our business. If we do not maintain adequate research coverage, or if one or more analysts who covers us downgrades our stock or publishes inaccurate or unfavorable research about our business, the price of our common stock could decline. If one or more of the research analysts ceases coverage of our company or fails to publish reports on us regularly, demand for our common stock could decrease, which could cause our stock price or trading volume to decline.
We are obligated to maintain proper and effective internal control over financial reporting. We may not complete our analysis of our internal control over financial reporting in a timely manner, or this internal control may not be determined to be effective, which may adversely affect investor confidence in our company and, as a result, the value of our common stock.
We are required, pursuant to the Securities and Exchange Act of 1934, as amended (the “Exchange Act”), to furnish a report by management on, among other things, the effectiveness of our internal control over financial reporting. This assessment will need to include disclosure of any material weaknesses identified by our management in our internal control over financial reporting, as well as a statement that our auditors have issued an attestation report on our internal controls.
While we were able to determine in our management’s report for fiscal 2017 that our internal control over financial reporting is effective, as well as provide an unqualified attestation report from our independent registered public accounting firm to that effect, we may not be able to complete our evaluation, testing, and any required remediation in a timely fashion or our independent registered public accounting firm may not be able to formally attest to the effectiveness of our internal control over financial reporting in the future. During the evaluation and testing process, if we identify one or more material weaknesses in our internal control over financial reporting that we are unable to remediate before the end of the same fiscal year in which the material weakness is identified, we will be unable to assert that our internal controls are effective. If we are unable to assert that our internal control over financial reporting is effective, or if our auditors are unable to attest to the effectiveness of our internal controls or determine we have a material weakness in our internal controls, we could lose investor confidence in the accuracy and completeness of our financial reports, which could cause the price of our common stock to decline.
If we are unable to pay quarterly dividends, our reputation and stock price may be harmed.
Our payment of dividends may require the use of a significant portion of our cash earnings. As a result, we may not retain a sufficient amount of cash to fund our operations or finance future growth opportunities, new product development initiatives and unanticipated capital expenditures which could adversely affect our financial performance. Additionally, our board of directors may, at its discretion, decrease or entirely discontinue the payment of dividends at any time. Our ability to pay dividends will depend on our ability to generate sufficient cash flows from operations in the future. This ability may be subject to certain economic, financial, competitive and other factors that are beyond our control. Any failure to pay dividends may negatively impact our reputation and investor confidence in us and may negatively impact the price of our common stock.
Our common stock ownership is concentrated
The dual class structure of our common stock as contained in our charter documents has the effect of concentrating voting control with certain stockholders, including Karl Lopker and Pamela Lopker, thus limiting our other stockholders’ ability to influence corporate matters.
Our Class B common stock has one vote per share and our Class A common stock has 1/20th vote per share. Stockholders who hold shares of our Class B common stock together held approximately 80% of the voting power of our outstanding capital stock as of January 31, 2017. As of January 31, 2017, Karl Lopker and Pamela Lopker jointly and beneficially owned approximately 43% of the outstanding shares of our Class A and Class B common stock, representing approximately 65% of the voting power of our outstanding capital stock. Currently they have sufficient voting control to determine the outcome of a stockholder vote concerning:
|
|
• |
The election and removal of all members of our board of directors; |
|
|
• |
The merger, consolidation or sale of the Company or all of our assets; and |
|
|
• |
All other matters requiring stockholder approval, regardless of how our other stockholders vote their shares. |
In addition, the holders of our Class B common stock collectively will continue to be able to control all matters submitted to our stockholders for approval even if their stock holdings represent less than 50% of the outstanding shares of our common stock. Because of the 20-to-1 voting ratio between our Class B and Class A common stock, the holders of our Class B common stock collectively will continue to control a majority of the combined voting power of our common stock even when the shares of Class B common stock represent as little as 5% of all outstanding shares of our Class A common stock. This concentrated control will limit the ability of our Class A stockholders to influence corporate matters for the foreseeable future, and, as a result, the market price of our Class A common stock could be adversely affected.
This concentrated control limits the ability of our other stockholders to influence corporate matters and also limits the liquidity of the shares owned by other stockholders. Should the interests of Karl Lopker and Pamela Lopker differ from those of other stockholders, the other stockholders may not be afforded the protections of having a majority of directors on the board who are independent from our principal stockholders or our management. For example, Karl Lopker’s and Pamela Lopker’s concentrated control could discourage others from initiating potential merger, takeover or other change of control transactions; and, transactions could be pursued that our other stockholders do not view as beneficial. As a result, the market price of our Class A and Class B common stock could be adversely affected.
We are not required to comply with certain corporate governance rules of NASDAQ that would otherwise apply to us as a company listed on NASDAQ because we are a controlled company.
Specifically, we are not required to have a majority of independent directors or a compensation committee comprised solely of independent directors; select, or recommend for the board’s selection, director nominees by a majority of independent directors or a nominating committee comprised solely of independent directors; determine officer compensation by a compensation committee comprised solely of independent directors or by a majority of the board upon recommendation of a compensation committee comprised solely of independent directors; and satisfy certain responsibilities of the compensation committee prior to retaining or receiving advice from a compensation consultant, legal counsel or other advisor to the compensation committee.
Provisions in the Company's charter documents or Delaware law could discourage a takeover that stockholders may consider favorable.
Our Certificate of Incorporation contains certain other provisions that may have an “anti-takeover” effect. The Certificate of Incorporation contains authority for the Board to issue up to 5,000,000 shares of preferred stock without stockholder approval. Although the Company has no present intention to issue any such shares, we could issue such shares in a manner that deters or seeks to prevent an unsolicited bid for us. The Certificate of Incorporation also does not provide for cumulative voting and, accordingly, a significant minority stockholder could not necessarily elect any designee to the board of directors. In addition, Section 203 of the Delaware Corporation Law may discourage, delay, or prevent a change in control of us by imposing certain restrictions on various business combinations. Furthermore, our dual class structure concentrates the voting power of our stock in a small group of stockholders who would have the ability to control the outcome of a stockholder vote. As a result of these provisions in the Company's Certificate of Incorporation, including our dual class structure, and Delaware law, our stockholders may be deprived of an opportunity to sell their shares at a premium over prevailing market prices and it would be more difficult to replace our directors and management.
We are dependent upon highly skilled personnel
Our performance depends on the talents and efforts of highly skilled employees, including the continued service of a relatively small number of key technical and senior management personnel. In particular, our Chairman of the Board and President, Pamela Lopker, and Chief Executive Officer, Karl Lopker, are critical to overall management of QAD, maintenance of our culture and setting our strategic direction. All of our executive officers and key employees are at-will employees and we do not have key-person insurance covering any of our employees. Our future success depends on our continuing ability to attract and retain highly skilled personnel in all areas of our organization. Competition for such personnel is intense and many of our competitors are larger and have greater financial resources for attracting skilled personnel. The loss of key technical and senior management personnel or the inability to attract and retain additional qualified personnel could have an adverse effect on our continued ability to compete effectively.
We have hired personnel in countries where advanced technical expertise and other expertise are available at lower costs to improve our cost structure. We may experience increased competition for employees in these countries as the trend toward globalization continues, which may negatively affect our employee retention efforts and increase our expenses in an effort to offer a competitive compensation program.
|
ITEM 1B. |
UNRESOLVED STAFF COMMENTS |
None.
|
ITEM 2. |
PROPERTIES |
QAD’s corporate headquarters are located in Santa Barbara, California. The corporate headquarters are owned by QAD and consist of approximately 120,000 square feet situated on 28 acres of land.
In addition to the corporate headquarters, QAD owns a facility in Dublin, Ireland and leases over 25 offices throughout the world with lease agreements ending on various dates through fiscal year 2026. QAD’s leased properties include offices in the United States, Belgium, France, Germany, Ireland, Italy, Poland, Spain, The Netherlands, United Kingdom, Australia, China, India, Japan, Singapore, Thailand, Brazil and Mexico. QAD will seek to review lease commitments in the future as may be required. QAD anticipates that its current domestic and international facilities are substantially sufficient to meet its needs for at least the next twelve months.
|
ITEM 3. |
LEGAL PROCEEDINGS |
We are not party to any material legal proceedings. We are from time to time party, either as plaintiff or defendant, to various legal proceedings and claims which arise in the ordinary course of business. While the outcome of these claims cannot be predicted with certainty, management does not believe that the outcome of any of these legal matters will have a material adverse effect on our consolidated financial position or results of operations.
|
ITEM 4. |
MINE SAFETY DISCLOSURES |
Not applicable.
PART II
|
ITEM 5. |
MARKET FOR REGISTRANT’S COMMON EQUITY, RELATED STOCKHOLDER MATTERS AND ISSUER PURCHASES OF EQUITY SECURITIES |
QAD common stock has been traded on the NASDAQ Global Market (“NASDAQ”) since our initial public offering in August 1997 under the symbol “QADI” through December 14, 2010. On December 14, 2010, QAD shareholders approved a recapitalization plan pursuant to which the Company established two classes of common stock (the “Recapitalization”). Our Class A Common Stock and Class B Common Stock are traded on the NASDAQ under the symbols “QADA” and “QADB”, respectively. The following table reflects the range of high and low sale prices of our Common Stock as reported by NASDAQ:
|
QADA |
QADB |
|||||||||||||||
|
Low Price |
High Price |
Low Price |
High Price |
|||||||||||||
|
Fiscal 2017: |
||||||||||||||||
|
Fourth quarter |
$ | 22.90 | $ | 31.10 | $ | 19.90 | $ | 26.20 | ||||||||
|
Third quarter |
18.88 | 24.75 | 17.05 | 21.68 | ||||||||||||
|
Second quarter |
18.35 | 20.53 | 13.79 | 17.89 | ||||||||||||
|
First quarter |
17.11 | 21.52 | 14.67 | 17.85 | ||||||||||||
|
QADA |
QADB |
|||||||||||||||
|
Low Price |
High Price |
Low Price |
High Price |
|||||||||||||
|
Fiscal 2016: |
||||||||||||||||
|
Fourth quarter |
$ | 17.63 | $ | 27.04 | $ | 15.33 | $ | 23.27 | ||||||||
|
Third quarter |
23.36 | 27.56 | 18.04 | 23.43 | ||||||||||||
|
Second quarter |
22.17 | 28.71 | 19.50 | 23.17 | ||||||||||||
|
First quarter |
18.70 | 25.99 | 16.30 | 21.98 | ||||||||||||
Holders
As of March 31, 2017, there were approximately 208 shareholders of record of our Class A common stock and approximately 178 shareholders of record of our Class B common stock. Because many of our shares of common stock are held by brokers or other institutions on behalf of stockholders, we are unable to estimate the total number of stockholders represented by the record holders.
Dividends
We declared four quarterly cash dividends in fiscal 2017 of $0.072 and $0.06 per share of Class A and Class B stock, respectively. Continuing quarterly cash dividends are subject to profitability measures, liquidity requirements of QAD and Board discretion.
Recent Sales of Unregistered Securities
None.
Issuer Purchases of Equity Securities
None.
STOCKHOLDER RETURN PERFORMANCE GRAPH
The line graph below compares the annual percentage change in the cumulative total stockholder return on QAD’s common stock with the cumulative total return of the NASDAQ Composite Total Return Index and the NASDAQ Computer Index, on an annual basis, for the period beginning January 31, 2012 and ending January 31, 2017.
The graph assumes that $100 was invested in QAD common stock on January 31, 2012 and that all dividends were reinvested. Historic stock price performance has been restated to reflect the effect of the Recapitalization for all periods presented. Historic stock price performance should not be considered indicative of future stock price performance.
The following Share Performance Graph shall not be deemed to be “filed” with the Securities and Exchange Commission, nor shall such information be incorporated by reference into any future filings under the Securities Act of 1933 or Securities Exchange Act of 1934, each as amended, except to the extent that the Company specifically incorporates it by reference into such filing.
COMPARISON OF CUMULATIVE TOTAL RETURN
AMONG QAD INC., THE NASDAQ COMPOSITE TOTAL RETURN INDEX,
AND THE NASDAQ COMPUTER INDEX
|
|
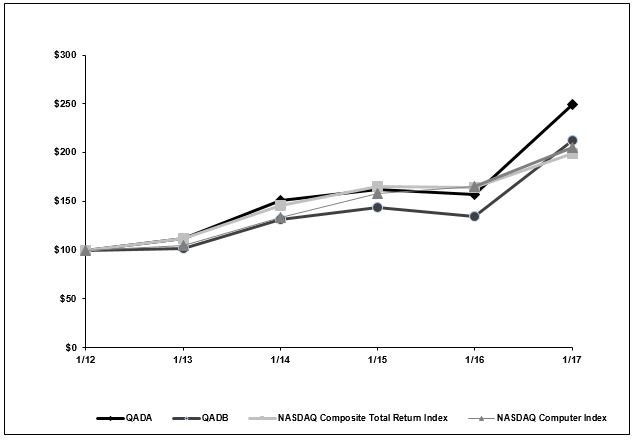
|
Measurement Periods |
QADA |
QADB |
NASDAQ |
NASDAQ |
||||||||||||
|
01/31/12 |
100.00 | 100.00 | 100.00 | 100.00 | ||||||||||||
|
01/31/13 |
112.03 | 101.29 | 111.67 | 104.58 | ||||||||||||
|
01/31/14 |
150.66 | 130.93 | 145.85 | 133.94 | ||||||||||||
|
01/31/15 |
162.56 | 143.64 | 164.73 | 158.46 | ||||||||||||
|
01/31/16 |
157.45 | 134.45 | 163.97 | 165.59 | ||||||||||||
|
01/31/17 |
249.01 | 212.73 | 199.54 | 204.76 | ||||||||||||
|
ITEM 6. SELECTED FINANCIAL DATA |
|
Years Ended January 31 |
||||||||||||||||||||
|
2017 (1) |
2016 (2) |
2015 (3) |
2014 |
2013 |
||||||||||||||||
|
(in thousands, except per share data) |
||||||||||||||||||||
|
STATEMENTS OF OPERATIONS DATA: |
||||||||||||||||||||
|
Revenues: |
||||||||||||||||||||
|
Subscription Fees |
$ | 52,167 | $ | 38,806 | $ | 28,217 | $ | 19,406 | $ | 14,838 | ||||||||||
|
License fees |
23,633 | 29,891 | 40,917 | 36,176 | 31,260 | |||||||||||||||
|
Maintenance and other |
130,406 | 132,962 | 141,295 | 139,557 | 138,563 | |||||||||||||||
|
Professional services |
71,767 | 76,193 | 84,672 | 71,172 | 67,511 | |||||||||||||||
|
Total revenue |
277,973 | 277,852 | 295,101 | 266,311 | 252,172 | |||||||||||||||
|
Operating income |
3,364 | 10,171 | 15,985 | 9,403 | 11,808 | |||||||||||||||
|
Net (loss) income |
$ | (15,450 | ) | $ | 8,912 | $ | 12,946 | $ | 6,386 | $ | 6,639 | |||||||||
|
Basic net (loss) income per share: |
||||||||||||||||||||
|
Class A |
$ | (0.84 | ) | $ | 0.49 | $ | 0.84 | $ | 0.42 | $ | 0.44 | |||||||||
|
Class B |
$ | (0.70 | ) | $ | 0.41 | $ | 0.70 | $ | 0.35 | $ | 0.37 | |||||||||
|
Diluted net (loss) income per share: |
||||||||||||||||||||
|
Class A |
$ | (0.84 | ) | $ | 0.47 | $ | 0.79 | $ | 0.41 | $ | 0.42 | |||||||||
|
Class B |
$ | (0.70 | ) | $ | 0.40 | $ | 0.68 | $ | 0.34 | $ | 0.35 | |||||||||
|
Dividends declared per common share: |
||||||||||||||||||||
|
Class A |
$ | 0.29 | $ | 0.29 | $ | 0.29 | $ | 0.29 | $ | 0.58 | ||||||||||
|
Class B |
$ | 0.24 | $ | 0.24 | $ | 0.24 | $ | 0.24 | $ | 0.48 | ||||||||||
|
BALANCE SHEET DATA: |
||||||||||||||||||||
|
Cash and equivalents |
145,082 | 137,731 | 120,526 | 75,984 | 65,009 | |||||||||||||||
|
Working capital |
80,351 | 86,791 | 69,757 | 20,644 | 10,276 | |||||||||||||||
|
Total assets |
280,890 | 287,341 | 282,151 | 233,672 | 224,807 | |||||||||||||||
|
Current portion of long-term debt |
446 | 422 | 406 | 389 | 372 | |||||||||||||||
|
Long-term debt |
13,767 | 14,191 | 14,603 | 15,085 | 15,474 | |||||||||||||||
|
Total stockholders’ equity |
112,686 | 128,006 | 110,565 | 63,064 | 57,057 | |||||||||||||||
|
(1) |
Fiscal year 2017 includes placement of a valuation allowance of $16.3 million against U.S. federal and state net deferred tax assets. |
|
(2) |
Fiscal year 2016 includes an issuance of 450,000 shares of class A common stock at $20.00 per share for net proceeds to the company of $8.4 million after deduction of offering expenses as a result of an option to purchase additional shares exercised in full by the underwriters related to the stock issuance described in note (3) below. |
|
(3) |
Fiscal year 2015 includes an issuance of 2,000,000 shares of Class A common stock at $20.00 per share for net proceeds to the Company of $37.0 million after deducting offering expenses. |
|
ITEM 7. |
MANAGEMENT’S DISCUSSION AND ANALYSIS OF FINANCIAL CONDITION AND RESULTS OF OPERATIONS |
INTRODUCTION
The following discussion should be read in conjunction with our Consolidated Financial Statements and Notes to Consolidated Financial Statements included in Item 15 of this Annual Report on Form 10-K.
BUSINESS OVERVIEW
QAD (“QAD”, the “Company”, “we” or “us”) is a global leader in cloud-based enterprise software solutions for global manufacturing companies across the automotive, life sciences, consumer products, food and beverage, high technology and industrial products industries. We offer global, full-featured, secure and flexible enterprise and supply chain solutions built for global manufacturing companies which can be delivered in the cloud, on premise or via a blended combination of certain sites on premise and others in the cloud. Our mission is to provide best-in-class software that enables our customers to operate as effective enterprises where their business processes are running at peak efficiency and are perfectly aligned to their strategic goals. Our solutions, called QAD Enterprise Applications, enable measurement and control of key business processes and support operational requirements, including financials, manufacturing, demand and supply chain planning, customer management, business intelligence, business process management, supply chain execution, transportation management, service and support, enterprise asset management, analytics, enterprise quality management, interoperability, process and performance, and internationalization. We also focus on the foundation and technology of our applications, such as user interface and usability.
We have four principal sources of revenue:
|
|
• |
Subscription of Enterprise Applications through our cloud offering in a Software as a Service (“SaaS”) model as well as other hosted applications; |
|
|
• |
License purchases of Enterprise Applications; |
|
|
• |
Maintenance and support, including technical support, training materials, product enhancements and upgrades; |
|
|
• |
Professional services, including implementations, technical and application consulting, training, migrations and upgrades. |
We operate primarily in the following four geographic regions: North America, Latin America, EMEA and Asia Pacific. In fiscal 2017, approximately 47% of our total revenue was generated in North America, 30% in EMEA, 17% in Asia Pacific and 6% in Latin America. The majority of our revenue is generated from global customers who have operations in multiple countries throughout the world. Subscription, license and maintenance revenues are allocated to the region where the end user is located. Services revenue is assigned based on the region where the services are performed. A significant portion of our revenue and expenses are derived from international operations which are primarily conducted in foreign currencies. As a result, changes in the value of foreign currencies relative to the U.S. dollar have impacted our results of operations and may impact our future results of operations. At January 31, 2017, we employed approximately 1,710 employees worldwide, of which 620 employees were based in North America, 530 employees in EMEA, 470 employees in Asia Pacific and 90 employees in Latin America.
Our customer base and our target markets are primarily global manufacturing companies; therefore, our results are heavily influenced by the state of the manufacturing economy on a global basis. As a result, our management team monitors several economic indicators, with particular attention to the Global and Country Purchasing Managers’ Indexes (“PMI”). The PMI is a survey conducted on a monthly basis by polling businesses that represent the makeup of respective sectors. Since most of our customers are manufacturers, our revenue has historically correlated with fluctuations in the manufacturing PMI. Global macro economic trends and manufacturing spending are important barometers for our business, and the health of the U.S., Western European and Asian economies have a meaningful impact on our financial results.
We are transitioning our business model from traditional perpetual licensing to cloud based subscription and we have seen an acceleration of customer preference for cloud based solutions. During fiscal 2017 we closed most of our new customer deals in the cloud. In addition, we converted many of our existing customers from on-premise licenses to our cloud based solution. Recurring revenue, which we define as subscription revenue plus maintenance revenue, accounted for 66% of total revenue for fiscal 2017, up from 62% one year ago. By reducing our customers’ up-front costs and providing more flexibility in how customers gain access to and pay for our products, we expect our cloud business model will be more attractive to our customers than perpetual licenses. We anticipate this will increase our long-term revenue growth rate by increasing total subscriptions and customer value over time. As a result of our increased sales in the cloud, our license revenue is declining as a percentage of total revenue in comparison to prior years, a trend that we believe will continue. This is putting adverse pressure on short-term profitability as we invest to support growth of our cloud business and our sales and operational expenses are recognized ahead of revenue.
FISCAL 2017 OPERATING RESULTS
To provide a framework for assessing how our underlying businesses performed excluding the effect of foreign currency fluctuations, we compare the changes in results from one period to another period using constant currency. In order to calculate our constant currency results, we apply the current foreign currency exchange rates to the prior period results. In the tables below, we present the change based on actual results in reported currency and in constant currency (in thousands):
|
Year Ended |
Year Ended |
|
Change due |
Total |
||||||||||||||||
|
Total revenue |
$ | 277,973 | $ | 277,852 | $ | 4,683 | $ | (4,562 |
) |
$ | 121 | |||||||||
|
Cost of revenue |
130,851 | 126,562 | (5,702 |
) |
1,413 | (4,289 |
) | |||||||||||||
|
Gross profit |
147,122 | 151,290 | (1,019 |
) |
(3,149 |
) |
(4,168 |
) | ||||||||||||
|
Operating expenses |
143,758 | 141,119 | (4,398 |
) |
1,759 | (2,639 |
) | |||||||||||||
|
Income from operations |
$ | 3,364 | $ | 10,171 | $ | (5,417 |
) |
$ | (1,390 |
) |
$ | (6,807 |
) | |||||||
In fiscal 2017, our total revenue was adversely impacted by the strengthening of the U.S. dollar relative to other currencies. Approximately 53% of our total revenue is generated outside the U.S. and we expect that a significant portion of our business will continue to be conducted in currencies other than the U.S. dollar, particularly the euro. Total revenue for fiscal 2017 was relatively consistent in total, but included an adverse currency impact of $4.6 million. In constant currency, total revenue increased by $4.7 million, driven by higher subscription revenue from our cloud offering. The growth in our cloud revenue in fiscal 2017 offset declines in our license and professional services revenue as well as the overall negative impact of foreign exchange on our total revenue. Income from operations declined by $6.8 million, including an adverse currency impact of $1.4 million. In constant currency, income from operations declined by $5.4 million, primarily due to lower services margins and higher research and development spending to enhance our product functionality.
Subscription Revenue. Subscription revenue consists of recurring fees from customers to access our products via the cloud and other subscription offerings. Our cloud offerings typically include access to QAD software, hosting, support and product updates, if and when available. Included in subscription revenue are the fees for transition services such as set up, configuration, database conversion and migration. Sales of QAD Enterprise Applications in the cloud represented over 85% of our total subscription revenue in fiscal 2017 and 2016. Our subscription revenue represented approximately 19% and 14% of our total revenue in fiscal 2017 and 2016, respectively. Our cloud customer retention rate is in excess of 90%. We track our retention rate of cloud and maintenance by calculating the annualized revenue of customer sites with contracts up for renewal during the period compared to the annualized revenue associated with the customer sites that have canceled during the period. The percentage of revenue not canceled is our retention rate.
On a constant currency basis, subscription revenue increased by $14.2 million, or 37%, in fiscal 2017 when compared to the prior year. Subscription margin was 48% and 47% for the fiscal years 2017 and 2016, respectively. Given the acceleration of our cloud business, we have made additional investments in infrastructure in order to support additional environments for our new customers. The revenue associated with these environments lags behind the cost, and as a result we experience margin pressure during periods of high growth. We expect subscription margins will improve over time, but quarterly fluctuations should be expected as we invest to support cloud growth. Growing our cloud solution and offering our products as SaaS continues to be a key strategic initiative for us. Subscription revenue is billed on a quarterly or annual basis and recognized ratably over the term of the agreement, typically 12 to 60 months.
Our cloud customers include a mix of existing customers who have converted from our on-premise model and new customers who are implementing our cloud solution. New customers typically generate less revenue up front as compared to customers who are converting to cloud. New customers tend to increase the number of users as their sites go live over time. Existing customers are already using our product at the time of conversion to the cloud; therefore, a greater number of sites and users generally go live from the conversion date.
License Revenue. License revenue is derived from software license fees that customers pay for our core product, QAD Enterprise Applications, and any add-on modules they purchase. In fiscal 2017, on a constant currency basis, license revenue decreased by $5.7 million, or 19%. During fiscal 2017 the number of license orders were lower when compared to the prior year. Our revenue mix has continued to shift significantly from license to subscription revenue as a result of our business model transition. We expect cloud revenue will continue to increase and license revenue will continue to decline.
At times, our license revenue is impacted by deferrals. When we enter into a multi-element transaction with fixed fee services or when we sell licenses for additional users under a pricing model that does not satisfy vendor specific objective evidence (“VSOE”) requirements, we may be required to recognize license revenue ratably over the longer of the maintenance period or expected services implementation timeframe rather than recognizing license revenue at the time of sale. Additionally, if at the time of the license sale we have not finalized the services agreement, we will defer the entire arrangement until the services agreement is signed.
We expect new customers are more likely to subscribe to our cloud based products rather than purchasing perpetual licenses. As a result, we believe a majority of our license revenue will be generated from existing customers and their affiliates. We anticipate that license revenue will decrease as existing customers elect to subscribe to QAD products in the cloud instead of purchasing licenses.
Maintenance Revenue. We offer support services 24 hours a day, seven days a week in addition to providing software upgrades, which include additional or improved functionality, when and if available. In fiscal 2017, on a constant currency basis maintenance revenue was relatively flat when compared to fiscal 2016, despite our expectation of lower maintenance revenue as we convert more of our existing customers to the cloud. When customers convert to QAD Enterprise Applications in the cloud they no longer pay separately for maintenance as those support services are included as a component of the subscription offering. As our customers continue to embrace our cloud offerings we believe our maintenance revenue is likely to decline.
Maintenance revenue fluctuations are influenced by: (1) new license revenue growth; (2) annual renewal of support contracts; (3) fluctuations in currency rates; (4) adjustments to revenue as a result of revenue recognition rules; and (5) customer conversions to the cloud. The vast majority of our customers renew their annual support contracts. Over the last three years, our annual retention rate of customers subscribing to maintenance has been greater than 90%. We track our retention rate of cloud and maintenance by calculating the annualized revenue of customer sites with contracts up for renewal during the period compared to the annualized revenue associated with the customer sites that have canceled during the period. The percentage of revenue not canceled is our retention rate. Conversions to the cloud are not considered cancellations for purposes of the maintenance retention rate calculation. Maintenance revenue is generally billed on an annual basis and recognized ratably over the term of the agreement, typically twelve months.
Professional Services Revenue. Our professional services business includes technical and application consulting and training, implementations, migrations and upgrades related to our solutions. In fiscal 2017, on a constant currency basis, professional services revenue decreased by $3.1 million, or 4%. A significant portion of our professional services revenue is generated from upgrade projects for existing customers. These projects are discretionary in nature and are affected by general economic conditions in the manufacturing industry and our customers' businesses. Consequently, global economic uncertainty can cause on-going projects to slow down, resulting in reduced monthly spend for our customers, while new projects can get delayed until conditions start to improve. We saw this effect in the first half of fiscal 2017 as several large engagements were delayed. However, during the second half of fiscal 2017 our professional services engagements replenished and services revenue increased in comparison to the first six months of fiscal 2017. As a result of these projects, we have put plans in place to add capacity through additional employees and partners in fiscal 2018. These hiring plans may impact our professional services margins in fiscal 2018.
We manage our partners and subcontractors to supplement our internal resources, which provides us with the flexibility to contend with these fluctuations in demand and helps us mitigate low utilization rates in slow times. We believe this also helps us extend our global reach by keeping a higher number of partners engaged and knowledgeable about our products.
Our professional services organization provides our customers with expertise and assistance in planning and implementing our solutions whether in the cloud or on-premise. Consultants typically assist customers with the initial installation of a system, the conversion and transfer of the customer’s historical data into our software, and ongoing training, education, and system upgrades. We believe our professional services help customers implement our software more efficiently, support a customer’s success with our solution, strengthen our customer relationships, and add to our industry-specific knowledge base for use in future implementations and product innovations. Our professional services margins tend to range from about breakeven to 10%. We believe we offer competitive rates and view our professional services organization as a department supporting the implementation and deployment of our products which improves the overall customer experience. Professional services margins lower our overall operating margin as professional services margins are inherently lower than margins for our subscription, license and maintenance revenues. Professional services revenue may be impacted by currency fluctuations; however, since we generally use local resources our costs are also impacted by similar currency fluctuations, providing a natural hedge. As a result, our professional services margins have not been significantly impacted by currency fluctuations.
Although our professional services are optional, many of our customers use these services for some of their planning, implementation, or related needs. Professional services are typically rendered under time and materials-based contracts with services typically billed on an hourly basis. Professional services are sometimes rendered under fixed-fee based contracts with payments due on specific dates or milestones.
Professional services revenue growth is contingent upon subscription and license revenue growth and customer upgrade cycles, which are influenced by the strength of general economic and business conditions and the competitive position of our software products. Our professional services business has competitive exposure to offshore providers which could create the risk of pricing pressure, fewer customer orders and reduced gross margins.
Cash Flow and Financial Condition. In fiscal 2017, we generated cash flow from operating activities of $18.7 million. Our cash and equivalents at January 31, 2017 totaled $145.1 million, with all of the $14.2 million of debt on our balance sheet related to the mortgage of our headquarters. Our primary uses of cash have been funding investment in research and development and funding operations to drive revenue and earnings growth. In addition, we use cash for acquisitions, dividend payments, share repurchase programs and other equity-related transactions.
In fiscal 2018, we anticipate that our priorities for use of cash will be developing sales and services resources and continued investment in research and development to drive and support growth and profitability. We will continue to evaluate acquisition opportunities that are complementary to our product footprint, solutions delivery and technology direction. We will also continue to assess share repurchases and dividend payments. We do not anticipate additional borrowing requirements in fiscal 2018.
Seasonal Nature of Deferred Revenue, Accounts Receivable and Operating Cash Flow. Deferred revenue primarily consists of billings to customers for maintenance and subscription. When renewing maintenance we generally invoice our customers in annual cycles and when renewing subscription we generally invoice our customers quarterly or annually. We typically issue renewal invoices in advance of the renewal period. Depending on timing, the initial invoice and the subsequent renewal invoice may occur in different quarters. This may result in an increase in deferred revenue and accounts receivable. There is a disproportionate weighting towards annual billings in the fourth quarter, primarily as a result of large enterprise account buying patterns. Our fourth quarter has historically been our strongest quarter for new business and renewals. The year on year compounding effect of this seasonality in both billing patterns and overall new and renewal business causes the value of invoices that we generate in the fourth quarter for both new business and renewals to increase as a proportion of our total annual billings.
The sequential quarterly changes in accounts receivable, related deferred revenue and operating cash flow during the first three quarters of our fiscal year are not necessarily indicative of the billing activity that occurs in the fourth quarter as displayed below (in thousands):
|
January 31, |
October 31, |
July 31, |
April 30, |
|||||||||||||
|
Fiscal 2017 |
||||||||||||||||
|
Accounts receivable, net |
$ | 69,441 | $ | 39,100 | $ | 45,468 | $ | 44,829 | ||||||||
|
Deferred revenue, current |
104,125 | 73,982 | 85,268 | 92,640 | ||||||||||||
|
Operating cash flow (1) |
13,209 | 3,451 | 663 | 1,357 | ||||||||||||
|
January 31, |
October 31, |
July 31, |
April 30, |
|||||||||||||
|
Fiscal 2016 |
||||||||||||||||
|
Accounts receivable, net |
$ | 65,512 | $ | 41,233 | $ | 45,957 | $ | 51,222 | ||||||||
|
Deferred revenue, current |
97,911 | 69,616 | 82,505 | 91,408 | ||||||||||||
|
Operating cash flow (1) |
13,892 | (70 | ) | 5,748 | 4,487 | |||||||||||
|
January 31, |
October 31, |
July 31, |
April 30, |
|||||||||||||
|
Fiscal 2015 |
||||||||||||||||
|
Accounts receivable, net |
$ | 78,887 | $ | 46,432 | $ | 52,662 | $ | 51,398 | ||||||||
|
Deferred revenue, current |
102,721 | 72,703 | 88,780 | 97,283 | ||||||||||||
|
Operating cash flow (1) |
18,932 | (567 |
) |
2,277 | 3,321 | |||||||||||
|
(1) |
Operating cash flow represents net cash provided by (used in) operating activities for the three months ended in the periods stated above. |
Backlog
We define backlog as the contract amount which has not been invoiced. When we enter into multiple-year contracts it is common to invoice an initial amount at contract signing followed by subsequent quarterly or annual invoices. At any point in the contract term, there can be amounts that we have not yet been contractually able to invoice. Until such time as these amounts are invoiced, they are not recorded in revenue, unearned revenue or elsewhere in our consolidated financial statements. To the extent future invoicing is determined to be certain, we consider those future invoices to be non-cancelable backlog. Future invoicing is determined to be certain when we have a fully executed non-cancelable contract and invoicing is not dependent on a future event such as customer funding or the delivery of a specific product or feature.
Subscription backlog
We generally sign multiple-year subscription contracts but invoice quarterly or annually. The timing of our invoices to each customer is a negotiated term and varies among our subscription contracts. The amount of non-cancelable subscription contract backlog was $73.2 million as of January 31, 2017.
Maintenance backlog
Maintenance backlog consists of maintenance contracts for licenses of our proprietary software that has not been invoiced. Typical maintenance contracts are for a one-year term and are renewed annually. At times, we contractually renew for multiple years or invoice an annual contract on a quarterly basis. Accordingly, we have historically operated with little maintenance backlog. Maintenance backlog at January 31, 2017 was $23.5 million.
We expect that the amount of subscription and maintenance backlog relative to the total value of our contracts will change from year to year due to several factors, including the amount invoiced early in the contract term, the timing and duration of customer agreements, varying invoicing cycles, the timing of customer renewals, changes in customer financial circumstances and foreign currency fluctuations. Accordingly, we believe that fluctuations in backlog are not always a reliable indicator of future revenues and we do not utilize backlog as a key management metric internally.
CRITICAL ACCOUNTING POLICIES
The SEC defines “critical accounting policies” as those that require application of management’s most difficult, subjective, or complex judgments. These policies often require us to make estimates about the effects of matters that are inherently uncertain and are subject to change in subsequent periods.
We consider the following policies to be critical because of the significance of these items to our operating results and the estimation processes and management judgment involved in each:
|
● |
Revenue |
|
● |
Accounts receivable allowances for doubtful accounts |
|
● |
Capitalized software development costs |
|
● |
Goodwill and intangible assets – impairment assessments |
|
● |
Valuation of deferred tax assets and tax contingency reserves |
|
● |
Stock-based compensation |
Our senior management has reviewed these critical accounting policies and related disclosures. Historically, estimates described in our critical accounting policies that have required significant judgment and estimation on the part of management have been reasonably accurate.
Revenue. We offer our software using two models, a traditional on-premise licensing model and a cloud delivery model. The traditional model involves the sale or license of software on a perpetual basis to customers who take possession of the software and install and maintain the software on their own hardware. Under the cloud delivery model we provide access to our software on a hosted basis as a service and customers generally do not have the contractual right to take possession of the software.
Revenue is recognized when 1) persuasive evidence of an arrangement exists 2) delivery has occurred or services have been rendered 3) fees are fixed or determinable and 4) collectability is probable. If we determine that any of the four criteria is not met, we will defer recognition of revenue until all the criteria are met.
Revenue is presented net of sales, use and value-added taxes collected from our customers.
Software Revenue Recognition (On-Premise Model)
The majority of our software is sold or licensed in multiple-element arrangements that include support services and often consulting services or other elements. Delivery of software is considered to have occurred upon electronic transfer of the license key that provides immediate availability of the product to the purchaser. Determining whether and when some of the above noted revenue recognition criteria have been satisfied often involves assumptions and judgments that can have a significant impact on the timing and amount of revenue we report. Our typical payment terms vary by region. Occasionally, payment terms of up to one year may be granted for software license fees to customers with an established history of collections without concessions.
Provided all other revenue recognition criteria have been met, we recognize license revenue on delivery using the residual method when VSOE exists for all of the undelivered elements (for example, support services, consulting, or other services) in the arrangement. We allocate revenue to each undelivered element based on VSOE, which is the price charged when that element is sold separately or, for elements not yet sold separately, the price established by our management if it is probable that the price will not change before the element is sold separately. We allocate revenue to undelivered support services (maintenance) based on rates charged to renew the support services annually after an initial period. We allocate revenue to undelivered consulting services based on time and materials rates of stand-alone services engagements by role and by country. We review VSOE at least annually. If we were to be unable to establish or maintain VSOE for one or more undelivered elements within a multiple-element software arrangement, it could adversely impact revenues, results of operations and financial position because we may have to defer all or a portion of the revenue or recognize revenue ratably.
Multiple-element software arrangements for which VSOE does not exist for all undelivered elements typically occur when we introduce a new product or product bundles for which we have not established VSOE for support services or fixed fee consulting or other services. In these instances, revenue is deferred and recognized ratably over the longer of the support services (maintenance period) or consulting services engagement, assuming there are no specified future deliverables. In the instances in which it has been determined that revenue on these bundled arrangements will be recognized ratably due to lack of VSOE, at the time of recognition, we allocate revenue from these bundled arrangement fees to all of the non-license revenue categories based on VSOE of similar support services or consulting services. The remaining arrangement fees, if any, are then allocated to software license fee revenues. The associated costs primarily consist of payroll and related costs to perform both the consulting services and provide support services and royalty expense related to the license and maintenance revenue. These costs are expensed as incurred and included in cost of maintenance, subscription and other revenue, cost of professional services and cost of license fees.
Revenue from support services and product updates, referred to as maintenance revenue, is recognized ratably over the term of the maintenance period, which in most instances is one year. Software license updates provide customers with rights to unspecified software product updates, maintenance releases and patches released during the term of the support period on a when-and-if available basis. Product support includes Internet access to technical content, as well as Internet and telephone access to technical support personnel. Our customers generally purchase both product support and license updates when they acquire new software licenses. In addition, a majority of customers renew their support services contracts annually.
We occasionally resell third party systems as part of an end-to-end solution requested by our customers. Hardware revenue is recognized on a gross basis in accordance with the guidance contained in ASC 605-45, Revenue Recognition – Principal Agent Considerations. We consider delivery to occur when the product is shipped and title and risk of loss have passed to the customer.
We execute arrangements through indirect sales channels via sales agents and distributors who are authorized to market our software products to end users. In arrangements with sales agents, revenue is recognized on a sell-through basis once an order is received from the end user, collectability from the end user is probable, a signed license agreement from the end user has been received, delivery has been made to the end user and all other revenue recognition criteria have been satisfied. Sales agents are compensated on a commission basis. Distributor arrangements are those in which the resellers are authorized to market and distribute our software products to end users in specified territories and the distributor bears the risk of collection from the end user customer. We recognize revenue from transactions with distributors when the distributor submits a written purchase commitment, collectability from the distributor is probable, a signed license agreement is received from the distributor and delivery has occurred to the distributor, provided that all other revenue recognition criteria have been satisfied. Revenue from distributor transactions is recorded on a net basis (the amount actually received by us from the distributor). We do not offer rights of return, product rotation or price protection to any of our distributors.
Subscription Revenue Recognition
We recognize the following fees in subscription revenue: i) subscription fees from customers accessing our cloud and our other subscription offerings, ii) transition fees for services such as set up, configuration, database conversion and migration, and iii) support fees on hosted products. Our subscription arrangements do not generally provide customers with the right to take possession of the subscribed software.
Subscription revenue is recognized ratably over the initial subscription period committed to by the customer commencing when the customer has been given access to the cloud environment. Transition fees are recognized over the estimated life of the customer relationship once the customer has gone live. The initial subscription period is typically 12 to 60 months. Our subscription services are non-cancelable, though customers typically have the right to terminate their contracts if we materially fail to perform. We generally invoice our customers in advance in quarterly or annual installments and typical payment terms provide that customers pay us within 30 days of invoice.
We may enter into multiple-element arrangements that may include a combination of our subscription offering and other professional services or arrangements that may include both software and non-software elements. We allocate revenue to each element in an arrangement based on a selling price hierarchy in accordance with ASC 605-25, Revenue Recognition - Multiple Deliverable Revenue Arrangements. In order to treat deliverables in a multiple-deliverable arrangement as separate units of accounting, the deliverables must have standalone value upon delivery. We evaluate each element in a multiple-element arrangement to determine whether it represents a separate unit of accounting. An element constitutes a separate unit of accounting when the item has standalone value and delivery of any undelivered elements is probable and within our control. Subscription and support services have standalone value because they are routinely sold separately by us. Consulting services and other services have standalone value because we have sold consulting services separately and there are several third party vendors that routinely provide similar consulting services to our customers on a standalone basis. We determine the relative selling price for a deliverable based on its VSOE, if available, or Estimated Selling Price (“ESP”), if VSOE is not available. We have determined that third-party evidence (“TPE”) is not a practical alternative due to differences in our service offerings compared to other parties and the availability of relevant third-party pricing information. The determination for ESP is made through consultation with and approval by management taking into consideration the go-to-market strategy. As our go-to-market strategies evolve, there may be modifications of pricing practices in the future, which could result in changes in both VSOE and ESP.
For multiple-element arrangements that may include a combination of our subscription offerings and other professional services, the total arrangement fee is allocated to each element based on the VSOE / ESP value of each element. After allocation, the revenue associated with the subscription offering and other professional services are recognized as described above.
Professional Services
Revenue from consulting services, which we call professional services in the Consolidated Statements of Income and Comprehensive Income, are typically comprised of implementation, development, training or other consulting services sold along with on-premise and cloud. Consulting services are generally sold on a time-and-materials basis and can include services ranging from software installation to data conversion and building non-complex interfaces to allow the software to operate in integrated environments. We recognize revenue for time-and-materials as the service is performed or upon written acceptance from customers, if applicable, assuming all other conditions for revenue recognition have been met. Consulting engagements can range anywhere from one day to many months and are based strictly on the customer’s requirements and complexities and are independent of the functionality of our software. Our software, as delivered, can generally be used by the customer for the customer’s purpose upon installation. Further, implementation and integration services provided are generally not essential to the functionality of the software, as delivered, and do not result in any material changes to the underlying software code. On occasion, we enter into fixed fee arrangements in which customer payments are tied to achievement of specific milestones. In fixed fee arrangements, revenue is recognized as services are performed as measured by costs incurred to date, as compared to total estimated costs to be incurred to complete the work. In milestone achievement arrangements, we recognize revenue as the respective milestones are achieved.
Allowance for Bad Debt. Trade accounts receivable are recorded at the invoiced amount and do not bear interest. We review the collectability of our accounts receivable each period by analyzing balances based on age and record specific allowances for any balances that we determine may not be fully collectible due to inability of the customers to pay. We also provide for a general reserve based on historical data including analysis of write-offs and other known factors. Provisions to the allowance for bad debt are included as bad debt expense in “General and Administrative” expense. Judgment is required in adjusting our receivables to amounts we believe are realizable, especially when a customer is experiencing financial difficulty or is in bankruptcy. Although we use the best information available in making our estimates, we may incur additional bad debt expense in future periods which could have a material effect on earnings in any given quarter should additional allowances for doubtful accounts be necessary. The determination to write-off specific accounts receivable balances is made based on likelihood of collection and past due status. Past due status is based on invoice date and terms specific to each customer.
Allowance for Sales Adjustments. We do not generally provide a contractual right of return; however, in the course of business we have occasionally allowed sales adjustments related to customer dispute resolution. We record a provision against revenue for estimated sales adjustments in the same period the related revenues are recorded or when current information indicates additional amounts are required. These estimates are based on historical experience, specifically identified customers and other known factors. Although we use the best information available in making our estimates, we may incur additional provisions against revenue in future periods which could have a material effect on earnings in any given quarter should additional allowances for sales adjustments be necessary.
The accounts receivable allowance for doubtful accounts is comprised of both the allowance for bad debts and the allowance for sales adjustments.
Capitalized Software Development Costs. We capitalize software development costs incurred once technological feasibility has been achieved in the form of a working model. These costs are primarily related to the localization and translation of our products. A working model is defined as an operative version of the computer software product that is completed in the same software language as the product to be ultimately marketed, performs all the major functions planned for the product and is ready for initial customer testing. We also capitalize software purchased from third parties or through business combinations as acquired software technology if such software has reached technological feasibility. Capitalized software costs are amortized on a product-by-product basis and charged to “Cost of license fees.” The amortization of capitalized software costs is the greater of the straight-line basis over three years, the expected useful life, or computed using a ratio of current revenue for a product compared to the estimated total of current and future revenues for that product. We periodically compare the unamortized capitalized software costs to the estimated net realizable value of the associated product. The amount by which the unamortized capitalized software costs of a particular software product exceed the estimated net realizable value of that asset is reported as a charge to the consolidated statement of income and comprehensive income. This review requires management judgment regarding future cash flows. If these estimates or their related assumptions require updating in the future, we may incur substantial losses due to the write-down or write-off of these assets.
Goodwill and Intangible Assets – Impairment Assessments. When we acquire a business, a portion of the purchase consideration is typically allocated to acquired technology and other identifiable intangible assets, such as customer relationships and developed technology. The excess of the purchase consideration over the net of the acquisition-date fair value of identifiable assets acquired and liabilities assumed is recorded as goodwill. The amounts allocated to acquired technology and other intangible assets represent our estimates of their fair values at the acquisition date. We amortize the acquired technology and other intangible assets with finite lives over their estimated useful lives. The estimation of acquisition-date fair values of intangible assets and their useful lives requires us to make assumptions and judgments, including but not limited to an evaluation of macroeconomic conditions as they relate to our business, industry and market trends, projections of future cash flows and appropriate discount rates.
We review the carrying value of goodwill using the methodology prescribed in FASB Accounting Standards Codification 350 Intangibles—Goodwill and Other. We test goodwill for impairment annually in our fourth fiscal quarter or sooner should events or changes in circumstances indicate potential impairment as required under Accounting Standard Update No. 2011-08, Testing Goodwill for Impairment (“ASU 2011-08”). ASU 2011-08 provides for an optional assessment of qualitative factors of impairment (“optional assessment”) prior to necessitating a two-step quantitative impairment test. Should the optional assessment be utilized for any given fiscal year, qualitative factors to consider include cost factors; financial performance; legal, regulatory, contractual, political, business, or other factors; entity specific factors; industry and market considerations; macroeconomic conditions; and other relevant events and factors affecting the reporting unit. If, after assessing the totality of events or circumstances, it is more likely than not that the fair value of the reporting unit is greater than its carrying value, then performing the two-step impairment test is unnecessary.
Under the two-step quantitative impairment test, we use discounted cash flow models which include assumptions regarding projected cash flows. Variances in these assumptions could have a significant impact on our conclusion as to whether goodwill is impaired, or the amount of any impairment charge. Impairment charges, if any, result from instances where the fair values of net assets associated with goodwill are less than their carrying values. As changes in business conditions and our assumptions occur, we may be required to record impairment charges.
Management evaluates the Company as a single reporting unit for business and operating purposes as almost all of our revenue streams are generated by the same underlying technology whether acquired, purchased or developed. In addition, the majority of our costs are, by their nature, shared costs that are not specifically identifiable to a geography or product line but relate to almost all products. As a result, there is a high degree of interdependency among our revenues and cash flows for levels below the consolidated entity and identifiable cash flows for a reporting unit separate from the consolidated entity are not meaningful.
For our annual impairment assessment in fiscal 2017, 2016 and 2015 we did not utilize the optional assessment. An impairment analysis was performed at the enterprise level which compared our market capitalization to our net assets as of the test date, November 30. As our market capitalization substantially exceeded our net assets, there was no indication of goodwill impairment for fiscal 2017, 2016 and 2015.
We make judgments about the recoverability of purchased finite lived intangible assets whenever events or changes in circumstances indicate that an impairment may exist. Each fiscal year we evaluate the estimated remaining useful lives of purchased intangible assets and whether events or changes in circumstances warrant a revision to the remaining periods of amortization. Recoverability of finite lived intangible assets is measured by comparison of the carrying amount of the asset to the future undiscounted cash flows the asset is expected to generate.
Assumptions and estimates about future values and remaining useful lives of our intangible assets are complex and subjective. They can be affected by a variety of factors, including external factors such as industry and economic trends and internal factors such as changes in our business strategy and our internal forecasts. Although we believe the historical assumptions and estimates we have made are reasonable and appropriate, different assumptions and estimates could materially impact our reported financial results. We did not recognize any intangible asset impairment charges in fiscal 2017, 2016 and 2015.
Valuation of Deferred Tax Assets. The carrying value of our deferred tax assets reflects an amount that is more likely than not to be realized. At January 31, 2017, we had $7.9 million of deferred tax assets, net of valuation allowances and uncertain tax positions, consisting of $38.7 million of gross deferred tax assets offset by valuation allowances of $29.9 million and uncertain tax positions of $0.9 million. In assessing the likelihood of realizing tax benefits associated with deferred tax assets and the need for a valuation allowance we consider the weight of all available evidence both positive and negative including expected future taxable income and tax planning strategies that are both prudent and feasible. For the U.S. federal jurisdiction, the positive evidence was outweighed by the U.S. three-year cumulative loss, a fiscal 2018 projected loss for the U.S. federal jurisdiction, and future dedicated investment necessary to transition the U.S. business to cloud. Management concluded that the weight of this negative evidence warranted placing a full valuation allowance on all its U.S. federal net deferred tax assets. The majority of QAD’s state deferred tax assets are California research and development tax credits. This jurisdiction was analyzed separately because QAD’s California return is filed on a worldwide basis. A significant decrease in current and forecast income both within and outside the US, along with a recent, significant drop in the California apportionment percentage, led management to conclude that a full valuation allowance on QAD’s state deferred tax assets was also necessary. In total, a full valuation allowance of $16.3 million was placed against QAD’s U.S. federal and state net deferred tax assets. Worldwide there was a net increase of valuation allowances recorded in fiscal 2017 of $16.4 million. QAD adopted ASU 2013-11 during the first quarter of fiscal year 2015. This standard requires the netting of unrecognized tax benefits against deferred tax assets for a loss or credit that would apply in settlement of the uncertain tax position. During fiscal year 2017, we also adopted ASU 2015-17 which requires us to classify all of our deferred tax assets/liabilities as non-current.
Tax Contingency Reserves. We are subject to income taxes in the U.S. and in various foreign jurisdictions. Significant judgment is required in determining our worldwide income tax position. In the ordinary course of a global business, there are transactions and calculations where the ultimate tax outcome is uncertain. Our estimate of the potential outcome for any uncertain tax position requires judgment. For tax related contingencies, we account for uncertain tax positions based on a two-step approach: recognition and measurement. We recognize a tax position when we determine that it is more likely than not that the position will be sustained upon ultimate settlement with a taxing authority that has full knowledge of all relevant information. For those positions that do not meet the recognition threshold, no tax benefit is recognized in the financial statements. For those tax positions that meet the recognition threshold, we measure the tax position as the largest amount of benefit that has a greater than 50% likelihood of being realized upon ultimate settlement. We record interest and penalties related to income tax liabilities as income tax expense. We have reserves to address tax positions that could be challenged by taxing authorities, even though we believe that the positions taken are appropriate. Our tax reserves are reviewed on a quarterly basis and adjusted as events occur that could affect our liability.
Stock-Based Compensation. We account for share-based payments (“equity awards”) to employees in accordance with ASC 718, Compensation—Stock Compensation (“ASC 718”), which requires that share-based payments (to the extent they are compensatory) be recognized in our Consolidated Statements of Income and Comprehensive Income based on their fair values as measured at the grant date. The fair value of an equity award is recognized as stock-based compensation expense ratably over the vesting period of the equity award. Determining the fair value of stock-based awards at the grant date requires judgment and the fair value per share of historical grants of equity awards may not be indicative of the fair value per share for future grants of equity awards.
Fair Value of SARs
The fair value of stock-settled stock appreciation rights (“SARs”) is determined on the grant date of the award using the Black-Scholes-Merton valuation model. One of the inputs to the Black-Scholes-Merton valuation model is the fair market value on the date of the grant. As our stock price fluctuates, so does the fair value of our future SAR grants. Judgment is required in determining the remaining inputs to the Black-Scholes-Merton valuation model. Furthermore, the values underlying these inputs fluctuate, which impacts the fair value of our future SAR grants. These inputs include the expected life, volatility, the risk-free interest rate and the dividend rate. The following describes our policies with respect to determining these valuation inputs:
Expected Life – The expected life valuation input includes a computation that is based on historical vested SAR exercises and post-vest expiration patterns and an estimate of the expected life for SARs that were fully vested and outstanding. Furthermore, based on our historical pattern of SAR exercises and post-vest expiration patterns we determined that there are two discernible populations, which include QAD’s directors and officers and all other QAD employees. The estimate of the expected life for SARs that were fully vested and outstanding was determined as the midpoint of a range as follows: the low end of the range assumes the fully vested and outstanding SARs are exercised or expire unexercised on the evaluation date and the high end of the range assumes that these SARs are exercised or expire unexercised upon contractual term.
Volatility – The volatility valuation input is based on the historical volatility of our common stock, which we believe is representative of the expected volatility over the expected life of options and SARs.
Risk Free Interest Rate – The risk-free interest rate is based on the U.S. Treasury constant maturities in effect at the time of grant for the expected term of the SAR.
Dividend Rate – The dividend rate is based on our historical dividend payments per share. Historically, have we paid quarterly dividends at a rate of $0.072 per share of Class A common stock and $0.060 per share of Class B common stock.
Fair Value of RSUs
The fair value of restricted stock units (“RSUs”) is determined on the grant date of the award as the market price of our common stock on the date of grant, reduced by the present value of estimated dividends foregone during the vesting period. As our stock price fluctuates, so does the fair value of our future RSU grants. Judgment is required in determining the present value of estimated dividends foregone during the vesting period. We estimate the dividends for purposes of this calculation based on our historical dividend payments per share, which has remained consistent over the last three years.
We record deferred tax assets for equity awards that result in deductions on our income tax returns, based on the amount of stock-based compensation recognized and the fair values attributable to the vested portion of those equity awards. Because the deferred tax assets we record are based upon the stock-based compensation expenses in a particular jurisdiction, the aforementioned inputs that affect the fair values of our equity awards may also indirectly affect our income tax expense. If the tax deduction is less than the deferred tax asset, the calculated shortfall would increase our income tax expense. If the tax deduction is more than the deferred tax asset, the calculated windfall would decrease our income tax expense.
We elected to early adopt the new guidance provided by ASU 2016-09, Improvements to Employee Share-Based Payment Accounting in the third quarter of fiscal year 2017. At adoption, we elected to account for forfeitures as they occur.
To the extent we change the terms of our employee stock-based compensation programs or experience fluctuations in the underlying criteria used to determine our equity award valuations, among other potential impacts, the stock-based compensation expense that we record in future periods and the tax benefits that we realize may differ significantly from what we have recorded in previous reporting periods.
RECENTLY ISSUED ACCOUNTING STANDARDS
For a full description of recent accounting pronouncements, including the expected dates of adoption and estimated effects on results of operations and financial condition, see Note 1 “Summary of Business and Significant Accounting Policies” within the Notes to Consolidated Financial Statements included in Item 15 of this Annual Report on Form 10-K.
RESULTS OF OPERATIONS
We operate in several geographical regions as described in Note 12 “Business Segment Information” within the Notes to Consolidated Financial Statements. In order to present our results of operations without the effects of changes in foreign currency exchange rates, we provide certain financial information on a “constant currency basis”, which is in addition to the actual financial information presented in the following tables. In order to calculate our constant currency results, we apply the current foreign currency exchange rates to the prior period results.
Revenue
|
Year Ended |
Year Ended |
Change in |
Change due |
Total Change |
||||||||||||||||||||
|
(in thousands) |
January 31, 2017 | January 31, 2016 | Currency | Fluctuations |
$ |
% |
||||||||||||||||||
|
Revenue |
||||||||||||||||||||||||
|
Subscription fees |
$ | 52,167 | $ | 38,806 | $ | 14,155 | $ | (794 |
) |
$ | 13,361 | 34 |
% | |||||||||||
|
Percentage of total revenue |
19 |
% |
14 |
% |
||||||||||||||||||||
|
License fees |
23,633 | 29,891 | (5,677 |
) |
(581 |
) |
(6,258 |
) |
-21 |
% | ||||||||||||||
|
Percentage of total revenue |
8 |
% |
11 |
% |
||||||||||||||||||||
|
Maintenance and other |
130,406 | 132,962 | (660 |
) |
(1,896 |
) |
(2,556 |
) |
-2 |
% | ||||||||||||||
|
Percentage of total revenue |
47 |
% |
48 |
% |
||||||||||||||||||||
|
Professional services |
71,767 | 76,193 | (3,135 |
) |
(1,291 |
) |
(4,426 |
) |
-6 |
% | ||||||||||||||
|
Percentage of total revenue |
26 |
% |
27 |
% |
||||||||||||||||||||
|
Total revenue |
$ | 277,973 | $ | 277,852 | $ | 4,683 | $ | (4,562 |
) |
$ | 121 | 0 |
% | |||||||||||
|
Year Ended |
Year Ended |
Change in |
Change due |
Total Change |
||||||||||||||||||||
|
(in thousands) |
January 31, 2016 | January 31, 2015 | Currency | Fluctuations | $ |
% |
||||||||||||||||||
|
Revenue |
||||||||||||||||||||||||
|
Subscription fees |
$ | 38,806 | $ | 28,217 | $ | 11,533 | $ | (944 |
) |
$ | 10,589 | 38 |
% | |||||||||||
|
Percentage of total revenue |
14 |
% |
9 |
% |
||||||||||||||||||||
|
License fees |
29,891 | 40,917 | (8,487 |
) |
(2,539 |
) |
(11,026 |
) |
-27 |
% | ||||||||||||||
|
Percentage of total revenue |
11 |
% |
14 |
% |
||||||||||||||||||||
|
Maintenance and other |
132,962 | 141,295 | 1,411 | (9,744 |
) |
(8,333 |
) |
-6 |
% | |||||||||||||||
|
Percentage of total revenue |
48 |
% |
48 |
% |
||||||||||||||||||||
|
Professional services |
76,193 | 84,672 | (1,788 |
) |
(6,691 |
) |
(8,479 |
) |
-10 |
% | ||||||||||||||
|
Percentage of total revenue |
27 |
% |
29 |
% |
||||||||||||||||||||
|
Total revenue |
$ | 277,852 | $ | 295,101 | $ | 2,669 | $ | (19,918 |
) |
$ | (17,249 |
) |
-6 |
% | ||||||||||
Total Revenue. On a constant currency basis, total revenue was $278.0 million and $273.3 million for fiscal 2017 and 2016, representing a $4.7 million, or 2%, increase from the prior year. When comparing categories within total revenue at constant rates, our results for fiscal 2017 included an increase in subscription revenue partially offset by decreases in license fees and professional services revenue. Maintenance and other revenue was generally flat on a constant currency basis. Our customers are widely dispersed and no single customer accounted for more than 10% of total revenue in any of the last three fiscal years. Revenue outside the North America region as a percentage of total revenue was 53% and 54% for fiscal 2017 and 2016, respectively. On a constant currency basis, total revenue increased in our North America, Latin America and Asia Pacific regions and was flat in our EMEA region during fiscal 2017 when compared to the same period last year. Our products are sold to manufacturing companies that operate mainly in the following six industries: automotive, consumer products, food and beverage, high technology, industrial products and life sciences. Given the similarities between consumer products and food and beverage as well as between high technology and industrial products, we aggregate them for management review. The following table presents revenue by industry for fiscal 2017, 2016 and 2015:
|
Years Ended January 31, |
||||||||||||
|
2017 |
2016 |
2015 |
||||||||||
|
Automotive |
35 |
% |
32 |
% |
30 |
% | ||||||
|
Consumer products and food and beverage |
16 |
% |
21 |
% |
21 |
% | ||||||
|
High technology and industrial products |
33 |
% |
33 |
% |
33 |
% | ||||||
|
Life sciences |
16 |
% |
14 |
% |
16 |
% | ||||||
|
Total revenue |
100 |
% |
100 |
% |
100 |
% | ||||||
On a constant currency basis, total revenue was $277.9 million and $275.2 million for fiscal 2016 and 2015, representing a $2.7 million, or 1%, increase from the prior year. When comparing categories within total revenue at constant rates, our results for fiscal 2016 included increases in subscription and maintenance revenue and decreases in license and professional services revenue. Revenue outside the North America region as a percentage of total revenue was 54% and 56% for fiscal 2016 and 2015, respectively. On a constant currency basis, total revenue increased in our Latin America and Asia Pacific regions and decreased in our North America and EMEA regions during fiscal 2016 when compared to the prior year.
Subscription Revenue. On a constant currency basis, subscription revenue was $52.2 million and $38.0 million for fiscal 2017 and 2016, respectively, representing a $14.2 million, or 37%, increase from the prior year. On a constant currency basis, subscription revenue increased across all regions during fiscal 2017 when compared to the prior year. The increase in subscription revenue was primarily due to sales of QAD Enterprise Applications in the cloud, which represented over 85% of total subscription revenue in fiscal 2017 and 2016. Cloud revenue consists of new customer sites; existing Enterprise Applications users converting from on-premise; and additional users and modules purchased by our existing cloud customers. Approximately half of our cloud revenue comes from existing customers converting Enterprise Applications users to cloud users and the other half comes from new customers and new modules. Our cloud customer retention rate is in excess of 90%.
The following table presents cloud revenue by region for fiscal 2017, 2016 and 2015:
|
Years Ended January 31, |
||||||||||||
|
2017 |
2016 |
2015 |
||||||||||
|
North America |
60 |
% |
61 |
% |
65 |
% | ||||||
|
Asia Pacific |
15 |
% |
15 |
% |
15 |
% | ||||||
|
EMEA |
17 |
% |
14 |
% |
14 |
% | ||||||
|
Latin America |
8 |
% |
10 |
% |
6 |
% | ||||||
|
Total cloud revenue |
100 |
% |
100 |
% |
100 |
% | ||||||
The following table presents cloud revenue by industry for fiscal 2017, 2016 and 2015:
|
Years Ended January 31, |
||||||||||||
|
2017 |
2016 |
2015 |
||||||||||
|
Automotive |
39 |
% |
42 |
% |
41 |
% | ||||||
|
Consumer products and food and beverage |
15 |
% |
16 |
% |
18 |
% | ||||||
|
High technology and industrial products |
18 |
% |
16 |
% |
16 |
% | ||||||
|
Life sciences |
28 |
% |
26 |
% |
25 |
% | ||||||
|
Total cloud revenue |
100 |
% |
100 |
% |
100 |
% | ||||||
We expect the growth rate of subscription revenue in the future to be primarily attributable to growth in sales of our QAD Enterprise Applications in the cloud.
On a constant currency basis, subscription revenue was $38.8 million and $27.3 million for fiscal 2016 and 2015, respectively, representing an $11.5 million, or 41%, increase from the prior year. On a constant currency basis, subscription revenue increased across all regions during fiscal 2016 when compared to the prior year.
License Revenue. On a constant currency basis, license revenue was $23.6 million and $29.3 million for fiscal 2017 and 2016, representing a $5.7 million, or 19%, decrease from the prior year. On a constant currency basis, license revenue decreased in our North America, EMEA and Asia Pacific regions and was flat in our Latin America region during fiscal 2017 when compared to the same period last year. One of the metrics that management uses to measure license revenue performance is the number of customers that have placed sizable license orders in the period. During fiscal 2017, 15 customers placed license orders totaling more than $0.3 million, two of which exceeded $1.0 million. This compared to fiscal 2016 in which 18 customers placed license orders totaling more than $0.3 million, none of which exceeded $1.0 million. The majority of our license revenue has come from additional users and module purchases from our existing customers. As cloud revenue increases we expect license revenue to decline.
On a constant currency basis, license revenue was $29.9 million and $38.4 million for fiscal 2016 and 2015, representing an $8.5 million, or 21%, decrease from the prior year. On a constant currency basis, license revenue decreased in our North America, EMEA and Asia Pacific regions and increased in our Latin America region during fiscal 2016 when compared to the prior year. During fiscal 2016, 18 customers placed license orders totaling more than $0.3 million, none of which exceeded $1.0 million. This compared to fiscal 2015 in which 21 customers placed license orders totaling more than $0.3 million, five of which exceeded $1.0 million.
Maintenance and Other Revenue. On a constant currency basis, maintenance and other revenue was $130.4 million and $131.1 million for fiscal 2017 and 2016, respectively, representing a $0.7 million, or 1%, decrease from the prior year. On a constant currency basis, maintenance and other revenue decreased slightly in our North America, EMEA and Asia Pacific regions and increased in our and Latin America region during fiscal 2017 when compared to the prior year. When customers convert to the cloud they no longer pay for maintenance as those support services are included as a component of the subscription offering. We continue to see renewal rates consistent with history; however, conversions from on-premise to cloud will result in future decreases in maintenance revenue.
On a constant currency basis, maintenance and other revenue was $133.0 million and $131.6 million for fiscal 2016 and 2015, respectively, representing a $1.4 million, or 1%, increase from the prior year. On a constant currency basis, maintenance and other revenue increased in our EMEA, Asia Pacific and Latin America regions and decreased in our North America region during fiscal 2016 when compared to the prior year. The increase in maintenance and other revenue was primarily attributable to sales of new licenses partially offset by the impact of customers converting to the cloud.
We track our retention rate of cloud and maintenance by calculating the annualized revenue of customer sites with contracts up for renewal during the period compared to the annualized revenue associated with the customer sites that have canceled during the period. The percentage of revenue not canceled is our retention rate. Conversions to the cloud are not considered cancellations for purposes of the maintenance retention rate calculation. Our maintenance retention rate has remained in excess of 90% for fiscal 2017, 2016 and 2015.
Professional Services Revenue. On a constant currency basis, professional services revenue was $71.8 million and $74.9 million for fiscal 2017 and 2016, respectively, representing a $3.1 million, or 4%, decrease from the prior year. On a constant currency basis, professional services revenue decreased in our North America, EMEA and Latin America regions and increased in our Asia Pacific region during fiscal 2017 when compared to the prior year. The decrease in professional services revenue period over period can be attributed to a lower number of engagements. Our professional services revenue is generated from discretionary upgrade projects for existing customers in addition to new implementations. These projects are affected by general economic conditions in the manufacturing industry and our customers' businesses. As a result, global economic uncertainty can cause on-going projects to slow down, resulting in reduced monthly spend for our customers, while new projects can get delayed until conditions start to improve. The manufacturing industry experienced a slowdown beginning in the second half of fiscal 2016 through the first half of fiscal 2017 as shown by the purchasing manufacturers’ index. As the manufacturing industry improved beginning in the third quarter of fiscal 2017, services revenue increased in the second half of the year.
On a constant currency basis, professional services revenue was $76.2 million and $78.0 million for fiscal 2016 and 2015, respectively, representing a $1.8 million, or 2%, decrease from the prior year. On a constant currency basis, professional services revenue decreased in our North America, EMEA and Asia Pacific regions and increased in our Latin America region during fiscal 2016 when compared to the prior year. The decrease in professional services revenue period over period can be attributed to engagements in which we recognized a lower amount of professional services revenue per customer.
Total Cost of Revenue
|
Year Ended |
Year Ended |
Change in |
Change due |
Total Change |
||||||||||||||||||||
|
(in thousands) |
January 31, 2017 | January 31, 2016 | Currency | Fluctuations | $ |
% |
||||||||||||||||||
|
Cost of revenue |
||||||||||||||||||||||||
|
Cost of subscription |
$ | 27,027 | $ | 20,635 | $ | (6,504 |
) |
$ | 112 | $ | (6,392 |
) |
-31 |
% | ||||||||||
|
Cost of license fees |
2,990 | 3,624 | 633 | 1 | 634 | 17 |
% | |||||||||||||||||
|
Cost of maintenance and other |
30,517 | 30,973 | 198 | 258 | 456 | 1 |
% | |||||||||||||||||
|
Cost of professional services |
70,317 | 71,330 | (29 |
) |
1,042 | 1,013 | 1 |
% | ||||||||||||||||
|
Total cost of revenue |
$ | 130,851 | $ | 126,562 | $ | (5,702 |
) |
$ | 1,413 | $ | (4,289 |
) |
-3 |
% | ||||||||||
|
Percentage of revenue |
47 |
% |
46 |
% |
||||||||||||||||||||
|
Year Ended |
Year Ended |
Change in |
Change due |
Total Change |
||||||||||||||||||||
|
(in thousands) |
January 31, 2016 |
January 31, 2015 |
Currency |
Fluctuations |
$ |
% |
||||||||||||||||||
|
Cost of revenue |
||||||||||||||||||||||||
|
Cost of subscription |
$ | 20,635 | $ | 17,149 | $ | (3,956 |
) |
$ | 470 | $ | (3,486 |
) |
-20 |
% | ||||||||||
|
Cost of license fees |
3,624 | 5,016 | 1,336 | 56 | 1,392 | 28 |
% | |||||||||||||||||
|
Cost of maintenance and other |
30,973 | 32,511 | 6 | 1,532 | 1,538 | 5 |
% | |||||||||||||||||
|
Cost of professional services |
71,330 | 76,954 | (347 |
) |
5,971 | 5,624 | 7 |
% | ||||||||||||||||
|
Total cost of revenue |
$ | 126,562 | $ | 131,630 | $ | (2,961 |
) |
$ | 8,029 | $ | 5,068 | 4 |
% | |||||||||||
|
Percentage of revenue |
46 |
% |
45 |
% |
||||||||||||||||||||
Total cost of revenue consists of cost of subscription, cost of license fees, cost of maintenance and other and cost of professional services. Cost of subscription includes salaries, benefits, bonuses of our cloud operations group located in the U.S. and India; stock-based compensation for those employees; hardware and hosting costs; royalties; professional fees; travel; and an allocation of information technology and facilities costs. Cost of license fees includes license royalties, amortization of capitalized software costs and fulfillment. Cost of maintenance and other includes salaries, benefits and bonuses of our support group, stock-based compensation for those employees, travel expense, professional fees, fulfillment and an allocation of information technology and facilities costs. Cost of professional services includes salaries, benefits and bonuses costs of fulfilling service contracts, stock-based compensation for those employees, third-party contractor expense, travel expense for services employees and an allocation of information technology and facilities costs.
Total Cost of Revenue. On a constant currency basis, total cost of revenue (combined cost of subscription, cost of license fees, cost of maintenance and other and cost of professional services) was $130.9 million and $125.1 million for fiscal 2017 and 2016, respectively and as a percentage of total revenue was 47% for fiscal 2017 and 46% for fiscal 2016. The increase in total cost of revenue as a percentage of total revenue was mainly due to lower professional services margin and the shift in our revenue mix from on-premise licenses to cloud. The non-currency related increase in cost of revenue of $5.8 million, or 5%, in fiscal 2017 compared to fiscal 2016 was primarily due to higher hosting and personnel costs associated with the growth of our cloud business which were partially offset by a decrease in license royalties related to a decline in license revenue.
On a constant currency basis, total cost of revenue (combined cost of subscription, cost of license fees, cost of maintenance and other and cost of professional services) was $126.6 million and $123.6 million for fiscal 2016 and 2015, respectively, and as a percentage of total revenue was 46% for fiscal 2016 and 45% for fiscal 2015. The non-currency related increase in cost of revenue of $3.0 million, or 2%, in fiscal 2016 compared to fiscal 2015 was primarily due to higher personnel and hosting costs associated with higher subscription revenue; and higher services personnel costs partially offset by lower subcontractor costs. The increases in cost of subscription and professional services were partially offset by a decrease in license royalties related to a decline in license revenue.
Cost of Subscription. On a constant currency basis, cost of subscription was $27.0 million and $20.5 million for fiscal 2017 and 2016, respectively, representing an increase of $6.5 million, or 32%. The non-currency related increase in cost of subscription of $6.5 million in fiscal 2017 compared to fiscal 2016 was primarily due to higher hosting costs of $3.5 million, higher salaries and related costs of $0.9 million as a result of higher headcount of approximately 16 people, higher subcontractor costs of $0.7 million and higher professional fees of $0.3 million. In addition, cost of subscription included higher personnel costs from other departments who worked on cloud engagements of $1.0 million. Cost of subscription as a percentage of subscription revenue was 52% and 53% in fiscal 2017 and 2016, respectively. We expect to continue to improve our subscription margins over time, but we also anticipate fluctuations in our subscription margins as we make investments to support future growth.
On a constant currency basis, cost of subscription was $20.6 million and $16.7 million for fiscal 2016 and 2015, respectively, representing an increase of $3.9 million, or 23%. The non-currency related increase in cost of subscription of $3.9 million in fiscal 2016 compared to fiscal 2015 was primarily due to higher hosting costs of $1.9 million, higher salaries and related costs of $1.5 million as a result of higher headcount of approximately six people and higher information technology and facilities allocated costs of $0.4 million. Cost of subscription as a percentage of subscription revenue was 53% and 61% in fiscal 2016 and 2015, respectively.
Cost of License Fees. On a constant currency basis, cost of license fees was $3.0 million and $3.6 million for fiscal 2017 and 2016, respectively, representing a decrease of $0.6 million, or 17%. Cost of license fees in fiscal 2017 compared to fiscal 2016 included lower royalties associated with lower license revenue. As a percent of revenue, royalty expense remained consistent year over year.
On a constant currency basis, cost of license fees was $3.6 million and $5.0 million for fiscal 2016 and 2015, respectively, representing a decrease of $1.3 million, or 27%. Cost of license fees in fiscal 2016 compared to fiscal 2015 included lower royalties associated with lower license revenue and lower fulfillment costs. As a percent of revenue, royalty expense remained consistent year over year.
Cost of Maintenance and Other. On a constant currency basis, cost of maintenance and other was $30.5 million and $30.7 million for fiscal 2017 and 2016, respectively, representing a decrease of $0.2 million, or 1%. The year over year decrease in cost of maintenance and other was primarily related to lower royalties of $0.3 million. Cost of maintenance and other as a percentage of maintenance and other revenue was 23% in both fiscal 2017 and 2016.
On a constant currency basis, cost of maintenance and other was $31.0 million for both fiscal 2016 and 2015. The year over year change in cost of maintenance and other included lower royalties of $0.5 million partially offset by higher salaries and related costs of $0.4 million. Cost of maintenance and other as a percentage of maintenance and other revenue was 23% in both fiscal 2016 and 2015.
Cost of Professional Services. On a constant currency basis, cost of professional services was $70.3 million for both fiscal 2017 and 2016. The non-currency related changes in cost of professional services in fiscal 2017 compared to fiscal 2016 included higher salaries and related costs of $1.4 million, as a result of higher headcount of approximately 18 people, higher bonuses of $0.5 million, higher information technology and facilities allocated costs of $0.4 million partially offset by lower third-party contractor costs of $0.6 million and lower travel of $0.4 million. In addition, professional services costs benefited from higher cost relief of $1.6 million related to staff who worked on cloud engagements and sales activities. Cost of professional services as a percentage of professional services revenues was 98% for fiscal 2017 and 94% for fiscal 2016.
On a constant currency basis, cost of professional services was $71.3 million and $71.0 million for fiscal 2016 and 2015, respectively, representing an increase of $0.3 million. The non-currency related increase in cost of professional services of $0.3 million in fiscal 2016 compared to fiscal 2015 was due primarily to higher salaries and related costs of $3.0 million, as a result of higher headcount of approximately 19 people, and higher information technology and facilities allocated costs of $0.4 million partially offset by lower third-party contractor costs of $2.4 million and lower bonuses of $0.7 million. Cost of professional services as a percentage of professional services revenues was 94% for fiscal 2016 and 91% for fiscal 2015.
Sales and Marketing
|
Year Ended |
Year Ended |
Change in |
Change due |
Total Change |
||||||||||||||||||||
|
(in thousands) |
January 31, 2017 | January 31, 2016 | Currency | Fluctuations |
$ |
% |
||||||||||||||||||
|
Sales and marketing |
$ | 67,194 | $ | 66,535 | $ | (1,514 |
) |
$ | 855 | $ | (659 |
) |
-1 | % | ||||||||||
|
Percentage of revenue |
24 |
% |
24 |
% |
||||||||||||||||||||
|
Year Ended |
Year Ended |
Change in Constant |
Change due |
Total Change |
||||||||||||||||||||
|
(in thousands) |
January 31, 2016 | January 31, 2015 | Currency | Fluctuations | $ |
% |
||||||||||||||||||
|
Sales and marketing |
$ | 66,535 | $ | 69,785 | $ | (964 |
) |
$ | 4,214 | $ | 3,250 | 5 |
% | |||||||||||
|
Percentage of revenue |
24 |
% |
24 |
% |
||||||||||||||||||||
Sales and marketing expense includes salaries, benefits, bonuses, stock-based compensation and travel expense for our sales and marketing employees in addition to costs of programs aimed at increasing revenue, such as trade shows, user group events, advertising and various sales and promotional programs. Sales and marketing expense also includes personnel costs of order processing, sales agent fees and an allocation of information technology and facilities costs. We pay and expense commissions for cloud deals at the time the contract is signed, whereas the related revenue is recognized in future periods.
On a constant currency basis, sales and marketing expense was $67.2 million and $65.7 million for fiscal 2017 and 2016, respectively, representing an increase of $1.5 million, or 2%. The non-currency related increase in sales and marketing expense of $1.5 million in fiscal 2017 compared to fiscal 2016 was primarily due to higher bonuses of $0.3 million, higher marketing expense of $0.3 million, higher payroll taxes of $0.2 million, higher leave expense of $0.2 million and higher information technology and facilities allocated costs of $0.2 million partially offset by lower travel of $0.4 million. In addition, sales and marketing expense was negatively impacted by lower cost relief of $0.7 million related to sales and marketing employees working on services engagements in the prior year.
On a constant currency basis, sales and marketing expense was $66.5 million and $65.6 million for fiscal 2016 and 2015, respectively, representing an increase of $0.9 million, or 1%. The non-currency related increase in sales and marketing expense of $0.9 million in fiscal 2016 compared to fiscal 2015 was primarily due to higher salaries and related costs of $1.4 million, as a result of higher headcount of approximately 11 people, higher stock compensation of $0.6 million, higher travel of $0.5 million, higher expenses of $0.3 million related to our annual Explore user conference, higher professional fees of $0.2 million and higher information technology and facilities allocated costs of $0.2 million partially offset by lower commissions of $1.7 million and lower bonuses of $0.5 million.
Research and Development
|
Year Ended |
Year Ended |
Change in |
Change due |
Total Change |
||||||||||||||||||||
|
(in thousands) |
January 31, 2017 |
January 31, 2016 |
Currency |
Fluctuations |
$ |
% |
||||||||||||||||||
|
Research and development |
$ | 43,587 | $ | 41,237 | $ | (2,743 |
) |
$ | 393 | $ | (2,350 |
) |
-6 |
% | ||||||||||
|
Percentage of revenue |
16 |
% |
15 |
% |
||||||||||||||||||||
|
Year Ended |
Year Ended |
Change in |
Change due |
Total Change |
||||||||||||||||||||
|
(in thousands) |
January 31, 2016 |
January 31, 2015 |
Currency |
Fluctuations |
$ |
% |
||||||||||||||||||
|
Research and development |
$ | 41,237 | $ | 42,315 | $ | (924 |
) |
$ | 2,002 | $ | 1,078 | 3 |
% | |||||||||||
|
Percentage of revenue |
15 |
% |
14 |
% |
||||||||||||||||||||
Research and development is expensed as incurred and consists primarily of salaries, benefits, bonuses, stock-based compensation, training and travel expense for research and development employees and professional services, such as fees paid to software development firms and independent contractors. Research and development expense also includes an allocation of information technology and facilities costs, and is reduced by reimbursements from joint development projects. As part of our vertical focus we regularly seek to engage in joint development arrangements with our customers in order to enhance specific functionality and industry experience, although the number and size of joint development arrangements may fluctuate.
On a constant currency basis, research and development expense was $43.6 million and $40.8 million for fiscal 2017 and 2016, respectively, representing an increase of $2.8 million, or 7%. The non-currency related increase in research and development expense of $2.8 million in fiscal 2017 compared to fiscal 2016 was primarily due to higher salaries and related costs of $1.7 million, as a result of higher headcount of approximately 29 people, higher information technology and facilities allocated costs of $0.4 million, higher bonuses of $0.3 million and higher professional fees of $0.3 million.
On a constant currency basis, research and development expense was $41.2 million and $40.3 million for fiscal 2016 and 2015, respectively, representing an increase of $0.9 million, or 2%. The non-currency related increase in research and development expense of $0.9 million in fiscal 2016 compared to fiscal 2015 was primarily due to higher salaries and related costs of $0.6 million, as a result of higher headcount of approximately 6 people, and higher stock compensation of $0.4 million partially offset by lower bonuses of $0.9 million. In addition, research and development expense was negatively impacted by higher cost relief in the prior period of $0.7 million for costs related to staff who worked on service engagements.
General and Administrative
|
Year Ended |
Year Ended |
Change in |
Change due |
Total Change |
||||||||||||||||||||
|
(in thousands) |
January 31, 2017 | January 31, 2016 | Currency | Fluctuations |
$ |
% |
||||||||||||||||||
|
General and administrative |
$ | 32,318 | $ | 32,689 | $ | (141 |
) |
$ | 512 | $ | 371 | 1 |
% | |||||||||||
|
Percentage of revenue |
12 |
% |
11 |
% |
||||||||||||||||||||
|
Year Ended |
Year Ended |
Change in |
Change due |
Total Change |
||||||||||||||||||||
|
(in thousands) |
January 31, 2016 | January 31, 2015 | Currency | Fluctuations |
$ |
% |
||||||||||||||||||
|
General and administrative |
$ | 32,689 | $ | 34,680 | $ | 845 | $ | 1,146 | $ | 1,991 | 6 |
% | ||||||||||||
|
Percentage of revenue |
11 |
% |
12 |
% |
||||||||||||||||||||
General and administrative expense includes salaries, benefits, bonuses, stock-based compensation and travel expense for our finance, human resources, legal and executive personnel, as well as professional fees for accounting and legal services, bad debt expense and an allocation of information technology and facilities costs.
On a constant currency basis, general and administrative expense was $32.3 million and $32.2 million for fiscal 2017 and 2016, respectively, representing a increase of $0.1 million. The non-currency related increase in general and administrative expense of $0.1 million in fiscal 2017 compared to fiscal 2016 was primarily due to higher salaries and related costs of $0.6 million partially offset by lower stock compensation of $0.2 million and lower travel of $0.2 million.
On a constant currency basis, general and administrative expense was $32.7 million and $33.5 million for fiscal 2016 and 2015, respectively, representing a decrease of $0.8 million, or 2%. The non-currency related decrease in general and administrative expense of $0.8 million in fiscal 2016 compared to fiscal 2015 was primarily due to lower professional fees of $0.8 million, lower bonuses of $0.8 million and lower costs associated with an internal system upgrade of $0.5 million partially offset by higher stock compensation of $1.0 million and higher severance of $0.2 million.
Amortization of Intangibles from Acquisitions
Amortization of intangibles from acquisitions totaled $0.7 million for each of the fiscal years 2017, 2016 and 2015. Amortization expense was due to the intangible assets acquired from our DynaSys and CEBOS acquisitions.
Total Other (Income) Expense
|
Year Ended |
Increase (Decrease) |
Year Ended |
Increase (Decrease) |
Year Ended |
||||||||||||||||||||||||
| (in thousands) | January 31, 2017 | $ |
% |
January 31, 2016 | $ |
% |
January 31, 2015 | |||||||||||||||||||||
|
Other (income) expense |
||||||||||||||||||||||||||||
|
Interest income |
$ | (696 |
) |
$ | (376 |
) |
-118 |
% |
$ | (320 |
) |
$ | (78 |
) |
-32 |
% |
$ | (242 |
) | |||||||||
|
Interest expense |
670 | (42 |
) |
-6 |
% |
712 | (99 |
) |
-12 |
% |
811 | |||||||||||||||||
|
Other income, net |
(436 |
) |
321 | 42 |
% |
(757 |
) |
(588 |
) |
-348 |
% |
(169 |
) | |||||||||||||||
|
Total other (income) expense, net |
$ | (462 |
) |
$ | (97 |
) |
-27 |
% |
$ | (365 |
) |
$ | (765 |
) |
-191 |
% |
$ | 400 | ||||||||||
|
Percentage of revenue |
0 |
% |
0 |
% |
0 |
% | ||||||||||||||||||||||
Total other (income) expense, net was $(0.5) million, $(0.4) million and $0.4 million for fiscal 2017, 2016 and 2015, respectively. When comparing fiscal 2017 to fiscal 2016, the favorable change is primarily related to an increase in the fair value of our interest rate swap of $0.5 million and higher interest income of $0.4 million partially offset by lower foreign exchange gains of $0.7 million. When comparing fiscal 2016 to fiscal 2015, the favorable change is primarily related to an increase in the fair value of our interest rate swap of $0.8 million partially offset by lower foreign exchange gains of $0.4 million.
Interest rate swap valuations and foreign exchange gains and losses are subject to changes which are inherently unpredictable. Our interest rate swap is accounted for using mark-to-market accounting. Accordingly, changes in the fair value of the swap each reporting period are adjusted through earnings, subjecting us to non-cash volatility in our results of operations. The swap fixes the interest rate on our mortgage to 4.31% over the entire term of the mortgage and effectively lowered our interest rate from the previous mortgage rate of 6.5%. Although the agreement allows us to prepay the loan and exit the agreement early, we have no intention of doing so. As a result, we will have non-cash adjustments through earnings each reporting period. Over the term of the mortgage, however, the net impact of these mark-to-market adjustments on earnings will be zero.
Income Tax Expense
|
Year Ended |
Increase (Decrease) |
Year Ended |
Increase (Decrease) |
Year Ended |
||||||||||||||||||||||||
| (in thousands) | January 31, 2017 | $ |
% |
January 31, 2016 | $ |
% |
January 31, 2015 | |||||||||||||||||||||
|
Income tax expense |
$ | 19,276 | $ | 17,652 | 1,087 |
% |
$ | 1,624 | $ | (1,015 | ) | -38 |
% |
$ | 2,639 | |||||||||||||
|
Percentage of revenue |
7 |
% |
1 |
% |
1 |
% | ||||||||||||||||||||||
|
Effective tax rate |
504 |
% |
15 |
% |
17 |
% | ||||||||||||||||||||||
We recorded income tax expense of $19.3 million, $1.6 million and $2.6 million for fiscal 2017, 2016, and 2015 respectively. QAD’s effective tax rate was 504%, 15%, and 17% for fiscal 2017, 2016, and 2015, respectively. In total, our effective tax rate increased in fiscal 2017 compared to fiscal 2016. This increase is primarily attributed to a valuation allowance of $16.3 million placed on U.S. federal and state net deferred tax assets. The decrease in our effective tax rate that occurred in fiscal 2016 compared to fiscal 2015 was attributed to the liquidation of an investment in a Japan legal entity, which gave us the ability to utilize expired net operating losses for Japanese tax purposes in the year of liquidation.
For further information regarding income taxes, see Note 3 “Income Taxes” within the Notes to Consolidated Financial Statements included in Item 15 of this Annual Report on Form 10-K.
Non-GAAP Financial Measures
Regulation S-K Item 10(e), “Use of Non-GAAP Financial Measures in Commission Filings,” defines and prescribes the conditions for use of non-GAAP financial information. Our measures of non-GAAP adjusted EBITDA, non-GAAP adjusted EBITDA margins, non-GAAP pre-tax income, non-GAAP net income and non-GAAP earnings per share each meet the definition of a non-GAAP financial measure.
We define the non-GAAP measures as follows:
|
● |
Non-GAAP adjusted EBITDA - EBITDA is GAAP net income before net interest expense, income tax expense, depreciation and amortization. Non-GAAP adjusted EBITDA is EBITDA less stock-based compensation expense and the change in the fair value of the interest rate swap. |
|
● |
Non-GAAP adjusted EBITDA margins - Calculated by dividing non-GAAP adjusted EBITDA by total revenue. |
|
● |
Non-GAAP pre-tax income - GAAP income before income taxes not including the effects of stock-based compensation expense, amortization of purchased intangible assets and the change in fair value of the interest rate swap. |
|
● |
Non-GAAP net income - GAAP net income before stock-based compensation expense, amortization of purchased intangible assets, the change in fair value of the interest rate swap, the change in valuation allowance and certain income tax adjustments. |
|
● |
Non-GAAP earnings per share - Non-GAAP net income allocated to Class A and Class B shares divided by the same weighted average shares outstanding of each class which was used to calculate GAAP earnings per share. |
QAD’s management uses non-GAAP measures internally to evaluate the business and believes that presenting non-GAAP measures provides useful information to investors regarding the underlying business trends and performance of our ongoing operations as well as useful metrics for monitoring our performance and evaluating it against industry peers. The non-GAAP financial measures presented should be used in addition to, and in conjunction with, results presented in accordance with GAAP, and should not be relied upon to the exclusion of GAAP financial measures. Management strongly encourages investors to review our consolidated financial statements in their entirety and to not rely on any single financial measure in evaluating QAD.
QAD non-GAAP measures reflect adjustments based on the following items:
EBITDA: We report EBITDA as a non-GAAP metric by excluding the effect of net interest expense, income tax expense, depreciation and amortization from net income because doing so makes internal comparisons to our historical operating results more consistent. In addition, we believe providing an EBITDA calculation is a more useful comparison of our operating results to the operating results of our peers.
Stock-based compensation expense: We have excluded the effect of stock-based compensation expense from our non-GAAP adjusted EBITDA, non-GAAP pre-tax income, non-GAAP net income and non-GAAP earnings per share calculations. Although stock-based compensation expense is calculated in accordance with current GAAP and constitutes an ongoing and recurring expense, such expense is excluded from non-GAAP results because it is not an expense which generally requires cash settlement by QAD, and therefore is not used by us to assess the profitability of our operations. We also believe the exclusion of stock-based compensation expense provides a more useful comparison of our operating results to the operating results of our peers.
Amortization of purchased intangible assets: We amortize purchased intangible assets in connection with our acquisitions. We have excluded the effect of amortization of purchased intangible assets, which include purchased technology, customer relationships, trade names and other intangible assets, from non-GAAP pre-tax income, non-GAAP net income and non-GAAP earnings per share calculations, because doing so makes internal comparisons to our historical operating results more consistent. In addition, we believe excluding amortization of purchased intangible assets provides a more useful comparison of our operating results to the operating results of our peers.
Change in fair value of the interest rate swap: We entered into an interest rate swap to mitigate our exposure to the variability of one-month LIBOR for our floating rate debt related to the mortgage of our headquarters. We have excluded the gain/loss adjustments to record the interest rate swap at fair value from non-GAAP adjusted EBITDA, non-GAAP pre-tax income, non-GAAP net income and non-GAAP earnings per share calculations. We believe that these fluctuations are not indicative of our operational costs or meaningful in evaluating comparative period results because we currently have no intention of exiting the debt agreement early; and therefore over the life of the debt the sum of the fair value adjustments will be $0.
Change in valuation allowance: We have excluded the effect of the change in valuation allowance from non-GAAP net income and non-GAAP earnings per share calculations. The placement of a valuation allowance on our deferred tax assets is a non-cash income tax expense charge and such expense is excluded from non-GAAP results because it is not a recurring expense which generally requires cash settlement, and therefore is not used by us to assess the profitability of our operations. We also believe the exclusion of the change in valuation allowance provides a useful comparison of actual results to guidance QAD provided at the beginning of the quarter as guidance did not include a valuation allowance charge and provides a more useful comparison of our operating results to the operating results of our peers.
Income tax adjustments: We compute and utilize a fixed long-term projected non-GAAP tax rate in order to provide better consistency across the interim reporting periods by eliminating the effects of non-recurring and period-specific items such as changes in the tax valuation allowance and tax effects of acquisition-related costs, since each of these can vary in size and frequency. When projecting the long-term rate we evaluated four years of historical and expected results excluding the impact of the following non-cash items: stock-based compensation expense, amortization of purchased intangibles and the change in fair value of the interest rate swap. The projected rate assumes no new acquisitions and takes into account other factors including our current tax structure, existing tax positions in various jurisdictions and key legislation in major jurisdictions where we operate. The long-term non-GAAP tax rate is 25%. We evaluate this long-term rate on an annual basis or if any significant events that may materially affect this long-term rate occur. This long-term rate could be subject to change for a variety of reasons, for example, significant changes in the geographic earnings mix, acquisition activity or fundamental tax law changes in major jurisdictions where we operate.
Our reconciliation of the non-GAAP financial measures of adjusted EBITDA, adjusted EBITDA margins, non-GAAP pre-tax income, non-GAAP net income and non-GAAP earnings per share to the most comparable GAAP measures for fiscal years 2017, 2016 and 2015 are as follows (in thousands, except for share numbers):
|
Years Ended January 31, |
||||||||||||
|
2017 |
2016 |
2015 |
||||||||||
|
Total revenue |
$ | 277,973 | $ | 277,852 | $ | 295,101 | ||||||
|
Net (loss) income |
(15,450 | ) | 8,912 | 12,946 | ||||||||
|
Add back: |
||||||||||||
|
Net interest expense |
(26 | ) | 392 | 569 | ||||||||
|
Depreciation |
4,326 | 3,968 | 3,816 | |||||||||
|
Amortization |
1,710 | 1,807 | 1,935 | |||||||||
|
Income taxes |
19,276 | 1,624 | 2,639 | |||||||||
|
EBITDA |
$ | 9,836 | $ | 16,703 | $ | 21,905 | ||||||
|
Add back: |
||||||||||||
|
Non-cash stock comp expense |
7,323 | 7,440 | 4,993 | |||||||||
|
Change in fair value of interest rate swap |
(485 | ) | 48 | 877 | ||||||||
|
Adjusted EBITDA |
$ | 16,674 | $ | 24,191 | $ | 27,775 | ||||||
|
Adjusted EBITDA margin |
6 | % | 9 | % | 9 | % | ||||||
|
Non-GAAP pre-tax income reconciliation |
||||||||||||
|
Income before income taxes |
$ | 3,826 | $ | 10,536 | $ | 15,585 | ||||||
|
Add back |
||||||||||||
|
Stock-based compensation expense |
7,323 | 7,440 | 4,993 | |||||||||
|
Amortization of purchased intangible assets |
1,377 | 1,377 | 1,493 | |||||||||
|
Change in fair value of interest rate swap |
(485 | ) | 48 | 877 | ||||||||
|
Non-GAAP income before income taxes |
$ | 12,041 | $ | 19,401 | $ | 22,948 | ||||||
|
Non-GAAP net income reconciliation |
||||||||||||
|
Net (loss) income |
$ | (15,450 | ) | $ | 8,912 | $ | 12,946 | |||||
|
Add back: |
||||||||||||
|
Non-cash stock-based compensation |
7,323 | 7,440 | 4,993 | |||||||||
|
Amortization of purchased intangible assets |
1,377 | 1,377 | 1,493 | |||||||||
|
Change in fair value of interest rate swap |
(485 | ) | 48 | 877 | ||||||||
|
Income tax adjustments |
(2,054 | ) | (2,216 | ) | (1,841 | ) | ||||||
|
Net change in valuation allowance |
16,861 | 2,564 | 1,657 | |||||||||
|
Non-GAAP net income |
$ | 7,572 | $ | 18,125 | $ | 20,125 | ||||||
|
Non-GAAP earnings per Class A share reconciliation |
||||||||||||
|
(Loss) Earnings per diluted Class A share |
$ | (0.84 | ) | $ | 0.47 | $ | 0.79 | |||||
|
Add back: |
||||||||||||
|
Non-cash stock-based compensation |
0.40 | 0.39 | 0.31 | |||||||||
|
Amortization of purchased intangible assets |
0.07 | 0.07 | 0.09 | |||||||||
|
Change in fair value of interest rate swap |
(0.03 | ) | 0.00 | 0.05 | ||||||||
|
Income tax adjustments |
(0.11 | ) | (0.11 | ) | (0.11 | ) | ||||||
|
Net change in valuation allowance |
0.92 | 0.13 | 0.10 | |||||||||
|
Non-GAAP earnings per Class A share |
$ | 0.41 | $ | 0.95 | $ | 1.23 | ||||||
|
Shares used in computing earnings per Class A share |
15,715 | 16,224 | 13,553 | |||||||||
|
Non-GAAP earnings per Class B share reconciliation |
||||||||||||
|
(Loss) Earnings per diluted Class B share |
$ | (0.70 | ) | $ | 0.40 | $ | 0.68 | |||||
|
Add back: |
||||||||||||
|
Non-cash stock-based compensation |
0.33 | 0.33 | 0.26 | |||||||||
|
Amortization of purchased intangible assets |
0.06 | 0.06 | 0.08 | |||||||||
|
Change in fair value of interest rate swap |
(0.02 | ) | 0.00 | 0.04 | ||||||||
|
Income tax adjustments |
(0.09 | ) | (0.10 | ) | (0.10 | ) | ||||||
|
Net Change in valuation allowance |
0.76 | 0.12 | 0.09 | |||||||||
|
Non-GAAP earnings per Class B share |
$ | 0.34 | $ | 0.81 | $ | 1.05 | ||||||
|
Shares used in computing earnings per Class B share |
3,206 | 3,283 | 3,271 | |||||||||
LIQUIDITY AND CAPITAL RESOURCES
Our primary source of cash is from the sale of subscription, licenses, maintenance and professional services to our customers. Our primary use of cash is payment of our operating expenses which mainly consist of employee-related expenses, such as compensation and benefits, as well as general operating expenses for facilities and overhead costs. In addition to operating expenses, we may also use cash for capital expenditures, payment of dividends and stock repurchases, and to invest in our growth initiatives, which include acquisitions of products, technologies and businesses.
At January 31, 2017, our principal sources of liquidity were cash and equivalents totaling $145.1 million and net accounts receivable of $69.4 million. During fiscal 2015 we closed an offering of 2,000,000 shares of Class A common stock. The net proceeds to us from the sale of the stock were $37.0 million after deducting underwriting discounts and commissions and offering expenses. In early fiscal 2016 the offering underwriters exercised in full an option to purchase additional shares. As a result, 450,000 shares of Class A common stock were issued in fiscal 2016 generating $8.4 million in additional proceeds. At January 31, 2017, our cash and equivalents consisted of current bank accounts, registered money market funds and time delineated deposits. Approximately 85% of our cash and equivalents were held in U.S. dollar denominated accounts as of January 31, 2017.
We have a U.S. line of credit facility with Rabobank that permits unsecured short-term borrowings of up to $20 million. Our line of credit agreement contains customary covenants that could restrict our ability to incur additional indebtedness. Our line of credit is available for working capital or other business needs. We have not drawn on the line of credit during any of the last three fiscal years nor do we expect to draw on the line of credit during fiscal 2018. Our line of credit expires in July 2017 and we may or may not renew.
Our primary commercial banking relationship is with Bank of America and its global affiliates. Our cash and equivalents are held by diversified financial institutions globally, and as of January 31, 2017 the portion of our cash and equivalents held by or invested through Bank of America was approximately 95%. Our largest cash concentrations are in the United States and Ireland. The majority of our cash and equivalents are held in investment accounts which are predominantly placed in money market mutual funds and in U.S. Treasury and government securities funds. The remaining cash and equivalents are held in deposit accounts and certificates of deposit.
Our cash and equivalents are concentrated in a few locations around the world, with substantial amounts held outside of the U.S. The percentage of cash and equivalents held by foreign subsidiaries was approximately 67% and 62% as of January 31, 2017 and 2016, respectively. Subject to local law restrictions, certain amounts held outside the U.S. could be repatriated to the U.S. These repatriated amounts would likely be subject to U.S. income taxes under current U.S. tax law. We have provided for the U.S. income tax liability on foreign earnings, except for foreign earnings that are considered permanently reinvested outside the U.S. Our intent is that foreign permanently reinvested earnings will remain outside the U.S. Our U.S. liquidity needs will be met through ongoing cash flows from operations or through alternative means of cash flow such as the sale of stock or external borrowing. We regularly review our capital structure to ensure we have the proper liquidity available in the locations in which it is needed.
The following table summarizes our cash flows for the fiscal years ended January 31, 2017, 2016 and 2015, respectively.
|
Years Ended January 31, |
||||||||||||
|
(in thousands) |
2017 |
2016 |
2015 |
|||||||||
|
Net cash provided by operating activities |
$ | 18,680 | $ | 24,057 | $ | 23,963 | ||||||
|
Net cash used in investing activities |
(3,406 |
) |
(3,348 |
) |
(4,879 |
) | ||||||
|
Net cash (used in) provided by financing activities |
(7,814 |
) |
(487 |
) |
29,178 | |||||||
|
Effect of foreign exchange rates on cash and equivalents |
(109 |
) |
(3,017 |
) |
(3,720 |
) | ||||||
|
Net increase in cash and equivalents |
$ | 7,351 | $ | 17,205 | $ | 44,542 | ||||||
Typical factors affecting our cash provided by operating activities include our level of revenue and earnings for the period; the timing and amount of employee bonus payments and income tax payments; and the timing and amount of billings and cash collections from our customers, which is our largest source of operating cash flow. Net cash flows provided by operating activities were $18.7 million and $24.1 million for fiscal 2017 and 2016, respectively. A decrease in net income of $24.4 million and the negative cash flow effect of changes in accounts receivable of $14.9 million was offset by the positive cash flow effect of changes in deferred revenue, accounts payable and other liabilities of $16.8 million and a non-cash change in deferred tax asset valuation allowances of $14.3 million.
Net cash flows provided by operating activities were $24.1 million and $24.0 million for fiscal 2016 and 2015, respectively. The positive cash flow effect of changes in accounts receivable of $22.0 million was offset by the negative cash flow effect of changes in deferred revenue and other liabilities of $17.4 million and a decrease in net income of $4.0 million.
Net cash used in investing activities consisted primarily of capital expenditures of $3.3 million, $3.2 million and $4.6 million for fiscal 2017, 2016 and 2015, respectively. We continue to monitor our capital spending and do not believe we are delaying critical capital expenditures required to run our business.
Cash dividend payments for fiscal 2017 and 2016 and 2015 were $5.3 million, $5.2 million and $4.5 million, respectively. The increase in dividend payments in fiscal 2016 when compared to fiscal 2015 was due to an increase in the number of outstanding shares as a result of our secondary stock offering. On a regular basis the Board of Directors evaluates our ability to continue to pay dividends as well as the structure of any potential dividend payments.
Net cash provided by financing activities during 2016 and 2015 included proceeds received from the sale of stock of $8.4 million and $37.0 million, respectively, after deducting offering expenses and underwriting discounts and commissions.
We have historically calculated accounts receivable days’ sales outstanding (“DSO”), using the countback, or last-in first-out, method. This method calculates the number of days of billed revenue represented by the accounts receivable balance as of period end. When reviewing the performance of our entities, DSO under the countback method is used by management. It is management’s belief that the countback method best reflects the relative health of our accounts receivable as of a given quarter-end or year-end because of the cyclical nature of our billings. Our billing cycle includes high annual maintenance renewal billings at year-end that will not be recognized as earned revenue until future periods.
DSO under the countback method was relatively consistent at 50 days and 49 days as of January 31, 2017 and 2016, respectively. DSO using the average method, which is calculated utilizing the accounts receivable balance and earned revenue for the most recent quarter, was 85 days at both January 31, 2017 and 2016. The aging of our accounts receivable remained consistent when compared with the same period last year. We believe our reserve methodology is adequate, our reserves are properly stated as of January 31, 2017 and the quality of our receivables remains good.
There have been no material changes in our contractual obligations or commercial commitments outside the ordinary course of business. Cash requirements for items other than normal operating expenses are anticipated for capital expenditures, dividend payments and other equity transactions. We may require cash for acquisitions of new businesses, software products or technologies complementary to our business.
We believe that our cash on hand, net cash provided by operating activities and available borrowings under our existing credit facility will provide us with sufficient resources to meet our current and long-term working capital requirements, debt service, dividend payments and other cash needs for at least the next twelve months.
Our revenue, earnings, cash flows, receivables, and payables are subject to fluctuations due to changes in foreign currency exchange rates, for which we have put in place foreign currency contracts as part of our risk management strategy. See Part II, Item 7A, “Quantitative and Qualitative Disclosures about Market Risk” for further discussion.
CONTRACTUAL OBLIGATIONS
The following table summarizes our significant contractual obligations at January 31, 2017 and the effect these contractual obligations are expected to have on our liquidity and cash flows in future periods.
|
Years Ended January 31, |
||||||||||||||||||||||||||||
|
2018 |
2019 |
2020 |
2021 |
2022 |
Thereafter |
Total |
||||||||||||||||||||||
|
(In millions) |
||||||||||||||||||||||||||||
|
Notes payable |
$ | 0.5 | $ | 0.5 | $ | 0.5 | $ | 0.5 | $ | 0.5 | $ | 11.8 | $ | 14.3 | ||||||||||||||
|
Notes payable interest payments |
0.6 | 0.6 | 0.6 | 0.5 | 0.5 | 0.2 | 3.0 | |||||||||||||||||||||
|
Lease obligations |
5.4 | 4.3 | 2.4 | 1.1 | 0.3 | 0.1 | 13.6 | |||||||||||||||||||||
|
Purchase obligations |
8.8 | 3.3 | 1.2 | — | — | — | 13.3 | |||||||||||||||||||||
|
Total |
$ | 15.3 | $ | 8.7 | $ | 4.7 | $ | 2.1 | $ | 1.3 | $ | 12.1 | $ | 44.2 | ||||||||||||||
Purchase obligations are contractual obligations for the purchase of goods or services. They are defined as agreements that are enforceable and legally binding on QAD which specify all significant terms, including fixed or minimum quantities to be purchased; fixed, minimum or variable price provisions; and the approximate timing of the transaction. Purchase obligations relate primarily to information technology infrastructure costs, hosting services agreements and costs associated with our sales and marketing events.
We have omitted unrecognized tax benefits from this table due to the inherent uncertainty regarding the timing of potential issue resolution. Specifically, either (a) the underlying positions have not been fully enough developed under audit to quantify at this time, or (b) the years relating to the issues for certain jurisdictions are not currently under audit. As of January 31, 2017, we had $1.7 million of unrecognized tax benefits. This is before the netting of unrecognized tax benefits against deferred tax assets for a loss or credit that would apply in settlement of the uncertain tax position, as required by ASU 2013-11. For further information regarding the unrecognized tax benefits see Note 3 “Income Taxes” within Notes to Consolidated Financial Statements.
Purchase orders or contracts for the purchase of supplies and other goods and services are not included in the table above. We are not able to determine the aggregate amount of such purchase orders that represent contractual obligations, as purchase orders may represent authorizations to purchase rather than binding agreements. Our purchase orders are based on our current procurement or development needs and are fulfilled by our vendors within short time frames. We do not have significant agreements for the purchase of supplies or other goods specifying minimum quantities or set prices that exceed our expected requirements for three months.
We have certain royalty commitments associated with the licensing or subscription of certain products. Royalty expense is generally based on the number of licenses sold or a percentage of the underlying revenue. Royalty expense, included in cost of subscription, license fees and maintenance and other revenue, was $16.2 million, $15.9 million and $17.1 million in fiscal 2017, 2016 and 2015, respectively.
Credit Facility
We have an unsecured credit agreement with Rabobank, N.A. (the “Facility”). The Facility provides a commitment through July 15, 2017 for a $20 million line of credit for working capital or other business needs. We pay a commitment fee of 0.25% per annum of the daily average of the unused portion of the $20 million Facility. Borrowings under the Facility bore interest at a rate equal to one month LIBOR plus 0.75%. At January 31, 2017, the effective borrowing rate would have been 1.52%.
The Facility provides that we maintain certain financial and operating ratios which include, among other provisions, minimum liquidity on a consolidated basis of $25 million in cash and equivalents at all times, a current ratio (calculated using current liabilities excluding deferred revenue) of not less than 1.3 to 1.0 determined at the end of each fiscal quarter, a leverage ratio of not more than 1.5 to 1.0 determined at the end of each fiscal quarter, and a debt service coverage ratio of not less than 1.5 to 1.0 determined at the end of each fiscal year. The Facility also contains customary covenants that could restrict our ability to incur additional indebtedness.
As of January 31, 2017, there were no borrowings under the Facility and we were in compliance with the financial covenants. Our line of credit expires in July 2017 and we may or may not renew it.
Note Payable
Effective May 30, 2012, QAD Ortega Hill, LLC entered into a variable rate credit agreement (the “2012 Mortgage”) with Rabobank, N.A., to refinance a pre-existing mortgage. The 2012 Mortgage has an original principal balance of $16.1 million and bears interest at the one-month LIBOR rate plus 2.25%. One month LIBOR was 0.77% at January 31, 2017. The 2012 Mortgage matures in June 2022 and is secured by our headquarters located in Santa Barbara, California. In conjunction with the 2012 Mortgage, QAD Ortega Hill, LLC entered into an interest rate swap with Rabobank, N.A. The swap agreement has an initial notional amount of $16.1 million and a schedule matching that of the underlying loan that synthetically fixes the interest rate on the debt at 4.31% for the entire term of the 2012 Mortgage. The terms of the 2012 Mortgage provide for QAD Ortega Hill, LLC to make net monthly payments of $88,100 consisting of principal and interest and one final payment of $11.7 million. The unpaid balance as of January 31, 2017 was $14.3 million.
Lease Obligations
We lease certain office facilities, office equipment and automobiles under operating lease agreements. Although our office lease agreements end on various dates through fiscal year 2026, they typically include termination options at earlier dates. The contractual obligations table reflects future minimum rental payments under non-cancellable operating lease commitments with terms of more than one year. For further discussion of our leased office facilities, see Item 2 entitled “Properties” included elsewhere in this Annual Report on Form 10-K.
Off-Balance Sheet Arrangements
As of January 31, 2017, we did not have any off-balance sheet arrangements as defined in Item 303(a)(4)(ii) of SEC Regulation S-K.
ITEM 7A. QUANTITATIVE AND QUALITATIVE DISCLOSURES ABOUT MARKET RISK
Foreign Exchange Rates. We have operations in foreign locations around the world and we are exposed to risk resulting from fluctuations in foreign currency exchange rates. We have experienced significant foreign currency fluctuations during the fourth quarter of fiscal 2016 and in fiscal 2017 due primarily to the volatility of the euro, Brazilian real, Mexican peso and British pound in relation to the U.S. dollar. However, while strengthening of the U.S. dollar compared to foreign currency exchange rates generally has the effect of reducing revenues it also has the effect of reducing expenses denominated in currencies other than the U.S. dollar. These foreign currency exchange rate movements could create a foreign currency gain or loss that could be realized or unrealized for us. Unfavorable movements in foreign currency exchange rates between the U.S. dollar and other foreign currencies may have an adverse impact on our operations. We did not have any foreign currency forward or option contracts, other material foreign currency denominated derivatives or other financial instruments open as of January 31, 2017.
We face two risks related to foreign currency exchange rates—translation risk and transaction risk. Amounts invested in our foreign operations are translated into U.S. dollars using period-end exchange rates. The resulting translation adjustments are recorded as a component of accumulated other comprehensive loss in the Consolidated Balance Sheets. Revenues and expenses in foreign currencies translate into higher or lower revenues and expenses in U.S. dollars as the U.S. dollar weakens or strengthens against other currencies. Our international subsidiaries also hold U.S. dollar and euro-based net monetary accounts subject to revaluation that results in realized or unrealized foreign currency gains or losses. Furthermore, we have exposure to foreign exchange fluctuations arising from the remeasurement of non-functional currency assets, liabilities and intercompany balances into U.S. dollars for financial reporting purposes.
For fiscal 2017, 2016 and 2015, approximately 51%, 52% and 55%, respectively, of our revenue was denominated in foreign currencies. We also incurred a significant portion of our expenses in currencies other than the U.S. dollar, approximately 40% for both fiscal 2017 and 2016 and 43% for fiscal 2015. Based on a hypothetical 10% adverse movement in all foreign currency exchange rates, our revenue would be adversely affected by approximately 5% partially offset by a positive effect on our expenses of approximately 4%, and our operating income would be adversely affected by approximately 90%.
For fiscal 2017, 2016 and 2015, foreign currency transaction and remeasurement losses (gains) totaled $0.2 million, $(0.5) million and $(0.9) million, respectively, and are included in “Other (income) expense, net” in our Consolidated Statements of Operations and Comprehensive (Loss) Income. We performed a sensitivity analysis on the net U.S. dollar and euro-based monetary accounts subject to revaluation that are held by our international subsidiaries and on the non-functional currency assets, liabilities and intercompany balances that are remeasured into U.S. dollars. A hypothetical 10% adverse movement in all foreign currency exchange rates would result in foreign currency transaction and remeasurement losses of approximately $3.4 million.
These estimates assume an adverse shift in all foreign currency exchange rates against the U.S. dollar, which do not always move in the same direction or in the same degrees, and actual results may differ materially from the hypothetical analysis.
Interest Rates. We invest our surplus cash in a variety of financial instruments, consisting principally of short-term marketable securities with maturities of less than 90 days at the date of purchase. Our investment securities are held for purposes other than trading. Cash balances held by subsidiaries are invested primarily in registered money market funds with local operating banks. Based on an interest rate sensitivity analysis of our cash and equivalents, we estimate a 10% adverse change in interest rates from the 2016 fiscal year-end rates would not have a material adverse effect on our cash flows or financial condition for the next fiscal year.
Our debt is comprised of a loan agreement, secured by real property, which bears interest at the one-month LIBOR rate plus 2.25%. In conjunction with the loan agreement we entered into an interest rate swap. The swap agreement has an initial notional amount and schedule matching that of the underlying loan that synthetically fixes the interest rate on the debt at 4.31%. Additionally, we have an unsecured line of credit which bears interest at the one month LIBOR rate plus 0.75%. As of January 31, 2017 there were no borrowings under our unsecured line of credit.
Our interest rate swap is accounted for using mark-to-market accounting. Accordingly, changes in the fair value of the swap each reporting period are adjusted through earnings, subjecting us to non-cash volatility in our results of operations. We prepared a sensitivity analysis using a modeling technique that measures the change in the fair values arising from a hypothetical 10% adverse movement in levels of interest rates across the entire yield curve, with all other variables held constant. Based upon the results of this analysis a 10% adverse change in interest rates from the January 31, 2017 rates would cause a $0.1 million reduction in our results of operations. We believe it is prudent to hedge the expected volatility of the variable rate mortgage on our corporate headquarters. The swap fixes the interest rate on our mortgage to 4.31% over the entire term of the mortgage and effectively lowers our interest rate from the previous mortgage rate of 6.5%. Although the agreement allows us to prepay the loan and exit the agreement early, we have no intention of doing so. As a result, we will have non-cash adjustments through earnings each reporting period. However, over the term of the mortgage, the net impact of these mark-to-market adjustments on earnings will be zero.
|
ITEM 8. |
FINANCIAL STATEMENTS AND SUPPLEMENTARY DATA |
The response to this item is included in Item 15 of this Annual Report on Form 10-K.
|
ITEM 9. |
CHANGES IN AND DISAGREEMENTS WITH ACCOUNTANTS ON ACCOUNTING AND FINANCIAL DISCLOSURE |
None.
|
ITEM 9A. |
CONTROLS AND PROCEDURES |
(a) Evaluation of Disclosure Controls and Procedures
QAD maintains disclosure controls and procedures that are designed to ensure that information required to be disclosed in reports that it files or submits under the Securities Exchange Act of 1934 (the “Exchange Act”) is recorded, processed, summarized and reported within the time periods specified in Securities and Exchange Commission rules and forms, and that such information is accumulated and communicated to management, including the Chief Executive Officer and the Chief Financial Officer, to allow timely decisions regarding required disclosure. QAD’s management, under the supervision and with the participation of the Chief Executive Officer and the Chief Financial Officer, evaluated the effectiveness of QAD’s disclosure controls and procedures as of the end of the period covered by this Annual Report on Form 10-K. Based on this evaluation, QAD’s principal executive officer and principal financial officer have concluded that QAD’s disclosure controls and procedures (as defined in Rules 13a-15(e) and 15d-15(e) under the Exchange Act) were effective at a reasonable assurance level.
(b) Management’s Report on Internal Control Over Financial Reporting
QAD’s management is responsible for establishing and maintaining adequate internal control over financial reporting as defined in Rules 13a-15(f) and 15d-15(f) under the Securities Exchange Act of 1934, as amended. QAD’s system of internal control over financial reporting is designed to provide reasonable assurance regarding the reliability of financial reporting and the preparation of consolidated financial statements for external purposes in accordance with generally accepted accounting principles. QAD’s internal control over financial reporting includes those policies and procedures that: (i) pertain to the maintenance of records that, in reasonable detail, accurately and fairly reflect the transactions and dispositions of QAD’s assets; (ii) provide reasonable assurance that transactions are recorded as necessary to permit preparation of financial statements in accordance with generally accepted accounting principles, and that QAD’s receipts and expenditures are being made only in accordance with authorizations of QAD’s management and directors; and (iii) provide reasonable assurance regarding prevention or timely detection of unauthorized acquisition, use or disposition of QAD’s assets that could have a material effect on the financial statements.
Management has assessed the effectiveness of QAD’s internal control over financial reporting as of January 31, 2017 based on the criteria described in Internal Control — Integrated Framework (2013) issued by the Committee of Sponsoring Organizations of the Treadway Commission (“COSO”). Based on management’s assessment, management has concluded that QAD’s internal control over financial reporting was effective at the reasonable assurance level as of January 31, 2017. We reviewed the results of management’s assessment with our Audit Committee.
Our independent registered public accounting firm, KPMG LLP, has audited our internal control over financial reporting as of January 31, 2017, as stated in their report included in this Annual Report on Form 10-K.
(c) Changes in Internal Control over Financial Reporting
There were no changes in the Company’s internal control over financial reporting identified in connection with the evaluation required by paragraph (d) of Exchange Act Rules 13a-15 or 15d-15 that occurred during our last fiscal quarter that have materially affected, or are reasonably likely to materially affect, internal control over financial reporting.
(d) Limitations on the Effectiveness of Controls
QAD’s management does not expect that its disclosure controls and procedures or its internal control over financial reporting will prevent all errors and all fraud. A control system, no matter how well conceived and operated, can provide only reasonable, not absolute, assurance that the objectives of the control system are met. Because of the inherent limitations in all control systems, no evaluation of controls can provide absolute assurance that all control issues and instances of fraud, if any, within QAD have been detected. The design of any system of controls also is based in part upon certain assumptions about the likelihood of future events, and there can be no assurance that any design will succeed in achieving its stated goals under all potential future conditions; over time, controls may become inadequate because of changes in conditions, or the degree of compliance with policies or procedures may deteriorate.
(e) Report of Independent Registered Public Accounting Firm
The Board of Directors and Stockholders
QAD Inc.:
We have audited the internal control over financial reporting of QAD Inc. as of January 31, 2017, based on criteria established in Internal Control – Integrated Framework (2013) issued by the Committee of Sponsoring Organizations of the Treadway Commission (COSO). Management of QAD Inc. is responsible for maintaining effective internal control over financial reporting and for its assessment of the effectiveness of internal control over financial reporting, included in the accompanying report entitled Management’s Report on Internal Control Over Financial Reporting included in Item 9A.(b). Our responsibility is to express an opinion on the internal control over financial reporting of QAD Inc. based on our audit.
We conducted our audit in accordance with the standards of the Public Company Accounting Oversight Board (United States). Those standards require that we plan and perform the audit to obtain reasonable assurance about whether effective internal control over financial reporting was maintained in all material respects. Our audit included obtaining an understanding of internal control over financial reporting, assessing the risk that a material weakness exists, and testing and evaluating the design and operating effectiveness of internal control based on the assessed risk. Our audit also included performing such other procedures as we considered necessary in the circumstances. We believe that our audit provides a reasonable basis for our opinion.
A company’s internal control over financial reporting is a process designed to provide reasonable assurance regarding the reliability of financial reporting and the preparation of financial statements for external purposes in accordance with generally accepted accounting principles. A company’s internal control over financial reporting includes those policies and procedures that (1) pertain to the maintenance of records that, in reasonable detail, accurately and fairly reflect the transactions and dispositions of the assets of the company; (2) provide reasonable assurance that transactions are recorded as necessary to permit preparation of financial statements in accordance with generally accepted accounting principles, and that receipts and expenditures of the company are being made only in accordance with authorizations of management and directors of the company; and (3) provide reasonable assurance regarding prevention or timely detection of unauthorized acquisition, use, or disposition of the company’s assets that could have a material effect on the financial statements.
Because of its inherent limitations, internal control over financial reporting may not prevent or detect misstatements. Also, projections of any evaluation of effectiveness to future periods are subject to the risk that controls may become inadequate because of changes in conditions, or that the degree of compliance with the policies or procedures may deteriorate.
In our opinion, QAD Inc. maintained, in all material respects, effective internal control over financial reporting as of January 31, 2017, based on criteria established in Internal Control – Integrated Framework (2013) issued by the Committee of Sponsoring Organizations of the Treadway Commission (COSO).
We also have audited, in accordance with the standards of the Public Company Accounting Oversight Board (United States), the consolidated balance sheets of QAD Inc. and subsidiaries as of January 31, 2017 and 2016, and the related consolidated statements of operations and comprehensive (loss) income, stockholders’ equity, and cash flows for each of the years in the three-year period ended January 31, 2017, and our report dated April 7, 2017 expressed an unqualified opinion on those consolidated financial statements.
/s/ KPMG LLP
Woodland Hills, California
April 7, 2017
|
ITEM 9B. |
OTHER INFORMATION |
None.
PART III
|
ITEM 10. |
DIRECTORS, EXECUTIVE OFFICERS AND CORPORATE GOVERNANCE |
Information regarding QAD directors is set forth in the section entitled “Election of Directors” appearing in our Definitive Proxy Statement for the Annual Meeting of Stockholders (“Proxy Statement”) to be filed with the Securities and Exchange Commission within 120 days after the end of our fiscal year ended January 31, 2017, which information is incorporated herein by reference.
In addition, the other information required by Item 10 is incorporated by reference from the Proxy Statement.
EXECUTIVE OFFICERS OF THE REGISTRANT
Set forth below is certain information concerning our executive officers. All ages are as of March 31, 2017.
|
NAME |
AGE |
POSITION(S) | ||
|
Pamela M. Lopker |
62 |
Chairman of the Board and President | ||
|
Karl F. Lopker |
65 |
Chief Executive Officer | ||
|
Daniel Lender |
50 |
Chief Financial Officer and Executive Vice President | ||
|
Anton Chilton |
49 |
Chief, Global Field Operations and Executive Vice President | ||
|
Kara Bellamy |
41 |
Chief Accounting Officer, Corporate Controller and Senior Vice President |
Pamela M. Lopker founded QAD in 1979 and has been Chairman of the Board and President since QAD’s incorporation in 1981. Previously, Ms. Lopker served as Senior Systems Analyst for Comtek Research from 1977 to 1979. She is certified in production and inventory management by the American Production and Inventory Control Society. Ms. Lopker earned a bachelor of arts degree in mathematics from the University of California, Santa Barbara. She is married to Karl F. Lopker, Chief Executive Officer of QAD.
Karl F. Lopker has served as Chief Executive Officer and a Director of QAD since joining QAD in 1981. Previously, he was President of Deckers Outdoor Corporation, a company that he founded in 1973. Mr. Lopker is certified in production and inventory management by the American Production and Inventory Control Society. He received a bachelor of science degree in electrical engineering from the University of California, Santa Barbara. Mr. Lopker is married to Pamela M. Lopker, Chairman of the Board and President of QAD.
Daniel Lender was first appointed Chief Financial Officer and Executive Vice President in July 2003. Previously, he served as QAD’s Vice President of Global Sales Operations and Vice President of Latin America. Mr. Lender joined QAD in 1998 as Treasurer following a nine-year tenure with the former Republic National Bank of New York, last serving as Vice President and Treasurer of the Bank’s Delaware subsidiary. He earned a master of business administration degree from the Wharton School of the University of Pennsylvania and a bachelor of science degree in applied economics and business management from Cornell University.
Anton Chilton was appointed Chief, Global Field Operations and Executive Vice President in March 2017. Previously he served as Executive Vice President, Global Services since June 2015. Mr. Chilton joined QAD in 2004 as Services Director of the Company’s Asia-Pacific region, based in Australia. He subsequently served as Managing Director of QAD Australia and New Zealand from 2006 to 2009. Mr. Chilton transferred to QAD's headquarters in 2009, serving as Senior Vice President – Strategic Global Accounts until 2011, when he became Senior Vice President - Professional Services. Prior to joining QAD, Mr. Chilton held senior roles in global systems integration at Atos Origin and Cap Gemini. Mr. Chilton began his career at British Steel designing software and infrastructure solutions and received his education in the Submarine Service, British Royal Navy. Mr. Chilton has an executive MBA from INSEAD.
Kara Bellamy has served as Senior Vice President, Corporate Controller and Chief Accounting Officer since January 2008. Previously, she served as QAD’s Director of Finance, Americas beginning in 2006 and joined QAD as Assistant Corporate Controller in 2004. Prior to joining QAD, Ms. Bellamy served as Corporate Controller for Somera Communications, Inc. from 2002 through 2004. Prior to that, she was an audit manager with Ernst & Young. Ms. Bellamy is a Certified Public Accountant (inactive) and received a bachelor of arts degree in business economics with an accounting emphasis from the University of California, Santa Barbara.
|
ITEM 11. |
EXECUTIVE COMPENSATION |
Information regarding executive compensation is set forth under the caption “Executive Compensation” in the Proxy Statement, which information is incorporated herein by reference.
|
ITEM 12. |
SECURITY OWNERSHIP OF CERTAIN BENEFICIAL OWNERS AND MANAGEMENT AND RELATED STOCKHOLDER MATTERS |
Information regarding security ownership of certain beneficial owners and management is set forth under the caption “Stock Ownership of Directors, Executive Officers and Certain Beneficial Owners” in the Proxy Statement, which information is incorporated herein by reference.
|
ITEM 13. |
CERTAIN RELATIONSHIPS AND RELATED TRANSACTIONS, AND DIRECTOR INDEPENDENCE |
Information regarding certain relationships and related transactions is set forth under the caption “Certain Relationships and Related Party Transactions” in the Proxy Statement, which information is incorporated herein by reference.
|
ITEM 14. |
PRINCIPAL ACCOUNTANT FEES AND SERVICES |
Information regarding services performed by, and fees paid to, our independent auditors is set forth under the caption “Principal Accountant Fees and Services” in the Proxy Statement, which information is incorporated herein by reference.
PART IV
|
ITEM 15. |
EXHIBITS, FINANCIAL STATEMENT SCHEDULES |
1. INDEX TO CONSOLIDATED FINANCIAL STATEMENTS
|
|
Page | ||
|
Report of Independent Registered Public Accounting Firm |
|
62 |
|
|
Consolidated Balance Sheets as of January 31, 2017 and 2016 |
|
63 |
|
|
Consolidated Statements of Operations and Comprehensive (Loss) Income for the years ended January 31, 2017, 2016 and 2015 |
|
64 |
|
|
Consolidated Statements of Stockholders’ Equity for the years ended January 31, 2017, 2016 and 2015 |
|
65 |
|
|
Consolidated Statements of Cash Flows for the years ended January 31, 2017, 2016 and 2015 |
|
66 |
|
|
Notes to Consolidated Financial Statements |
|
67 |
|
2. INDEX TO FINANCIAL STATEMENT SCHEDULES
The following financial statement schedule is filed as a part of this Annual Report on Form 10-K:
|
|
Page | ||
|
SCHEDULE II—VALUATION AND QUALIFYING ACCOUNTS |
|
90 |
|
All other schedules are omitted because they are not required or the required information is presented in the financial statements or notes thereto.
3. INDEX OF EXHIBITS
See the Index of Exhibits at page 96.
|
ITEM 16. |
FORM 10-K SUMMARY |
None.
Report of Independent Registered Public Accounting Firm
The Board of Directors and Stockholders
QAD Inc.:
We have audited the accompanying consolidated balance sheets of QAD Inc. and subsidiaries (the Company) as of January 31, 2017 and 2016, and the related consolidated statements of operations and comprehensive (loss) income, stockholders’ equity, and cash flows for each of the years in the three-year period ended January 31, 2017. In connection with our audits of the consolidated financial statements, we also have audited the related consolidated financial statement schedule. These consolidated financial statements and consolidated financial statement schedule are the responsibility of the Company’s management. Our responsibility is to express an opinion on these consolidated financial statements and consolidated financial statement schedule based on our audits.
We conducted our audits in accordance with the standards of the Public Company Accounting Oversight Board (United States). Those standards require that we plan and perform the audit to obtain reasonable assurance about whether the financial statements are free of material misstatement. An audit includes examining, on a test basis, evidence supporting the amounts and disclosures in the financial statements. An audit also includes assessing the accounting principles used and significant estimates made by management, as well as evaluating the overall financial statement presentation. We believe that our audits provide a reasonable basis for our opinion.
In our opinion, the consolidated financial statements referred to above present fairly, in all material respects, the financial position of QAD Inc. and subsidiaries as of January 31, 2017 and 2016, and the results of their operations and their cash flows for each of the years in the three-year period ended January 31, 2017, in conformity with U.S. generally accepted accounting principles. Also in our opinion, the related consolidated financial statement schedule, when considered in relation to the basic consolidated financial statements taken as a whole, presents fairly, in all material respects, the information set forth therein.
We also have audited, in accordance with the standards of the Public Company Accounting Oversight Board (United States), QAD’s internal control over financial reporting as of January 31, 2017, based on criteria established in Internal Control – Integrated Framework (2013) issued by the Committee of Sponsoring Organizations of the Treadway Commission (COSO), and our report dated April 7, 2017 expressed an unqualified opinion on the effectiveness of the Company’s internal control over financial reporting of QAD Inc.
/s/ KPMG LLP
Woodland Hills, California
April 7, 2017
QAD INC.
CONSOLIDATED BALANCE SHEETS
(in thousands, except share data)
|
January 31, |
||||||||
|
2017 |
2016 |
|||||||
|
Assets |
||||||||
|
Current assets: |
||||||||
|
Cash and equivalents |
$ | 145,082 | $ | 137,731 | ||||
|
Accounts receivable, net of allowances of $2,205 and $2,642 at January 31, 2017 and 2016, respectively |
69,441 | 65,512 | ||||||
|
Deferred tax assets, net |
— | 8,203 | ||||||
|
Other current assets |
15,351 | 16,024 | ||||||
|
Total current assets |
229,874 | 227,470 | ||||||
|
Property and equipment, net |
30,872 | 32,080 | ||||||
|
Capitalized software costs, net |
732 | 1,553 | ||||||
|
Goodwill |
10,558 | 10,645 | ||||||
|
Deferred tax assets, net |
6,166 | 12,914 | ||||||
|
Other assets, net |
2,688 | 2,679 | ||||||
|
Total assets |
$ | 280,890 | $ | 287,341 | ||||
|
Liabilities and Stockholders’ Equity |
||||||||
|
Current liabilities: |
||||||||
|
Current portion of long-term debt |
$ | 446 | $ | 422 | ||||
|
Accounts payable |
11,316 | 10,811 | ||||||
|
Deferred revenue |
104,125 | 97,911 | ||||||
|
Other current liabilities |
33,636 | 31,535 | ||||||
|
Total current liabilities |
149,523 | 140,679 | ||||||
|
Long-term debt |
13,767 | 14,191 | ||||||
|
Other liabilities |
4,914 | 4,465 | ||||||
|
Commitments and contingencies |
||||||||
|
Stockholders’ equity: |
||||||||
|
Preferred stock, $0.001 par value. Authorized 5,000,000 shares; none issued or outstanding |
— | — | ||||||
|
Common stock: |
||||||||
|
Class A, $0.001 par value. Authorized 71,000,000 shares; issued 16,605,215 shares and 16,603,729 shares at January 31, 2017 and 2016, respectively |
16 | 16 | ||||||
|
Class B, $0.001 par value. Authorized 4,000,000 shares; issued 3,537,380 shares and 3,537,366 shares at January 31, 2017 and 2016, respectively |
4 | 4 | ||||||
|
Additional paid-in capital |
197,594 | 195,808 | ||||||
|
Treasury stock, at cost (1,125,552 shares and 1,365,885 shares at January 31, 2017 and 2016, respectively) |
(15,170 | ) | (18,717 | ) | ||||
|
Accumulated deficit |
(61,127 | ) | (40,376 | ) | ||||
|
Accumulated other comprehensive loss |
(8,631 | ) | (8,729 | ) | ||||
|
Total stockholders’ equity |
112,686 | 128,006 | ||||||
|
Total liabilities and stockholders’ equity |
$ | 280,890 | $ | 287,341 | ||||
See accompanying notes to consolidated financial statements.
QAD INC.
CONSOLIDATED STATEMENTS OF OPERATIONS AND COMPREHENSIVE (LOSS) INCOME
(in thousands)
|
Years Ended January 31, |
||||||||||||
|
2017 |
2016 |
2015 |
||||||||||
|
Revenue: |
||||||||||||
|
Subscription fees |
$ | 52,167 | $ | 38,806 | $ | 28,217 | ||||||
|
License fees |
23,633 | 29,891 | 40,917 | |||||||||
|
Maintenance and other |
130,406 | 132,962 | 141,295 | |||||||||
|
Professional services |
71,767 | 76,193 | 84,672 | |||||||||
|
Total revenue |
277,973 | 277,852 | 295,101 | |||||||||
|
Costs of revenue: |
||||||||||||
|
Subscription fees |
27,027 | 20,635 | 17,149 | |||||||||
|
License fees |
2,990 | 3,624 | 5,016 | |||||||||
|
Maintenance and other |
30,517 | 30,973 | 32,511 | |||||||||
|
Professional services |
70,317 | 71,330 | 76,954 | |||||||||
|
Total cost of revenue |
130,851 | 126,562 | 131,630 | |||||||||
|
Gross profit |
147,122 | 151,290 | 163,471 | |||||||||
|
Operating expenses |
||||||||||||
|
Sales and marketing |
67,194 | 66,535 | 69,785 | |||||||||
|
Research and development |
43,587 | 41,237 | 42,315 | |||||||||
|
General and administrative |
32,318 | 32,689 | 34,680 | |||||||||
|
Amortization of intangible assets from acquisitions |
659 | 658 | 706 | |||||||||
|
Total operating expenses |
143,758 | 141,119 | 147,486 | |||||||||
|
Operating income |
3,364 | 10,171 | 15,985 | |||||||||
|
Other (income) expense: |
||||||||||||
|
Interest income |
(696 |
) |
(320 |
) |
(242 |
) | ||||||
|
Interest expense |
670 | 712 | 811 | |||||||||
|
Other (income) expense, net |
(436 |
) |
(757 |
) |
(169 |
) | ||||||
|
Total other (income) expense, net |
(462 |
) |
(365 |
) |
400 | |||||||
|
Income before income taxes |
3,826 | 10,536 | 15,585 | |||||||||
|
Income tax expense |
19,276 | 1,624 | 2,639 | |||||||||
|
Net (loss) income |
$ | (15,450 |
) |
$ | 8,912 | $ | 12,946 | |||||
|
Basic net (loss) income per share: |
||||||||||||
|
Class A |
$ | (0.84 |
) |
$ | 0.49 | $ | 0.84 | |||||
|
Class B |
$ | (0.70 |
) |
$ | 0.41 | $ | 0.70 | |||||
|
Diluted net (loss) income per share: |
||||||||||||
|
Class A |
$ | (0.84 |
) |
$ | 0.47 | $ | 0.79 | |||||
|
Class B |
$ | (0.70 |
) |
$ | 0.40 | $ | 0.68 | |||||
|
Net (loss) income |
$ | (15,450 |
) |
$ | 8,912 | $ | 12,946 | |||||
|
Other comprehensive income (loss), net of tax |
||||||||||||
|
Foreign currency translation adjustment |
98 | (1,311 |
) |
(460 |
) | |||||||
|
Total comprehensive (loss) income |
$ | (15,352 |
) |
$ | 7,601 | $ | 12,486 | |||||
See accompanying notes to consolidated financial statements.
QAD INC.
CONSOLIDATED STATEMENTS OF STOCKHOLDERS’ EQUITY
(in thousands)
|
Number of Shares |
Amount |
Additional Paid-in |
Treasury |
Accumulated |
Accumulated Other Comprehensive |
Total Stockholders’ |
||||||||||||||||||||||||||||||||||
|
Class A |
Class B |
Treasury |
Class A |
Class B |
Capital |
Stock |
Deficit |
Loss |
Equity |
|||||||||||||||||||||||||||||||
|
Balance, January 31, 2014 |
14,150 | 3,537 | (1,930 |
) |
$ | 14 | $ | 4 | $ | 150,837 | $ | (28,220 |
) |
$ | (52,613 |
) |
$ | (6,958 |
) |
$ | 63,064 | |||||||||||||||||||
|
Net income |
— | — | — | — | — | — | — | 12,946 | — | 12,946 | ||||||||||||||||||||||||||||||
|
Foreign currency translation adjustments |
— | — | — | — | — | — | — | — | (460 |
) |
(460 |
) | ||||||||||||||||||||||||||||
|
Stock award exercises |
1 | — | 199 | — | — | (5,188 |
) |
3,749 | (138 |
) |
— | (1,577 |
) | |||||||||||||||||||||||||||
|
Stock-based compensation income tax deficiencies |
— | — | — | — | — | (15 |
) |
— | — | — | (15 |
) | ||||||||||||||||||||||||||||
|
Stock compensation expense |
— | — | — | — | — | 4,993 | — | — | — | 4,993 | ||||||||||||||||||||||||||||||
|
Dividends declared ($0.288 and $0.24 per Class A and Class B share, respectively) |
— | — | — | — | — | — | — | (4,452 |
) |
— | (4,452 |
) | ||||||||||||||||||||||||||||
|
Proceeds from stock issuance, net of costs |
2,000 | — | — | 2 | — | 37,044 | — | — | — | 37,046 | ||||||||||||||||||||||||||||||
|
Restricted stock |
1 | — | 121 | — | — | (2,125 |
) |
1,494 | (349 |
) |
— | (980 |
) | |||||||||||||||||||||||||||
|
Balance, January 31, 2015 |
16,152 | 3,537 | (1,610 |
) |
$ | 16 | $ | 4 | $ | 185,546 | $ | (22,977 |
) |
$ | (44,606 |
) |
$ | (7,418 |
) |
$ | 110,565 | |||||||||||||||||||
|
Net income |
— | — | — | — | — | — | — | 8,912 | — | 8,912 | ||||||||||||||||||||||||||||||
|
Foreign currency translation adjustments |
— | — | — | — | — | — | — | — | (1,311 |
) |
(1,311 |
) | ||||||||||||||||||||||||||||
|
Stock award exercises |
— | — | 105 | — | — | (3,289 |
) |
2,207 | (9 |
) |
— | (1,091 |
) | |||||||||||||||||||||||||||
|
Stock-based compensation income tax benefits |
— | — | — | — | — | 736 | — | — | — | 736 | ||||||||||||||||||||||||||||||
|
Stock compensation expense |
— | — | — | — | — | 7,440 | — | — | — | 7,440 | ||||||||||||||||||||||||||||||
|
Dividends declared ($0.288 and $0.24 per Class A and Class B share, respectively) |
— | — | — | — | — | — | — | (5,235 |
) |
— | (5,235 |
) | ||||||||||||||||||||||||||||
|
Proceeds from stock issuance, net of costs |
450 | — | — | — | — | 8,365 | — | — | — | 8,365 | ||||||||||||||||||||||||||||||
|
Restricted stock |
2 | — | 139 | — | — | (3,378 |
) |
2,053 | (45 |
) |
— | (1,370 |
) | |||||||||||||||||||||||||||
|
Balance, January 31, 2016 |
16,604 | 3,537 | (1,366 |
) |
$ | 16 | $ | 4 | $ | 195,420 | $ | (18,717 |
) |
$ | (40,983 |
) |
$ | (8,729 |
) |
$ | 127,011 | |||||||||||||||||||
|
Cumulative effect of the adoption of ASU 2016-09 |
— | — | — | — | — | 388 | — | 607 | — | 995 | ||||||||||||||||||||||||||||||
|
Adjusted balance at February 1, 2016 |
16,604 | 3,537 | (1,366 |
) |
$ | 16 | $ | 4 | $ | 195,808 | $ | (18,717 |
) |
$ | (40,376 |
) |
$ | (8,729 |
) |
$ | 128,006 | |||||||||||||||||||
|
Net loss |
— | — | — | — | — | — | — | (15,450 |
) |
— | (15,450 |
) | ||||||||||||||||||||||||||||
|
Foreign currency translation adjustments |
— | — | — | — | — | — | — | — | 98 | 98 | ||||||||||||||||||||||||||||||
|
Stock award exercises |
— | — | 59 | — | — | (1,406 |
) |
795 | — | — | (611 |
) | ||||||||||||||||||||||||||||
|
Stock-based compensation income tax benefits |
— | — | — | — | — | 89 | — | — | — | 89 | ||||||||||||||||||||||||||||||
|
Stock compensation expense |
— | — | — | — | — | 7,323 | — | — | — | 7,323 | ||||||||||||||||||||||||||||||
|
Dividends declared ($0.288 and $0.24 per Class A and Class B share, respectively) |
— | — | — |
— — |
— | — | — | (5,301 |
) |
— | (5,301 |
) | ||||||||||||||||||||||||||||
|
Restricted stock |
1 | — | 182 | — | — | (4,220 |
) |
2,752 | — | — | (1,468 |
) | ||||||||||||||||||||||||||||
|
Balance, January 31, 2017 |
16,605 | 3,537 | (1,125 |
) |
$ | 16 | $ | 4 | $ | 197,594 | $ | (15,170 |
) |
$ | (61,127 |
) |
$ | (8,631 |
) |
$ | 112,686 | |||||||||||||||||||
See accompanying notes to consolidated financial statements.
QAD INC.
CONSOLIDATED STATEMENTS OF CASH FLOWS
(in thousands)
|
Years Ended January 31, |
||||||||||||
|
2017 |
2016 |
2015 |
||||||||||
|
Cash flows from operating activities: |
||||||||||||
|
Net (loss) income |
$ | (15,450 |
) |
$ | 8,912 | $ | 12,946 | |||||
|
Adjustments to reconcile net (loss) income to net cash provided by operating activities: |
||||||||||||
|
Depreciation and amortization |
6,046 | 5,785 | 5,759 | |||||||||
|
Provision for doubtful accounts and sales adjustments |
237 | 774 | 854 | |||||||||
|
Loss on disposal of property and equipment |
41 | 29 | 8 | |||||||||
|
Other deferred income taxes |
(2,035 |
) |
(3,154 |
) |
(2,562 | ) | ||||||
|
Change in fair value of a derivative instrument |
(485 |
) |
48 | 877 | ||||||||
|
Stock compensation expense |
7,323 | 7,440 | 4,993 | |||||||||
|
Net change in valuation allowance |
16,861 | 2,564 | 1,657 | |||||||||
|
Adjustment of contingent liability associated with acquisitions |
— | — | 42 | |||||||||
|
Changes in assets and liabilities, net of effects from acquisitions: |
||||||||||||
|
Accounts receivable |
(4,141 |
) |
10,804 | (11,236 |
) | |||||||
|
Other assets |
(90 |
) |
(2,768 |
) |
(431 |
) | ||||||
|
Accounts payable |
646 | (1,441 |
) |
2,568 | ||||||||
|
Deferred revenue |
7,245 | (2,675 |
) |
4,912 | ||||||||
|
Other liabilities |
2,482 | (2,261 | ) | 3,576 | ||||||||
|
Net cash provided by operating activities |
18,680 | 24,057 | 23,963 | |||||||||
|
Cash flows from investing activities: |
||||||||||||
|
Purchase of property and equipment |
(3,267 |
) |
(3,208 |
) |
(4,577 |
) | ||||||
|
Capitalized software costs |
(146 |
) |
(153 |
) |
(311 |
) | ||||||
|
Other, net |
7 | 13 | 9 | |||||||||
|
Net cash used in investing activities |
(3,406 |
) |
(3,348 |
) |
(4,879 |
) | ||||||
|
Cash flows from financing activities: |
||||||||||||
|
Repayments of debt |
(434 |
) |
(406 |
) |
(388 |
) | ||||||
|
Dividends paid |
(5,301 |
) |
(5,235 |
) |
(4,452 |
) | ||||||
|
Tax payments, net of proceeds, related to stock awards |
(2,079 |
) |
(2,461 |
) |
(2,557 |
) | ||||||
|
Payment of contingent liability associated with acquisitions |
— | (750 | ) | (471 | ) | |||||||
|
Proceeds from issuance of common stock, net of issuance costs |
— | 8,365 | 37,046 | |||||||||
|
Net cash (used in) provided by financing activities |
(7,814 |
) |
(487 |
) |
29,178 | |||||||
|
Effect of exchange rates on cash and equivalents |
(109 |
) |
(3,017 |
) |
(3,720 |
) | ||||||
|
Net increase in cash and equivalents |
7,351 | 17,205 | 44,542 | |||||||||
|
Cash and equivalents at beginning of year |
137,731 | 120,526 | 75,984 | |||||||||
|
Cash and equivalents at end of year |
$ | 145,082 | $ | 137,731 | $ | 120,526 | ||||||
|
Supplemental disclosure of cash flow information: |
||||||||||||
|
Cash paid during the period for: |
||||||||||||
|
Interest |
$ | 655 | $ | 700 | $ | 735 | ||||||
|
Income taxes, net of refunds |
3,396 | 3,925 | 3,284 | |||||||||
See accompanying notes to consolidated financial statements.
QAD INC.
NOTES TO CONSOLIDATED FINANCIAL STATEMENTS
1. SUMMARY OF BUSINESS AND SIGNIFICANT ACCOUNTING POLICIES
BUSINESS
QAD is a global provider of vertically-oriented, mission-critical enterprise software solutions for global manufacturing companies across the automotive, life sciences, consumer products, food and beverage, high technology and industrial products industries. QAD Enterprise Applications enables measurement and control of key business processes and supports operational requirements, including financials, manufacturing, demand and supply chain planning, customer management, business intelligence and business process management. QAD delivers its software solutions to customers in a format that best meets their current and future needs - either in the cloud, on premise, or via blended deployment, which is a combination of certain sites on premise and others in the cloud. QAD provides ongoing support to customers which ensures they always have access to the latest features of its software. QAD provides professional services to assist customers in deploying, upgrading and optimizing the Company’s software so they can maximize the benefit they receive from QAD solutions in their operating environment. QAD was founded in 1979, incorporated in California in 1986 and reincorporated in Delaware in 1997.
In fiscal 2015, QAD successfully closed a public offering of 2 million shares of Class A stock resulting in net cash received of $37.0 after underwriting discounts and commissions and offering expenses. On February 18, 2015 the offering underwriters exercised in full an option to purchase additional shares. As a result, 450,000 shares of Class A common stock were issued in fiscal 2016 generating approximately $8.4 million in additional proceeds.
PRINCIPLES OF CONSOLIDATION
The consolidated financial statements include the accounts of QAD Inc. and all of its subsidiaries. All subsidiaries are wholly-owned and all significant balances and transactions among the entities have been eliminated from the consolidated financial statements.
USE OF ESTIMATES
The financial statements have been prepared in conformity with U.S. generally accepted accounting principles and, accordingly, include amounts based on informed estimates and judgments of management that affect the reported amounts of assets and liabilities, disclosure of contingent assets and liabilities at the date of the Company’s financial statements, and the reported amounts of revenue and expenses during the reporting period. Actual results could differ from those estimates. Changes in estimates resulting from continuing changes in the economic environment will be reflected in the financial statements in future periods.
The Company considers certain accounting policies related to revenue, accounts receivable allowances for doubtful accounts, capitalized software development costs, goodwill and intangible assets, valuation of deferred tax assets and tax contingency reserves, and accounting for stock-based compensation to be critical policies due to the significance of these items to its operating results and the estimation processes and management judgment involved in each.
FOREIGN CURRENCY TRANSLATIONS AND TRANSACTIONS
The financial position and results of operations of the Company’s foreign subsidiaries are generally determined using the country’s local currency as the functional currency. Assets and liabilities recorded in foreign currencies are translated at the exchange rates on the balance sheet date. Revenue and expenses are translated at average rates of exchange prevailing during the year. Translation adjustments resulting from this process are charged or credited to other comprehensive (loss) income, which is included in “Accumulated other comprehensive loss” within the Consolidated Balance Sheets.
Gains and losses resulting from foreign currency transactions and remeasurement adjustments of monetary assets and liabilities not held in an entity’s functional currency are included in earnings. Foreign currency transaction and remeasurement losses (gains) for fiscal 2017, 2016 and 2015 totaled $0.2 million, $(0.5) million and $(0.9) million, respectively, and are included in “Other (income) expense, net” in the accompanying Consolidated Statements of Operations and Comprehensive (Loss) Income.
CASH AND EQUIVALENTS
Cash and equivalents consist of cash and short-term marketable securities with maturities of less than 90 days at the date of purchase. The Company considers all highly liquid investments purchased with an original maturity of 90 days or less to be cash equivalents. At January 31, 2017 and 2016, the Company’s cash and equivalents consisted of money market mutual funds invested in U.S. Treasury and government securities, deposit accounts and certificates of deposit.
ACCOUNTS RECEIVABLE, NET
Accounts receivable, net, consisted of the following as of January 31:
|
2017 |
2016 |
|||||||
|
(in thousands) |
||||||||
|
Accounts receivable |
$ | 71,647 | $ | 68,154 | ||||
|
Less allowance for: |
||||||||
|
Doubtful accounts |
(1,090 |
) |
(1,242 |
) | ||||
|
Sales adjustments |
(1,116 |
) |
(1,400 |
) | ||||
|
Accounts receivable, net |
$ | 69,441 | $ | 65,512 | ||||
Trade accounts receivable are recorded at the invoiced amount and do not bear interest. The collectability of accounts receivable is reviewed each period by analyzing balances based on age. Specific allowances are recorded for any balances that the Company determines may not be fully collectible due to a customer’s inability to pay. The Company also provides a general reserve based on historical data including analysis of write-offs and other known factors. Provisions to the allowance for bad debts are included as bad debt expense in “General and Administrative” expense. The determination to write-off specific accounts receivable balances is based on the likelihood of collection and past due status. Past due status is based on invoice date and terms specific to each customer.
The Company does not generally provide a contractual right of return; however, in the course of business sales adjustments related to customer dispute resolution may occur. A provision is recorded against revenue for estimated sales adjustments in the same period the related revenues are recorded or when current information indicates additional amounts are required. These estimates are based on historical experience, specifically identified customers and other known factors.
FINANCIAL INSTRUMENTS AND CONCENTRATION OF CREDIT RISK
The carrying amounts of cash and equivalents, accounts receivable and accounts payable approximate fair value due to the short-term maturities of these instruments. The Company’s line of credit and note payable both bear a variable market interest rate, subject to certain minimum interest rates. Therefore, the carrying amounts outstanding under the line of credit and note payable reasonably approximate fair value.
Concentration of credit risk with respect to trade receivables is limited due to the large number of customers comprising our customer base, and their dispersion across many different industries and locations throughout the world. No single customer accounted for 10% or more of the Company’s total revenue in any of the last three fiscal years. In addition, no single customer accounted for 10% or more of accounts receivable at January 31, 2017 or 2016.
PROPERTY AND EQUIPMENT
Property and equipment are stated at cost. Additions and significant improvements to property and equipment are capitalized, while maintenance and repairs are expensed as incurred. For financial reporting purposes, depreciation is generally expensed via the straight-line method over the useful life of three years for computer equipment and software, five years for furniture and office equipment, 10 years for building improvements, and 39 years for buildings. Leasehold improvements are depreciated over the shorter of the lease term or the useful life of five years.
Certain costs associated with software developed for internal use, including payroll costs for employees, are capitalized once the project has reached the application development stage and are included in property and equipment classified as software. These costs are amortized using the straight-line method over the expected useful life of the software, beginning when the asset is substantially ready for use. Costs incurred during the preliminary project stage, maintenance, training and research and development costs are expensed as incurred.
Property and equipment, net consisted of the following as of January 31:
|
2017 |
2016 |
|||||||
|
(in thousands) |
||||||||
|
Buildings and building improvements |
$ | 31,979 | $ | 31,968 | ||||
|
Computer equipment and software |
16,027 | 16,090 | ||||||
|
Furniture and office equipment |
6,748 | 7,149 | ||||||
|
Leasehold improvements |
5,984 | 5,814 | ||||||
|
Land |
3,850 | 3,850 | ||||||
|
Automobiles |
54 | 54 | ||||||
| 64,642 | 64,925 | |||||||
|
Less accumulated depreciation and amortization |
(33,770 |
) |
(32,845 |
) | ||||
| $ | 30,872 | $ | 32,080 | |||||
The changes in property and equipment, net, for the fiscal years ended January 31 were as follows:
|
2017 |
2016 |
|||||||
|
(in thousands) |
||||||||
|
Cost |
||||||||
|
Balance at February 1 |
$ | 64,925 | $ | 64,661 | ||||
|
Additions |
3,267 | 3,208 | ||||||
|
Disposals |
(3,258 |
) |
(2,072 |
) | ||||
|
Impact of foreign currency translation |
(292 |
) |
(872 |
) | ||||
|
Balance at January 31 |
64,642 | 64,925 | ||||||
|
Accumulated depreciation |
||||||||
|
Balance at February 1 |
(32,845 |
) |
(31,507 |
) | ||||
|
Depreciation |
(4,326 |
) |
(3,968 |
) | ||||
|
Disposals |
3,211 | 2,043 | ||||||
|
Impact of foreign currency translation |
190 | 587 | ||||||
|
Balance at January 31 |
(33,770 |
) |
(32,845 |
) | ||||
|
Property and equipment, net at January 31 |
$ | 30,872 | $ | 32,080 | ||||
Depreciation and amortization expense of property and equipment for fiscal 2017, 2016 and 2015 was $4.3 million, $4.0 million and $3.8 million, respectively. There was no impairment of property and equipment assets during fiscal 2017, 2016 and 2015.
CAPITALIZED SOFTWARE COSTS
The Company capitalizes software development costs incurred in connection with the localization and translation of its products once technological feasibility has been achieved based on a working model. A working model is defined as an operative version of the computer software product that is completed in the same software language as the product to be ultimately marketed, performs all the major functions planned for the product and is ready for initial customer testing (usually identified as beta testing). In addition, the Company capitalizes software purchased from third parties or through business combinations as acquired software technology, if the related software under development has reached technological feasibility.
The amortization of capitalized software costs is the greater of the straight-line basis over three years, the expected useful life, or a computation using a ratio of current revenue for a product compared to the estimated total of current and future revenues for that product. The Company periodically compares the unamortized capitalized software costs to the estimated net realizable value of the associated product. The amount by which the unamortized capitalized software costs of a particular software product exceeds the estimated net realizable value of that asset would be reported as a charge to the Consolidated Statements of Operations and Comprehensive (Loss) Income.
Capitalized software costs and accumulated amortization at January 31 were as follows:
|
2017 |
2016 |
|||||||
|
(in thousands) |
||||||||
|
Capitalized software costs: |
||||||||
|
Acquired software technology |
$ | 3,458 | $ | 3,458 | ||||
|
Capitalized software development costs (1) |
748 | 1,029 | ||||||
| Subtotal capitalized software costs | 4,206 | 4,487 | ||||||
|
Less accumulated amortization |
(3,474 |
) |
(2,934 |
) | ||||
|
Capitalized software costs, net |
$ | 732 | $ | 1,553 | ||||
______________________________
|
(1) |
Capitalized software development costs include the impact of foreign currency translation. |
Acquired software technology costs relate to technology purchased from the Company’s fiscal 2013 acquisitions of DynaSys and CEBOS. In addition to the acquired software technology, the Company has capitalized costs related to translations and localizations of QAD Enterprise Applications.
It is the Company’s policy to write off capitalized software development costs once fully amortized. Accordingly, during fiscal 2017, approximately $0.4 million of costs and accumulated amortization was removed from the balance sheet.
Amortization of capitalized software costs for fiscal 2017, 2016 and 2015 was $1.0 million, $1.1 million and $1.1 million, respectively. Amortization of capitalized software costs is included in “Cost of license fees” in the accompanying Consolidated Statements of Operations and Comprehensive (Loss) Income.
Estimated amortization expense relating to the Company’s capitalized software costs as of January 31, 2017 is $628,000, $79,000 and $25,000 in fiscal 2018, 2019 and 2020 respectively.
GOODWILL AND INTANGIBLE ASSETS
Goodwill represents the excess of the purchase price over the fair value of net assets of purchased businesses. Goodwill is not amortized, but instead is subject to impairment tests on at least an annual basis and whenever circumstances suggest that goodwill may be impaired. The Company tests goodwill for impairment in the fourth quarter of each fiscal year. The Company performs a two-step impairment test. Under the first step of the goodwill impairment test, the Company is required to compare the fair value of a reporting unit with its carrying amount, including goodwill. If the fair value of a reporting unit exceeds its carrying amount, goodwill of the reporting unit is not considered impaired and the second step is not performed. If the results of the first step of the impairment test indicate that the fair value of a reporting unit does not exceed its carrying amount, then the second step of the goodwill impairment test is required. The second step of the goodwill impairment test compares the implied fair value of the reporting unit goodwill with the carrying amount of that goodwill. The impairment loss is measured by the excess of the carrying amount of the reporting unit goodwill over the implied fair value of that goodwill.
Management evaluates the Company as a single reporting unit for business and operating purposes as almost all of the Company’s revenue streams are generated by the same underlying technology whether acquired, purchased or developed. In addition, the majority of QAD’s costs are, by their nature, shared costs that are not specifically identifiable to a geography or product line but relate to almost all products. As a result, there is a high degree of interdependency among the Company’s revenues and cash flows for levels below the consolidated entity and identifiable cash flows for a component separate from the consolidated entity are not meaningful. Therefore, the Company’s impairment test considers the consolidated entity as a single reporting unit.
Judgments about the recoverability of purchased finite lived intangible assets are made whenever events or changes in circumstances indicate that an impairment may exist. Each fiscal year the Company evaluates the estimated remaining useful lives of purchased intangible assets and whether events or changes in circumstances warrant a revision to the remaining periods of amortization. Recoverability of finite-lived intangible assets is measured by comparison of the carrying amount of the asset to the future undiscounted cash flows the asset is expected to generate.
Assumptions and estimates about future values and remaining useful lives of intangible assets are complex and subjective. They can be affected by a variety of factors, including external factors such as industry and economic trends and internal factors such as changes in the Company’s business strategy or internal forecasts.
The changes in the carrying amount of goodwill for the fiscal years ended January 31, 2017, and 2016 were as follows:
|
Gross Carrying Amount |
Accumulated Impairment |
Goodwill, Net |
||||||||||
|
(in thousands) |
||||||||||||
|
Balance at January 31, 2015 |
$ | 26,519 | $ | (15,608 |
) |
$ | 10,911 | |||||
|
Impact of foreign currency translation |
(266 |
) |
— | (266 |
) | |||||||
|
Balance at January 31, 2016 |
26,253 | (15,608 |
) |
10,645 | ||||||||
|
Impact of foreign currency translation |
(87 |
) |
— | (87 |
) | |||||||
|
Balance at January 31, 2017 |
$ | 26,166 | $ | (15,608 |
) |
$ | 10,558 | |||||
During each of the fourth quarters of fiscal 2017, 2016 and 2015, an impairment analysis was performed at the enterprise level which compared the Company’s market capitalization to its net assets as of the test date, November 30. As the market capitalization substantially exceeded the Company’s net assets, there was no indication of goodwill impairment for fiscal 2017, 2016 and 2015.
Intangible assets as of January 31 were as follows:
|
2017 |
2016 |
|||||||
|
(in thousands) |
||||||||
|
Amortizable intangible assets |
||||||||
|
Customer relationships (1) |
$ | 2,721 | $ | 2,749 | ||||
|
Trade name |
515 | 515 | ||||||
| 3,236 | 3,264 | |||||||
|
Less: accumulated amortization |
(2,821 |
) |
(2,191 |
) | ||||
|
Net amortizable intangible assets |
$ | 415 | $ | 1,073 | ||||
_________________________________
|
(1) |
Customer relationships include the impact of foreign currency translation. |
The Company’s intangible assets as of January 31, 2017 are related to the DynaSys and CEBOS acquisitions completed in fiscal 2013. Intangible assets are included in “Other assets, net” in the accompanying Consolidated Balance Sheets. As of January 31, 2017, all of the Company’s intangible assets were determined to have finite useful lives, and therefore were subject to amortization.
Amortization of intangible assets was $0.7 million for each of the fiscal years 2017, 2016 and 2015. The following table summarizes the estimated amortization expense relating to the Company’s intangible assets as of January 31, 2017:
|
Fiscal Years |
(in thousands) |
|||
|
2018 |
$ | 415 | ||
| $ | 415 | |||
DEFERRED TAX ASSETS AND LIABILITIES
The Company recognizes deferred tax assets and liabilities for temporary differences between the financial reporting basis and the tax basis of its assets and liabilities and expected benefits of utilizing net operating loss and credit carryforwards. In assessing whether there is a need for a valuation allowance on deferred tax assets, the Company determines whether it is more likely than not that it will realize tax benefits associated with deferred tax assets. In making this determination, the Company considers future taxable income and tax planning strategies that are both prudent and feasible. For deferred tax assets that cannot be recognized under the more-likely-than-not standard, the Company has established a valuation allowance. The impact on deferred taxes of changes in tax rates and laws, if any, are reflected in the financial statements in the period of enactment. No provision is made for taxes on unremitted earnings of foreign subsidiaries because they are considered to be reinvested indefinitely in such operations.
The Company records a liability for taxes to address potential exposures involving uncertain tax positions that could be challenged by taxing authorities, even though the Company believes that the positions taken are appropriate. The tax reserves are reviewed on a quarterly basis and adjusted as events occur that affect the Company’s potential liability for additional taxes. The Company is subject to income taxes in the U.S. and in various foreign jurisdictions, and in the ordinary course of business there are many transactions and calculations where the ultimate tax determination is uncertain. For tax positions that are more likely than not of being sustained upon audit, the Company recognizes the largest amount of the benefit that is greater than 50% likely of being realized upon ultimate settlement in the financial statements. For tax positions that do not meet the more-likely-than-not standard the entire balance is reserved.
STOCK-BASED COMPENSATION
The Company accounts for share-based payments (“equity awards”) to employees in accordance with ASC 718, Compensation—Stock Compensation (“ASC 718”), which requires that share-based payments (to the extent they are compensatory) be recognized in the Consolidated Statements of Income and Comprehensive Income based on the fair values of the equity awards as measured at the grant date. The fair value of an equity award is recognized as stock-based compensation expense ratably over the vesting period of the equity award. Determining the fair value of equity awards at the grant date requires judgment.
Fair Value of SARs
The fair value of stock-settled stock appreciation rights (“SARs”) is determined on the grant date of the award using the Black-Scholes-Merton valuation model. One of the inputs to the Black-Scholes-Merton valuation model is the fair market value of the Company’s stock on the date of grant. Judgment is required in determining the remaining inputs to the Black-Scholes-Merton valuation model. These inputs include the expected life, volatility, the risk-free interest rate and the dividend rate. The following describes the Company’s policies with respect to determining these valuation inputs:
Expected Life
The expected life valuation input includes a computation that is based on historical vested SAR exercises and post-vest expiration patterns and an estimate of the expected life for SARs that were fully vested and outstanding. Furthermore, based on the Company’s historical pattern of SAR exercises and post-vest expiration patterns the Company determined that there are two discernible populations which include the Company’s directors and officers (“D&O”) and all other QAD employees. The estimate of the expected life for SARs that were fully vested and outstanding is determined as the midpoint of a range as follows: the low end of the range assumes the fully vested and outstanding SARs are exercised or expire unexercised on the evaluation date and the high end of the range assumes that these SARs are exercised or expire unexercised upon contractual term.
Volatility
The volatility valuation input is based on the historical volatility of the Company’s common stock, which the Company believes is representative of the expected volatility over the expected life of SARs.
Risk-Free Interest Rate
The risk-free interest rate is based on the U.S. Treasury constant maturities in effect at the time of grant for the expected term of the SAR.
Dividend Rate
The dividend rate is based on the Company’s historical dividend payments per share.
Fair Value of RSUs
The fair value of restricted stock units (“RSUs”) is determined on the grant date of the award as the market price of the Company’s common stock on the date of grant, reduced by the present value of estimated dividends foregone during the vesting period. Judgment is required in determining the present value of estimated dividends foregone during the vesting period. The Company estimates the dividends for purposes of this calculation based on the Company’s historical dividend payments per share, which has remained consistent over the last three years.
The Company elected to early adopt the new guidance provided by ASU 2016-09, “Improvements to Employee Share-Based Payment Accounting” in the third quarter of fiscal year 2017. At adoption, the Company elected to account for forfeitures as they occur.
COMPREHENSIVE (LOSS) INCOME
Comprehensive (loss) income includes changes in the balances of items that are reported directly as a separate component of Stockholders’ Equity on the Consolidated Balance Sheets. The components of comprehensive (loss) income are net (loss) income and foreign currency translation adjustments. The Company does not provide for income taxes on foreign currency translation adjustments since it does not provide for taxes on the unremitted earnings of its foreign subsidiaries. The changes in “Accumulated other comprehensive loss” are included in the Company’s Consolidated Statements of Operations and Comprehensive (Loss) Income.
REVENUE
The Company offers its software using two models, a traditional on-premise licensing model and a cloud delivery model. The traditional model involves the sale or license of software on a perpetual basis to customers who take possession of the software and install and maintain the software on their own hardware. Under the cloud delivery model the Company provides access to the software on a hosted basis as a service and customers generally do not have the contractual right to take possession of the software.
Revenue is recognized when 1) persuasive evidence of an arrangement exists 2) delivery has occurred or services has been rendered 3) fees are fixed or determinable and 4) collectability is probable. If we determine that any of the four criteria is not met, we will defer recognition of revenue until all the criteria are met.
Revenue is presented net of sales, use and value-added taxes collected from customers.
Software Revenue Recognition (On-Premise Model)
The majority of the Company’s software is sold or licensed in multiple-element arrangements that include support services and often consulting services or other elements. Delivery of software is considered to have occurred upon electronic transfer of the license key that provides immediate availability of the product to the purchaser. Determining whether and when some of the above noted revenue recognition criteria have been satisfied often involves assumptions and judgments that can have a significant impact on the timing and amount of revenue reported. Typical payment terms vary by region. Occasionally, payment terms of up to one year may be granted for software license fees to customers with an established history of collections without concessions.
Provided all other revenue recognition criteria have been met, the Company recognizes license revenue on delivery using the residual method when VSOE exists for all of the undelivered elements (for example, support services, consulting, or other services) in the arrangement. Revenue is allocated to each undelivered element based on VSOE, which is the price charged when that element is sold separately or, for elements not yet sold separately, the price established by management if it is probable that the price will not change before the element is sold separately. The Company allocates revenue to undelivered support services (maintenance) based on rates charged to renew the support services annually after an initial period. Revenue is allocated to undelivered consulting services based on time and materials rates of stand-alone services engagements by role and by country. The Company reviews VSOE at least annually. If the Company is unable to establish or maintain VSOE for one or more undelivered elements within a multiple-element software arrangement, it could adversely impact revenues, results of operations and financial position because the Company may have to defer all or a portion of the revenue or recognize revenue ratably.
Multiple-element software arrangements for which VSOE does not exist for all undelivered elements typically occur when the Company introduces a new product or product bundles for which the Company has not established VSOE for support services or fixed fee consulting or other services. In these instances, revenue is deferred and recognized ratably over the longer of the support services (maintenance period) or consulting services engagement, assuming there are no specified future deliverables. In the instances in which it has been determined that revenue on these bundled arrangements will be recognized ratably due to lack of VSOE, at the time of recognition, the Company allocates revenue from these bundled arrangement fees to all of the non-license revenue categories based on VSOE of similar support services or consulting services. The remaining arrangement fees, if any, are then allocated to software license fee revenues. The associated costs primarily consist of payroll and related costs to perform both the consulting services and provide support services and royalty expense related to the license and maintenance revenue. These costs are expensed as incurred and included in cost of maintenance, subscription and other revenue, cost of professional services and cost of license fees.
Revenue from support services and product updates, referred to as maintenance revenue, is recognized ratably over the term of the maintenance period, which in most instances is one year. Software license updates provide customers with rights to unspecified software product updates, maintenance releases and patches released during the term of the support period on a when-and-if available basis. Product support includes Internet access to technical content, as well as Internet and telephone access to technical support personnel. Customers generally purchase both product support and license updates when they acquire new software licenses. In addition, a majority of customers renew their support services contracts annually.
The Company occasionally resells third party systems as part of an end-to-end solution requested by customers. Hardware revenue is recognized on a gross basis in accordance with the guidance contained in ASC 605-45, Revenue Recognition – Principal Agent Considerations. Delivery is considered to occur when the product is shipped and title and risk of loss have passed to the customer.
The Company executes arrangements through indirect sales channels via sales agents and distributors in which the indirect sales channels are authorized to market the Company’s software products to end users. In arrangements with sales agents, revenue is recognized on a sell-through basis once an order is received from the end user, collectability from the end user is probable, a signed license agreement from the end user has been received, delivery has been made to the end user and all other revenue recognition criteria have been satisfied. Sales agents are compensated on a commission basis. Distributor arrangements are those in which the resellers are authorized to market and distribute our software products to end users in specified territories and the distributor bears the risk of collection from the end user customer. The Company recognizes revenue from transactions with distributors when the distributor submits a written purchase commitment, collectability from the distributor is probable, a signed license agreement is received from the distributor and delivery has occurred to the distributor, provided that all other revenue recognition criteria have been satisfied. Revenue from distributor transactions is recorded on a net basis (the amount actually received by the Company from the distributor). The Company does not offer rights of return, product rotation or price protection to any distributors.
Subscription Revenue Recognition
The Company recognizes the following fees in subscription revenue: i) subscription fees from customers accessing the Company’s cloud and other subscription offerings, ii) transition fees for services such as set up, configuration, database conversion and migration, and iii) support fees on hosted products. Subscription arrangements do not generally provide customers with the right to take possession of the subscribed software.
Subscription revenue is recognized ratably over the initial subscription period committed to by the customer commencing when the customer has been given access to the cloud environment. Transition fees are recognized over the estimated life of the customer relationship once the customer has gone live. The initial subscription period is typically 12 to 60 months. Subscription services are non-cancelable, though customers typically have the right to terminate their contracts if we materially fail to perform. The Company generally invoices customers in advance in quarterly or annual installments and typical payment terms provide that customers pay the Company within 30 days of invoice.
The Company may enter into multiple-element arrangements that may include a combination of subscription offering and other professional services or arrangements that may include both software and non-software elements. The Company allocates revenue to each element in an arrangement based on a selling price hierarchy in accordance with ASC 605-25, Revenue Recognition - Multiple Deliverable Revenue Arrangements. In order to treat deliverables in a multiple-deliverable arrangement as separate units of accounting, the deliverables must have standalone value upon delivery. The Company evaluates each element in a multiple-element arrangement to determine whether it represents a separate unit of accounting. An element constitutes a separate unit of accounting when the item has standalone value and delivery of any undelivered elements is probable and within the Company’s control. Subscription and support services have standalone value because they are routinely sold separately. Consulting services and other services have standalone value because the Company has sold consulting services separately and there are several third party vendors that routinely provide similar consulting services to the Company’s customers on a standalone basis. Relative selling price for a deliverable is based on its VSOE, if available, or Estimated Selling Price (“ESP”), if VSOE is not available. The Company has determined that third-party evidence (“TPE”) is not a practical alternative due to differences in the Company’s service offerings compared to other parties and the availability of relevant third-party pricing information. The determination for ESP is made through consultation with and approval by management taking into consideration the go-to-market strategy. As the Company’s go-to-market strategies evolve, there may be modifications of pricing practices in the future, which could result in changes in both VSOE and ESP.
For multiple-element arrangements that may include a combination of our subscription offerings and other professional services, the total arrangement fee is allocated to each element based on the VSOE / ESP value of each element. After allocation, the revenue associated with the subscription offering and other professional services are recognized as described above.
Professional Services
Revenue from consulting services, which the Company calls professional services in the Consolidated Statements of Income and Comprehensive Income, are typically comprised of implementation, development, training or other consulting services sold along with on-premise and cloud Consulting services are generally sold on a time-and-materials basis and can include services ranging from software installation to data conversion and building non-complex interfaces to allow the software to operate in integrated environments. The Company recognizes revenue for time-and-materials as the services are performed or upon written acceptance from customers, if applicable, assuming all other conditions for revenue recognition have been met. Consulting engagements can range anywhere from one day to many months and are based strictly on the customer’s requirements and complexities and are independent of the functionality of our software. The Company’s software, as delivered, can generally be used by the customer for the customer’s purpose upon installation. Further, implementation and integration services provided are generally not essential to the functionality of the software, as delivered, and do not result in any material changes to the underlying software code. On occasion, the Company enters into fixed fee arrangements in which customer payments are tied to achievement of specific milestones. In fixed fee arrangements, revenue is recognized as services are performed as measured by costs incurred to date, as compared to total estimated costs to be incurred to complete the work. In milestone achievement arrangements, revenue is recognized as the respective milestones are achieved.
ADVERTISING EXPENSES
Advertising costs are expensed as incurred. Advertising expenses were $1.1 million, $0.9 million and $0.8 million for fiscal years 2017, 2016 and 2015.
RESEARCH AND DEVELOPMENT
All costs incurred to establish the technological feasibility of the Company’s software products are expensed to research and development as incurred.
OTHER (INCOME) EXPENSE, NET
The components of other (income) expense, net for fiscal 2017, 2016 and 2015 were as follows:
|
Years Ended January 31, |
||||||||||||
|
2017 |
2016 |
2015 |
||||||||||
|
(in thousands) |
||||||||||||
|
Interest income |
$ | (696 |
) |
$ | (320 |
) |
$ | (242 |
) | |||
|
Interest expense |
670 | 712 | 811 | |||||||||
|
Foreign exchange gains |
180 | (503 |
) |
(878 |
) | |||||||
|
Change in fair value of interest rate swap |
(485 |
) |
48 | 877 | ||||||||
|
Other income, net |
(131 |
) |
(302 |
) |
(168 |
) | ||||||
|
Total other (income) expense, net |
$ | (462 |
) |
$ | (365 | ) | $ | 400 | ||||
COMPUTATION OF NET (LOSS) INCOME PER SHARE
Net (loss) income per share of Class A common stock and Class B common stock is computed using the two-class method. Holders of Class A common stock are entitled to cash or stock dividends equal to 120% of the amount of such dividend payable with respect to a share of Class B common stock.
The following table sets forth the computation of basic and diluted net (loss) income per share:
|
Years Ended January 31, |
||||||||||||
|
2017 |
2016 |
2015 |
||||||||||
|
(in thousands, except per share data) |
||||||||||||
|
Net (loss) income |
$ | (15,450 |
) |
$ | 8,912 | $ | 12,946 | |||||
|
Less: dividends declared |
(5,301 |
) |
(5,235 |
) |
(4,452 |
) | ||||||
|
Undistributed net (loss) income |
$ | (20,751 |
) |
$ | 3,677 | $ | 8,494 | |||||
|
Net (loss) income per share – Class A Common Stock |
||||||||||||
|
Dividends declared |
$ | 4,531 | $ | 4,466 | $ | 3,688 | ||||||
|
Allocation of undistributed net (loss) income |
(17,742 |
) |
3,140 | 7,041 | ||||||||
|
Net (loss) income attributable to Class A common stock |
$ | (13,211 |
) |
$ | 7,606 | $ | 10,729 | |||||
|
Weighted average shares of Class A common stock outstanding—basic |
15,715 | 15,466 | 12,841 | |||||||||
|
Weighted average potential shares of Class A common stock |
— | 758 | 712 | |||||||||
|
Weighted average shares of Class A common stock and potential common shares outstanding—diluted |
15,715 | 16,224 | 13,553 | |||||||||
|
Basic net (loss) income per Class A common share |
$ | (0.84 |
) |
$ | 0.49 | $ | 0.84 | |||||
|
Diluted net (loss) income per Class A common share |
$ | (0.84 |
) |
$ | 0.47 | $ | 0.79 | |||||
|
Net (loss) income per share – Class B Common Stock |
||||||||||||
|
Dividends declared |
$ | 770 | $ | 769 | $ | 764 | ||||||
|
Allocation of undistributed net (loss) income |
(3,009 |
) |
537 | 1,453 | ||||||||
|
Net (loss) income attributable to Class B common stock |
$ | (2,239 |
) |
$ | 1,306 | $ | 2,217 | |||||
|
Weighted average shares of Class B common stock outstanding—basic |
3,206 | 3,201 | 3,183 | |||||||||
|
Weighted average potential shares of Class B common stock |
— | 82 | 88 | |||||||||
|
Weighted average shares of Class B common stock and potential common shares outstanding—diluted |
3,206 | 3,283 | 3,271 | |||||||||
|
Basic net (loss) income per Class B common share |
$ | (0.70 |
) |
$ | 0.41 | $ | 0.70 | |||||
|
Diluted net (loss) income per Class B common share |
$ | (0.70 |
) |
$ | 0.40 | $ | 0.68 | |||||
Potential common shares consist of the shares issuable upon the release of restricted stock units (“RSUs”) and the exercise of stock options and stock appreciation rights (“SARs”). The Company’s unvested RSUs, unexercised stock options and unexercised SARs are not considered participating securities as they do not have rights to dividends or dividend equivalents prior to release or exercise.
The following table sets forth the number of potential common shares not included in the calculation of diluted earnings per share because their effects were anti-dilutive:
|
Years Ended January 31, |
||||||||||||
|
2017 |
2016 |
2015 |
||||||||||
|
(in thousands) |
||||||||||||
|
Class A |
845 | 528 | 211 | |||||||||
|
Class B |
158 | 99 | 45 | |||||||||
RECENT ACCOUNTING PRONOUNCEMENTS
With the exception of those discussed below, there have been no recent changes in accounting pronouncements issued by the Financial Accounting Standards Board (“FASB”) or adopted by the Company during the fiscal year ended January 31, 2017, that are of significance, or potential significance, to the Company.
Accounting Standards Adopted
In March 2016, the FASB issued ASU 2016-09 regarding ASC Topic 718, Improvements to Employee Share-Based Payment Accounting. The new guidance requires excess tax benefits and tax deficiencies to be recorded in the income statement when the awards vest or are settled. In addition, cash flows related to excess tax benefits will no longer be separately classified as a financing activity apart from other income tax cash flows. The standard also increases the amount of shares an employer can withhold for tax purposes without triggering liability accounting, clarifies that all cash payments made on an employee's behalf for withheld shares should be presented as a financing activity in the statements of cash flows, and provides an entity-wide accounting policy election to account for forfeitures as they occur.
The Company elected to early adopt the new guidance in the third quarter of fiscal year 2017 which required the Company to reflect any adjustments as of February 1, 2016, the beginning of the annual period that includes the interim period of adoption. The primary impact of adoption was the recognition of excess tax benefits in the Company’s provision for income taxes rather than paid-in capital for all periods in fiscal year 2017. Additional amendments to the accounting for income taxes resulted in the recognition of prior year unrealized excess tax benefits. This recognition resulted in an increase to the Company’s deferred tax assets of $2.2 million, an increase to valuation allowance $1.2 million and an offset to opening accumulated deficit of $1.0 million.
The Company elected to account for forfeitures as they occur using a modified retrospective transition method, which resulted in a cumulative-effect adjustment of $0.4 million to reduce the February 1, 2016 opening accumulated deficit. Additional amendments to the accounting for minimum statutory withholding tax requirements had no impact to opening accumulated deficit as of February 1, 2016 as the Company does not withhold more than the minimum statutory requirements.
The Company elected to apply the presentation requirements for cash flows related to excess tax benefits retrospectively to all periods presented which resulted in an increase to net cash provided by operating activities and a decrease to net cash used in financing of $0.8 million and $0.3 million for fiscal 2016 and 2015, respectively. The presentation requirements for cash flows related to employee taxes paid for withheld shares had no impact to any of the periods presented in the Company’s consolidated cash flows statements since such cash flows have historically been presented as a financing activity.
In April 2015, the FASB issued ASU 2015-03 - Interest - Imputation of Interest (Subtopic 2015-03): Simplifying the Presentation of Debt Issuance Costs, which requires that debt issuance costs related to a recognized debt liability be presented in the balance sheet as a direct deduction from the carrying amount of the related debt liability instead of being presented as an asset, consistent with debt discounts. The recognition and measurement guidance for debt issuance costs are not affected by ASU 2015-03. This ASU is effective for fiscal years beginning after December 15, 2015, and interim periods within those fiscal years and is to be implemented retrospectively. The Company adopted the provisions of this ASU in the first quarter of fiscal 2017. Adoption of this ASU did not have a material impact on the Company’s consolidated financial statements.
In August 2015, the FASB issued ASU 2015-15, Interest-Imputation of Interest (Subtopic 835-30): Presentation and Subsequent Measurement of Debt Issuance Costs Associated with Line of Credit Arrangements, given that the authoritative guidance within ASU 2015-03 for debt issuance costs does not address presentation or subsequent measurement of debt issuance costs related to line-of-credit arrangements. The SEC staff would not object to an entity deferring and presenting debt issuance costs as an asset and subsequently amortizing the deferred debt issuance costs ratably over the term of the line-of-credit arrangement, regardless of whether there are any outstanding borrowings on the line-of-credit arrangement. The Company adopted the provisions of this ASU in the first quarter of fiscal 2017. Adoption of this ASU did not have an impact on the Company’s consolidated financial statements.
In November 2015, the FASB issued ASU 2015-17, Balance Sheet Classification of Deferred Taxes, which requires deferred tax liabilities and assets be presented as noncurrent on the statement of financial position. ASU 2015-17 will be effective for the Company’s fiscal year beginning February 1, 2017. The standard permits the use of either prospective or retrospective application to all periods presented. The Company adopted the provisions of this standard in the fourth quarter of fiscal 2017 with prospective application. Adoption of this ASU did not have a material impact on the Company’s consolidated financial statements.
Accounting Standards Not Yet Adopted
In May 2014, the FASB issued ASU 2014-09, Revenue from Contracts with Customers. The standard was issued to provide a single framework that replaces existing industry and transaction specific U.S. GAAP with a five-step analysis of transactions to determine when and how revenue is recognized. The accounting standard update will replace most existing revenue recognition guidance in U.S. GAAP when it becomes effective. In August 2015, the FASB issued ASU 2015-14, Revenue from Contracts with Customers (Topic 606): Deferral of the Effective Date, to defer the effective date of ASU 2014-09 by one year. Therefore, ASU 2014-09 will become effective for the Company beginning in fiscal year 2019 and we do not plan to early adopt. The standard permits the use of either the retrospective or cumulative transition method. We anticipate this standard will have a material impact on our consolidated financial statements. While we are continuing to assess all potential impacts of the standard, we currently believe the most significant impact relates to our accounting for software license revenue. The requirement to have VSOE for undelivered elements to enable the separation of revenue for the delivered software licenses is eliminated under the new standard. We expect revenue related to subscription and professional services to remain substantially unchanged. We are still in the process of evaluating the impact of the new standard on these arrangements. Due to the complexity of certain of our contracts, the actual revenue recognition treatment required under the new standard for these arrangements may be dependent on contract-specific terms and vary in some instances. We are also continuing to evaluate the impact of the standard on our recognition of costs related to obtaining customer contracts, namely sales commissions. The commission accounting under the new standard is significantly different than the Company's current policy of expensing commission upfront.
In February 2016, the FASB issued ASU 2016-02, Leases (Topic 842). ASU 2016-02 requires companies to generally recognize on the balance sheet operating and financing lease liabilities and corresponding right-of-use assets. ASU 2016-02 is effective for the Company in its first quarter of fiscal 2020 on a modified retrospective basis and earlier adoption is permitted. The Company is currently evaluating the impact of the pending adoption of ASU 2016-02 on its consolidated financial statements and currently expects that most of its operating lease commitments will be subject to the new standard and recognized as operating lease liabilities and right-of-use assets upon adoption of ASU 2016-02.
In October 2016, the FASB issued ASU 2016-16, Income Taxes: Intra-Entity Transfers of Assets Other than Inventory which requires that entities recognize the income tax consequences of an intra-entity transfer of an asset, other than inventory, when the transfer occurs. ASU 2016-16 will be effective for the Company's fiscal year beginning February 1, 2018. The standard is required to be applied on a modified retrospective basis through a cumulative-effect adjustment directly to retained earnings as of the beginning of the period of adoption. The Company is currently evaluating the accounting, transition, and disclosure requirements of the standard.
In January 2017, the FASB issued ASU 2017-04, Intangibles—Goodwill and Other (Topic 350): Simplifying the Test for Goodwill Impairment, which simplifies the subsequent measurement of goodwill to eliminate Step 2 from the goodwill impairment test. In addition, it eliminates the requirements for any reporting unit with a zero or negative carrying amount to perform a qualitative assessment and, if that fails that qualitative test, to perform Step 2 of the goodwill impairment test. Therefore, the same impairment assessment applies to all reporting units. The amendments will be effective for the Company’s fiscal year beginning February 1, 2020. Early adoption is permitted. The new guidance is required to be applied on a prospective basis. The Company does not believe adoption of ASU 2017-04 will have a material impact on its consolidated financial statements.
In January 2017, the FASB issued ASU 2017-01, Business Combinations: Clarifying the Definition of a Business, which provides a more robust framework to use in determining when a set of assets and activities is a business. The amendments will be effective for the Company’s fiscal year beginning February 1, 2018. Early adoption is permitted. The new guidance is required to be applied on a prospective basis. The effect of adoption of ASU 2017-01 will depend upon the nature of the Company's future acquisitions, if any.
2. FAIR VALUE MEASUREMENTS
When determining fair value, the Company uses a three-tier value hierarchy which prioritizes the inputs used in measuring fair value. Whenever possible, the Company uses observable market data. The Company relies on unobservable inputs only when observable market data is not available. Classification within the hierarchy is determined based on the lowest level input that is significant to the fair value measurement. The assessment of the significance of a particular item to the fair value measurement in its entirety requires judgment, including the consideration of inputs specific to the asset or liability.
|
• |
Level 1 - Money market mutual funds are recorded at fair value based upon quoted market prices. | |
| • |
Level 2 - The liability related to the interest rate swap is recorded at fair value based upon a valuation model that uses relevant observable market inputs at quoted intervals, such as forward yield curves. |
The following table sets forth the financial assets, measured at fair value, as of January 31, 2017 and January 31, 2016:
|
Fair value measurement at reporting date using |
||||||||||||
|
Quoted Prices |
Significant |
Significant |
||||||||||
|
(in thousands) |
||||||||||||
|
Money market mutual funds as of January 31, 2017 |
$ | 116,043 | ||||||||||
|
Money market mutual funds as of January 31, 2016 |
$ | 113,984 | ||||||||||
|
Liability related to the interest rate swap as of January 31, 2017 |
$ | (190 |
) |
|||||||||
|
Liability related to the interest rate swap as of January 31, 2016 |
$ | (675 |
) |
|||||||||
Money market mutual funds are classified as part of “Cash and equivalents” in the accompanying Consolidated Balance Sheets. In addition, the amount of cash and equivalents, including cash deposited with commercial banks, was $29 million and $24 million as of January 31, 2017 and January 31, 2016, respectively.
The Company’s line of credit and notes payable both bear a variable market interest rate commensurate with the Company’s credit standing. Therefore, the carrying amounts outstanding under the line of credit and note payable reasonably approximate fair value based on Level 2 inputs.
There have been no transfers between fair value measurements levels during the 12 months ended January 31, 2017.
Derivative Instruments
The Company entered into an interest rate swap in May 2012 to mitigate the exposure to the variability of one month LIBOR for its floating rate debt described in Note 8 “Debt” within these Notes to Condensed Consolidated Financial Statements. The fair value of the interest rate swap is reflected as an asset or liability in the Condensed Consolidated Balance Sheets and the change in fair value is reported in “Other (income) expense, net” in the Condensed Consolidated Statements of Operations and Comprehensive Income. The fair value of the interest rate swap is estimated as the net present value of projected cash flows based upon forward interest rates at the balance sheet date.
The fair values of the derivative instrument at January 31, 2017 and January 31, 2016 were as follows (in thousands):
|
Liability |
|||||||||
|
Fair Value |
|||||||||
|
Balance Sheet |
January 31, |
January 31, |
|||||||
|
Derivative instrument: |
|||||||||
|
Interest rate swap |
Other liabilities net |
$ | (190 |
) |
$ | (675 |
) | ||
|
Total |
$ | (190 |
) |
$ | (675 |
) | |||
The change in fair value of the interest rate swap recognized in the Consolidated Statement of Income and Comprehensive Income for the twelve months ended January 31, 2017, 2016 and 2015 was $485,000, $(48,000) and $(877,000), respectively.
3. INCOME TAXES
Income tax expense is summarized as follows:
|
Years Ended January 31, |
||||||||||||
|
2017 |
2016 |
2015 |
||||||||||
|
(in thousands) |
||||||||||||
|
Current: |
||||||||||||
|
Federal |
$ | 437 | $ | (1,656 |
) |
$ | 174 | |||||
|
State |
30 | 26 | 109 | |||||||||
|
Foreign |
3,894 | 2,591 | 3,010 | |||||||||
|
Subtotal |
4,361 | 961 | 3,293 | |||||||||
|
Deferred: |
||||||||||||
|
Federal |
11,564 | (956 |
) |
(786 |
) | |||||||
|
State |
3,610 | 303 | 229 | |||||||||
|
Foreign |
(348 | ) | 63 | (348 |
) | |||||||
|
Subtotal |
14,826 | (590 |
) |
(905 |
) | |||||||
|
Equity adjustment |
89 | 1,253 | 251 | |||||||||
|
Total |
$ | 19,276 | $ | 1,624 | $ | 2,639 | ||||||
Actual income tax expense differs from that obtained by applying the statutory federal income tax rate of 34% to income before income taxes as follows:
|
Years Ended January 31, |
||||||||||||
|
2017 |
2016 |
2015 |
||||||||||
|
(in thousands) |
||||||||||||
|
Computed expected tax expense |
$ | 1,301 | $ | 3,582 | $ | 5,299 | ||||||
|
State income taxes, net of federal income tax expense |
(54 | ) | 252 | 253 | ||||||||
|
Incremental tax expense (benefit) from foreign operations |
137 | (2,548 |
) |
(5,220 |
) | |||||||
|
Non-deductible equity compensation |
(29 | ) | 254 | 258 | ||||||||
|
Foreign withholding taxes |
676 | 968 | 1,256 | |||||||||
|
Net change in valuation allowance |
16,861 | 2,564 | 1,657 | |||||||||
|
Net change in contingency reserve |
198 | (379 |
) |
(594 | ) | |||||||
|
Non-deductible expenses |
660 | 621 | 742 | |||||||||
|
Benefit of tax credits |
(1,243 | ) | (3,186 |
) |
(1,345 |
) | ||||||
|
Subpart F income |
345 | 254 | 283 | |||||||||
|
Rate change impact |
19 | 193 | 54 | |||||||||
|
Benefit from liquidation utilized |
— | (1,321 |
) |
— | ||||||||
|
Other |
405 | 370 | (4 |
) | ||||||||
| $ | 19,276 | $ | 1,624 | $ | 2,639 | |||||||
Consolidated U.S. (loss) before income taxes was $(3.8) million, $(7.8) million, and $(2.4) million, for the fiscal years ended January 31, 2017, 2016 and 2015, respectively. The corresponding income before income taxes for foreign operations was $7.6 million, $18.4 million, and $18.0 million for the fiscal years ended January 31, 2017, 2016 and 2015, respectively.
The Company files U.S. federal, state, and foreign tax returns that are subject to audit by various tax authorities. The Company is currently under audit in:
| ● |
India for fiscal years ended March 31, 1998, 1999, 2010, 2013, 2014, 2015 and 2016 |
|
|
● |
State of Iowa for fiscal year 2014 |
|
|
● |
China for calendar years 2013, 2014, 2015 and 2016 |
U.S. income and foreign withholding taxes have not been recorded on permanently reinvested earnings of our foreign subsidiaries. These permanently reinvested earnings are approximately $83.2 million at January 31, 2017. It is not practicable for the Company to determine the amount of the related unrecognized deferred income tax liability. Such earnings would become taxable upon the sale or liquidation of these subsidiaries or upon the remittance of dividends.
Deferred income taxes reflect the net effects of the temporary differences between the carrying amounts of assets and liabilities for financial reporting purposes and the amounts used for income tax purposes.
Significant components of the Company’s deferred tax assets and liabilities are as follows:
|
January 31, |
||||||||
|
2017 |
2016 |
|||||||
|
(in thousands) |
||||||||
|
Deferred tax assets: |
||||||||
|
Allowance for doubtful accounts and sales adjustments |
$ | 356 | $ | 486 | ||||
|
Accrued vacation |
2,033 | 1,900 | ||||||
|
Tax credits |
13,116 | 11,025 | ||||||
|
Deferred revenue |
3,465 | 3,520 | ||||||
|
Net operating loss carry forwards |
10,255 | 7,965 | ||||||
|
Accrued expenses - other |
1,695 | 1,557 | ||||||
|
Other comprehensive income |
— | 1,483 | ||||||
|
Section 263(a) interest capitalization |
322 | 333 | ||||||
|
Equity compensation |
5,399 | 4,631 | ||||||
|
Other |
2,039 | 2,111 | ||||||
|
Total deferred tax assets |
38,680 | 35,011 | ||||||
|
Less valuation allowance |
(29,868 |
) |
(13,480 |
) | ||||
|
Less netting of unrecognized tax benefits against deferred tax assets |
(954 |
) |
(1,042 |
) | ||||
|
Deferred tax assets, net of valuation allowance |
$ | 7,858 | $ | 20,489 | ||||
|
Deferred tax liabilities: |
||||||||
|
Depreciation and amortization |
(630 |
) |
(249 |
) | ||||
|
Other comprehensive income |
(1,009 | ) | — | |||||
|
Other |
(53 |
) |
(118 |
) | ||||
|
Total deferred tax liabilities |
(1,692 |
) |
(367 |
) | ||||
|
Total net deferred tax assets |
$ | 6,166 | $ | 20,122 | ||||
The Company reviews its net deferred tax assets by jurisdiction on a quarterly basis to determine whether a valuation allowance is necessary based on the more-likely-than-not standard. During the fourth quarter of the fiscal year ended January 31, 2017 management considered all available positive and negative evidence to determine whether, based on the weight of that evidence, a valuation allowance was needed. Management assessed historic, current and future financial projections by jurisdiction to draw its conclusion. For the U.S. federal jurisdiction, the positive evidence was outweighed by the U.S. three-year cumulative loss, a fiscal 2018 projected loss, and future earmarked investment necessary to transition the business to cloud. Management concluded that the weight of this negative evidence warranted placing a full valuation allowance on all its U.S. federal net deferred tax assets. The majority of QAD’s state deferred tax assets are California research and development tax credits. This jurisdiction was analyzed separately because QAD’s California return is filed on a worldwide basis. A significant decrease in current and forecast income both within and outside the US, along with a recent significant drop in the California apportionment percentage, led management to conclude that a full valuation allowance on QAD’s state deferred tax assets was also necessary. In total, a full valuation allowance of $16.3 million was placed against QAD’s U.S. federal and state net deferred tax assets. If and when the Company’s operating performance improves on a sustained basis, the conclusion regarding the need for a valuation allowance could change, resulting in the reversal of some or all of the valuation allowance in the future. At January 31, 2017 and 2016, the valuation allowance attributable to deferred tax assets was $29.9 million and $13.5 million, respectively.
The Company has gross net operating loss carryforwards of $35.5 million and tax credit carryforwards of $16.4 million as of January 31, 2017. The majority of the Company’s net operating loss carryforwards do not expire, the remaining begin to expire in fiscal year 2035. The majority of the Company’s tax credits carryforwards do not expire, the remaining begin to expire in fiscal year 2019.
During the fiscal year ended January 31, 2017, the Company increased its reserves for uncertain tax positions by $0.2 million. Interest and penalties on accrued but unpaid taxes are classified in the Consolidated Statements of Operations and Comprehensive (Loss) Income as income tax expense. The liability for unrecognized tax benefits that may be recognized in the next twelve months is classified as short-term in the Company’s Consolidated Balance Sheet while the remainder is classified as long-term.
The following table reconciles the gross amounts of unrecognized tax benefits at the beginning and end of the period:
|
Years Ended January 31, |
||||||||
|
2017 |
2016 |
|||||||
|
(in thousands) |
||||||||
|
Unrecognized tax benefits at beginning of the year |
$ | 1,545 | $ | 1,924 | ||||
|
Decreases as a result of tax positions taken in a prior period |
(79 | ) | (17 |
) | ||||
|
Increases as a result of tax positions taken in the current period |
365 | 15 | ||||||
|
Reduction as a result of a lapse of the statute of limitations |
(88 | ) | (288 |
) | ||||
|
Decreases as a result of tax settlements |
— | (89 |
) | |||||
|
Unrecognized tax benefit at end of year |
$ | 1,743 | $ | 1,545 | ||||
All of the unrecognized tax benefits included in the balance sheet at January 31, 2017 would impact the effective tax rate on income from continuing operations, if recognized.
The total amount of interest recognized in the Consolidated Statement of Operations and Comprehensive (Loss) Income for unpaid taxes was $69,000 for the year ended January 31, 2017. The total amount of interest and penalties recognized in the Consolidated Balance Sheet at January 31, 2017 was $0.3 million.
The Company files U.S. federal, state, and foreign income tax returns in jurisdictions with varying statute of limitations. The years that may be subject to examination will vary by jurisdiction. Below is a list of our material jurisdictions and the years open for audit as of fiscal 2017:
|
Jurisdiction |
Years Open for Audit |
|
U.S. Federal |
FY14 and beyond |
|
California |
FY13 and beyond |
|
Michigan |
FY13 and beyond |
|
New Jersey |
FY13 and beyond |
|
Australia |
FY13 and beyond |
|
France |
FY14 and beyond |
|
India |
FY98, FY99, FY10, FY13 and beyond |
|
Ireland |
FY13 and beyond |
|
United Kingdom |
FY16 and beyond |
4. STOCKHOLDERS’ EQUITY
Common Stock
The Company has two classes of common stock. Each share of Class B Common Stock entitles the holder to one vote and each share of Class A Common Stock entitles the holder to 1/20th of one vote. On all matters, the Class A Common Stock and the Class B Common Stock will vote as a single class, except as otherwise required by applicable law or the articles of incorporation. Neither the Class A Common Stock nor the Class B Common Stock are convertible into the other, unless either or both classes becomes subject to exclusion from the principal national securities exchange on which such securities are traded, in which case all outstanding shares of Class A Common Stock may be converted into shares of Class B Common Stock on a share-for-share basis by resolution of the Board of Directors. There are no restrictions on the transferability of either class.
The amount of any dividend payable in cash or non-cash property of the Company (other than a dividend payable solely in the Company’s capital stock) with respect to each share of Class A Common Stock is equal to 120% of the value of any such dividend payable with respect to a share of Class B Common Stock, except for dividends declared for the purpose of distributing all or some of the proceeds received by the Company from any transaction determined by the Board to be a material transaction not in the ordinary course of business or for the purpose of effecting a spin-off of a subsidiary of the Company (in either case, such dividend will be paid ratably, on a per share basis, to all holders of Common Stock).
Issuance of Common Stock
On January 22, 2015, the Company closed an offering of 2,000,000 shares of Class A common stock. The net proceeds to the Company from the sale of the stock were $37.0 million after deducting underwriting discounts and commissions and offering expenses.
On February 18, 2015 the offering underwriters exercised in full an option to purchase additional shares. As a result, 450,000 shares of Class A common stock were issued generating approximately $8.4 million in additional net proceeds.
Dividends
The following table sets forth the dividends declared and paid by the Company during fiscal 2017:
|
Declaration |
Record Date | Payable |
Dividend |
Dividend |
Amount |
|||||||||
|
12/13/2016 |
12/27/2016 |
1/5/2017 |
$ | 0.072 | $ | 0.06 | $ | 1,331,000 | ||||||
|
9/14/2016 |
9/28/2016 |
10/5/2016 |
$ | 0.072 | $ | 0.06 | $ | 1,328,000 | ||||||
|
6/14/2016 |
6/28/2016 |
7/7/2016 |
$ | 0.072 | $ | 0.06 | $ | 1,326,000 | ||||||
|
4/12/2016 |
4/26/2016 |
5/3/2016 |
$ | 0.072 | $ | 0.06 | $ | 1,316,000 | ||||||
5. STOCK-BASED COMPENSATION
Stock Plans
On June 14, 2016, the stockholders approved the QAD Inc. 2016 Stock Incentive Program (“2016 Program”). The 2016 Program allows for equity awards in the form of incentive stock options, non-statutory stock options, restricted shares, rights to purchase stock, stock appreciation rights (“SARs”) and other stock rights. The stockholders authorized a maximum of 4,000,000 shares to be issued under the 2016 Program. Prior to July 1, 2016, stock awards were issued under the QAD Inc. 2006 Stock Incentive Program. As of January 31, 2017, 3,992,000 Class A Common Shares were available for issuance.
The Company issues restricted stock units (“RSUs”) to employees with the exception of the CEO and President of the Company. RSUs granted to employees under the 2016 Program and 2006 Program are generally released 25% after each year of service for four years and are contingent upon employment with the Company on the release date. Stock-based compensation is typically issued out of treasury shares. At January 31, 2017, there were 8,000 RSUs to purchase Class A Common Stock outstanding under the 2016 Program. At January 31, 2017, there were 615,000 RSUs to purchase Class A Common Stock outstanding under the 2006 Program.
The Company also issues equity awards in the form of stock-settled SARs to the CEO and President of the Company. A SAR is a contractual right to receive value tied to the post-grant appreciation of the underlying stock. Although the Company has the ability to grant stock-settled or cash-settled SARs, the Company has only granted stock-settled SARs. Upon vesting, a holder of a stock-settled SAR receives shares in the Company’s common stock equal to the intrinsic value of the SAR at time of exercise. Under the 2006 Program, SARs have generally been granted for a term of eight years, they generally vest 25% after each year of service for four years and are contingent upon employment with the Company on the vesting date. Economically, a stock-settled SAR provides the same compensation value as a stock option, but the employee is not required to pay an exercise price upon exercise of the SAR. Stock compensation expense, as required under ASC 718, is the same for stock-settled SARs and stock options. At January 31, 2017, there were 2,402,000 SARs to purchase Class A Common Stock and 391,000 SARs to purchase Class B Common Stock outstanding under the 2006 Program.
Equity compensation is also issued to non-employee Board members that are newly-appointed or reelected at the Annual Meeting of Stockholders. They are granted Class A shares as stock payments that are fully vested on the date of grant. Equity awards to non-employee Board members are limited to $250,000 per year, as determined for the Company’s financial accounting purposes as of the date of grant.
Under the 2016 Program, officers, directors, employees, consultants and other independent contractors or agents of the Company or subsidiaries of the Company who are responsible for or contribute to the management, growth or profitability of its business are eligible for selection by the program administrators to participate. However, incentive stock options granted under the 2016 Program may only be granted to a person who is an employee of the Company or one of its subsidiaries.
Stock- Based Compensation
The following table sets forth reported stock compensation expense included in the Company’s Consolidated Statements of Operations and Comprehensive (Loss) Income for the fiscal years ended January 31, 2017, 2016 and 2015:
|
Years Ended January 31, |
||||||||||||
|
2017 |
2016 |
2015 |
||||||||||
|
(in thousands) |
||||||||||||
|
Stock-based compensation expense: |
||||||||||||
|
Cost of subscription |
$ | 113 | $ | 76 | $ | 45 | ||||||
|
Cost of maintenance and other revenue |
299 | 271 | 152 | |||||||||
|
Cost of professional services |
848 | 739 | 492 | |||||||||
|
Sales and marketing |
1,200 | 1,377 | 790 | |||||||||
|
Research and development |
1,009 | 900 | 518 | |||||||||
|
General and administrative |
3,854 | 4,077 | 2,996 | |||||||||
|
Total stock-based compensation expense |
$ | 7,323 | $ | 7,440 | $ | 4,993 | ||||||
RSU Information
The following table summarizes the activity for RSUs for the fiscal years ended January 31, 2017, 2016 and 2015:
|
RSUs (in thousands) |
Weighted |
|||||||
|
Restricted stock at January 31, 2014 |
430 | $ | 11.02 | |||||
|
Granted |
287 | 21.25 | ||||||
|
Released (1) |
(167 |
) |
11.92 | |||||
|
Forfeited |
(47 |
) |
14.00 | |||||
|
Restricted stock at January 31, 2015 |
503 | $ | 16.27 | |||||
|
Granted |
326 | 24.75 | ||||||
|
Released (1) |
(192 |
) |
15.58 | |||||
|
Forfeited |
(20 |
) |
18.93 | |||||
|
Restricted stock at January 31, 2016 |
617 | $ | 20.91 | |||||
|
Granted |
307 | 18.54 | ||||||
|
Released (1) |
(259 |
) |
18.96 | |||||
|
Forfeited |
(42 |
) |
20.69 | |||||
|
Restricted stock at January 31, 2017 |
623 | $ | 20.56 | |||||
|
(1) |
The number of RSUs released includes shares withheld on behalf of employees to satisfy minimum statutory tax withholding requirements. During the fiscal years ended January 31, 2017, 2016 and 2015, the Company withheld 75,000 shares, 52,000 shares and 45,000 shares, respectively, for payment of these taxes. The value of the withheld shares for the fiscal years ended January 31, 2017, 2016 and 2015 were $1.5 million, $1.4 million and $1.0 million, respectively. |
Total unrecognized compensation cost related to RSUs was approximately $9.9 million as of January 31, 2017. This cost is expected to be recognized over a period of approximately 2.6 years.
SAR Information
The weighted average assumptions used to value SARs are shown in the following table.
|
Years Ended January 31, |
||||||||||||
|
2017 |
2016 |
2015 |
||||||||||
|
Expected life in years |
5.25 | 5.00 | 4.98 | |||||||||
|
Risk free interest rate |
1.16 |
% |
1.64 |
% |
1.58 |
% | ||||||
|
Volatility |
36 |
% |
41 |
% |
47 |
% | ||||||
|
Dividend rate |
1.51 |
% |
1.10 |
% |
1.32 |
% | ||||||
The following table summarizes the activity for outstanding SARs for the fiscal years ended January 31, 2017, 2016 and 2015:
|
Options/ |
Weighted |
Weighted |
Aggregate |
|||||||||||||
|
Outstanding at January 31, 2014 |
2,842 | $ | 11.19 | |||||||||||||
|
Granted |
387 | 21.61 | ||||||||||||||
|
Exercised |
(655 |
) |
11.47 | |||||||||||||
|
Expired |
(22 |
) |
12.68 | |||||||||||||
|
Forfeited |
(53 |
) |
12.31 | |||||||||||||
|
Outstanding at January 31, 2015 |
2,499 | $ | 12.69 | |||||||||||||
|
Granted |
380 | 25.34 | ||||||||||||||
|
Exercised |
(266 |
) |
10.69 | |||||||||||||
|
Expired |
(12 |
) |
14.22 | |||||||||||||
|
Forfeited |
(5 |
) |
12.05 | |||||||||||||
|
Outstanding at January 31, 2016 |
2,596 | $ | 14.74 | |||||||||||||
|
Granted |
380 | 18.64 | ||||||||||||||
|
Exercised |
(158 |
) |
10.94 | |||||||||||||
|
Expired |
(17 |
) |
12.56 | |||||||||||||
|
Forfeited |
(8 |
) |
12.09 | |||||||||||||
|
Outstanding at January 31, 2017 |
2,793 | $ | 15.51 | 4.4 | $ | 35,885 | ||||||||||
|
Vested and exercisable at January 31, 2017 |
1,802 | $ | 12.92 | 3.3 | $ | 27,853 | ||||||||||
The aggregate intrinsic value in the table above represents the total pretax intrinsic value (the aggregate difference between the closing stock price of the Company’s common stock based on the last trading day as of January 31, 2017 and the exercise price for in-the-money SARs) that would have been received by the holders if all SARs had been exercised on January 31, 2017. The total intrinsic value of SARs exercised in the years ended January 31, 2017, 2016 and 2015 was $2.1 million, $3.7 million and $5.7 million, respectively. The weighted average grant date fair value per share of SARs granted in the years ended January 31, 2017, 2016 and 2015 was $5.43, $8.70 and $8.18, respectively.
The number of SARs exercised includes shares withheld on behalf of employees to satisfy minimum statutory tax withholding requirements. During the fiscal years ended January 31, 2017, 2016 and 2015, the Company withheld shares 25,000, 44,000 shares and 88,000 shares for payment of these taxes. The value of the withheld shares for the fiscal years ended January 31, 2017, 2016 and 2015 were $0.6 million, $1.1 million and $1.8 million, respectively.
At January 31, 2017, there was approximately $5.0 million of total unrecognized compensation cost related to unvested SARs. This cost is expected to be recognized over a weighted average period of approximately 2.4 years.
6. DEFERRED REVENUES
Deferred revenues consisted of the following:
|
January 31, |
||||||||
|
2017 |
2016 |
|||||||
|
(in thousands) |
||||||||
|
Deferred maintenance revenue |
$ | 78,923 | $ | 79,533 | ||||
|
Deferred subscription revenue |
20,389 | 14,194 | ||||||
|
Deferred services revenue |
2,550 | 2,332 | ||||||
|
Deferred license revenue |
1,740 | 1,549 | ||||||
|
Deferred other revenue |
523 | 303 | ||||||
|
Deferred revenues, current |
104,125 | 97,911 | ||||||
|
Deferred revenues, non-current (in Other liabilities) |
2,353 | 1,690 | ||||||
|
Total deferred revenues |
$ | 106,478 | $ | 99,601 | ||||
Deferred maintenance and subscription revenues represent billings and customer payments made in advance for support and subscription contracts. Support and subscription are billed in advance with corresponding revenues being recognized ratably over the support and subscription periods. Support is typically billed annually while subscription is billed quarterly or annually. Deferred license revenues result from undelivered products or specified enhancements, customer specific acceptance provisions and software license transactions that cannot be segmented from undelivered consulting or other services. Deferred services revenues represent both prepayments for our professional services where revenues for these services are generally recognized as the Company completes the performance obligations for the prepaid services and services already provided but deferred due to software revenue recognition rules.
7. OTHER BALANCE SHEET ACCOUNTS
|
January 31, |
||||||||
|
2017 |
2016 |
|||||||
|
(in thousands) |
||||||||
|
Other current assets |
||||||||
|
Deferred cost of revenues |
$ | 8,194 | $ | 7,849 | ||||
|
Prepaid expenses |
4,879 | 5,789 | ||||||
|
Income tax receivable, net of payables |
928 | 1,202 | ||||||
|
Other |
1,350 | 1,184 | ||||||
| $ | 15,351 | $ | 16,024 | |||||
|
Other assets, net |
||||||||
|
Other intangibles, net |
$ | 415 | $ | 1,073 | ||||
|
Security deposits |
1,323 | 1,315 | ||||||
|
Other long-term assets |
950 | 291 | ||||||
| $ | 2,688 | $ | 2,679 | |||||
|
Accounts payable |
||||||||
|
Trade payables |
$ | 7,392 | $ | 6,648 | ||||
|
VAT payable |
3,924 | 4,163 | ||||||
| $ | 11,316 | $ | 10,811 | |||||
|
Other current liabilities |
||||||||
|
Accrued commissions and bonus |
$ | 13,449 | $ | 12,155 | ||||
|
Accrued compensated absences |
8,346 | 7,887 | ||||||
|
Other accrued payroll |
4,477 | 4,126 | ||||||
|
Accrued professional fees |
1,709 | 1,416 | ||||||
|
Accrued travel |
1,304 | 1,558 | ||||||
|
Accrued contract labor |
812 | 914 | ||||||
|
Other current liabilities |
3,539 | 3,479 | ||||||
| $ | 33,636 | $ | 31,535 | |||||
|
Other liabilities |
||||||||
|
Long-term deferred revenue |
$ | 2,353 | $ | 1,690 | ||||
|
Fair value of interest rate swap |
190 | 675 | ||||||
|
Long-term tax contingency reserve |
764 | 503 | ||||||
|
Lease restoration obligations |
736 | 730 | ||||||
|
Other |
871 | 867 | ||||||
| $ | 4,914 | $ | 4,465 | |||||
8. DEBT
|
January 31, 2017 |
January 31, 2016 |
|||||||
|
(in thousands) |
||||||||
|
Note payable |
$ | 14,269 | $ | 14,680 | ||||
|
Less current maturities |
(446 |
) |
(422 |
) | ||||
|
Less loan origination costs, net |
(56 |
) |
(67 |
) | ||||
|
Long-term debt |
$ | 13,767 | $ | 14,191 | ||||
Note Payable
Effective May 30, 2012, QAD Ortega Hill, LLC entered into a variable rate credit agreement (the “2012 Mortgage”) with Rabobank, N.A., to refinance a pre-existing mortgage. The 2012 Mortgage has an original principal balance of $16.1 million and bears interest at the one month LIBOR rate plus 2.25%. One month LIBOR was 0.77% at January 31, 2017. The 2012 Mortgage matures in June 2022 and is secured by the Company’s headquarters located in Santa Barbara, California. In conjunction with the 2012 Mortgage, QAD Ortega Hill, LLC entered into an interest rate swap with Rabobank, N.A. The swap agreement has an initial notional amount of $16.1 million and a schedule matching that of the underlying loan that synthetically fixes the interest rate on the debt at 4.31% for the entire term of the 2012 Mortgage. The terms of the 2012 Mortgage provide for QAD Ortega Hill, LLC to make net monthly payments of $88,100 consisting of principal and interest and one final payment of $11.7 million. The unpaid balance as of January 31, 2017 was $14.3 million.
Credit Facility
The Company has an unsecured credit agreement with Rabobank, N.A. (the “Facility”). The Facility provides a commitment through July 15, 2017 for a $20 million line of credit for working capital or other business needs. The Company pays a commitment fee of 0.25% per annum of the daily average of the unused portion of the $20 million Facility. Borrowings under the Facility bore interest at a rate equal to one month LIBOR plus 0.75%. At January 31, 2017, the effective borrowing rate would have been 1.52%.
The Facility provides that the Company maintain certain financial and operating ratios which include, among other provisions, minimum liquidity on a consolidated basis of $25 million in cash and equivalents at all times, a current ratio (calculated using current liabilities excluding deferred revenue) of not less than 1.3 to 1.0 determined at the end of each fiscal quarter, a leverage ratio of not more than 1.5 to 1.0 determined at the end of each fiscal quarter, and a debt service coverage ratio of not less than 1.5 to 1.0 determined at the end of each fiscal year. The Facility also contains customary covenants that could restrict the Company’s ability to incur additional indebtedness.
As of January 31, 2017, there were no borrowings under the Facility and the Company was in compliance with all financial covenants.
9. ACCUMULATED OTHER COMPREHENSIVE LOSS
The components of accumulated other comprehensive loss, net of taxes, were as follows:
|
Foreign Currency Translation Adjustments |
||||
|
(in thousands) |
||||
|
Balance as of January 31, 2016 |
$ | (8,729 |
) | |
|
Other comprehensive loss before reclassifications |
98 | |||
|
Amounts reclassified from accumulated other comprehensive loss |
— | |||
|
Net current period other comprehensive loss |
98 | |||
|
Balance as of January 31, 2017 |
$ | (8,631 |
) | |
During fiscal 2017 there were no reclassifications from accumulated other comprehensive loss.
10. EMPLOYEE BENEFIT PLANS
The Company has a defined contribution 401(k) plan which is available to U.S. employees after 30 days of employment. Employees may contribute up to the maximum allowable by the Internal Revenue Code. The Company voluntarily matches 75% of the employees’ contributions up to the first four percent of the employee’s eligible compensation. In addition, the Company can make additional contributions at the discretion of the board of directors. Participants are immediately vested in their employee contributions. Employer contributions vest over a five-year period. The Company’s contributions for fiscal years 2017, 2016 and 2015 were $2.1 million, $1.8 million and $1.8 million, respectively.
Various QAD foreign subsidiaries also contribute to defined contribution pension plans. Employer contributions in these plans are generally based on employee salary and range from 3% to 21%. These plans are funded at various times throughout the year according to plan provisions, with aggregate employer contributions of $4.8 million, $4.8 million and $5.0 million during fiscal years 2017, 2016 and 2015, respectively.
11. COMMITMENTS AND CONTINGENCIES
Lease Obligations
The Company leases certain office facilities, office equipment and automobiles under operating lease agreements. The leases generally provide that QAD pays taxes, insurance and maintenance expenses related to the leased assets. Total rent expense for fiscal years 2017, 2016 and 2015 was $4.9 million, $5.0 million and $5.6 million, respectively. Future minimum rental payments under non-cancelable operating lease commitments with terms of more than one year as of January 31, 2017 are as follows (in millions):
|
2018 |
$ | 5.4 | ||
|
2019 |
4.3 | |||
|
2020 |
2.4 | |||
|
2021 |
1.1 | |||
|
2022 |
0.3 | |||
|
Thereafter |
0.1 | |||
| $ | 13.6 |
Purchase Obligations
At January 31, 2017, the Company had $13.3 million of other non-cancelable contractual obligations, related to the purchase of goods and services not included in the table above.
Indemnifications
The Company sells software licenses and services to its customers under written agreements. Each agreement contains the relevant terms of the contractual arrangement with the customer and generally includes certain provisions for indemnifying the customer against losses, expenses and liabilities from damages that may be awarded against the customer in the event the Company’s software is found to infringe upon certain intellectual property rights of a third party. The agreements generally limit the scope of and remedies for such indemnification obligations in a variety of industry-standard respects.
The Company believes its internal development processes and other policies and practices limit its exposure related to the indemnification provisions of the agreements. For several reasons, including the lack of prior indemnification claims and the lack of a monetary liability limit for certain infringement cases under the agreements, the Company cannot determine the maximum amount of potential future payments, if any, related to such indemnification provisions.
Legal Actions
The Company is subject to various legal proceedings and claims, either asserted or unasserted, which arise in the ordinary course of business. While the outcome of these claims cannot be predicted with certainty, management does not believe that the outcome of any of these legal matters will have a material adverse effect on the Company’s consolidated results of operations, financial position or liquidity.
12. BUSINESS SEGMENT INFORMATION
The Company markets its products and services worldwide, primarily to companies in the manufacturing industry, including automotive, consumer products, food and beverage, high technology, industrial products and life sciences industries. The Company sells and licenses its products through its direct sales force in four geographic regions: North America; Europe, the Middle East and Africa (“EMEA”); Asia Pacific; and Latin America and through distributors where third parties can extend sales reach more effectively or efficiently. The North America region includes the United States and Canada. The EMEA region includes Europe, the Middle East and Africa. The Asia Pacific region includes Asia and Australia. The Latin America region includes South America, Central America and Mexico. The Company’s Chief Operating Decision Maker, the Chief Executive Officer, reviews the consolidated results within one operating segment.
Subscription, license and maintenance revenues are allocated to the region where the end user is located. Services revenue is assigned based on the region where the services are performed.
Capital expenditures and property and equipment, net are assigned by geographic region based on the location of each legal entity.
|
Years Ended January 31, |
||||||||||||
|
2017 |
2016 |
2015 |
||||||||||
|
(in thousands) |
||||||||||||
|
Revenue: |
||||||||||||
|
North America (1) |
$ | 129,436 | $ | 127,776 | $ | 129,693 | ||||||
|
EMEA |
81,765 | 84,268 | 98,279 | |||||||||
|
Asia Pacific |
47,742 | 46,457 | 48,292 | |||||||||
|
Latin America |
19,030 | 19,351 | 18,837 | |||||||||
| $ | 277,973 | $ | 277,852 | $ | 295,101 | |||||||
|
January 31, |
||||||||
|
2017 |
2016 |
|||||||
|
(in thousands) |
||||||||
|
Property and equipment, net: |
||||||||
|
North America |
$ | 26,601 | $ | 27,304 | ||||
|
EMEA |
2,861 | 3,270 | ||||||
|
Asia Pacific |
1,075 | 1,331 | ||||||
|
Latin America |
335 | 175 | ||||||
| $ | 30,872 | $ | 32,080 | |||||
|
(1) |
Sales into Canada accounted for 2% of North America total revenue for each of the fiscal years 2017, 2016 and 2015. |
13. QUARTERLY INFORMATION (Unaudited)
|
Quarters Ended |
||||||||||||||||
|
April 30 |
July 31 |
Oct. 31 |
Jan. 31 |
|||||||||||||
|
(in thousands, except per share data) |
||||||||||||||||
|
Fiscal 2017 |
||||||||||||||||
|
Total revenue |
$ | 65,397 | $ | 69,778 | $ | 69,534 | $ | 73,264 | ||||||||
|
Total costs and expenses |
68,390 | 69,816 | 67,275 | 69,128 | ||||||||||||
|
Gross margin |
33,259 | 36,974 | 36,477 | 40,412 | ||||||||||||
|
Operating (loss) income |
(2,993 |
) |
(38 |
) |
2,259 | 4,136 | ||||||||||
|
Net (loss) income |
(2,792 |
) |
968 | 1,533 | (15,159 |
) | ||||||||||
|
Basic net (loss) income per share |
||||||||||||||||
|
Class A |
$ | (0.15 |
) |
$ | 0.05 | $ | 0.08 | $ | (0.82 |
) | ||||||
|
Class B |
(0.13 |
) |
0.04 | 0.07 | (0.68 |
) | ||||||||||
|
Diluted net income per share |
||||||||||||||||
|
Class A |
$ | (0.15 |
) |
$ | 0.05 | $ | 0.08 | $ | (0.82 |
) | ||||||
|
Class B |
(0.13 |
) |
0.04 | 0.07 | (0.68 |
) | ||||||||||
|
Fiscal 2016 |
||||||||||||||||
|
Total revenue |
$ | 69,265 | $ | 71,291 | $ | 68,037 | $ | 69,259 | ||||||||
|
Total costs and expenses |
68,505 | 68,968 | 64,570 | 65,638 | ||||||||||||
|
Gross margin |
37,167 | 38,663 | 37,032 | 38,428 | ||||||||||||
|
Operating income |
760 | 2,323 | 3,467 | 3,621 | ||||||||||||
|
Net income |
549 | 1,631 | 2,586 | 4,146 | ||||||||||||
|
Basic net income per share |
||||||||||||||||
|
Class A |
$ | 0.03 | $ | 0.09 | $ | 0.14 | $ | 0.23 | ||||||||
|
Class B |
0.03 | 0.08 | 0.12 | 0.19 | ||||||||||||
|
Diluted net income per share |
||||||||||||||||
|
Class A |
$ | 0.03 | $ | 0.09 | $ | 0.14 | $ | 0.22 | ||||||||
|
Class B |
0.02 | 0.07 | 0.12 | 0.18 | ||||||||||||
SCHEDULE II
SCHEDULE OF VALUATION AND QUALIFYING ACCOUNTS
(in thousands)
|
Balance at |
Charged |
Write-Offs, |
Impact of |
Balance at |
||||||||||||||||
|
Year ended January 31, 2015 |
||||||||||||||||||||
|
Allowance for bad debt |
1,221 | 86 | (39 |
) |
(74 |
) |
1,194 | |||||||||||||
|
Allowance for sales adjustments |
1,229 | 768 | (574 |
) |
(93 |
) |
1,330 | |||||||||||||
|
Total allowance for doubtful accounts |
$ | 2,450 | $ | 854 | $ | (613 |
) |
$ | (167 |
) |
$ | 2,524 | ||||||||
|
Year ended January 31, 2016 |
||||||||||||||||||||
|
Allowance for bad debt |
1,194 | 78 | (5 |
) |
(25 |
) |
1,242 | |||||||||||||
|
Allowance for sales adjustments |
1,330 | 696 | (555 |
) |
(71 |
) |
1,400 | |||||||||||||
|
Total allowance for doubtful accounts |
$ | 2,524 | $ | 774 | $ | (560 |
) |
$ | (96 |
) |
$ | 2,642 | ||||||||
|
Year ended January 31, 2017 |
||||||||||||||||||||
|
Allowance for bad debt |
1,242 | 40 | (184 | ) | (8 | ) | 1,090 | |||||||||||||
|
Allowance for sales adjustments |
1,400 | 197 | (472 | ) | (10 | ) | 1,115 | |||||||||||||
|
Total allowance for doubtful accounts |
$ | 2,642 | $ | 237 | $ | (656 |
) |
$ | (18 | ) | $ | 2,205 | ||||||||
See accompanying report of independent registered public accounting firm.
SIGNATURES
Pursuant to the requirements of Section 13 or 15(d) of the Securities Exchange Act of 1934, the Registrant has duly caused this report to be signed on its behalf by the undersigned, thereunto duly authorized, on April 7, 2017.
|
|
QAD Inc. | |
|
|
|
|
|
|
By: |
/s/ Daniel Lender |
|
|
|
Daniel Lender (Principal Financial Officer) |
Pursuant to the requirements of the Securities Exchange Act of 1934, this report has been signed by the following persons on behalf of the Registrant and in the capacities and on the date indicated.
|
Signature |
Title |
Date | ||
|
|
|
| ||
|
/s/ PAMELA M. LOPKER |
Chairman of the Board and President |
April 7, 2017 | ||
|
Pamela M. Lopker |
| |||
|
|
|
| ||
|
/s/ KARL F. LOPKER |
Director, Chief Executive Officer |
April 7, 2017 | ||
|
Karl F. Lopker |
(Principal Executive Officer) |
| ||
|
|
|
| ||
|
/s/ DANIEL LENDER |
Chief Financial Officer and Executive Vice President |
April 7, 2017 | ||
|
Daniel Lender |
(Principal Financial Officer) |
| ||
|
|
|
| ||
|
/s/ KARA BELLAMY |
Corporate Controller and Senior Vice President |
April 7, 2017 | ||
|
Kara Bellamy |
(Chief Accounting Officer) |
| ||
|
|
|
| ||
|
/s/ SCOTT ADELSON |
Director |
April 7, 2017 | ||
|
Scott Adelson |
|
| ||
|
|
|
| ||
|
/s/ PETER R. VAN CUYLENBURG |
Director |
April 7, 2017 | ||
|
Peter R. van Cuylenburg |
|
| ||
|
|
|
| ||
|
/s/ LESLIE STRETCH |
Director |
April 7, 2017 | ||
|
Leslie Stretch |
|
| ||
|
|
|
| ||
|
/s/ LEE ROBERTS |
Director |
April 7, 2017 | ||
|
Lee Roberts |
|
|
INDEX OF EXHIBITS
|
EXHIBIT |
EXHIBIT TITLE | |
|
3.1 |
Amended and Restated Certificate of Incorporation of the Registrant, filed with the Delaware Secretary of State on December 15, 2010 (Incorporated by reference to Exhibit 3.1 of the Registrant’s Annual Report on Form 10-K for the fiscal year ended January 31, 2011) | |
|
|
| |
|
3.2 |
Revised Bylaws of the Registrant (Incorporated by reference to Exhibit 3.1 of the Registrant's Form 8-K filed on December 13, 2013) | |
|
|
| |
|
4.1 |
Specimen Class A and Class B Common Stock Certificate (Incorporated by reference to Exhibit 4.1 of the Registrant’s Annual Report on Form 10-K for the fiscal year ended January 31, 2011) | |
|
|
| |
|
10.1 |
QAD Inc. 2006 Stock Incentive Program (Incorporated by reference to Exhibit 4.4 of the Registrant’s Registration Statement on Form S-8 (Commission File No. 333-137417)) | |
|
|
| |
|
10.1(a) |
Forms of Agreement for QAD Inc. 2006 Stock Incentive Program (Incorporated by reference to Exhibit 10.2(a) of the Registrant’s Annual Report on Form 10-K for the fiscal year ended January 31, 2009) | |
|
|
| |
|
10.2 |
Form of Indemnification Agreement with Directors and Executive Officers (Incorporated by reference to Exhibit 10.3 of the Registrant’s Registration Statement on Form S-1 (Commission File No. 333- 28441))† | |
|
|
| |
|
10.3 |
Executive Termination Policy (Incorporated by reference to Exhibit 10.2 of the Registrant’s Quarterly Report on Form 10-Q for the quarter ended April 30, 2011)† | |
|
|
| |
|
10.4 |
Change in Control Policy (Incorporated by reference to Exhibit 10.1 of the Registrant’s Quarterly Report on Form 10-Q for the quarter ended April 30, 2011)† | |
|
|
| |
|
10.4(a) |
Change in Control Agreement for Karl Lopker (Incorporated by reference to Exhibit 10.5 of the Registrant’s Annual Report on Form 10-K for the fiscal year ended January 31, 2009)† | |
|
|
| |
|
10.4(b) |
Change in Control Agreement for Pam Lopker (Incorporated by reference to Exhibit 10.6 of the Registrant’s Annual Report on Form 10-K for the fiscal year ended January 31, 2009)† | |
|
|
| |
|
10.4(c) |
Change in Control Agreement for Daniel Lender (Incorporated by reference to Exhibit 10.7(a) of the Registrant’s Annual Report on Form 10-K for the fiscal year ended January 31, 2009)† | |
|
|
| |
|
10.5 |
Offer letter between the Registrant and Daniel Lender dated October 10, 2008 (Incorporated by reference to Exhibit 10.72 of the Registrant’s Quarterly Report on Form 10-Q for the quarter ended October 31, 2008)† |
|
EXHIBIT |
EXHIBIT TITLE | |
|
10.6 |
Acknowledgement between the Registrant and Daniel Lender dated October 10, 2008 (Incorporated by reference to Exhibit 10.3 of the Registrant’s Quarterly Report on Form 10-Q for the quarter ended April 30, 2011)† | |
|
|
| |
|
10.7 |
Credit Agreement between the Registrant and Rabobank, N.A. effective as of July 8, 2011 (Incorporated by reference to Exhibit 10.1 of the Registrant’s Form 8-K filed on July 14, 2011) | |
|
|
| |
|
10.7(a) |
Promissory Note between the Registrant and Rabobank, N.A. effective as of July 8, 2011 (Incorporated by reference to Exhibit 10.2 of the Registrant’s Form 8-K filed on July 14, 2011) | |
|
|
| |
|
10.7(b) |
Disbursement Request and Authorization between the Registrant and Rabobank, N.A. effective as of July 8, 2011 (Incorporated by reference to Exhibit 10.3 of the Registrant’s Form 8-K filed on July 14, 2011) | |
|
|
| |
|
10.7(c) |
First Amendment to Credit Agreement between the Registrant and Rabobank, N.A. effective as of July 13, 2012 (Incorporated by reference to Exhibit 10.1 of the Registrant’s Form 8-K filed on July 17, 2012) | |
|
|
| |
|
10.7(d) |
Second Amendment to Credit Agreement between the Registrant and Rabobank N.A. effective as of July 11, 2014 (Incorporated by reference to Exhibit 10.1 of the Registrant’s Form 8-K filed on July 17, 2014) | |
|
|
| |
|
10.8 |
Credit Agreement between the Registrant and Rabobank, N.A. effective as of May 30, 2012 (Incorporated by reference to Exhibit 10.1 of the Registrant’s Form 8-K filed on June 5, 2012) | |
|
|
| |
|
10.8(a) |
Real Estate Term Loan Note between the Registrant and Rabobank, N.A. effective as of May 30, 2012 (Incorporated by reference to Exhibit 10.2 of the Registrant’s Form 8-K filed on June 5, 2012) | |
|
|
| |
|
10.8(b) |
Deed of Trust between the Registrant and Rabobank, N.A. effective as of May 30, 2012 (Incorporated by reference to Exhibit 10.3 of the Registrant’s Form 8-K filed on June 5, 2012) | |
|
|
| |
|
10.8(c) |
ISDA 2002 Master Agreement between the Registrant and Rabobank, N.A. effective as of May 30, 2012 (Incorporated by reference to Exhibit 10.4 of the Registrant’s Form 8-K filed on June 5, 2012) | |
|
|
| |
|
10.8(d) |
ISDA Schedule to the 2002 Master Agreement between the Registrant and Rabobank, N.A. effective as of May 30, 2012 (Incorporated by reference to Exhibit 10.5 of the Registrant’s Form 8-K filed on June 5, 2012) | |
|
|
| |
|
10.8(e) |
Confirmation of a Swap Transaction between the Registrant and Rabobank, N.A. effective as of June 4, 2012 (Incorporated by reference to Exhibit 10.6 of the Registrant’s Form 8-K filed on June 5, 2012) | |
|
10.9 |
2016 Stock Incentive Program (Incorporated by reference to Exhibit A of the Company’s Definitive Proxy Statement for the Registrant’s 2016 Annual Meeting of Stockholders filed on Schedule 14A on April 29, 2016) † | |
|
10.9(a) |
Form of Stock Rights Agreement under the 2016 Stock Incentive Program (Incorporated by reference to Exhibit 10.2 of the Registrant’s Form 8-K filed on June 17, 2016) † | |
|
10.9(b) |
Form of Restricted Stock Unit Agreement under the 2016 Stock Incentive Program (Incorporated by reference to Exhibit 10.3 of the Registrant’s Form 8-K filed on June 17, 2016) † | |
|
10.9(c) |
Form of Stock Appreciation Rights Agreement under the 2016 Stock Incentive Program (Incorporated by reference to Exhibit 10.4 of the Registrant’s Form 8-K filed on June 17, 2016) † | |
|
10.10 |
Offer letter between the Registrant and Anton Chilton, dated March 7, 2017*† | |
|
21.1 |
Subsidiaries of the Registrant* | |
|
|
| |
|
23.1 |
Consent of Independent Registered Public Accounting Firm* | |
|
|
| |
|
31.1 |
Certification by the Chief Executive Officer pursuant to Rule 13a-14(a) of the Securities Exchange Act of 1934, as adopted pursuant to Section 302 of the Sarbanes-Oxley Act of 2002* |
|
EXHIBIT |
EXHIBIT TITLE | |
|
31.2 |
Certification by the Chief Financial Officer pursuant to Rule 13a-14(a) of the Securities Exchange Act of 1934, as adopted pursuant to Section 302 of the Sarbanes-Oxley Act of 2002* | |
|
|
| |
|
32.1 |
Certification by the Chief Executive Officer and the Chief Financial Officer furnished pursuant to 18 U.S.C. Section 1350, as adopted pursuant to Section 906 of the Sarbanes-Oxley Act of 2002* | |
|
|
| |
|
101.INS |
XBRL Instance Document | |
|
|
| |
|
101.SCH |
XBRL Taxonomy Extension Schema Document | |
|
|
| |
|
101.CAL |
XBRL Taxonomy Extension Calculation Linkbase Document | |
|
|
| |
|
101.DEF |
XBRL Taxonomy Extension Definition Linkbase Document | |
|
|
| |
|
101.LAB |
XBRL Taxonomy Extension Label Linkbase Document | |
|
|
| |
|
101.PRE |
XBRL Taxonomy Extension Presentation Linkbase Document |
|
|
(*) |
Indicates the document is filed herewith. |
|
(†) |
Indicates a management contract or compensatory plan or arrangement required to be filed as an exhibit. |
94