Attached files
| file | filename |
|---|---|
| EX-31.1 - EX-31.1 - At Home Group Inc. | home-20170128ex31107a759.htm |
| EX-32.1 - EX-32.1 - At Home Group Inc. | home-20170128ex321aca96b.htm |
| EX-31.2 - EX-31.2 - At Home Group Inc. | home-20170128ex312ff530a.htm |
| EX-21.1 - EX-21.1 - At Home Group Inc. | home-20170128ex211560233.htm |
| EX-10.21 - EX-10.21 - At Home Group Inc. | home-20170128ex1021a69d9.htm |
UNITED STATES
SECURITIES AND EXCHANGE COMMISSION
Washington, D.C. 20549
FORM 10-K
|
☒ANNUAL REPORT PURSUANT TO SECTION 13 OR 15(d) OF THE SECURITIES EXCHANGE ACT OF 1934 |
For the fiscal year ended January 28, 2017
or
|
☐TRANSITION REPORT PURSUANT TO SECTION 13 OR 15(d) OF THE SECURITIES EXCHANGE ACT OF 1934 |
Commission File Number: 001-37849
AT HOME GROUP INC.
(Exact name of registrant as specified in its charter)
|
Delaware |
|
45-3229563 |
|
(State of other jurisdiction of incorporation or organization) |
|
(I.R.S. Employer Identification No.) |
|
1600 East Plano Parkway |
|
75074 |
|
(Address of principal executive offices) |
|
(Zip Code) |
(972) 265-6227
(Registrant’s telephone number, including area code)
Securities registered pursuant to Section 12(b) of the Act:
|
Title of each class |
|
Name of each exchange on which registered |
|
Common Stock, par value $0.01 per share |
|
New York Stock Exchange |
Securities registered pursuant to Section 12(g) of the Act: None
Indicate by check mark if the registrant is a well-known seasoned issuer, as defined in Rule 405 of the Securities Act. ☐ Yes ☒ No
Indicate by check mark whether the registrant (1) has filed all reports required to be filed by Section 13 or 15(d) of the Securities Exchange Act of 1934 during the preceding 12 months (or for such shorter period that the registrant was required to file such reports), and (2) has been subject to such filing requirements for the past 90 days. ☒ Yes ☐ No
Indicate by check mark whether the registrant has submitted electronically and posted on its corporate Web site, if any, every Interactive Data File required to be submitted and posted pursuant to Rule 405 of Regulation S-T (§232.405 of this chapter) during the preceding 12 months (or for such shorter period that the registrant was required to submit and post such files). ☒ Yes ☐ No
Indicate by check mark if disclosure of delinquent filers pursuant to Item 405 of Regulation S-K is not contained herein, and will not be contained, to the best of the registrant's knowledge, in definitive proxy or information statements incorporated by reference in Part III of this Form 10-K or any amendment to this Form 10-K. ☐ Yes ☒ No
Indicate by check mark whether the registrant is a large accelerated filer, an accelerated filer, a non-accelerated filer, or a smaller reporting company. See the definitions of “large accelerated filer,” “accelerated filer” and “smaller reporting company” in Rule 12b-2 of the Exchange Act.
|
Large accelerated filer ☐ |
|
Accelerated filer ☐ |
|
Non-accelerated filer ☒ |
|
Smaller reporting company ☐ |
Indicate by check mark whether the registrant is a shell company (as defined in Rule 12b-2 of the Exchange Act). ☐ Yes ☒ No
The aggregate market value of the common stock of the Registrant held by non-affiliates of the Registrant on August 4, 2016, based upon the closing price of $15.00 of the Registrant's common stock as reported on the New York Stock Exchange, was $129,840,000. The Registrant has elected to use August 4, 2016 as the calculation date, which was the initial trading date of the Registrant's common stock on the New York Stock Exchange, because as of July 30, 2016, the last business day of the registrant’s most recently completed second fiscal quarter, there was no established public market for the registrant’s common stock.
There were 60,366,768 shares of the registrant’s common stock, par value $0.01 per share, outstanding as of March 31, 2017.
DOCUMENTS INCORPORATED BY REFERENCE
Portions of the registrant's definitive Proxy Statement for its 2017 Annual Meeting of Stockholders are incorporated by reference into Part III of this Annual Report on Form 10-K. The Proxy Statement will be filed with the Securities and Exchange Commission within 120 days of the registrant’s fiscal year ended January 28, 2017.
AT HOME GROUP INC.
This Annual Report on Form 10-K contains forward-looking statements within the meaning of the U.S. Private Securities Litigation Reform Act of 1995. You can generally identify forward-looking statements by our use of forward-looking terminology such as “anticipate”, “believe”, “continue”, “could”, “estimate”, “expect”, “intend”, “may”, “might”, “plan”, “potential”, “predict”, “seek”, “vision”, or “should”, or the negative thereof or other variations thereon or comparable terminology. In particular, statements about our expected new store openings, our real estate strategy, growth targets and potential growth opportunities and future capital expenditures and our expectations, beliefs, plans, strategies, objectives, prospects, assumptions or future events or performance contained in this report are forward-looking statements.
We have based these forward-looking statements on our current expectations, assumptions, estimates and projections. While we believe these expectations, assumptions, estimates and projections are reasonable, such forward-looking statements are only predictions and involve known and unknown risks and uncertainties, including the important factors described in the “Item 1A. Risk Factors” section of this Annual Report on Form 10-K, many of which are beyond our control. These and other important factors may cause our actual results, performance or achievements to differ materially from any future results, performance or achievements expressed or implied by these forward-looking statements. Given these risks and uncertainties, you are cautioned not to place undue reliance on such forward-looking statements. The forward-looking statements contained in this report are not guarantees of future performance and our actual results of operations, financial condition and liquidity, and the development of the industry in which we operate, may differ materially from the forward-looking statements contained in this report. In addition, even if our results of operations, financial condition and liquidity, and events in the industry in which we operate, are consistent with the forward-looking statements contained in this report, they may not be predictive of results or developments in future periods.
Any forward-looking statement that we make in this Annual Report on Form 10-K speaks only as of the date of such statement. Except as required by law, we do not undertake any obligation to update or revise, or to publicly announce any update or revision to, any of the forward-looking statements, whether as a result of new information, future events or otherwise, after the date of this report.
Unless the context otherwise requires, references in this Annual Report on Form 10-K to “the Company”, “At Home”, “we”, “us”, and “our” refer to At Home Group Inc. and its consolidated subsidiaries.
History and Company Overview
At Home is the leading home décor superstore based on the number of our locations and our large format stores that we believe dedicate more space per store to home décor than any other player in the industry. We are focused on providing the broadest assortment of products for any room, in any style, for any budget. We utilize our space advantage to out-assort our competition, offering over 50,000 SKUs throughout our stores. Our differentiated merchandising strategy allows us to identify on-trend products and then value engineer those products to provide desirable aesthetics at attractive price points for our customers. Over 70% of our products are unbranded, private label or specifically designed for us. We believe that our broad and comprehensive offering and compelling value proposition combine to create a leading destination for home décor with the opportunity to continue taking market share in a large, fragmented and growing market.
At Home (formerly known as Garden Ridge) was founded in 1979 in Garden Ridge, Texas, a suburb of San Antonio. We quickly gained a loyal following in our Texas home market and expanded thereafter. Throughout our history, we have cultivated a passionate customer base that shops our stores for the unique, wide assortment of products offered at value price points. After our Company was acquired in 2011 by an investment group led by AEA Investors LP ("AEA"), which included affiliates of Starr Investment Holdings, LLC ("Starr Investments" and, together with AEA, the “Sponsors”), we began a series of strategic investments in the business. We believe that the core strengths of our
1
business combined with the significant investments made in the years following our acquisition by our Sponsors position us to grow sales and expand our store base.
As of January 28, 2017, our store base is comprised of 123 stores across 30 states, averaging approximately 115,000 square feet per store. We utilize a flexible and disciplined real estate strategy that allows us to successfully open and operate stores from 80,000 to 165,000 square feet across a wide range of formats and markets. All of our stores that were open as of the beginning of the fiscal year are profitable, and stores that have been open for more than a year average over $6 million in net sales. Due in part to our past investments, our distribution center should be able to support up to approximately 220 stores. In addition, based on our internal analysis and research conducted for us by Buxton Company, a leading real estate analytics firm (referred to herein as “Buxton”), we believe that we have the potential to expand to at least 600 stores in the United States over the long term although we do not currently have an anticipated timeframe to reach this potential.
We have developed a highly efficient operating model that seeks to drive growth and profitability while minimizing operating risk. Our merchandising, sourcing and pricing strategies generate strong and consistent performance across our product offering and throughout the entire year. Through specialized in‑store merchandising and visual navigation elements, we enable a self‑service model that minimizes in‑store staffing needs and allows us to deliver exceptional value to our customers.
We believe that our differentiated home décor concept, flexible real estate strategy and highly efficient operating model create competitive advantages that have driven our financial success.
Initial Public Offering
On August 3, 2016, our Registration Statement on Form S-1 relating to our initial public offering was declared effective by the Securities and Exchange Commission (“SEC”) pursuant to which we registered an aggregate of 9,967,050 shares of our common stock (including 1,300,050 shares subject to the underwriters' over-allotment option). We issued and sold 8,667,000 of the shares registered at a price of $15.00 per share on August 9, 2016, resulting in net proceeds of $120.9 million after deducting underwriters' discounts and commissions of $9.1 million. On September 8, 2016, we issued and sold a further 863,041 shares of our common stock pursuant to the underwriters’ partial exercise of the over-allotment option. This exercise of the over-allotment option resulted in net proceeds to us of $12.0 million after deducting underwriters’ discounts and commissions of $0.9 million.
We used the net proceeds from the initial public offering and partial exercise of the over-allotment option, after deducting underwriters’ discounts and commissions, to repay in full the $130.0 million of principal amount of indebtedness outstanding under our $130.0 million second lien term loan (the “Second Lien Term Loan”).
Our common stock began trading on the New York Stock Exchange (the “NYSE”), on August 4, 2016 under the ticker symbol "HOME".
Our Growth Strategies
We expect to continue our strong sales growth and leading profitability by pursuing the following strategies:
Expand Our Store Base
We believe there is a tremendous whitespace opportunity to expand in both existing and new markets in the United States. Over the long term, we believe we have the potential to expand to at least 600 stores in the United States based on our internal analysis and research conducted by Buxton. During fiscal year 2017, we opened 23 new stores, net of one relocation. During fiscal year 2018, we plan to open 25 net new stores and we plan to open at least 25 new stores in each subsequent year for the foreseeable future. The rate of future growth in any particular period is inherently uncertain and is subject to numerous factors that are outside of our control. As a result, we do not currently have an anticipated timeframe to reach our long‑term potential. In addition, due in part to our investments, our systems, processes and controls should be able to support up to approximately 220 stores with limited incremental investment.
2
We have used our site selection model to score over 20,000 big box retail locations throughout the United States, which positions us to be able to act quickly as locations become available, and we have developed detailed market maps for each U.S. market that guide our deliberate expansion strategy. We have opened stores in a mix of existing and new markets. New stores in existing markets have increased our total market share due to higher brand awareness. We believe there is still considerable opportunity to continue adding locations in even our most established markets. In addition, we anticipate a limited number of relocations periodically as we evaluate our position in the market upon the impending expiration of lease terms. We have demonstrated our ability to open stores successfully in a diverse range of new markets across the country. Our portable concept has delivered consistent store economics across all markets, from smaller, less dense locations to larger, more heavily populated metropolitan areas. We have delivered over 20% year‑over‑year net sales growth in each of the past eleven consecutive quarters.
Our new store model combines high average unit volumes and high margins with low net capital investment and occupancy costs, resulting in cash flow generation early in the life of a store. Our stores typically mature within six months of opening. We target first year annualized sales of $5 million. Our new stores require, on average, approximately $3 million of net investment, varying based on our lease, purchase or build decisions, but with a target payback period of less than two years.
Drive Comparable Store Sales
We have achieved positive comparable store sales in each of the last twelve consecutive fiscal quarters, ranging from 0.9% to 11.4%, and averaging 5.2% growth over the period. Comparable store sales can be impacted by various factors from period to period, including our recent rebranding, as discussed in “Item 7. Management’s Discussion and Analysis of Financial Condition and Results of Operations—How We Assess the Performance of Our Business”. We will seek to continue to drive demand and customer spend by providing a targeted, exciting product selection and a differentiated shopping experience, including the following specific strategic initiatives:
|
· |
Continuously introduce new and on‑trend products to appeal to a wide range of customers and improve the mix of our assortment (“good / better / best” product offering); |
|
· |
Enhance inventory planning and allocation capabilities to get the right products in the right store at the right time; |
|
· |
Continue to strengthen our visual merchandising such as vignettes, end caps and feature tables to inspire our customers and generate in‑store demand; and |
|
· |
Grow the At Home brand through marketing and advertising as well as community engagements that target the home décor enthusiast to drive increased traffic to our stores. |
Build the At Home Brand and Create Awareness
During fiscal year 2015, we launched the At Home brand, which we believe better communicates our positioning as the leading home décor superstore. Additionally, we re‑established a marketing function and reinstated marketing spend to highlight our new brand, broad product offering and compelling value proposition. Given the newness and relatively limited awareness of the At Home brand, we believe there is a significant opportunity to grow our brand and build awareness for existing and new markets.
To address this opportunity, we intend to allocate our marketing spend across a range of strategic initiatives in order to highlight our differentiated value proposition. We will involve both traditional media platforms and unique, targeted strategies aimed at reaching the home décor enthusiast. Our marketing and brand building efforts will be enhanced by engaging in an ongoing dialogue with our customers through growing social and mobile channels. We believe we have an opportunity to leverage our growing social media and online presence to drive brand excitement and increase store visits within existing and new markets.
3
We have loyal, enthusiastic and diverse customers who are deeply passionate about, and love to decorate, their homes. Based on research completed by a third-party during fiscal year 2016, our current customer demographic consists primarily of women and we appeal to a broad income demographic. Our customers average 46 years of age, while customers under 34 years of age comprise almost 30% of our demographic, representing the fastest growing segment and indicating our cross-generational appeal. Regardless of age or income, we focus on customers who are highly engaged in, and spend substantial time and money on home décor.
Through our extensive customer research, we have learned that many home décor enthusiasts browse online for ideas, inspiration and general product information before visiting specific stores. In fiscal year 2017, we upgraded our website to enable our customers to view our product assortment online with robust search functionality and a mobile‑friendly website. This enhancement focuses on an inspirational shopping experience that showcases decorating ideas to drive traffic into our stores. We are exploring opportunities to provide various levels of e‑commerce capabilities but intend to focus on initiatives that maintain our industry‑leading profitability.
We believe increased brand awareness will not only drive traffic to existing stores, but also strengthen our business as we expand into new markets.
Our Industry
We compete in the large, growing and highly fragmented home furnishings and décor market. The industry had total sales of approximately $189 billion in 2015 according to Home Furnishings News, and has enjoyed stable growth at an annual rate of approximately 2.3% per year over the last five years according to Euromonitor. We attribute this growth to the industry’s broad consumer appeal, coupled with strong positive tailwinds from a growing housing market, rising property values and home sales and growing disposable incomes. This growth trend is expected to continue, with a forecasted growth rate of approximately 2.2% over the next five years according to Euromonitor.
Unlike other big box retail categories (e.g., office supplies, home improvement and electronics) where the top retailers hold a significant share of the overall market, the top three retailers in the home décor and furnishings category make up less than 25% of the market share. We believe we are uniquely positioned in the market, focused on providing the broadest assortment of home décor products at value price points. In addition, the size of our stores enables us to carry a broad offering of fully assembled, larger merchandise, unlike many of our competitors, who are space constrained from providing a similar offering. We believe our focus on a broad assortment at value price points also uniquely positions us for those times when the industry is growing below trend, as it allows us to gain share in a fragmented market while also supporting our customer’s passion about, and love for, decorating her home.
The home furnishings and décor market includes a diverse set of categories and retail formats. However, we believe that we do not have a direct competitor, as no retailer matches our size, scale or scope of the product assortment that we offer at everyday low prices. While we have no direct competitor, certain products that we offer do compete with offerings by companies in the following segments:
|
· |
Specialty Home Décor / Organization and Furniture retailers (e.g., Bed Bath & Beyond, The Container Store, Ethan Allen, Havertys, Home Goods, Pier 1 Imports and Williams‑Sonoma) have stores that are typically smaller (approximately 10,000 to 30,000 square feet) and we believe their home décor product offering is much narrower than ours and often is priced at a substantial premium. |
|
· |
Mass / Club retailers (e.g., Costco, Target and Wal‑Mart Stores) only dedicate a small portion of their selling spaces to home décor products and focus on the most popular SKUs. |
|
· |
Arts / Craft / Hobby retailers (e.g., Hobby Lobby, Jo‑Ann Stores and Michaels Stores) target customers who prefer to create the product themselves, whereas our customer prefers finished products. |
|
· |
Discount retailers (e.g., Big Lots, Burlington and Tuesday Morning) have a home décor product offering that is typically limited, offered at deep discounts and often dependent on their ability to purchase close‑out or liquidated merchandise from manufacturers. |
4
|
· |
Home Improvement retailers (e.g., Home Depot and Lowe’s) have a product offering that is primarily focused on home improvement and repair items, although we do compete with them in seasonal and outdoor products. |
|
· |
Online Home Décor retailers (e.g., Wayfair) offer a broad selection of products in home furnishings and décor that is typically weighted toward more expensive items (typically $200 to $300 per transaction) that can justify the high shipping, returns and damage costs and overall economics of their model. Conversely, we focus primarily on the attractive decorative accents and accessories portion of the market, generating an average basket of approximately $65, where we can employ our efficient operating model to generate attractive economics. For similar products, we believe we are able to offer comparable breadth of assortment to online retailers. |
Our Merchandise
We have the largest assortment of home décor products among all big box retailers. With eight main design archetypes, from traditional to country and from vintage to modern, we cover the full spectrum of home décor styles and we believe we have something for everyone. Over the past four years, we have evolved our merchandising strategy to increase our product offering of “better” and “best” level products, resulting in an increase in average basket size. We are advantageously situated as a value player in the home décor market, with an average price point of less than $15 and typical customer spend of approximately $65 per visit.
Our merchant organization is focused on finding or creating products that meet our customers’ aesthetic requirements at attractive price points. A core goal of our buyers is to ensure we deliver our targeted selling margins across our entire product portfolio and, as a result, we enjoy strong gross margins that are consistent across our product offering.
Our product design process begins with inspiration. We seek to capitalize on existing trends and home décor fashions across various price points and make them accessible rather than drive new trends. We monitor emerging trends through a wide range of home décor industry sources including competitors, media sources, vendors, trade shows, various online outlets and user generated content (e.g., Pinterest and Houzz) to stay current with consumer preferences. We then identify new product opportunities or any gaps in our offering and work closely with our vendors to design products to meet her needs at accessible price points. Our merchandising team also closely monitors our sales trends and new product launches to ensure our store offering remains fresh and relevant.
We employ an everyday low pricing strategy that offers our customers the best possible pricing without the need for periodic discounts or promotions. When customers view our prices, they can be confident in the value they receive and do not need to wait for sales or coupons to make purchasing decisions. We believe this results in consistent traffic to our stores. Over 80% of our net sales occur at full price, with the balance attributable to selective markdowns used to clear slow-moving inventory or post‑dated seasonal product. For the limited set of products that are directly comparable to products offered by other retailers, we seek to offer prices significantly below our specialty competitors and at or below our mass retail competitors. We allow for merchandise to be returned within 60 days from the purchase date.
Our merchant team consists of approximately 65 people and includes a Chief Merchandising Officer, divisional merchandising managers, buyers, assistant buyers and an inventory planning and allocation team. Our inventory planners work with our buyers to ensure that the appropriate level of inventory for each product is stocked across our store base. We purchase our inventory through a central system that buys for the entire chain versus individual stores. We believe this strategy allows us to take advantage of volume discounts and improves controls over inventory and product mix to ensure that we are disciplined about the level of inventory we carry.
5
Product Mix
Our broad and deep offering includes the following products:
|
Accent furniture |
Frames |
Pottery |
|
Bar stools |
Garden decor |
Rugs and mats |
|
Bedding & bath products |
Halloween decorations |
Sculptures |
|
Beds and mattresses |
Harvest decorations |
Silk flowers |
|
Candles |
Home organization |
Sofas |
|
Chairs |
Kitchenware |
Stands |
|
Christmas decorations |
Lamps |
Storage |
|
Consumables |
Mirrors |
Tables |
|
Easter decorations |
Patio |
Vases |
|
Floor plants and trees |
Pet items |
Wall art |
|
Food preparation items |
Pillows and cushions |
Window treatments |
Home furnishings, which generally consists of accent furniture, furniture, mirrors, patio cushions, rugs and wall art, comprised approximately 48%, 48% and 47% of total net sales for fiscal years 2017, 2016 and 2015, respectively. In addition, accent décor, which generally consists of artificial flowers and trees, bedding, candles, garden and outdoor décor, holiday accessories, home organization, pillows, pottery, vases and window treatments, comprised approximately 49%, 49% and 49% of total net sales for fiscal years 2017, 2016 and 2015, respectively. Our superstore format and unique approach to merchandising result in our ability to offer multiple styles, colors and design elements most other retailers are unable to carry.
Sourcing
We believe our sourcing model provides us with significant flexibility to control our product costs. We work very closely with over 500 vendors to value engineer products at price points that deliver excellent value to our customers. In fiscal year 2017, approximately 40% of our merchandise was purchased from domestic vendors and 60% was purchased from foreign vendors in countries such as China, Hong Kong, Belgium and Taiwan. Lead times vary depending on the product, ranging from one week to nine months. We plan to establish an overseas sourcing office in the future. An overseas office would allow us to continue to increase our direct purchases from overseas factories in Asia, rather than purchasing through domestic agents or trading companies. We believe this represents an opportunity to increase our access to unique and quality products.
We seek to build long‑term relationships with our vendor partners, who can provide support for our various marketing and in‑store merchandising initiatives. However, we believe we are not dependent on any one vendor and have no long‑term purchase commitments or arrangements. For many of our vendors, we are their fastest growing and, sometimes, largest account, which promotes collaboration between our companies. In fiscal year 2017, our top ten vendors accounted for approximately 20% of total purchases, with our largest vendor representing less than 5%. We believe our vendor partner relationships will continue to support our business growth.
Our Stores
We currently operate 127 stores in 31 states across the United States. A summary of our store locations by state as of January 28, 2017 is included in “Item 2. Properties”.
Store Layout
Our stores vary in size between 80,000 and 165,000 square feet with an average of approximately 115,000 square feet. Our locations have a similar store layout that is specifically designed to engage our customers. We design our stores as shoppable warehouses with wide aisles, an interior race track and clear signage that enable customers to easily navigate the store. We also have store maps available at the entrances for our customer to use while she shops.
6
Throughout our stores, we merchandise products logically by color, design and size in order to appeal to our core shopper’s buying preferences and use feature tables and end caps to create continuous visual interest and to highlight value. Additionally, we utilize product vignettes that offer design inspiration and coordinated product ideas to our customers. Our large store format allows us to maintain high in‑stock positions and sell larger‑sized and fully assembled products. To make her shopping experience easier and support our efficient operating model, we install fixture shelves lower to the ground so that products are easily reachable and require minimal staff assistance. We also utilize special fixtures for our products such as wall art, mirrors and rugs to allow easy viewing, improved shopability and minimized product damage. We have a centralized checkout lane with multiple registers that makes the checkout process simple and efficient.
To enhance our customer's self-help shopping experience in connection with our larger-sized products, we offer her the opportunity to engage Select Express, a third-party delivery service, to provide home delivery. Through this service, she is able to interface directly with the provider to schedule a convenient delivery time. Deliveries typically occur within 48 hours, but next-day service is also available. Select Express has experience nationwide with many major retailers. Nonetheless, deliveries from our stores follow completion of the sales transaction with our customer, thus minimizing any exposure we might have in connection with the delivery.
Store Operations
We centralize major decisions relating to merchandising, inventory and pricing in order to allow our in‑store team to focus on creating a clean and organized shopping environment. Our stores are typically led by a store director, a store manager and have a general staff averaging 25 employees. Store employees are broadly split into two functional groups, customer service and operations, thereby allowing us to maximize efficiencies while aligning employees to the function that best suits their skills. Our proprietary labor model optimizes staffing levels based on hourly sales and traffic volumes. Additionally, employees utilize downtime to stock shelves and displays with new inventory. This model provides us with the flexibility to meet various seasonal demands while enabling consistent labor margins throughout the year. Overall store supervision is managed by our Director of Store Operations, two regional managers and twelve district managers.
Our employees are a critical component of our success and we are focused on attracting, retaining and promoting the best talent in our stores. We recognize and reward team members who meet our high performance standards. All employees are eligible to participate in our bonus incentive program and store directors are able to participate in an unlimited bonus incentive program based primarily on exceeding store level sales targets. We also recognize individual performance through internal promotions and provide opportunities for advancement throughout our organization. We provide training for all new hires and ongoing training for existing employees.
Our stores are typically open seven days a week across the chain with regular hours of 9 a.m. to 10 p.m. Monday through Saturday and 9 a.m. to 9 p.m. on Sunday.
7
Real Estate Strategy
Expansion Opportunities
Our retail concept has been successful across a number of geographic markets spanning populations of 150,000 to over five million people. Our stores that have been open for more than twelve months as of January 28, 2017 perform consistently across small, mid‑level and large markets and generate average net sales of approximately $6.0 million to $7.0 million across these markets. Over the past five fiscal years, we have successfully opened 77 new stores in a mix of existing and new markets. Our recent store growth is summarized in the following table:
|
|
|
Fiscal Year Ended |
||||||||
|
|
|
January 26, 2013 |
|
January 25, 2014 |
|
January 31, 2015 |
|
January 30, 2016 |
|
January 28, 2017 |
|
Beginning of period |
|
51 |
|
58 |
|
68 |
|
81 |
|
100 |
|
Openings |
|
7 |
|
10 |
|
16 |
|
20 |
|
24 |
|
Relocations |
|
— |
|
— |
|
(2) |
|
— |
|
(1) |
|
Closures |
|
— |
|
— |
|
(1) |
|
(1) |
|
— |
|
Total stores at end of period |
|
58 |
|
68 |
|
81 |
|
100 |
|
123 |
We believe we have the whitespace to open at least 25 new stores per year for the foreseeable future. During fiscal year 2017, we opened 23 new stores, net of one relocated store. During fiscal year 2018, we plan to open 25 net new stores. Based on our internal analysis and research conducted for us by Buxton, we believe that we have the potential to expand to at least 600 stores in the United States over the long term, or approximately five times our footprint of 123 stores as of January 28, 2017. The rate of future growth in any particular period is inherently uncertain and is subject to numerous factors that are outside of our control. As a result, we do not currently have an anticipated timeframe to reach this potential. In addition, due in part to our investments, our systems, processes and controls should be able to support up to approximately 220 stores with limited incremental investment. We expect to continue to be disciplined in our approach to opening new stores, focusing on expanding our presence in existing markets while entering adjacent geographies. We also plan to act on compelling opportunities we identify in new markets.
Our store growth is supported by new store economics that we believe are compelling. Our new stores generate an average of $6 million of net sales within the first full year of operations and reach maturity within the first six months. The average investment varies by the type of site and whether the store is leased, purchased or built from the ground up. Each store requires net investment on average of approximately $3 million. Based on our model and historical results, we expect our new stores to pay back the initial investment within two years.
Site Selection and Availability
We have developed a highly analytical approach to real estate site selection with a stringent new store approval process. Our dedicated real estate team spends considerable time evaluating prospective sites before submitting a comprehensive approval package to our real estate committee, comprised of our Chief Executive Officer, Chief Financial Officer and Chief Development Officer. We target markets that meet our specific demographic and site evaluation criteria and complete substantial research before opening a new site. We use a proprietary model which takes into account several demand factors including population density of our target customer, median household income, home ownership rates, retail adjacencies, competitor presence and local economic growth metrics. Primary site evaluation criteria include availability of attractive lease terms, sufficient box size, co‑tenancy, convenient parking, traffic patterns, visibility and access from major roadways. We typically favor locations near other big box retailers that drive strong customer traffic to the area.
We believe there will continue to be an ample supply of large format real estate in the United States that is attractive to us, driven by multi‑chain, national retailers relocating or closing stores, a number of retailers shifting to smaller locations and the relative lack of new retail concepts using larger store formats. We believe we are one of the only growing, large format retailers in the country. As a result, we have become a direct beneficiary of this available real estate and of various retailers looking to quickly shed stores. We typically offer a convenient solution to any selling or leasing party as we are able to take a wide variety of boxes, move quickly and require little investment in time, resources or capital on their part. We take a disciplined approach to how we enter and build out our presence in markets and seek to optimize sales in a deliberate, carefully planned manner. In order to act quickly on new opportunities, we have scored
8
over 20,000 big box retail locations in the United States with a proprietary site selection model. As a result of our proven track record, we have developed strong relationships with brokers, landlords and big box retailers and are often the first to receive a call when locations become available.
Site Development and Financing
We have a flexible and balanced approach to site development that allows us to optimize the investment characteristics of each new store and maintain our robust new store pipeline. We can lease a second generation property, purchase a second generation building or build a new location from the ground up.
For purchased properties or new development builds, we can extract capital using sale‑leasebacks through a proven and disciplined approach. We have relationships with a number of the major publicly traded REITs, many of which have demonstrated interest in our portfolio of assets. We have completed six sale‑leaseback transactions generating approximately $188 million in proceeds in the past four years at a capitalization rate between 6.46% and 6.99%.
We have developed an efficient process from site selection through new store opening. Our three-pronged approach to site development allows us to negotiate very favorable real estate terms that typically include low occupancy costs, the ability to unilaterally “opt out” of leased locations, and other features that provide us with flexibility to manage our store portfolio.
Marketing
Our marketing and advertising strategies seek to effectively and efficiently communicate our compelling value proposition to an increasing base of home décor enthusiasts. Our goal is to develop a continuous dialogue with our core customers, while attracting new customers by building a distinctive connection to the At Home brand. We reinvigorated our marketing efforts, increasing spend from nearly zero in fiscal year 2013 to 2.0% of net sales in each of fiscal years 2015 and 2016 and 2.6% of net sales in fiscal year 2017.
The home décor enthusiast views her home as a place that is constantly evolving with each season as well as everyday events in her life. We connect with her on an ongoing basis by inspiring her with all of the ways she can refresh her home with our wide range of décor styles for any room, in any style, for any budget. We engage with her across various marketing channels before, during and after her store visit. We have increased our focus in social media building relationships with home décor influencers as well as facilitating the sharing of home décor ideas through user-generated content strategies leveraging Pinterest, Facebook, Instagram, Twitter and various blogs. We use weekly email marketing to inspire her with seasonally relevant décor, and will be growing the reach of these efforts as we focus on significantly building our customer database (currently over 2.3 million) through in-store email capture. We have entered into an agreement with Synchrony Bank to provide for a co-branded and private label consumer credit card program that includes loyalty incentives for our customers. This program is expected to launch during fiscal year 2018 and will allow At Home cardholders to take advantage of promotional financing offers on qualifying purchases, exclusive discounts, loyalty rewards and other benefits, including mobile account servicing.
We also use traditional media platforms (outdoor, radio and online advertising) to build broader brand awareness in markets where we can achieve the highest impact. To launch our brand during new store openings, we have evolved our strategy through tactical testing to get to an effective and cost efficient mix of direct mail, radio, outdoor, social, digital, public relations and events. Additionally, we leverage this same media mix in select markets to drive traffic during the key summer season with our outdoor product offering and during the important holiday season with our broad holiday décor assortments.
Through our customer research, we have learned that many home décor enthusiasts browse online for ideas, inspiration and general product information before visiting specific stores. In fiscal year 2017, we upgraded our website to enable our customers to view our product assortment online with a robust search functionality and mobile friendly website focused on an inspirational shopping experience that showcases decorating ideas with our broad product assortment to drive traffic into our stores. We are exploring opportunities to provide various levels of e-commerce capabilities but will focus on strategies that maintain our industry-leading profitability.
9
We believe that effective marketing will continue to grow our awareness which will drive brand excitement, increase our customer engagement leading to increased store visits and sales.
Distribution
We operate a 592,000 square foot distribution center in Plano, Texas, which also serves as our corporate headquarters. We also have an additional approximately 420,000 square feet of warehouse premises in Garland, Texas, for initial inventory build‑up for new store openings. We upgraded the distribution center over the past four years and it should be able to support up to approximately 220 stores. We have also invested over $9 million in automating our facility, implementing warehouse management software and robotics to efficiently handle daily product deliveries. This automation will continue to support our needs as we expand our store base.
The vast majority of our products are shipped directly to our distribution center, which serves as a cross‑dock facility, storing very limited inventory on site. In order to streamline store operations and reduce labor requirements, all of the merchandise in our distribution center is prepared for the sales floor prior to transport. Vendors pre‑ticket items with the appropriate price tags. Products are sorted onto pallets by zone such that they can be easily loaded onto trucks and then unloaded and placed directly in the sales zone with minimal back room storage. We arrange shipments in trucks in the most logical manner to expedite unloading and delivery. This approach to distribution supports our efficient store operating model.
Real‑time product replenishment in stores ensures that our customers have the broadest selection available and that we do not carry extra inventory. We generally ship merchandise to our stores between one and five times a week, depending on the season and the volume of a specific store, utilizing contract carriers for all shipments.
Information Systems
We believe that our management information systems will support our growth and enhance our competitive position. Our efficient operating model is supported by using industry standard applications in the areas of merchandising, store systems, replenishment, distribution and financial systems. We use a combination of these industry standard systems along with automated and easy to use proprietary systems to support all areas of our business. Over the past four years, we have invested in IT systems and infrastructure, including investments in merchandising, planning and allocation (JDA), POS systems (IBM/Toshiba), distribution center (PKMS) and finance and accounting (SAP) to ensure our systems are robust and scalable. Additionally, over the past four years we have invested in additional IT team members to provide appropriate support and project delivery capabilities needed for the growth of the Company.
Employees
As of January 28, 2017, we employed approximately 3,172 employees, including 2,913 store employees and 259 other employees across the corporate and distribution center functions. Of the 2,913 store employees, 364 were full‑time salaried level staff and the remaining employees consisted of a mix of full‑time and part‑time hourly workers. All of our full‑time employees earn a minimum wage of $10.00 per hour and all of our part‑time employees earn a minimum wage of $9.00 per hour. Based on the level of transactions experienced at different times of the day, week and year, store labor is planned to serve customers effectively during peak periods while minimizing overall labor costs. None of our employees are currently covered under any collective bargaining agreements.
Intellectual Property
We own a U.S. trademark registration for the trademark “at home” and design, which was registered by the United States Patent & Trademark Office on July 7, 2015 for a ten‑year term and is renewable every ten years thereafter. We also own the domain name athome.com and a number of other registered trademarks, pending trademark applications and domain names that we use in our business. Collectively, we consider our trademarks and domain names to be important assets of our operations and seek to actively monitor and protect our interest in this property.
10
Government Regulation
We are subject to labor and employment laws, laws governing truth‑in‑advertising, privacy laws, environmental laws, safety regulations and other laws, including consumer protection regulations that regulate retailers and govern the promotion and sale of merchandise and the operation of stores and warehouse facilities. We monitor changes in these laws and believe that we are in material compliance with applicable laws.
Available Information
We are subject to the informational requirements of the Securities Exchange Act of 1934, as amended (the “Exchange Act”), and in accordance therewith, we file reports, proxy and information statements and other information with the SEC. Our Annual Report on Form 10-K, Quarterly Reports on Form 10-Q, Current Reports on Form 8-K, and any amendments to these reports filed or furnished pursuant to Section 13(a) or 15(d) of the Exchange Act are available through the investor relations section of our website at investor.athome.com. Reports are available free of charge as soon as reasonably practicable after we electronically file them with, or furnish them to, the SEC. The information contained on our website is not incorporated by reference into this Annual Report on Form 10-K.
In addition to our website, you may read and copy public reports we file with or furnish to the SEC at the SEC’s Public Reference Room at 100 F Street, NE, Washington, DC 20549. You may obtain information on the operation of the Public Reference Room by calling the SEC at 1-800-SEC-0330. The SEC maintains an Internet site that contains our reports, proxy and information statements, and other information that we file electronically with the SEC at www.sec.gov.
The following risk factors may be important to understanding any statement in this Annual Report on Form 10-K or elsewhere. Our business, financial condition and operating results can be affected by a number of factors, whether currently known or unknown, including but not limited to those described below. Any one or more of such factors could directly or indirectly cause our actual results of operations and financial condition to vary materially from past or anticipated future results of operations and financial condition. Any of these factors, in whole or in part, could materially and adversely affect our business, financial condition, results of operations and stock price.
Risks Relating to Our Business
General economic factors may materially adversely affect our business, revenue and profitability.
General conditions in the United States and global economy that are beyond our control may materially adversely affect our business and financial performance. As a retailer that is dependent upon consumer discretionary spending for home décor products, our customers may allocate less money for discretionary purchases as a result of increased levels of unemployment, reduced consumer disposable income, higher interest rates, higher fuel and other energy costs, higher tax rates and other changes in tax laws, foreclosures, bankruptcies, falling home prices, reduced availability of consumer credit, higher consumer debt levels, a decline in consumer confidence, inflation, deflation, recession, an overall economic slowdown and other factors that influence consumer spending. Any reduced demand for the merchandise that we sell could result in a significant decline in customer traffic and sales and decreased inventory turnover. Therefore, if economic conditions worsen, there may be a material adverse impact on our business, revenue and profitability.
In addition, our costs and expenses could be materially adversely impacted by general economic factors such as higher interest rates, higher fuel and other energy costs, higher transportation costs, higher commodity costs, higher costs of labor, insurance and healthcare, increased rental expense, inflation in other costs, higher tax rates and other changes in the tax law and changes in other laws and regulations. The economic factors that affect our operations also affect the operations and economic viability of our suppliers from whom we purchase goods, a factor that can result in an increase in the cost to us of merchandise we sell to our customers.
11
Volatility or disruption in the financial markets could materially adversely affect our business and the trading price of our common stock.
We rely on stable and efficient financial markets. Any disruption in the credit and capital markets could adversely impact our ability to obtain financing on acceptable terms. Volatility in the financial markets could also result in difficulties for financial institutions and other parties that we do business with, which could potentially affect our ability to access financing under our existing arrangements. We are exposed to the impact of any global or domestic economic disruption, including any potential impact of the recent vote by the United Kingdom to exit the European Union, commonly referred to as “Brexit”. Although we generally generate funds from our operations and our existing credit facilities to pay our operating expenses and fund our capital expenditures, our ability to continue to meet these cash requirements over the long term may require access to additional sources of funds, including equity and debt capital markets, and market volatility and general economic conditions may adversely affect our ability to access capital markets. In addition, the inability of our vendors to access capital and liquidity with which to maintain their inventory, production levels and product quality and to operate their businesses, or the insolvency of our vendors, could lead to their failure to deliver merchandise. If we are unable to purchase products when needed, our sales could be materially adversely impacted. Accordingly, volatility or disruption in the financial markets could impair our ability to execute our growth strategy and could have a material adverse effect on the trading price of our common stock.
Consumer spending on home décor products could decrease or be displaced by spending on other activities as driven by a number of factors.
Consumer spending on home décor products could decrease or be displaced by spending on other activities as driven by a number of factors including:
|
· |
shifts in behavior away from home decorating in favor of other products or activities, such as fashion, media or electronics; |
|
· |
general economic conditions and other factors that affect consumer discretionary spending; |
|
· |
natural disasters, including hurricanes, tornadoes, floods, droughts, heavy snow, ice or rain storms, which disrupt the ability of consumers to continue spending on home décor products; |
|
· |
man‑made disasters, such as terrorism or war, as well as other national and international security concerns; and |
|
· |
other matters that influence consumer confidence and spending. |
Total consumer spending may not continue to increase at historical rates due to slowed population growth and shifts in population demographics, and it may not increase in certain product markets given changes in consumer interests. Further, as we expand into new markets, we may not accurately predict consumer preferences in that market, which could result in lower than expected sales. If consumer spending on home décor products decline, our results of operations could be materially adversely affected.
We may not be able to successfully implement our growth strategy on a timely basis or at all, which could harm our growth and results of operations.
Our growth is dependent on our ability to open profitable new stores. Our ability to increase the number of our stores will depend in part on the availability of existing big box retail stores or store sites that meet our specifications. We may face competition from other retailers for suitable locations and we may also face difficulties in negotiating leases on acceptable terms. In addition, a lack of available financing on terms acceptable to real estate developers or a tightening credit market may adversely affect the retail sites available to us. Rising real estate costs and acquisition, construction and development costs and available lease financing could also inhibit our ability to open or acquire new stores.
12
Opening or acquiring stores involves certain risks, including constructing, furnishing, supplying and staffing a store in a timely and cost‑effective manner and accurately assessing the demographic or retail environment for a particular location, as well as addressing any environmental issues related to such locations. We cannot predict whether new stores will be successful. Our future sales at new stores may not meet our expectations, which could adversely impact our return on investment. For example, the costs of opening and operating new stores may offset the increased sales generated by the additional stores. Therefore, there can be no assurance that our new stores will generate sales levels necessary to achieve store‑level profitability or profitability comparable to that of existing stores. New stores also may face greater competition and have lower anticipated sales volumes relative to previously opened stores during their comparable years of operation. In addition, a significant portion of our management’s time and energy may be consumed with issues related to store expansion and we may be unable to hire a sufficient number of qualified store personnel or successfully integrate the new stores into our business. Furthermore, our vendors may be unable to meet the increased demand of additional stores in a timely manner. We cannot guarantee that we will be able to obtain and distribute adequate merchandise to new stores or maintain adequate warehousing and distribution capability at acceptable costs.
In addition, our expansion in existing and new markets may present competitive, distribution, merchandising and regulatory challenges that differ from our current challenges, including competition among our stores, diminished novelty of our store design and concept, added strain on our distribution center, additional information to be processed by our information technology systems and diversion of management attention from operations. New stores in new markets, where we are less familiar with the population and are less well‑known, may face different or additional risks and increased costs compared to stores operating in existing markets or new stores in existing markets. For example, we may need to increase marketing and advertising expenditures in new or smaller markets in which we have less store density. Additionally, we may not accurately predict consumer preferences in new markets, which could result in lower than expected sales. Expansion into new markets could also bring us into direct competition with retailers with whom we have no past experience as direct competitors. To the extent that we are not able to meet these new challenges, our sales could decrease and our operating costs could increase. Furthermore, our margins may be impacted in periods in which incremental expenses are incurred as a result of new store openings. Additionally, although our distribution center currently should be able to support a store base of up to approximately 220 stores, any unanticipated failure of or inability to support our growing store base could have a material adverse effect on our business. Therefore, there can be no assurance that we will be successful in opening, acquiring or operating any new stores on a profitable basis.
Accordingly, we cannot assure you that we will achieve our planned growth or, even if we are able to grow our store base as planned, that any new stores will perform as planned. If we fail to successfully implement our growth strategy, we will not be able to sustain the growth in sales and profits that we expect, which would likely have an adverse impact on the price of our common stock.
Failure to manage our inventory effectively and inability to satisfy changing consumer demands and preferences could materially adversely impact our operations.
Due to the nature of our business, we make decisions regarding merchandise several months in advance of each of the seasons in which such merchandise will be sold, particularly with respect to our merchandise that is manufactured, purchased and imported from countries around the world. We must maintain sufficient inventory levels to operate our business successfully. However, if we misjudge consumer preferences or demands, we could have excess inventory that may need to be held for a long period of time, written down or discarded in order to clear excess inventory, especially seasonal and holiday merchandise. Conversely, if we underestimate consumer demand, we may not be able to provide certain products in a timely manner to our customers in order to meet their demand, which can result in lost sales. Either event could have a material adverse impact on our business, financial condition and results of operations. In addition, we recently upgraded to a new inventory planning and allocation system. If the new inventory planning and allocation system is unsuccessful, our ability to properly allocate inventory to stores could be adversely affected.
There can be no assurance that we will be able to continue to offer assortments of products that appeal to our customers or that we will satisfy changing consumer demands and preferences in the future. Accordingly, our business, financial condition and results of operations could be materially adversely affected if:
|
· |
we miscalculate either the market for the merchandise in our stores or our customers’ purchasing habits; |
13
|
· |
consumer demand unexpectedly shifts away from the merchandise we offer or if there are unanticipated shifts in consumer preferences in some seasons; or |
|
· |
we are unable to anticipate, identify and respond to changing consumer demands or emerging trends, including shifts in the popularity of certain products or increased consumer demand for more enhanced customer service and assistance, home delivery or online sales and services. |
In addition, inventory shrinkage (inventory theft, loss or damage) rates could negatively impact our financial results. Furthermore, failure to control merchandise returns could also adversely affect our business. We have established a provision for estimated merchandise returns based upon historical experience and other known factors. However, if actual returns are greater than those projected by management, additional reductions of revenue could be recorded in the future. In addition, to the extent that returned merchandise is damaged or otherwise not appealing to our customers, we may not receive full retail value from the resale or liquidation of the returned merchandise.
Our business model currently relies on purchasing all inventory centrally through our home office in Plano, Texas. At this office, all product samples are developed and/or received and reviewed; in addition, all purchase orders are placed, fulfilled and allocated from the same location. Major catastrophic events such as natural disasters, localized labor issues or wages increases, fire or flooding, malfunction or disruption of the information systems, a disruption in communication services, power outages or shipping interruptions could delay or otherwise adversely affect inventory purchasing or allocation, as well as the ultimate distribution of inventory to our stores and customers. Such disruptions could have a negative impact on our sales and results of operations. Our business model of central purchasing could also fail to account for differences in consumer preferences by market. In such cases, and where our focus of providing the broadest assortment of products for any room similarly did not account for differences in consumer preferences by market, our sales and results of operations could be adversely affected.
The loss of, or disruption in, or our inability to efficiently operate our distribution network could have a materially adverse impact on our business.
We operate a single cross‑dock distribution center in Plano, Texas, which services all of our stores, as well as warehouse premises in Garland, Texas. The majority of our inventory is shipped directly from suppliers to our distribution center where the inventory is processed and then shipped to our stores. Only mattresses and some food items are shipped directly to stores. We rely in large part on the orderly operation of this receiving and distribution process, which depends on our automated distribution system, adherence to shipping schedules and effective management of our distribution network. If complications arise with our distribution facility or if the facility or warehouse premises (or a significant portion of inventory located there) is severely damaged or destroyed, our ability to receive and deliver inventory on a timely basis will be significantly impaired. There can be no assurance that disruptions in operations due to natural or man‑made disasters, fire, flooding, terrorism or other catastrophic events, system failure, labor disagreements or shipping problems will not result in delays in the delivery of merchandise to our stores. Such delays could materially adversely impact our business. In addition, we could incur significantly higher costs and longer lead times associated with distributing merchandise to our stores during the time it takes for us to reopen or replace our distribution center. Moreover, our business interruption insurance may not be adequate to cover or compensate us for any losses that may occur. In addition, our distribution center should have the capacity to support up to approximately 220 stores. To the extent that we grow to larger than 220 stores, we will need to expand our current distribution center and/or add new distribution capabilities.
We rely upon various means of transportation through third parties, including shipments by air, sea, rail and truck, to deliver products to our distribution center from vendors and from our distribution center to our stores, as well as for direct shipments from vendors to stores. Labor shortages or capacity constraints in the transportation industry, disruptions to the national and international transportation infrastructure, fuel shortages or transportation cost increases (such as increases in fuel costs or port fees) could materially adversely affect our business and operating results, particularly as we receive and deliver our seasonal and holiday merchandise.
14
We are subject to a number of risks because we import a significant portion of our merchandise.
Approximately 60% of our merchandise was purchased from vendors in foreign countries such as China, Hong Kong, Belgium and Taiwan during fiscal year 2017. In addition, many of our domestic vendors purchase a portion of their products from foreign sources. For example, we purchase merchandise from domestic vendors that is imported from China or that is manufactured in China and assembled in the United States. Currently, we do not employ any resources on the ground in Asia to manage our procurement process and various vendor relationships. Instead, we often rely on trading companies to handle sourcing and logistics with Asian factories.
Foreign sourcing subjects us to a number of risks generally associated with doing business abroad such as the following:
|
· |
long lead times; |
|
· |
work stoppages and strikes; |
|
· |
delays in shipment, shipping port and ocean carrier constraints; |
|
· |
freight cost increases; |
|
· |
product quality issues; |
|
· |
raw material shortages and factory consolidations; |
|
· |
employee rights issues and other social concerns; |
|
· |
epidemics and natural disasters; |
|
· |
political instability, international conflicts, war, threats of war, terrorist acts or threats, especially threats to foreign and U.S. ports and piracy; |
|
· |
economic conditions, including inflation; |
|
· |
the imposition of tariffs, duties, quotas, taxes, import and export controls and other trade restrictions; |
|
· |
governmental policies and regulations; and |
|
· |
the status of trade relations with foreign countries, including the loss of “most favored nation” status with the United States for a particular foreign country. |
Adverse events could have a greater impact on us than if our operations were in more dispersed geographical regions.
We currently operate 127 stores in 31 states, primarily in the South Central, Southeastern and Midwestern regions of the United States, including 25 stores in Texas. In addition, we operate a single distribution center and warehouse premises in Texas, which service all of our stores. Accordingly, the effect on us of adverse events in these regions, especially in Texas, such as weather (including hurricanes, tornadoes, floods, droughts, heavy snow, ice or rain storms), natural or man‑made disasters, catastrophic events, terrorism, blackouts, widespread illness or unfavorable regional economic conditions, may be greater than if our operations or inventory were more geographically dispersed throughout the country or abroad. Such events could result in physical damage to or destruction or disruption of one or more of our properties, physical damage to or destruction of our inventory, the closure of one or more stores, the lack of an adequate workforce in parts or all of our operations, supply chain disruptions, data and communications disruptions and the inability of our customers to shop in our stores.
15
In addition, increases in our selling, general and administrative expenses due to overhead costs could affect our profitability more negatively than if we had a larger store base. One or more unsuccessful new stores, or a decline in sales or profitability at an existing store, will have a more significant effect on our results of operations than if we had a larger store base.
Because of our international operations, we could be adversely affected by violations of the U.S. Foreign Corrupt Practices Act and similar worldwide anti‑bribery and anti‑kickback laws.
We source over half of our products abroad. The U.S. Foreign Corrupt Practices Act and other similar laws and regulations generally prohibit companies and their intermediaries from making improper payments to non‑U.S. officials for the purpose of obtaining or retaining business. While our policies mandate compliance with these anti‑bribery laws, we cannot assure you that we will be successful in preventing our employees or other agents from taking actions in violation of these laws or regulations. Such violations, or allegations of such violations, could disrupt our business and result in a material adverse effect on our financial condition, results of operations and cash flows.
Our rebranding may not be successful.
During fiscal year 2015, we launched a significant rebranding initiative through which we spent over $20 million in capital and expenses to change our brand and corporate name and convert and refresh all of our stores. There is no assurance that our rebranding initiative will be successful or result in a positive return on investment. In addition, we have a limited operating history under the At Home brand. We believe that maintaining and enhancing our brand is integral to our business and to the implementation of our strategies for expanding our business. Therefore, we could be required to devote significant additional resources to advertising and marketing, which could have an adverse impact on our operations.
We are subject to risks associated with leasing substantial amounts of space.
We lease certain of our retail properties, our distribution center and our corporate office. The profitability of our business is dependent on operating our current store base with favorable margins, opening and operating new stores at a reasonable profit, renewing leases for stores in desirable locations and, if necessary, identifying and closing underperforming stores. We lease a significant number of our store locations, ranging from short‑term to long‑term leases. Typically, a large portion of a store’s operating expense is the cost associated with leasing the location.
The operating leases for our retail properties, distribution center and corporate office expire at various dates through 2036. A number of the leases have renewal options for various periods of time at our discretion. We are typically responsible for taxes, utilities, insurance, repairs and maintenance for these retail properties. Rent expense for the fiscal years ended January 31, 2015, January 30, 2016 and January 28, 2017 totaled approximately $42.9 million, $52.3 million and $68.1 million, respectively. Our future minimum rental commitments for all operating leases in existence as of January 28, 2017 for fiscal year 2018 is approximately $70.8 million and total approximately $856.2 million for fiscal years 2019 through 2035. We expect that many of the new stores we open will also be leased to us under operating leases, which will further increase our operating lease expenditures and require significant capital expenditures. We depend on cash flows from operations to pay our lease expenses and to fulfill our other cash needs. If our business does not generate sufficient cash flow from operating activities, and sufficient funds are not otherwise available to us from borrowings under our Asset-Based Lending Credit Facility (“ABL Facility”), as described in Note 5 – Revolving Line of Credit, to our audited consolidated financial statements included in “Item 15. Exhibits and Financial Statement Schedules,” or other sources, we may not be able to service our lease expenses or fund our other liquidity and capital needs, which would materially affect our business.
Over time current store locations may not continue to be desirable because of changes in demographics within the surrounding area or a decline in shopping traffic, including traffic generated by other nearby stores. Although we have the right to terminate some of our leases under specified conditions by making certain payments (typically within two to three years after opening a store), we may not be able to terminate a particular lease if or when we would like to do so. If we decide to close stores, we are generally required to either continue to pay rent and operating expenses for the balance of the lease term or, for certain locations, pay exercise rights to terminate, which in either case could be expensive. Even if we are able to assign or sublease vacated locations where our lease cannot be terminated, we may remain liable on the lease obligations if the assignee or sublessee does not perform.
16
In addition, when leases for the stores in our ongoing operations expire, we may be unable to negotiate renewals, either on commercially acceptable terms, or at all, which could cause us to close stores in locations that may be desirable. We may be unable to relocate these stores cost‑effectively or at all and there can be no assurance that any relocated stores will be successful.
We are subject to risks associated with our sale‑leaseback strategy.
From time to time, we engage in sale‑leaseback transactions. The net proceeds from such transactions have been used to reduce outstanding debt and fund future capital expenditures for new store development. However, the sale‑leaseback market may cease to be a reliable source of additional cash flows for us in the future if capitalization rates become less attractive, other unfavorable market conditions develop or the perceived value of our owned property declines. For example, should the sale‑leaseback market require significantly higher yields (which may occur as interest rates rise), we may not enter into sale‑leaseback transactions, which could adversely affect our ability to reduce outstanding debt and fund capital expenditures for future store development.
We operate in a highly competitive retail environment.
The retail business is highly competitive. The marketplace for home décor products is highly fragmented as many different retailers compete for market share by using a variety of store formats and merchandising strategies, dedicating a portion of their selling space to a limited selection of home décor, seasonal and holiday merchandise. Although we are the only big box concept solely dedicated to the home décor space, for all of our major products we compete with a diverse group of retailers, including mass merchants (such as Target and Wal‑Mart), home improvement stores (such as Home Depot and Lowe’s), craft retailers (such as Hobby Lobby, Jo‑Ann Stores and Michaels Stores), home specialty/décor retailers (such as Bed Bath & Beyond, The Container Store, Home Goods and Pier 1 Imports), as well as various other small, independent retailers. In addition, to a lesser extent, we compete with Internet‑based retailers (such as Wayfair), which competition could intensify in the future.
We compete with these and other retailers for customers, retail locations, management and other personnel. Some of our competitors are larger and have greater resources, more customers and greater store brand recognition. They may secure better terms from vendors, adopt more aggressive pricing and devote more resources to technology, distribution and marketing. Competitive pressures or other factors could cause us to lose customers, sales and market share, which may require us to lower prices, increase marketing and advertising expenditures or increase the use of discounting or promotional campaigns, each of which could materially adversely affect our margins and could result in a decrease in our operating results and profitability. We cannot guarantee that we will continue to be able to compete successfully against existing or future competitors. Further, although we do not currently engage in e‑commerce, there is no assurance that we will not in the future, and the use of e‑commerce by our competitors could have a material adverse effect on our business. Expansion into markets served by our competitors, entry of new competitors, expansion of existing competitors into our markets or the adoption by competitors of innovative store formats and retail sale methods, including e‑commerce, could cause us to lose market share and could be detrimental to our business, financial condition and results of operations.
We face risks related to our substantial indebtedness.
As of January 28, 2017, we had total outstanding debt of $403.2 million. Our substantial leverage could adversely affect our ability to raise additional capital to fund our operations, limit our ability to react to changes in the economy or our industry, expose us to interest rate risk associated with our variable rate debt and prevent us from meeting our obligations under our ABL Facility and $300 million senior secured term loan (the “Term Loan”). Our substantial indebtedness could have important consequences to us, including:
|
· |
making it more difficult for us to satisfy our obligations with respect to our debt, and any failure to comply with the obligations under our debt instruments, including restrictive covenants, could result in an event of default under the agreements governing our indebtedness increasing our vulnerability to general economic and industry conditions; |
17
|
· |
requiring a substantial portion of our cash flow from operations to be dedicated to the payment of principal and interest on our debt, thereby reducing our ability to use our cash flow to fund our operations, capital expenditures, selling and marketing efforts, product development, future business opportunities and other purposes; |
|
· |
exposing us to the risk of increased interest rates as substantially all of our borrowings are at variable rates; |
|
· |
restricting us from making strategic acquisitions; |
|
· |
limiting our ability to obtain additional financing for working capital, capital expenditures, product development, debt service requirements, acquisitions, and general corporate or other purposes; and |
|
· |
limiting our ability to plan for, or adjust to, changing market conditions and placing us at a competitive disadvantage compared to our competitors who may be less highly leveraged. |
The occurrence of any one of these events could have an adverse effect on our business, financial condition, results of operations, and ability to satisfy our obligations under our indebtedness.
We and our subsidiaries may be able to incur substantial additional indebtedness in the future, subject to the restrictions contained in the credit agreements governing our ABL Facility and Term Loan.
The ABL Facility and Term Loan impose significant operating and financial restrictions on us and our subsidiaries that may prevent us from pursuing certain business opportunities and restrict our ability to operate our business.
The credit agreements governing our ABL Facility and Term Loan contain covenants that restrict our and our subsidiaries’ ability to take various actions, such as:
|
· |
incur or guarantee additional indebtedness or issue certain disqualified or preferred stock; |
|
· |
pay dividends or make other distributions on, or redeem or purchase, any equity interests or make other restricted payments; |
|
· |
make certain acquisitions or investments; |
|
· |
create or incur liens; |
|
· |
transfer or sell assets; |
|
· |
incur restrictions on the payments of dividends or other distributions from our restricted subsidiaries; |
|
· |
alter the business that we conduct; |
|
· |
enter into transactions with affiliates; and |
|
· |
consummate a merger or consolidation or sell, assign, transfer, lease or otherwise dispose of all or substantially all of our assets. |
The restrictions in the credit agreements governing our ABL Facility and Term Loan also limit our ability to plan for or react to market conditions, meet capital needs or otherwise restrict our activities or business plans and adversely affect our ability to finance our operations, enter into acquisitions or to engage in other business activities that could be in our interest.
18
In addition, our ability to borrow under the ABL Facility is limited by the amount of our borrowing base. Any negative impact on the elements of our borrowing base, such as accounts receivable and inventory, could reduce our borrowing capacity under the ABL Facility.
We are dependent upon the services of our senior management and our buyers.
We are dependent on the services, abilities and experiences of our senior management team. Any loss or interruption of the services of our senior management, or any general instability in the composition of our senior management team, could significantly reduce our ability to effectively manage our operations. Lee Bird, our Chief Executive Officer, joined us in December 2012 and, together with our senior management team, has played an instrumental role in developing and executing our business and operating strategies, which we believe are critical to our ability to maintain strong margins. Therefore, the loss of Mr. Bird’s services, or any members of our senior management, could have a material adverse impact on our business, operating results and profitability and there can be no assurance that we will be able to find appropriate replacements for our senior management as needed. In addition, certain members of our management team are relatively new to our business and have not worked as a team with other members of management for a significant period of time. Therefore, there can be no assurance that any new members of our management team will be able to successfully execute our business and operating strategies or continue to follow the same strategies.
In addition, a number of our buyers have been with us for many years and have developed a deep understanding of our business and our customers. The market for buyers is highly competitive and it may be difficult to find suitable replacements if we lose any of our buyers. If we are unable to find suitable replacements, we may experience difficulties in selecting and sourcing merchandise, which could materially adversely impact our business, revenue and profitability.
Failure to attract and retain quality employees could materially adversely affect our performance.
Our performance depends on attracting and retaining quality people at all levels, including corporate, stores, the distribution center and other areas. Many of our store employees are in entry level or part‑time positions with historically high rates of turnover. Our ability to meet our labor needs while controlling labor costs is subject to external factors such as unemployment levels, prevailing wage rates, minimum wage legislation, changing demographics, health and other insurance costs and governmental labor and employment requirements. In the event of changes in the federal or state minimum wage, living wage requirements or changes in other wage or workplace regulations, including, for example, health care or employee leave regulations, if our overall compensation and benefits fail to remain competitive, then the quality of our workforce could decline, while increasing our costs could impair our profitability. If we do not continue to attract and retain quality employees, our performance could be materially adversely affected.
Although none of our employees are currently covered under collective bargaining agreements, there can be no assurance that our employees will not elect to be represented by labor unions in the future. If some or all of our workforce were to become unionized and collective bargaining agreement terms were significantly different from our current compensation arrangements or work practices, it could have a material adverse effect on our business, financial condition and results of operations.
Difficulties with our vendors may adversely impact our business.
Our performance depends on our ability to purchase merchandise at sufficient levels and at competitive prices from vendors who can deliver products in a timely and efficient manner and in compliance with our vendor standards and all applicable laws and regulations. We currently have over 500 vendor relationships. Generally, we do not have any long‑term purchase agreements or other contractual assurances of continued supply, pricing or access to new products, and any vendor could discontinue selling to us at any time. Historically, we have not relied on any single vendor for our products and have not had difficulties replacing vendors for various products we sell. However, in the future there is no assurance that we will continue to be able to acquire desired merchandise in sufficient quantities or on terms acceptable to us, or be able to develop relationships with new vendors to replace any discontinued vendors. Our inability to acquire suitable merchandise in the future or our failure to replace any one or more vendors may have a material adverse effect on our business, results of operations and financial condition. In addition, any significant change in the payment terms that we have with our suppliers could adversely affect our liquidity.
19
Many of our suppliers are small firms that produce a limited number of items. These smaller vendors generally have limited resources, production capacities and operating histories, and some of our vendors have limited the distribution of their merchandise in the past. Accordingly, these vendors may be susceptible to cash flow issues, downturns in economic conditions, production difficulties, quality control issues and difficulty delivering agreed‑upon quantities on schedule and in compliance with regulatory requirements. If a vendor fails to deliver on its commitments, whether due to financial difficulties or other reasons, we could experience merchandise out‑of‑stocks that could lead to lost sales, especially with respect to seasonal and holiday merchandise. In addition, there is no assurance that we would be able, if necessary, to return product to these vendors, obtain refunds of our purchase price or obtain reimbursement or indemnification from any of our vendors should we so desire, and from time to time, we may be in litigation with one or more vendors. Many of these suppliers require extensive advance notice of our requirements in order to supply products in the quantities we need. This long lead time requires us to place orders far in advance of the time when certain products will be offered for sale, exposing us to shifts in consumer demand and discretionary spending.
Our business is moderately seasonal and weak performance during one of our historically strong seasonal periods could have a material adverse effect on our operating results for the entire fiscal year.
Our business is moderately seasonal, with a meaningful portion of our sales dedicated to seasonal and holiday merchandise, resulting in the realization of higher portions of net sales and operating income in the second and fourth fiscal quarters. Due to the importance of our peak sales periods, which include the spring and year‑end holiday decorating seasons, the second and fourth fiscal quarters have historically contributed, and are expected to continue to contribute, significantly to our operating results for the entire fiscal year. In anticipation of seasonal increases in sales activity during these periods, we incur significant additional expense prior to and during our peak seasonal periods, which we may finance with additional short‑term borrowings. These expenses may include the acquisition of additional inventory, seasonal staffing needs and other similar items. As a result, any factors negatively affecting us during these periods, including adverse weather and unfavorable economic conditions, could have a material adverse effect on our results of operations for the entire fiscal year.
Our quarterly operating results may fluctuate substantially and historical quarterly operating results may not be a meaningful indicator of future performance.
Our quarterly results of operations have fluctuated in the past and may fluctuate significantly in the future as a result of a variety of factors, many outside of our control, including:
|
· |
general economic and political conditions; |
|
· |
the mix of merchandise sold; |
|
· |
shifts in consumer tastes and changes in demand for the products that we offer in our stores; |
|
· |
calendar shifts of holiday or seasonal periods; |
|
· |
the timing of new store openings and the level of pre‑opening expenses associated with new stores; |
|
· |
the amount and timing of sales contributed by new stores; |
|
· |
store closings or relocations and costs related thereto; |
|
· |
expansion of existing or entry of new competitors into our markets; |
|
· |
pricing and other actions taken by our competitors; |
|
· |
changes in promotions, advertising or other actions taken by us or our existing or possible new competitors; |
|
· |
the timing and level of markdowns; |
20
|
· |
delays in the flow of merchandise to our stores; |
|
· |
changes in our operating expenses; |
|
· |
changes in commodity prices and the cost of fuel; |
|
· |
foreign exchange rates; |
|
· |
litigation; |
|
· |
adverse weather conditions in our markets, particularly on weekends; |
|
· |
natural or man‑made disasters; |
|
· |
the timing of income tax refunds to our customers; |
|
· |
the timing or elimination of certain state and local tax holidays; and |
|
· |
changes in other tenants or landlords or surrounding geographic circumstances in the areas in which we are located. |
Any of these events could have a material adverse effect on our business, financial condition and operating results for the fiscal quarter in which such event occurs as well as for the entire fiscal year. Therefore, period‑to‑period comparisons of historical quarterly operating results may not be a meaningful indicator of future performance.
We may not be able to protect our important intellectual property and we could incur substantial costs if we are subject to claims that our operations infringe on the proprietary rights of others.
We rely on our proprietary intellectual property, including trademarks, to market, promote and sell our products in our stores, particularly our At Home private label products. We monitor and protect against activities that might infringe, dilute or otherwise violate our trademarks and other intellectual property and rely on the trademark and other laws of the United States. However, we may be unable to prevent third parties from using our intellectual property without our authorization. To the extent we cannot protect our intellectual property, unauthorized use and misuse of our intellectual property could harm our competitive position and have a material adverse effect on our financial condition, cash flows or results of operations.
Additionally, we cannot be certain that we do not or will not in the future infringe on the intellectual property rights of third parties. From time to time, we have been subject to claims from third parties that we have infringed upon their intellectual property rights and we face the risk of such claims in the future. Any intellectual property infringement claims against us could be costly, time‑consuming, harmful to our reputation or result in injunctive or other equitable relief that may require us to make changes to our business, any of which could have a material adverse effect on our financial condition, cash flows or results of operations.
Increases in commodity prices and supply chain costs could materially adversely affect our results of operations.
Various commodities are used in our merchandise, such as petroleum, resin, copper, steel, cotton and lumber. These commodities are subject to inflation, price fluctuations and other market disturbances, including supply shortages. Increases in commodity prices or the costs related to our supply chain and distribution network, including currency exchange rates, tariffs, labor, fuel and other transportation costs, could have a material adverse effect on our gross margin, expenses and results of operations. Due to the uncertainty of these price fluctuations and our strategy to maintain everyday low prices, we may not be able to pass some or all of these increased costs on to our customers. Even if we are able to pass these increased costs on to our customers, we may not be able to do so on a timely basis, our gross margins could decline and we may not be able to implement other price increases for our merchandise.
21
If we are required to make significant investments in advertising, marketing or promotions, our margins and profitability could materially decline.
In general, we employ an everyday low pricing strategy that avoids high‑low pricing and promotions and allows us to minimize advertising and marketing expenses incurred by other retailers. However, there is no assurance that we can continue to be successful without significant advertising, marketing and promotions, particularly as we open stores in new markets. We spent over $20 million in capital and expenses in connection with our rebranding initiative during fiscal year 2015 and may need to incur additional expenses to promote our new brand. In addition, if we choose to invest in advertising, marketing and promotions in the future, there is no assurance that such efforts will be successful or result in a positive return on investment. Therefore, if we are required to make significant investments in advertising, marketing or promotions and related expenditures, our margins and profitability could materially decline even if sales increase.
Any online services or e‑commerce activities that we may launch in the future may require substantial investment and may not be successful.
We do not currently engage in e‑commerce and have a limited online presence through our website and other forms of social media. However, as part of our growth strategy, we are exploring expansion of our online services and could engage in e‑commerce activities in the future, which would require substantial investment. The success of any online services or e‑commerce business would depend, in part, on factors over which we may not control. We would need to successfully respond to changing consumer preferences and buying trends relating to online or e‑commerce usage. We would also be vulnerable to increased risks and uncertainties including: changes in required technology interfaces; website downtime and other technical failures; costs and technical issues related to upgrading website software; computer viruses; changes in applicable federal and state regulations; security breaches; consumer privacy concerns; and keeping up to date with competitive technology trends, including the use of new or improved technology, creative user interfaces and other online or e‑commerce marketing tools. In addition, any e‑commerce platform may be unprofitable, cannibalize sales from our existing stores or not be able to compete successfully against other Internet‑based retailers who sell similar merchandise. Our failure to successfully respond to these risks and uncertainties might adversely affect sales in any e‑commerce business that we establish in the future and could damage our reputation and brand. Further, in the event that we engage in e‑commerce in the future, we will need to establish a shipping and delivery system for items purchased online, for which we do not currently have adequate capability. Our business could be adversely affected if we are not able to successfully develop and integrate such a shipping and delivery system in connection with any e‑commerce business in which we may engage in the future.
Disruptions to our information systems, or our failure to adequately support, maintain and upgrade these systems, could negatively impact our operations and financial results.
We depend on our information technology systems for many aspects of our business. We have made significant investments in information technology, including investments in systems and applications for finance and accounting functions, supply chain management software for retail operations and data warehouse management systems and an automated distribution system for our distribution center operations. We purchase our inventory through a centralized inventory management system that operates for the entire chain. Merchandise is bar‑coded, enabling management to control inventory and pricing by SKU. Sales are updated daily in the merchandise reporting systems by polling all sales information from each store’s point‑of sale terminals. Stores are then staffed based on a statistically developed labor model which incorporates the daily and hourly store sales volume. We attempt to mitigate the risk of possible business interruptions caused by disruptions to our information systems by maintaining a disaster recovery plan, which includes maintaining backup systems off‑site. However, despite safeguards and careful contingency planning, our systems are still subject to power outages, computer viruses, computer and telecommunication failures, employee usage errors, security breaches, terrorism, natural or man‑made disasters and other catastrophic events. A major disruption of our information systems and backup mechanisms may cause us to incur significant costs to repair our systems and experience a critical loss of data. System failures could also disrupt our ability to track, record and analyze sales and inventory and could cause disruptions of our operations, including, among other things, our ability to process and ship inventory, process financial information including credit card transactions, process payrolls or vendor payments or engage in other similar normal business activities.
22
In addition, we may be unable to improve, upgrade, integrate or expand upon our existing systems and any costs and potential problems and interruptions associated with the implementation of new or upgraded systems and technology could also disrupt or reduce the efficiency of our operations.
Unauthorized disclosure of sensitive or confidential customer information could harm our business and standing with our customers.
The protection of our customer, employee and other company data is critical to us. We rely on commercially available systems, software, tools and monitoring to provide security for processing, transmission and storage of confidential customer information, such as payment card and personal information. Despite the security measures we have in place, our facilities and systems, and those of our third‑party service providers, may be vulnerable to security breaches, acts of vandalism, payment card terminal tampering, computer viruses, misplaced, lost or stolen data, programming or human errors or other similar events. The risks associated with our processing of sensitive customer data may be heightened if the amount of such data collected is increased, including via the co‑branded and private label credit card and customer loyalty programs that we are expecting to launch during fiscal year 2018. Any security breach involving the misappropriation, loss or other unauthorized disclosure of confidential information, whether by us or our third‑party service providers, could damage our reputation, expose us to risk of litigation and liability, disrupt our operations and harm our business. In addition, as a result of recent security breaches at a number of prominent retailers, the media and public scrutiny of information security and privacy has become more intense. As a result, we may incur significant costs to change our business practices or modify our service offerings in connection with the protection of personally identifiable information.
Regulatory or litigation developments could materially adversely affect our business operations and financial performance.
We are subject to numerous statutory, regulatory and legal requirements at a local, state, national and international level because of our business operations, store locations, workforce, sales to consumers and importation of merchandise. In addition, as a publicly traded company we may be exposed to the risk of stockholder litigation if our stock price declines. Laws and regulations affecting our business may change, sometimes frequently and significantly, as a result of political, economic, social or other events. Changes in the regulatory environment in the areas of product safety, environmental protection, privacy and information security, health care, labor and employment, U.S. customs, advertising and taxes, among others, could potentially impact our operations and financial results. For example, more stringent and varied requirements of local and state governmental bodies with respect to zoning, land use and environmental factors could delay or prevent development of new stores in particular locations. Environmental laws and regulations also govern, among other things, discharges of pollutants into the air and water as well as the presence, handling, release and disposal of and exposure to hazardous substances. These laws provide for significant fines and penalties for noncompliance. Third parties may also make personal injury, property damage or other claims against us associated with actual or alleged release of, or exposure to, hazardous substances at our properties. We could also be strictly liable, without regard to fault, for certain environmental conditions at properties we formerly owned or operated as well as at our current properties. We could be negatively impacted by developments in these areas due to the costs of compliance, and if we fail to comply with a law or regulation, we may be subject to claims, lawsuits, fines, penalties, loss of a license or permit and adverse publicity or other consequences that could have a material adverse effect on our business and results of operations.
Product recalls and/or product liability, as well as changes in product safety and other consumer protection laws, may adversely impact our operations, merchandise offerings, reputation, results of operations, cash flow and financial condition.
We are subject to regulations by a variety of federal, state and international regulatory authorities, including The Consumer Product Safety Commission. A large portion of our merchandise is manufactured in foreign countries. As such, one or more of our vendors might not adhere to product safety requirements or our quality control standards, and we might not identify the deficiency before merchandise ships to our stores. If our merchandise offerings do not meet applicable safety standards or our customers’ expectations regarding safety, we could experience lost sales and increased costs and be exposed to legal and reputational risk. We could be required to recall some of those products or could expose ourselves to government enforcement action or private litigation, such as product liability claims, which could
23
result in significant fines, penalties, monetary damages and other remedies as well as harm to our reputation. We could also be subject to litigation related to injuries or other accidents at our stores or distribution center.
Moreover, changes in product safety or other consumer protection laws could lead to increased costs to us for certain merchandise, or additional labor costs associated with readying merchandise for sale. Long lead times on merchandise ordering cycles increase the difficulty for us to plan and prepare for potential changes to applicable laws. In particular, The Consumer Product Safety Improvement Act of 2008 imposes significant requirements on manufacturing, importing, testing and labeling requirements for some of our products. In the event that we are unable to timely comply with regulatory changes, significant fines or penalties could result, and could adversely affect our reputation, results of operations, cash flow and financial condition.
Inadequacy of our insurance coverage could have a material adverse effect on our business.
We maintain third-party insurance coverage against various liability risks and risks of property loss and business interruption, as well directors and officers liability insurance coverage. While we believe these arrangements are an effective way to insure against liability and property damage risks, the potential liabilities associated with those risks or other events could exceed the coverage provided by such arrangements. Significant uninsured liabilities could have a material adverse effect on our Company.
Our continued success is substantially dependent on positive perceptions of At Home.
We are highly dependent on our reputation amongst home décor enthusiasts. To remain successful in the future, we must continue to preserve, grow and utilize the value of our reputation as the destination retailer for our customers’ home décor needs. Reputational value is based in large part on perceptions of subjective qualities, and even isolated incidents may erode trust and confidence. Events that can damage our reputation include, but are not limited to, legal violations, litigation, actual or perceived ethical problems, product safety issues, actual or perceived poor employee relations, actual or perceived poor customer service, store appearance or operational issues, unauthorized use or other misappropriation of our trade name, data security or events outside of our control that could generate negative publicity with respect to At Home, whether in traditional media or social media outlets. Any event that has the potential to negatively impact our trade name or our reputation with customers, employees, suppliers, communities, governmental officials and others could have a material adverse effect on our business and results of operations.
Our operating results and financial position could be negatively impacted by accounting policies, rules and regulations.
Our operating results and financial position could be negatively impacted by implementation of our various accounting policies as well as changes to accounting rules and regulations or new interpretations of existing accounting standards. These changes may include, without limitation, changes to lease accounting standards. For example, while we are still evaluating the impact of our pending adoption of ASU No. 2016‑02, “Leases” on our consolidated financial statements, we expect that upon adoption we will recognize right-of-use assets and liabilities that could be material to our financial statements. In addition, from time to time, we could incur impairment charges that adversely affect our operating results. For example, changes in economic or operating conditions impacting our estimates and assumptions could result in the impairment of intangible assets (such as our goodwill or trade name) or long‑lived assets in accordance with applicable accounting guidance. In the event that we determine our intangible or long‑lived assets are impaired, we may be required to record a significant charge to earnings in our financial statements that could have a material adverse effect on our results of operations.
We incurred net losses in fiscal years 2014 and 2015 and we may experience net losses in the future.
We experienced net losses of $22.3 million and $0.4 million, respectively, for the fiscal years ended January 25, 2014 and January 31, 2015. There is no guarantee that we will be successful in realizing net income or otherwise achieving profitability or sustaining positive cash flow in future periods. Any failure to achieve net income could, among other things, impair our ability to complete future financings or the cost of obtaining financing or force us to seek additional capital through sales of our equity securities, which could dilute the value of currently outstanding shares of our common stock. In addition, a lack of profitability could adversely affect the price of our common stock.
24
Changes in our effective income tax rate could affect our results of operations.
Our effective income tax rate is influenced by a number of factors. Changes in the tax laws, the interpretation of existing laws or our failure to sustain our reporting positions on examination could adversely affect our effective tax rate. Further, our effective tax rate in a given financial statement period may be materially impacted by changes in the mix and level of earnings or by changes to existing accounting rules or regulations.
We are a holding company with no operations of our own, and we depend on our subsidiaries for cash.
We are a holding company and do not have any material assets or operations other than ownership of equity interests of our subsidiaries. Our operations are conducted almost entirely through our subsidiaries, and our ability to generate cash to meet our obligations or to pay dividends, if any, is highly dependent on the earnings of, and receipt of funds from, our subsidiaries through dividends or intercompany loans. The ability of our subsidiaries to generate sufficient cash flow from operations to allow us and them to make scheduled payments on our debt obligations will depend on their future financial performance, which will be affected by a range of economic, competitive and business factors, many of which are outside of our control. We cannot assure our stockholders that the cash flow and earnings of our operating subsidiaries will be adequate for our subsidiaries to service their debt obligations. If our subsidiaries do not generate sufficient cash flow from operations to satisfy corporate obligations, we may have to undertake alternative financing plans (such as refinancing), restructure debt, sell assets, reduce or delay capital investments, or seek to raise additional capital. We cannot assure our stockholders that any such alternative refinancing would be possible, that any assets could be sold, or, if sold, of the timing of the sales and the amount of proceeds realized from those sales, that additional financing could be obtained on acceptable terms, if at all, or that additional financing would be permitted under the terms of our various debt instruments then in effect. Our inability to generate sufficient cash flow to satisfy our obligations, or to refinance our obligations on commercially reasonable terms, could have a material adverse effect on our business, financial condition and results of operations.
Furthermore, we and our subsidiaries may incur substantial additional indebtedness in the future that may severely restrict or prohibit our subsidiaries from making distributions, paying dividends, if any, or making loans to us.
Risks Relating to Ownership of Our Common Stock
The market price of our common stock may be highly volatile, and our stockholders may not be able to resell their shares of our common stock at or above the price they paid for them.
The trading price of our common stock could be volatile, and our stockholders can lose all or part of their investment. The following factors, in addition to other factors described in this "Risk Factors" section and elsewhere in this Annual Report on Form 10-K, may have a significant impact on the market price of our common stock:
|
· |
quarterly variations in our operating results compared to market expectations; |
|
· |
changes in the preferences of our customers; |
|
· |
low comparable store sales growth compared to market expectations; |
|
· |
delays in the planned openings of new stores; |
|
· |
the failure of securities analysts to cover the Company or changes in analysts’ financial estimates; |
|
· |
economic, legal, regulatory and political factors unrelated to our performance; |
|
· |
changes in consumer spending or the housing market; |
|
· |
increased competition or stock price performance of our competitors; |
|
· |
future sales of our common stock or the perception that such sales may occur; |
25
|
· |
changes in senior management or key personnel; |
|
· |
investor perceptions of us and the retail industry; |
|
· |
new regulatory pronouncements and changes in regulatory guidelines; |
|
· |
lawsuits, enforcement actions and other claims by third parties or governmental authorities; |
|
· |
action by institutional stockholders or other large stockholders; |
|
· |
failure to meet any guidance given by us or any change in any guidance given by us, or changes by us in our guidance practices; |
|
· |
speculation in the press or investment community; |
|
· |
events beyond our control, such as war, terrorist attacks, transportation and fuel prices, natural disasters, severe weather and widespread illness; and |
|
· |
the other factors listed in this “Risk Factors” section. |
In addition, our stock price may be volatile. The stock market in general has experienced extreme price and volume fluctuations that have often been unrelated or disproportionate to the operating performance of companies like us. Accordingly, these broad market and industry factors may significantly reduce the market price of our common stock, regardless of our operating performance.
Because the Sponsors control a significant percentage of our common stock, they may control all major corporate decisions and their interests may conflict with your interests as an owner of our common stock and those of the Company.
We are controlled by the Sponsors, which currently indirectly own approximately 85% of our common stock. Accordingly, the Sponsors currently control the election of the majority of our directors and could exercise a controlling interest over our business, affairs and policies, including the appointment of our management and the entering into of business combinations or dispositions and other corporate transactions. The directors so elected have the authority to incur additional debt, issue or repurchase stock, declare dividends and make other decisions that could be detrimental to stockholders. In addition, pursuant to the stockholders’ agreement, for a period of two years following our initial public offering, subject to certain exceptions, Starr Investments has agreed to vote or cause to be voted 9,611,804 of their shares of our common stock on all matters presented to the stockholders in the same manner that AEA votes on such matters. In addition, following our initial public offering, and for so long as certain affiliates of AEA, on the one hand, and Starr Investments, on the other hand, respectively in the aggregate hold least 10% of our outstanding common stock, each of such Sponsors shall be entitled to nominate at least one individual for election to our board, and our board and nominating committee thereof shall nominate and recommend to our stockholders that such individual be elected to our board, and each party to the stockholders’ agreement agrees to vote all of their shares to elect such individual to our board.
The Sponsors may have interests that are different from our other stockholders and may vote in a way with which our other stockholders disagree and which may be adverse to our other stockholders’ interests. Further, AEA and Starr Investments may have differing views from each other, neither of which may align with other stockholders’ interests. In addition, the Sponsors’ concentration of ownership could have the effect of delaying or preventing a change in control or otherwise discouraging a potential acquirer from attempting to obtain control of us, which could cause the market price of our common stock to decline or prevent stockholders from realizing a premium over the market price for their common stock.
Additionally, the Sponsors are in the business of making investments in companies and may from time to time acquire and hold interests in businesses that compete directly or indirectly with us or supply us with goods and services.
26
The Sponsors may also pursue acquisition opportunities that may be complementary to our business and, as a result, those acquisition opportunities may not be available to us. Stockholders should consider that the interests of the Sponsors may differ from their interests in material respects.
Sales of a substantial number of shares of our common stock in the public market by our existing stockholders could cause our stock price to fall.
Sales of a substantial number of shares of our common stock in the public market, or the perception that these sales might occur, could depress the market price of our common stock and could impair our ability to raise capital through the sale of additional equity securities.
Moreover, holders of an aggregate of approximately 85% of our outstanding common stock have rights to require us to file registration statements covering their shares or to include their shares in registration statements that we may file for ourselves or other stockholders. Registration of these shares under the Securities Act of 1933, as amended, or the Securities Act, would result in the shares becoming freely tradable without restriction under the Securities Act, except for shares held by our affiliates as defined in Rule 144 under the Securities Act. Any sales of securities by these stockholders could have a material adverse effect on the trading price of our common stock.
If securities or industry analysts do not publish or cease publishing research or reports about At Home, or if they issue unfavorable commentary about us or our industry or downgrade our common stock, the price of our common stock could decline.
The trading market for our common stock will depend in part on the research and reports that third‑party securities analysts publish about At Home and the retail industry. One or more analysts could downgrade our common stock or issue other negative commentary about At Home or our industry. In addition, we may be unable or slow to attract research coverage. Alternatively, if one or more of these analysts cease coverage of At Home, we could lose visibility in the market. As a result of one or more of these factors, the trading price of our common stock could decline.
Some provisions of our charter documents and Delaware law may have anti‑takeover effects that could discourage an acquisition of us by others, even if an acquisition would be beneficial to our stockholders, and may prevent attempts by our stockholders to replace or remove our current management.
Provisions in our amended and restated certificate of incorporation and our amended and restated bylaws, as well as provisions of the Delaware General Corporation Law, or DGCL, could make it more difficult for a third-party to acquire us or increase the cost of acquiring us, even if doing so would benefit our stockholders, including transactions in which stockholders might otherwise receive a premium for their shares. These provisions include:
|
· |
establishing a classified board of directors such that not all members of the board are elected at one time; |
|
· |
allowing the total number of directors to be determined exclusively (subject to the rights of holders of any series of preferred stock to elect additional directors) by resolution of our board of directors and granting to our board the sole power (subject to the rights of holders of any series of preferred stock or rights granted pursuant to the stockholders’ agreement) to fill any vacancy on the board; |
|
· |
limiting the ability of stockholders to remove directors without cause if AEA ceases to own, or have the right to direct the vote of, 50% or more of the voting power of our common stock; |
|
· |
authorizing the issuance of “blank check” preferred stock by our board of directors, without further stockholder approval, to thwart a takeover attempt; |
|
· |
prohibiting stockholder action by written consent (and, thus, requiring that all stockholder actions be taken at a meeting of our stockholders), if AEA ceases to own, or have the right to direct the vote of, 50% or more of the voting power of our common stock; |
27
|
· |
eliminating the ability of stockholders to call a special meeting of stockholders, except for AEA, so long as AEA owns, or has the right to direct the vote of, 50% or more of the voting power of our common stock; |
|
· |
establishing advance notice requirements for nominations for election to the board of directors or for proposing matters that can be acted upon at annual stockholder meetings; and |
|
· |
requiring the approval of the holders of at least two‑thirds of the voting power of all outstanding stock entitled to vote thereon, voting together as a single class, to amend or repeal our certificate of incorporation or bylaws if AEA ceases to own, or have the right to direct the vote of, 50% or more of the voting power of our common stock. |
In addition, while we have opted out of Section 203 of the DGCL, our amended and restated certificate of incorporation contains similar provisions providing that we may not engage in certain “business combinations” with any “interested stockholder” for a three‑year period following the time that the stockholder became an interested stockholder, unless:
|
· |
prior to such time, our board of directors approved either the business combination or the transaction that resulted in the stockholder becoming an interested stockholder; |
|
· |
upon consummation of the transaction that resulted in the stockholder becoming an interested stockholder, the interested stockholder owned at least 85% of our voting stock outstanding at the time the transaction commenced, excluding certain shares; or |
|
· |
at or subsequent to that time, the business combination is approved by our board of directors and by the affirmative vote of holders of at least two‑thirds of our outstanding voting stock that is not owned by the interested stockholder. |
Generally, a “business combination” includes a merger, asset or stock sale or other transaction provided for or through our Company resulting in a financial benefit to the interested stockholder. Subject to certain exceptions, an “interested stockholder” is a person who owns 15% or more of our outstanding voting stock and the affiliates and associates of such person. For purposes of this provision, “voting stock” means any class or series of stock entitled to vote generally in the election of directors. Our amended and restated certificate of incorporation provides that AEA, Starr Investments, their respective affiliates and any of their respective direct or indirect designated transferees (other than in certain market transfers and gifts) and any group of which such persons are a party do not constitute “interested stockholders” for purposes of this provision.
Under certain circumstances, this provision will make it more difficult for a person who qualifies as an “interested stockholder” to effect certain business combinations with our Company for a three‑year period. This provision may encourage companies interested in acquiring us to negotiate in advance with our board of directors in order to avoid the stockholder approval requirement if our board of directors approves either the business combination or the transaction that results in the stockholder becoming an interested stockholder. These provisions also may have the effect of preventing changes in our board of directors and may make it more difficult to accomplish transactions that our stockholders may otherwise deem to be in their best interests.
These anti‑takeover defenses could discourage, delay or prevent a transaction involving a change in control of our Company. These provisions could also discourage proxy contests and make it more difficult for our stockholders to elect directors of their choosing and cause us to take corporate actions other than those that our stockholders desire.
We are exposed to risks relating to evaluations of controls required by Section 404 of the Sarbanes‑Oxley Act.
We are in the process of evaluating our internal controls systems to allow management to report on, and our independent auditors to audit, our internal controls over financial reporting. We will be performing the system and process evaluation and testing (and any necessary remediation) required to comply with the management certification
28
and, once required, the auditor attestation requirements of Section 404 of the Sarbanes‑Oxley Act. We will be required to comply with the management certification requirements of Section 404 in our annual report on Form 10‑K for the year following our first annual report that is filed with the SEC (subject to any change in applicable SEC rules). Beginning with our annual report on Form 10-K for the year ended January 27, 2018, we will be required to provide a management report on internal control over financial reporting. In preparation for being able to provide such a report, we continue to make progress in documenting, assessing and testing our internal control over financial reporting. When we are no longer an emerging growth company, our management report on internal control over financial reporting will need to be attested to by our independent registered public accounting firm. We do not expect to have our independent registered public accounting firm attest to our management report on internal control over financial reporting while we are an emerging growth company. Furthermore, upon completion of this process, we may identify control deficiencies of varying degrees of severity under applicable SEC and PCAOB rules and regulations that remain unremediated. As a public company, we are required to report, among other things, control deficiencies that constitute a “material weakness” or changes in internal controls that, or that are reasonably likely to, materially affect internal controls over financial reporting. A “material weakness” is a deficiency, or a combination of deficiencies, in internal control over financial reporting, such that there is a reasonable possibility that a material misstatement of our annual or interim financial statements will not be prevented or detected on a timely basis. A “significant deficiency” is a deficiency, or a combination of deficiencies, in internal control over financial reporting that is less severe than a material weakness, yet important enough to merit attention by those responsible for oversight of our financial reporting.
To continue to comply with the requirements of being a public company, we have undertaken various actions, and may need to take additional actions, such as implementing and enhancing our internal controls and procedures and hiring additional accounting or internal audit staff. Testing and maintaining internal controls can divert our management’s attention from other matters that are important to the operation of our business. Additionally, when evaluating our internal control over financial reporting, we may identify material weaknesses that we may not be able to remediate in time to meet the applicable deadline imposed upon us for compliance with the requirements of Section 404. For example, in the past, certain matters involving our internal controls over financial reporting that constituted “material weaknesses” were identified and have since been remediated, which related to our limited accounting personnel and other resources at the time, as well as our adoption of public company standards. If we identify any additional material weaknesses in our internal control over financial reporting or are unable to comply with the requirements of Section 404 in a timely manner or assert that our internal control over financial reporting is effective, if we are required to make further restatements of our financial statements, or if our independent registered public accounting firm is unable to express an opinion as to the effectiveness of our internal control over financial reporting once we are no longer an emerging growth company, investors may lose confidence in the accuracy, completeness or reliability of our financial reports and the trading price of our common stock may be adversely affected, and we could become subject to sanctions or investigations by the NYSE, the SEC or other regulatory authorities, which could require additional financial and management resources. In addition, if we fail to remedy any material weakness, our financial statements could be inaccurate and we could face restricted access to the capital markets.
We do not currently expect to pay any cash dividends.
The continued operation and expansion of our business will require substantial funding. Accordingly, we do not currently expect to pay any cash dividends on shares of our common stock. Any determination to pay dividends in the future will be at the discretion of our board of directors and will depend upon results of operations, financial condition, contractual restrictions, restrictions imposed by applicable law and other factors that our board of directors deems relevant. We are a holding company, and substantially all of our operations are carried out by our operating subsidiaries. Under our ABL Facility and Term Loan, our operating subsidiaries are significantly restricted in their ability to pay dividends or otherwise transfer assets to us, and we expect these limitations to continue in the future. Our ability to pay dividends may also be limited by the terms of any future credit agreement or any future debt or preferred equity securities of ours or of our subsidiaries.
29
The requirements of being a public company, including compliance with the reporting requirements of the Exchange Act and the requirements of the Sarbanes‑Oxley Act and the NYSE, may strain our resources, increase our costs and divert management’s attention, and we may be unable to comply with these requirements in a timely or cost‑effective manner.
As a public company, we are subject to the reporting requirements of the Securities Exchange Act of 1934, as amended, or the Exchange Act, and the corporate governance standards of the Sarbanes‑Oxley Act and the NYSE. These requirements place a strain on our management, systems and resources and we incur significant legal, accounting, insurance and other expenses that we did not incur as a private company. The Exchange Act requires us to file annual, quarterly and current reports with respect to our business and financial condition within specified time periods and to prepare a proxy statement with respect to our annual meeting of stockholders. The Sarbanes‑Oxley Act requires that we maintain effective disclosure controls and procedures and internal controls over financial reporting. The NYSE requires that we comply with various corporate governance requirements. To maintain and improve the effectiveness of our disclosure controls and procedures and internal controls over financial reporting and comply with the Exchange Act and the NYSE’s requirements, significant resources and management oversight are required. This may divert management’s attention from other business concerns and lead to significant costs associated with compliance, which could have a material adverse effect on us and the price of our common stock.
The expenses incurred by public companies generally for reporting and corporate governance purposes have been increasing. We expect that continuing compliance with these rules and regulations will increase our legal and financial compliance costs and to make some activities more time‑consuming and costly. These laws and regulations could also make it more difficult or costly for us to obtain certain types of insurance, including director and officer liability insurance, and we may be forced to accept reduced policy limits and coverage or incur substantially higher costs to obtain the same or similar coverage. These laws and regulations could also make it more difficult for us to attract and retain qualified persons to serve on our board of directors, our board committees or as our executive officers. Advocacy efforts by stockholders and third parties may also prompt even more changes in governance and reporting requirements. We cannot predict or estimate the amount of additional costs we may incur or the timing of these costs. Furthermore, if we are unable to satisfy our obligations as a public company, we could be subject to delisting of our common stock, fines, sanctions and other regulatory action and potentially civil litigation.
We are a “controlled company” within the meaning of the NYSE rules and, as a result, qualify for, and rely on, exemptions from certain corporate governance requirements.
The Sponsors control a majority of the voting power of our outstanding common stock. As a result, we are a “controlled company” within the meaning of the NYSE corporate governance standards. A company of which more than 50% of the voting power is held by an individual, a group or another company is a “controlled company” within the meaning of the NYSE rules and may elect not to comply with certain corporate governance requirements of the NYSE, including:
|
· |
the requirement that a majority of our board of directors consist of independent directors; |
|
· |
the requirement that we have a nominating/corporate governance committee that is composed entirely of independent directors with a written charter addressing the committee’s purpose and responsibilities; |
|
· |
the requirement that we have a compensation committee that is composed entirely of independent directors with a written charter addressing the committee’s purpose and responsibilities; and |
|
· |
the requirement for an annual performance evaluation of the nominating and corporate governance and compensation committees. |
We intend to continue to rely on all of the exemptions listed above for so long as we are eligible to do so. To the extent we utilize these exemptions, we will not have a majority of independent directors and our nominating and corporate governance and compensation committees will not consist entirely of independent directors. As a result, our board of directors and those committees may have more directors who do not meet the NYSE’s independence standards than they would if those standards were to apply. The independence standards are intended to ensure that directors who
30
meet those standards are free of any conflicting interest that could influence their actions as directors. Accordingly, our stockholders may not have the same protections afforded to stockholders of companies that are subject to all of the corporate governance requirements of the NYSE.
Taking advantage of the reduced disclosure requirements applicable to “emerging growth companies” may make our common stock less attractive to investors.
As a company with less than $1.0 billion in revenue during our last fiscal year, we qualify as an “emerging growth company” as defined in the JOBS Act. An emerging growth company may take advantage of specified reduced reporting and other requirements that are otherwise applicable generally to public companies. These provisions include:
|
· |
we are not required to engage an auditor to report on our internal controls over financial reporting pursuant to Section 404(b) of the Sarbanes‑Oxley Act; |
|
· |
we are not required to comply with any requirement that may be adopted by the PCAOB regarding mandatory audit firm rotation or a supplement to the auditor’s report providing additional information about the audit and the financial statements (i.e., an auditor discussion and analysis); |
|
· |
we are not required to submit certain executive compensation matters to stockholder advisory votes, such as “say‑on‑pay”, “say‑on‑frequency” and “say‑on‑golden parachutes”; and |
|
· |
we are not required to disclose certain executive compensation related items such as the correlation between executive compensation and performance and comparisons of the chief executive officer’s compensation to median employee compensation. |
We may take advantage of these provisions until the last day of our fiscal year following the fifth anniversary of our initial public offering or such earlier time that we are no longer an emerging growth company. We would cease to be an emerging growth company if we have more than $1.0 billion in annual revenue, have more than $700 million in market value of our common stock held by non‑affiliates, or issue more than $1.0 billion of non‑convertible debt over a three‑year period.
The JOBS Act permits an emerging growth company like us to take advantage of an extended transition period to comply with new or revised accounting standards applicable to public companies. We are choosing to irrevocably “opt out” of this provision and, as a result, we will comply with new or revised accounting standards as required when they are adopted.
We cannot predict if investors will find our common stock less attractive to the extent we continue to rely on these exemptions, or if taking advantage of these exemptions would result in less active trading or more volatility in the price of our common stock.
Our amended and restated certificate of incorporation designates the Court of Chancery of the State of Delaware as the exclusive forum for certain litigation that may be initiated by our stockholders, which could limit our stockholders’ ability to obtain a favorable judicial forum for disputes with us.
Our amended and restated certificate of incorporation provides that the Court of Chancery of the State of Delaware will be the sole and exclusive forum for (i) any derivative action or proceeding brought on our behalf, (ii) any action asserting a claim of breach of a fiduciary duty owed to us or our stockholders by any of our directors, officers, employees or agents, (iii) any action asserting a claim against us arising under the DGCL or (iv) any action asserting a claim against us that is governed by the internal affairs doctrine. Our stockholders are deemed to have notice of and have consented to the provisions of our amended and restated certificate of incorporation related to choice of forum. The choice of forum provision in our amended and restated certificate of incorporation may limit our stockholders’ ability to obtain a favorable judicial forum for disputes with us.
ITEM 1B. UNRESOLVED STAFF COMMENTS
None.
31
We lease our corporate headquarters, distribution centers and the majority of our store properties. Our store locations are generally anchor, stand-alone or mall-enclosed locations that range between 80,000 and 165,000 square feet, averaging approximately 115,000 square feet per store. As of January 28, 2017, we operated 123 stores across the United States, of which 111 are leased and 12 are owned locations. Our leases generally have a term of 5 to 20 years, with renewal options that generally range from 5 to 20 years and are subject to escalating rent increases. We are typically responsible for taxes, utilities, insurance, repairs and maintenance for these store properties. Certain leases require the payment of contingent rent based on a specified percentage of stores’ gross sales, as defined in the lease agreement, and are subject to certain limitations. A summary of our store locations by state as of January 28, 2017 is below:
|
|
|
|
|
|
|
|
|
|
Location |
|
Store(s) |
|
Location |
|
Store(s) |
|
|
|
|
|
|
|
|
|
|
|
Alabama |
|
3 |
|
Missouri |
|
7 |
|
|
Arizona |
|
5 |
|
Nebraska |
|
1 |
|
|
Arkansas |
|
1 |
|
New Mexico |
|
1 |
|
|
Colorado |
|
3 |
|
New York |
|
2 |
|
|
Florida |
|
3 |
|
North Carolina |
|
5 |
|
|
Georgia |
|
7 |
|
Ohio |
|
5 |
|
|
Illinois |
|
3 |
|
Oklahoma |
|
3 |
|
|
Indiana |
|
3 |
|
Pennsylvania |
|
4 |
|
|
Iowa |
|
2 |
|
South Carolina |
|
2 |
|
|
Kansas |
|
2 |
|
South Dakota |
|
1 |
|
|
Kentucky |
|
3 |
|
Tennessee |
|
6 |
|
|
Louisiana |
|
3 |
|
Texas |
|
26 |
|
|
Michigan |
|
6 |
|
Utah |
|
4 |
|
|
Minnesota |
|
2 |
|
Virginia |
|
5 |
|
|
Mississippi |
|
3 |
|
Wisconsin |
|
2 |
|
|
|
|
|
|
|
|
|
|
|
|
|
|
|
Total |
|
123 |
|
We lease a 592,000 square foot distribution center in Plano, Texas, which also serves as our corporate headquarters. The lease will expire in 2036 and we have options to renew the lease for an additional period of up to 20 years. We believe that our current facility will be sufficient to support a store base of up to approximately 220 stores. We also lease an additional 420,000 square feet warehouse premises located in Garland, Texas, for initial inventory build-up for new store openings.
We are subject to various litigations, claims and other proceedings that arise from time to time in the ordinary course of business. We believe these actions are routine and incidental to the business. While the outcome of these actions cannot be predicted with certainty, we do not believe that any will have a material adverse impact on our business.
ITEM 4. MINE SAFETY DISCLOSURES
Not applicable.
32
ITEM 5. MARKET FOR REGISTRANT’S COMMON EQUITY, RELATED STOCKHOLDER MATTERS AND ISSUER PURCHASES OF EQUITY SECURITIES
Market Information
Our common stock has been listed on the New York Stock Exchange (the “NYSE”) under the symbol “HOME” since our initial public offering on August 4, 2016. Prior to that date, there was no public market for our common stock. As of January 28, 2017, there were approximately 85 holders of record of our common stock. The number of holders of record is based upon the actual number of holders registered at such date and does not include holders of shares in “street names” or persons, partnerships, associates, corporations or other entities identified in security position listing maintained by depositories. The following table sets forth, for the periods indicated, the high and low sales price of our common stock as reported by the NYSE:
|
|
|
Fiscal Year Ended January 28, 2017 |
|
||||
|
|
|
High |
|
Low |
|
||
|
|
|
|
|
|
|
|
|
|
Third Quarter (1) |
|
$ |
16.35 |
|
$ |
11.18 |
|
|
Fourth Quarter |
|
$ |
16.07 |
|
$ |
10.53 |
|
|
(1) |
The stock prices indicated represent the period from August 4, 2016 through October 29, 2016, the end of our third quarter. |
Dividend Policy
We do not currently expect to pay any cash dividends on our common stock for the foreseeable future. Instead, we intend to retain future earnings, if any, for the future operation and expansion of our business and the repayment of debt. Any determination to pay dividends in the future will be at the discretion of our board of directors and will depend upon our results of operations, cash requirements, financial condition, contractual restrictions, restrictions imposed by applicable laws and other factors that our board of directors may deem relevant. Our business is conducted through our subsidiaries. Dividends, distributions and other payments from, and cash generated by, our subsidiaries will be our principal sources of cash to repay indebtedness, fund operations and pay dividends. Accordingly, our ability to pay dividends to our stockholders is dependent on the earnings and distributions of funds from our subsidiaries. In addition, the covenants in the agreements governing our existing indebtedness significantly restrict the ability of our subsidiaries to pay dividends or otherwise transfer assets to us. For information regarding restrictions on the payment of dividends imposed by agreements for indebtedness, See Note 5 – Revolving Line of Credit, to our audited consolidated financial statements included in “Item 15. Exhibits and Financial Statement Schedules”, which is incorporated herein by reference.
33
Performance Graph
The following graph shows a comparison of cumulative total return to holders of shares of At Home Group Inc.’s common stock against the cumulative total return of S&P 500 Index and S&P 500 Specialty Retail Index from August 4, 2016 (the date our common stock commenced trading on the NYSE) through January 28, 2017. The comparison of the cumulative total returns for each investment assumes that $100 was invested in At Home Group Inc. common stock and the respective indices on August 4, 2016 through January 28, 2017 including reinvestment of any dividends. Historical share price performance should not be relied upon as an indication of future share price performance.
This performance graph and related information shall not be deemed “soliciting material” or to be “filed” for purposes of Section 18 of the Exchange Act or otherwise subject to the liabilities under that Section, and shall not be deemed to be incorporated by reference into any future filing under the Securities Act or Exchange Act, except to the extent that we specifically incorporate it by reference into such filing.
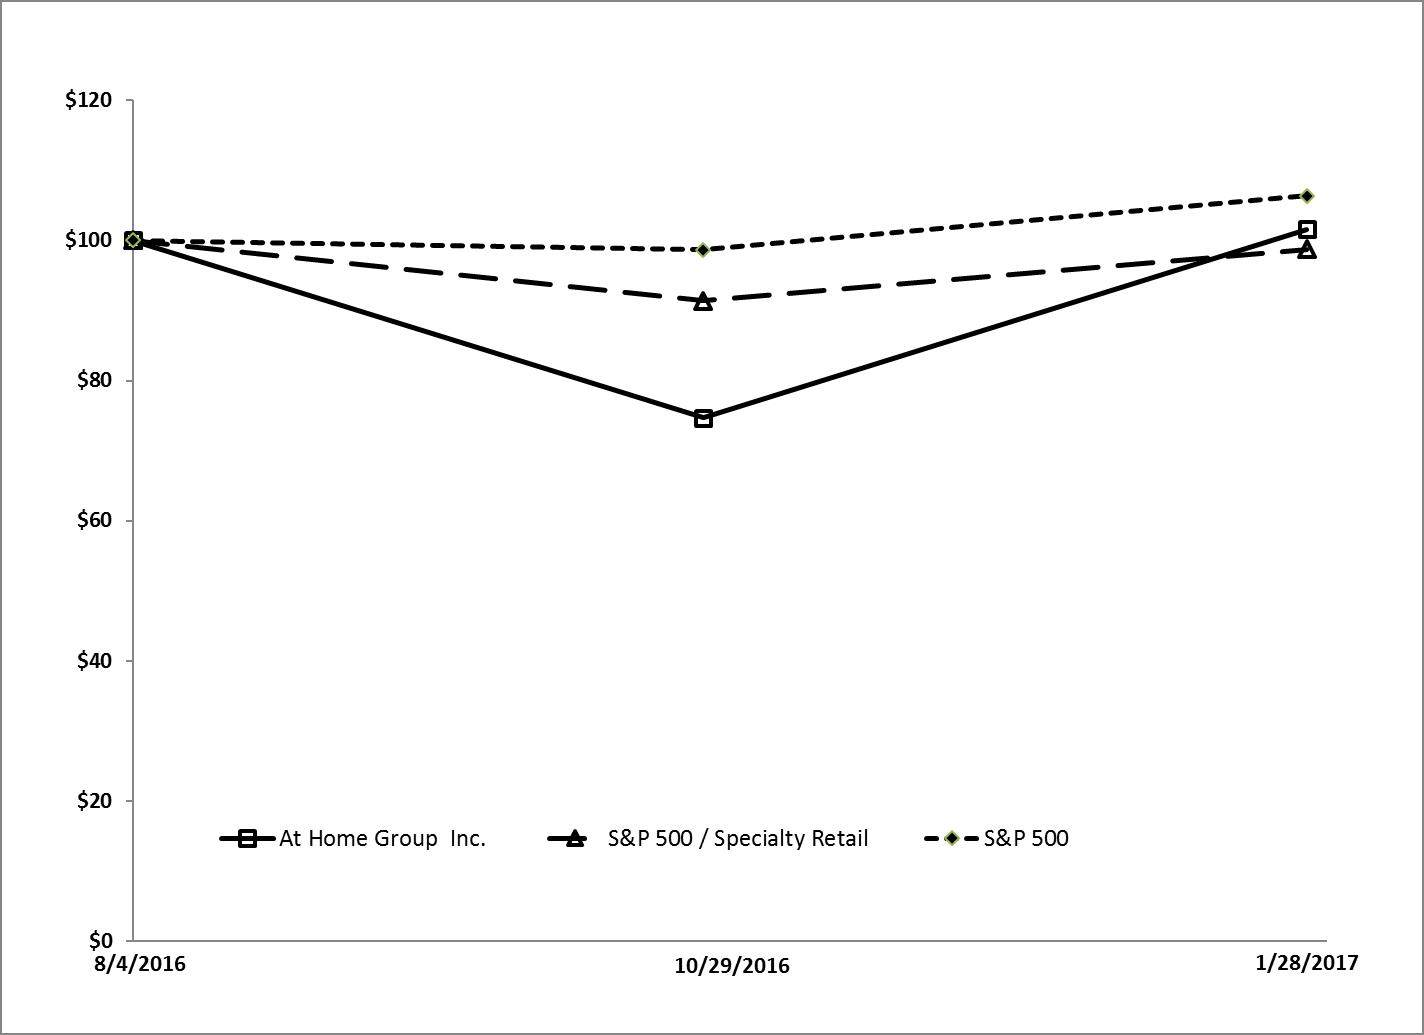
|
|
|
08/03/2016 |
|
10/29/2016 |
|
01/28/2017 |
|
|||
|
|
|
|
|
|
|
|
|
|
||
|
At Home Group Inc |
|
$ |
100.00 |
|
$ |
75.00 |
|
$ |
100.93 |
|
|
S&P 500 Index |
|
|
100.00 |
|
|
98.25 |
|
|
106.03 |
|
|
S&P 500 Specialty Retail Index |
|
|
100.00 |
|
|
91.37 |
|
|
97.95 |
|
34
ITEM 6. SELECTED FINANCIAL AND OPERATING DATA
The following selected consolidated financial data for each of the years ended January 28, 2017, January 30, 2016 and January 31, 2015, and the selected consolidated balance sheet data as of January 28, 2017 and January 30, 2016 have been derived from our audited consolidated financial statements, which are included in “Item 15. Exhibits and Financial Statement Schedules”. The selected consolidated balance sheet data as of January 31, 2015 have been derived from our audited consolidated financial statements, which are not included in this Annual Report on Form 10-K.
We operate on a fiscal calendar which, in a given fiscal year, consists of a 52- or 53-week period ending on the last Saturday in January. The reporting periods contained in our audited consolidated financial statements included in this report contain 52 weeks of operations in fiscal year ended January 28, 2017, 52 weeks of operations in the fiscal year ended January 30, 2016 and 53 weeks of operations in the fiscal year ended January 31, 2015. The historical results presented below are not necessarily indicative of the results to be expected for any future period. You should read the selected consolidated financial and operating data for the periods presented in conjunction with “Item 1A. Risk Factors”, “Item 7. Management’s Discussion and Analysis of Financial Condition and Results of Operations” and our consolidated financial statements and the related notes, which are included elsewhere in this Annual Report on Form 10-K.
|
|
|
Fiscal Year Ended |
|
|||||||
|
|
|
January 28, 2017 |
|
January 30, 2016 |
|
January 31, 2015 |
|
|||
|
Statement of Operations Data: |
|
|
|
|
|
|
|
|
||
|
Net sales |
|
$ |
765,635 |
|
$ |
622,161 |
|
$ |
497,733 |
|
|
Cost of sales |
|
|
518,155 |
|
|
421,750 |
|
|
335,617 |
|
|
Gross profit |
|
|
247,480 |
|
|
200,411 |
|
|
162,116 |
|
|
Operating Expenses |
|
|
|
|
|
|
|
|
|
|
|
Selling, general and administrative expenses |
|
|
170,556 |
|
|
135,716 |
|
|
110,503 |
|
|
Depreciation and amortization |
|
|
4,247 |
|
|
2,476 |
|
|
5,310 |
|
|
Total operating expenses |
|
|
174,803 |
|
|
138,192 |
|
|
115,813 |
|
|
Operating income |
|
|
72,677 |
|
|
62,219 |
|
|
46,303 |
|
|
Interest expense, net |
|
|
27,174 |
|
|
36,759 |
|
|
42,382 |
|
|
Loss on extinguishment of debt |
|
|
2,715 |
|
|
36,046 |
|
|
— |
|
|
Income (loss) before income taxes |
|
|
42,788 |
|
|
(10,586) |
|
|
3,921 |
|
|
Income tax provision (benefit) |
|
|
15,722 |
|
|
(14,160) |
|
|
4,357 |
|
|
Net income (loss) |
|
$ |
27,066 |
|
$ |
3,574 |
|
$ |
(436) |
|
|
Per Share Data: |
|
|
|
|
|
|
|
|
|
|
|
Net income (loss) per common share: |
|
|
|
|
|
|
|
|
|
|
|
Basic |
|
$ |
0.49 |
|
$ |
0.07 |
|
$ |
(0.01) |
|
|
Diluted |
|
$ |
0.48 |
|
$ |
0.07 |
|
$ |
(0.01) |
|
|
Weighted average shares outstanding: |
|
|
|
|
|
|
|
|
|
|
|
Basic |
|
|
55,414,037 |
|
|
50,836,727 |
|
|
50,836,727 |
|
|
Diluted |
|
|
56,892,183 |
|
|
51,732,752 |
|
|
50,836,727 |
|
|
Balance Sheet Data: |
|
|
|
|
|
|
|
|
|
|
|
Cash and cash equivalents |
|
$ |
7,092 |
|
$ |
5,428 |
|
$ |
4,706 |
|
|
Inventories, net |
|
|
243,795 |
|
|
176,388 |
|
|
142,256 |
|
|
Property and equipment, net |
|
|
340,358 |
|
|
272,776 |
|
|
220,084 |
|
|
Total assets |
|
|
1,213,393 |
|
|
1,054,810 |
|
|
968,315 |
|
|
Current portion of long-term debt and financing obligations |
|
|
3,691 |
|
|
3,789 |
|
|
758 |
|
|
Long-term debt |
|
|
299,606 |
|
|
422,610 |
|
|
369,990 |
|
|
Financing obligations |
|
|
19,937 |
|
|
19,017 |
|
|
19,683 |
|
|
Total Shareholders' equity |
|
|
534,870 |
|
|
369,153 |
|
|
360,916 |
|
|
Operational Data: |
|
|
|
|
|
|
|
|
|
|
|
Total stores at end of period |
|
|
123 |
|
|
100 |
|
|
81 |
|
|
New stores opened |
|
|
24 |
|
|
20 |
|
|
16 |
|
|
Comparable store sales |
|
|
3.7% |
|
|
3.9% |
|
|
8.3% |
|
35
ITEM 7. MANAGEMENT’S DISCUSSION AND ANALYSIS OF FINANCIAL CONDITION AND RESULTS OF OPERATIONS
This discussion and analysis of the financial condition and results of our operations should be read in conjunction with “Item 6. Selected Financial and Operating Data” and our consolidated financial statements and related notes of At Home Group Inc. included in Item 15 of this Annual Report on Form 10-K. You should review “Item 1A. Risk Factors” section of this filing for a discussion of important factors that could cause actual results to differ materially from the results described in or implied by any forward-looking statements contained in the following discussion and analysis.
We operate on a fiscal calendar widely used by the retail industry that results in a given fiscal year consisting of a 52- or 53-week period ending on the last Saturday in January. In a 52-week fiscal year, each quarter contains 13 weeks of operations; in a 53-week fiscal year, each of the first, second and third quarters includes 13 weeks of operations and the fourth quarter includes 14 weeks of operations. References to a fiscal year mean the year in which that fiscal year ends. References herein to “fiscal year 2017” relate to the 52 weeks ending January 28, 2017, references herein to “fiscal year 2016” relate to the 52 weeks ended January 30, 2016, references herein to “fiscal year 2015” relate to the 53 weeks ended January 31, 2015 and references herein to “fiscal year 2014” relate to the 52 weeks ended January 25, 2014.
Overview
At Home is the leading home décor superstore based on the number of our locations and our large format stores that we believe dedicate more space per store to home décor than any other player in the industry. We are focused on providing the broadest assortment of products for any room, in any style, for any budget. We utilize our space advantage to out-assort our competition, offering over 50,000 SKUs throughout our stores. Our differentiated merchandising strategy allows us to identify on-trend products and then value engineer those products to provide desirable aesthetics at attractive price points for our customers. Over 70% of our products are unbranded, private label or specifically designed for us. We believe that our broad and comprehensive offering and compelling value proposition combine to create a leading destination for home décor with the opportunity to continue taking market share in a large, fragmented and growing market.
We were founded in 1979 in Garden Ridge, Texas, a suburb of San Antonio. After we were acquired in 2011 by a group of investors led by AEA, including affiliates of Starr Investments, we began a series of strategic investments in our business that we believe have laid the foundation for continued profitable growth. During fiscal years 2014 and 2015, we invested approximately $85 million in capital in connection with the following strategic initiatives:
|
· |
We moved our Company headquarters from Houston to Plano to take advantage of the concentration of retail talent in the Dallas / Fort Worth area. |
|
· |
We significantly increased the number of people within all functional areas, resulting in a well-rounded team with a deep bench of experience, in addition to building out our executive team. |
|
· |
We implemented rigorous, systematic processes which have allowed us to accelerate new store openings while delivering strong financial results. |
|
· |
We upgraded and automated our distribution center and expanded its capacity to service our growing store base. |
|
· |
We completed a rebranding of our Company from Garden Ridge to At Home in fiscal year 2015, an important milestone which has strengthened our brand message and better communicates our position as the leading home décor superstore. |
36
Our strengthened management team, new brand identity, improved real estate capabilities, upgraded and automated distribution center and enhanced information systems should enable us to expand our store base while maintaining our industry-leading profitability.
As of January 28, 2017, our store base is comprised of 123 large format stores across 30 states, averaging approximately 115,000 square feet per store. Over the past five completed fiscal years we have opened 77 new stores and we believe there is significant whitespace opportunity to increase our store count in both existing and new markets.
Trends and Other Factors Affecting Our Business
Various trends and other factors affect or have affected our operating results, including:
Overall economic trends. The overall economic environment and related changes in consumer behavior have a significant impact on our business. In general, positive conditions in the broader economy promote customer spending in our stores, while economic weakness results in a reduction of customer spending. Macroeconomic factors that can affect customer spending patterns, and thereby our results of operations, include employment rates, business conditions, changes in the housing market, the availability of credit, interest rates, tax rates and fuel and energy costs.
Consumer preferences and demand. Our ability to maintain our appeal to existing customers and attract new customers depends on our ability to originate, develop and offer a compelling product assortment responsive to customer preferences and design trends. If we misjudge the market for our products, we may be faced with excess inventories for some products and may be required to become more promotional in our selling activities, which would impact our net sales and gross profit.
New store openings. We expect new stores will be the key driver of the growth in our sales and operating profit in the future. Our results of operations have been and will continue to be materially affected by the timing and number of new store openings. The performance of new stores may vary depending on various factors such as the store opening date, the time of year of a particular opening, the amount of store opening costs, the amount of store occupancy costs and the location of the new store, including whether it is located in a new or existing market. For example, we typically incur higher than normal employee costs at the time of a new store opening associated with set-up and other opening costs. In addition, in response to the interest and excitement generated when we open a new store, the new stores generally experience higher net sales during the initial period of one to three months after which the new store’s net sales will begin to normalize as it reaches maturity within six months of opening, as further discussed below.
Our planned store expansion will place increased demands on our operational, managerial, administrative and other resources. Managing our growth effectively will require us to continue to enhance our store management systems, financial and management controls and information systems. We will also be required to hire, train and retain store management and store personnel which, together with increased marketing costs, can affect our operating margins.
A new store typically reaches maturity, meaning the store’s annualized targeted sales volume has been reached, within six months of opening. New stores are included in the comparable store base during the sixteenth full fiscal month following the store’s opening, which we believe represents the most appropriate comparison. We also periodically explore opportunities to relocate a limited number of existing stores to improve location, lease terms, store layout or customer experience. Relocated stores typically achieve a level of operating profitability comparable to our company-wide average for existing stores more quickly than new stores.
Rebranding initiative. During the fiscal year ended January 31, 2015, we launched a significant rebranding initiative through which we spent over $20 million in capital and expenses to change our brand and corporate name and convert and refresh all of our stores. We changed our name from “Garden Ridge” to “At Home”, a name that we believe better communicates our positioning as the leading home décor superstore. We completed the rebranding initiative during the first nine months of fiscal year 2015 and now all of our stores operate under the At Home brand.
Infrastructure investment. Our historical operating results reflect the impact of our ongoing investments to support our growth. We have made significant investments in our business that we believe have laid the foundation for
37
continued profitable growth. We believe that our strengthened management team, new brand identity, upgraded and automated distribution center and enhanced information systems, including our warehouse management and POS systems, enable us to replicate our profitable store format and differentiated shopping experience. In addition, during fiscal year 2016, we implemented a merchandise planning system and upgraded our inventory allocation system to better manage inventory for each store and corresponding customer base. We expect these infrastructure investments to support our successful operating model over a significantly expanded store base.
Pricing strategy. We are committed to providing our products at everyday low prices. We value engineer products in collaboration with our suppliers to recreate the “look” that we believe our customer wants while eliminating the costly construction elements that our customer does not value. We believe our customer views shopping At Home as an in-person experience through which our customer can see and feel the quality of our products and physically assemble a desired aesthetic. This design approach allows us to deliver an attractive value to our customers, as our products are typically less expensive than other branded products with a similar look. We employ a simple everyday low pricing strategy that consistently delivers savings to our customers without the need for extensive promotions, as evidenced by 80% of our net sales occurring at full price.
Our ability to source and distribute products effectively. Our net sales and gross profit are affected by our ability to purchase our products in sufficient quantities at competitive prices. While we believe our vendors have adequate capacity to meet our current and anticipated demand, our level of net sales could be adversely affected in the event of constraints in our supply chain, including the inability of our vendors to produce sufficient quantities of some merchandise in a manner that is able to match market demand from our customers, leading to lost sales.
Fluctuation in quarterly results. Our quarterly results have historically varied depending upon a variety of factors, including our product offerings, promotional events, store openings and shifts in the timing of holidays, among other things. As a result of these factors, our working capital requirements and demands on our product distribution and delivery network may fluctuate during the year.
Inflation and deflation trends. Our financial results can be expected to be directly impacted by substantial increases in product costs due to commodity cost increases or general inflation which could lead to a reduction in our sales as well as greater margin pressure as costs may not be able to be passed on to consumers. To date, changes in commodity prices and general inflation have not materially impacted our business. In response to increasing commodity prices or general inflation, we seek to minimize the impact of such events by sourcing our merchandise from different vendors, changing our product mix or increasing our pricing when necessary.
Refinancings. In June 2015, we entered into the Term Loan and the Second Lien Term Loan (together with the Term Loan, the “Term Loan Facilities”). The proceeds of these term loans were used to refinance and redeem in full our 10.75% senior secured notes due 2019, which reduced our overall cost of capital. In addition, we used net proceeds from our initial public offering and partial exercise of the over-allotment option to repay in full the $130.0 million of principal amount of indebtedness outstanding under the Second Lien Term Loan which further reduced our cost of capital and debt service obligations. For more information, please see “—Liquidity and Capital Resources”.
53rd week. Our fiscal year 2015 consisted of 53 weeks. Fiscal years 2017 and 2016 each consisted of 52 weeks. The 53rd week of fiscal year 2015 contributed $7.8 million to net sales. Please see “—Results of Operations” below for further discussion of the impact of the 53rd week on net sales.
How We Assess the Performance of Our Business
In assessing our performance, we consider a variety of performance and financial measures. The key measures include net sales, gross profit and gross margin, and selling, general and administrative expenses. In addition, we also review other important metrics such as Adjusted EBITDA, Store-level Adjusted EBITDA and Adjusted Net Income (Loss).
38
Net Sales
Net sales are derived from direct retail sales to customers in our stores, net of merchandise returns and discounts. Growth in net sales is impacted by opening new stores and increases in comparable store sales.
New store openings
The number of new store openings reflects the new stores opened during a particular reporting period, including any relocations of existing stores during such period. Before we open new stores, we incur pre-opening costs, as described below. The total number of new stores per year and the timing of store openings has, and will continue to have, an impact on our results as described above in “—Trends and Other Factors Affecting Our Business”.
Comparable store sales
A store is included in the comparable store sales calculation on the first day of the sixteenth full fiscal month following the store's opening, which is when we believe comparability is achieved. When a store is being relocated or remodeled, we exclude sales from that store in the calculation of comparable store sales until the first day of the sixteenth full fiscal month after it reopens. In addition, when applicable, we adjust for the effect of the 53rd week. There may be variations in the way in which some of our competitors and other retailers calculate comparable or “same store” sales. As a result, data in this report regarding our comparable store sales may not be comparable to similar data made available by other retailers.
Comparable store sales allow us to evaluate how our store base is performing by measuring the change in period-over-period net sales in stores that have been open for the applicable period. Various factors affect comparable store sales, including:
|
· |
consumer preferences, buying trends and overall economic trends; |
|
· |
our ability to identify and respond effectively to customer preferences and trends; |
|
· |
our ability to provide an assortment of high quality and trend-right product offerings that generate new and repeat visits to our stores; |
|
· |
the customer experience we provide in our stores; |
|
· |
our ability to source and receive products accurately and timely; |
|
· |
changes in product pricing, including promotional activities; |
|
· |
the number of items purchased per store visit; |
|
· |
weather; and |
|
· |
timing and length of holiday shopping periods. |
Opening new stores is an important part of our growth strategy. As we continue to pursue our growth strategy, we anticipate that an increasing percentage of our net sales will come from stores not included in our comparable store sales calculation. Accordingly, comparable store sales are only one measure we use to assess the success of our growth strategy.
Gross Profit and Gross Margin
Gross profit is determined by subtracting cost of sales from our net sales. Gross margin measures gross profit as a percentage of net sales.
39
Cost of sales consists of various expenses related to the cost of selling our merchandise. Cost of sales consists of the following: (1) cost of merchandise, net of inventory shrinkage, damages and vendor allowances; (2) inbound freight and internal transportation costs such as distribution center-to-store freight costs; (3) costs of operating our distribution center, including labor, occupancy costs, supplies, and depreciation; and (4) store occupancy costs including rent, insurance, taxes, common area maintenance, utilities, repairs and maintenance and depreciation. The components of our cost of sales expenses may not be comparable to other retailers.
Selling, General and Administrative Expenses
Selling, general and administrative expenses (“SG&A”) consist of various expenses related to supporting and facilitating the sale of merchandise in our stores. These costs include payroll, benefits and other personnel expenses for corporate and store employees, including stock-based compensation expense, consulting, legal and other professional services expenses, marketing and advertising expenses, occupancy costs for our corporate headquarters and various other expenses.
SG&A includes both fixed and variable components and, therefore, is not directly correlated with net sales. In addition, the components of our SG&A expenses may not be comparable to those of other retailers. We expect that our SG&A expenses will increase in future periods due to our continuing store growth. In addition, any increase in future stock option or other stock-based grants or modifications will increase our stock-based compensation expense included in SG&A. In particular, the one-time bonus grant of stock options to certain members of our senior management in connection with our initial public offering which will result in incremental non-cash stock-based compensation expense of approximately $20.0 million, which is being expensed over the derived service period beginning in the third quarter of fiscal 2017 and continuing over the following eight quarters.
Adjusted EBITDA
Adjusted EBITDA is a key metric used by management and our board of directors to assess our financial performance. Adjusted EBITDA is also the basis for performance evaluation under our current executive compensation programs. In addition, Adjusted EBITDA is frequently used by analysts, investors and other interested parties to evaluate companies in our industry. In addition to covenant compliance and executive performance evaluations, we use Adjusted EBITDA to supplement generally accepted accounting principles in the United States of America (“GAAP”) measures of performance to evaluate the effectiveness of our business strategies, to make budgeting decisions and to compare our performance against that of other peer companies using similar measures.
Adjusted EBITDA is defined as net income (loss) before interest expense, net, loss from early extinguishment of debt, income tax (benefit) provision and depreciation and amortization, adjusted for the impact of certain other items as defined in our debt agreements, including certain legal settlements and consulting and other professional fees, costs associated with new store openings, relocation and employee recruiting incentives, management fees and expenses, stock-based compensation expense, impairment of our trade name and non-cash rent. For a reconciliation of Adjusted EBITDA to net income (loss), the most directly comparable GAAP measure, see “—Results of Operations”.
Store-level Adjusted EBITDA
We use Store-level Adjusted EBITDA as a supplemental measure of our performance, which represents our Adjusted EBITDA excluding the impact of certain corporate overhead expenses that we do not consider in our evaluation of the ongoing operating performance of our stores from period to period. Our calculation of Store-level Adjusted EBITDA is a supplemental measure of operating performance of our stores and may not be comparable to similar measures reported by other companies. We believe that Store-level Adjusted EBITDA is an important measure to evaluate the performance and profitability of each of our stores, individually and in the aggregate, especially given the level of investments we have made in our home office and infrastructure over the past four years to support future growth. We also believe that Store-level Adjusted EBITDA is a useful measure in evaluating our operating performance because it removes the impact of general and administrative expenses, which are not incurred at the store level, and the costs of opening new stores, which are non-recurring at the store-level, and thereby enables the comparability of the
40
operating performance of our stores during the period. We use Store-level Adjusted EBITDA information to benchmark our performance versus competitors. Store-level Adjusted EBITDA should not be used as a substitute for consolidated measures of profitability of performance because it does not reflect corporate overhead expenses that are necessary to allow us to effectively operate our stores and generate Store-level Adjusted EBITDA. For a reconciliation of Store-level Adjusted EBITDA to net income (loss), the most directly comparable GAAP measure, see “—Results of Operations”.
Adjusted Net Income (Loss)
Adjusted Net Income (Loss) represents our net income (loss), adjusted for loss on extinguishment of debt, initial public offering related non-cash stock-based compensation expense and initial public offering transaction costs. We present Adjusted Net Income (Loss) because we believe it assists investors and analysts in comparing our performance across reporting periods on a consistent basis by excluding items that we do not believe are indicative of our core operating performance. For a reconciliation of Adjusted Net Income (Loss) to net income (loss), the most directly comparable GAAP measure, see “—Results of Operations”.
41
Results of Operations
The following tables summarize key components of our results of operations for the periods indicated, both in dollars and as a percentage of our net sales:
|
|
|
Fiscal Year Ended |
|
|||||||
|
|
|
January 28, 2017 |
|
January 30, 2016 |
|
January 31, 2015 |
|
|||
|
|
|
|
|
|
|
|
|
|
|
|
|
Statement of Operations Data: |
|
|
|
|
|
|
|
|
||
|
Net sales |
|
$ |
765,635 |
|
$ |
622,161 |
|
$ |
497,733 |
|
|
Cost of sales |
|
|
518,155 |
|
|
421,750 |
|
|
335,617 |
|
|
Gross profit |
|
|
247,480 |
|
|
200,411 |
|
|
162,116 |
|
|
Operating expenses |
|
|
|
|
|
|
|
|
|
|
|
Selling, general and administrative expenses |
|
|
170,556 |
|
|
135,716 |
|
|
110,503 |
|
|
Depreciation and amortization |
|
|
4,247 |
|
|
2,476 |
|
|
5,310 |
|
|
Total operating expenses |
|
|
174,803 |
|
|
138,192 |
|
|
115,813 |
|
|
Operating income |
|
|
72,677 |
|
|
62,219 |
|
|
46,303 |
|
|
Interest expense, net |
|
|
27,174 |
|
|
36,759 |
|
|
42,382 |
|
|
Loss on extinguishment of debt |
|
|
2,715 |
|
|
36,046 |
|
|
— |
|
|
Income (loss) before income taxes |
|
|
42,788 |
|
|
(10,586) |
|
|
3,921 |
|
|
Income tax provision (benefit) |
|
|
15,722 |
|
|
(14,160) |
|
|
4,357 |
|
|
Net income (loss) |
|
$ |
27,066 |
|
$ |
3,574 |
|
$ |
(436) |
|
|
Percentage of Net Sales: |
|
|
|
|
|
|
|
|
|
|
|
Net sales |
|
|
100.0% |
|
|
100.0% |
|
|
100.0% |
|
|
Cost of sales |
|
|
67.7% |
|
|
67.8% |
|
|
67.4% |
|
|
Gross profit |
|
|
32.3% |
|
|
32.2% |
|
|
32.6% |
|
|
Operating Expenses |
|
|
|
|
|
|
|
|
|
|
|
Selling, general and administrative expenses |
|
|
22.3% |
|
|
21.8% |
|
|
22.2% |
|
|
Depreciation and amortization |
|
|
0.6% |
|
|
0.4% |
|
|
1.1% |
|
|
Total operating expenses |
|
|
22.8% |
|
|
22.2% |
|
|
23.3% |
|
|
Operating income |
|
|
9.5% |
|
|
10.0% |
|
|
9.3% |
|
|
Interest expense, net |
|
|
3.5% |
|
|
5.9% |
|
|
8.5% |
|
|
Loss on extinguishment of debt |
|
|
0.4% |
|
|
5.8% |
|
|
—% |
|
|
Income (loss) before income taxes |
|
|
5.6% |
|
|
(1.7)% |
|
|
0.8% |
|
|
Income tax provision (benefit) |
|
|
2.1% |
|
|
(2.3)% |
|
|
0.9% |
|
|
Net income (loss) |
|
|
3.5% |
|
|
0.6% |
|
|
(0.1)% |
|
|
Operational Data: |
|
|
|
|
|
|
|
|
|
|
|
Total stores at end of period |
|
|
123 |
|
|
100 |
|
|
81 |
|
|
New stores opened |
|
|
24 |
|
|
20 |
|
|
16 |
|
|
Comparable store sales |
|
|
3.7% |
|
|
3.9% |
|
|
8.3% |
|
|
Non-GAAP Measures(1): |
|
|
|
|
|
|
|
|
|
|
|
Store-level Adjusted EBITDA(2) |
|
$ |
198,987 |
|
$ |
168,573 |
|
$ |
133,122 |
|
|
Store-level Adjusted EBITDA margin(2) |
|
|
26.0% |
|
|
27.1% |
|
|
26.7% |
|
|
Adjusted EBITDA(2) |
|
$ |
138,312 |
|
$ |
115,270 |
|
$ |
95,552 |
|
|
Adjusted EBITDA margin(2) |
|
|
18.1% |
|
|
18.5% |
|
|
19.2% |
|
|
Adjusted Net Income (Loss)(3) |
|
$ |
32,652 |
|
$ |
(8,722) |
|
$ |
(457) |
|
|
(1) |
We present Adjusted EBITDA, Adjusted EBITDA margin, Store-level Adjusted EBITDA, Store-level Adjusted EBITDA margin and Adjusted Net Income (Loss), which are not recognized financial measures under GAAP, because we believe they assist investors and analysts in comparing our operating performance across reporting periods on a consistent basis by excluding items that we do not believe are indicative of our core operating performance, such as interest, depreciation, amortization, loss on extinguishment of debt and taxes, as well as costs related to new store openings, which are incurred on a limited basis with respect to any particular store when opened and are not indicative of ongoing core operating performance. You are encouraged to evaluate these adjustments and the reasons we consider them appropriate for supplemental analysis. In evaluating Adjusted EBITDA, Store-level Adjusted EBITDA and Adjusted Net Income (Loss), you should be aware that in the future we may incur expenses that are the same as or similar to some of the adjustments in our presentation of Adjusted EBITDA, Store-level Adjusted EBITDA and Adjusted Net Income (Loss). In particular, Store-level Adjusted EBITDA does not reflect corporate overhead expenses that are necessary to allow us to effectively operate our stores and generate Store-level Adjusted EBITDA. Our presentation of Adjusted EBITDA, Store-level Adjusted EBITDA and Adjusted Net Income (Loss) should not be construed |
42
as an inference that our future results will be unaffected by unusual or non-recurring items. There can be no assurance that we will not modify the presentation of Adjusted EBITDA, Store-level Adjusted EBITDA and Adjusted Net Income (Loss) in the future, and any such modification may be material. In addition, Adjusted EBITDA, Adjusted EBITDA margin, Store-level Adjusted EBITDA, Store-level Adjusted EBITDA margin and Adjusted Net Income (Loss) may not be comparable to similarly titled measures used by other companies in our industry or across different industries. |
Management believes Adjusted EBITDA is helpful in highlighting trends in our core operating performance, while other measures can differ significantly depending on long-term strategic decisions regarding capital structure, the tax jurisdictions in which companies operate and capital investments. We also use Adjusted EBITDA in connection with performance evaluations for our executives; to supplement GAAP measures of performance in the evaluation of the effectiveness of our business strategies; to make budgeting decisions; and to compare our performance against that of other peer companies using similar measures. In addition, we utilize Adjusted EBITDA in certain calculations under our ABL Facility (defined therein as “Consolidated EBITDA”) and our Term Loan Facilities (defined therein as “Consolidated Cash EBITDA”). Management believes Store-level Adjusted EBITDA is helpful in highlighting trends because it facilitates comparisons of store operating performance from period to period by excluding the impact of certain corporate overhead expenses, such as certain costs associated with management, finance, accounting, legal and other centralized corporate functions. Management believes that Adjusted Net Income (Loss) assists investors and analysts in comparing our performance across reporting periods on a consistent basis by excluding items we do not believe are indicative of our core operating performance.
|
(2) |
The following table reconciles our net income (loss) to EBITDA (excluding loss on extinguishment of debt), Adjusted EBITDA and Store-level Adjusted EBITDA for the periods presented (in thousands): |
|
|
|
Fiscal Year Ended |
|
|||||||
|
|
|
January 28, 2017 |
|
January 30, 2016 |
|
January 31, 2015 |
|
|||
|
|
|
|
|
|
|
|
|
|
||
|
Net income (loss) |
|
$ |
27,066 |
|
$ |
3,574 |
|
$ |
(436) |
|
|
Interest expense, net |
|
|
27,174 |
|
|
36,759 |
|
|
42,382 |
|
|
Loss on extinguishment of debt |
|
|
2,715 |
|
|
36,046 |
|
|
— |
|
|
Income tax provision (benefit) |
|
|
15,722 |
|
|
(14,160) |
|
|
4,357 |
|
|
Depreciation and amortization(a) |
|
|
36,925 |
|
|
28,694 |
|
|
23,317 |
|
|
EBITDA |
|
$ |
109,602 |
|
$ |
90,913 |
|
$ |
69,620 |
|
|
Legal settlements and consulting and other professional services(b) |
|
|
2,478 |
|
|
3,506 |
|
|
4,633 |
|
|
Costs associated with new store openings(c) |
|
|
12,035 |
|
|
9,801 |
|
|
6,848 |
|
|
Relocation and employee recruiting costs(d) |
|
|
262 |
|
|
724 |
|
|
2,928 |
|
|
Management fees and expenses(e) |
|
|
1,847 |
|
|
3,612 |
|
|
3,596 |
|
|
Stock-based compensation expense(f) |
|
|
4,066 |
|
|
4,663 |
|
|
4,251 |
|
|
Stock-based compensation related to special one-time IPO bonus grant(g) |
|
|
5,318 |
|
|
— |
|
|
— |
|
|
Non-cash rent(h) |
|
|
2,320 |
|
|
2,398 |
|
|
1,795 |
|
|
Other(i) |
|
|
384 |
|
|
(347) |
|
|
1,881 |
|
|
Adjusted EBITDA |
|
$ |
138,312 |
|
$ |
115,270 |
|
$ |
95,552 |
|
|
Corporate overhead expenses(j) |
|
|
60,675 |
|
|
53,303 |
|
|
37,570 |
|
|
Store-level Adjusted EBITDA |
|
$ |
198,987 |
|
$ |
168,573 |
|
$ |
133,122 |
|
|
(a) |
Includes the portion of depreciation and amortization expenses that are classified as cost of sales in our consolidated statements of operations. |
|
(b) |
Primarily consists of (i) consulting and other professional fees with respect to tax consulting services as well as completed projects to enhance our accounting and finance capabilities and other public company readiness initiatives, of $2.5 million, $3.5 million and $2.8 million for fiscal years 2017, 2016 and 2015, respectively and (ii) litigation settlement charges and related legal fees for certain claims and legal costs for other matters relating to events that arose prior to our acquisition by our Sponsors that have concluded in the amounts of $1.8 million for fiscal year 2015. Adjustments related to such items for the other periods presented were not material. |
|
(c) |
Non-capital expenditures associated with opening new stores, including marketing and advertising, labor and cash occupancy expenses. We anticipate that we will continue to incur cash costs as we open new stores in the future. We opened 24, 20 and 16 new stores in fiscal years 2017, 2016 and 2015, respectively. |
|
(d) |
Primarily reflects employee recruiting and relocation costs in connection with the build-out of our management team. |
43
|
(e) |
Reflects management fees paid to our Sponsors in accordance with our management agreement. In connection with our initial public offering, the management agreement was terminated on August 3, 2016 and our Sponsors no longer receive management fees from us. |
|
(f) |
Non-cash stock-based compensation related to the ongoing equity incentive program that we have in place to incentivize and retain management. |
|
(g) |
Non-cash stock-based compensation associated with a special one-time initial public offering bonus grant to senior executives, which we do not consider in our evaluation of our ongoing performance. The grant was made in addition to the ongoing equity incentive program that we have in place to incentivize and retain management and was made to reward certain senior executives for historical performance and allow them to benefit from future successful outcomes for our Sponsors. |
|
(h) |
Consists of the non-cash portion of rent, which reflects (i) the extent to which our GAAP straight-line rent expense recognized exceeds or is less than our cash rent payments, partially offset by (ii) the amortization of deferred gains on sale-leaseback transactions that are recognized to rent expense on a straight-line basis through the applicable lease term. The offsetting amounts relating to the amortization of deferred gains on sale-leaseback transactions were $(4.7) million, $(3.2) million and $(1.8) million for fiscal years 2017, 2016 and 2015, respectively. The GAAP straight-line rent expense adjustment can vary depending on the average age of our lease portfolio, which has been impacted by our significant growth. For newer leases, our rent expense recognized typically exceeds our cash rent payments while for more mature leases, rent expense recognized is typically less than our cash rent payments. |
|
(i) |
Other adjustments include amounts our management believes are not representative of our ongoing operations, including: |
|
· |
for fiscal year 2017, a loss of $0.3 million recognized on the sale of land in connection with the expansion of our distribution center; |
|
· |
for fiscal year 2016, gain on the sale of our property in Houston, Texas of $(1.8) million and $(0.3) million related to various refunds for prior period taxes and audits, partially offset by $0.5 million in expenses incurred for a store closure; and |
|
· |
for fiscal year 2015, asset retirements related to our rebranding of $0.6 million and $0.4 million for a store relocation. |
|
(j) |
Reflects corporate overhead expenses, which are not directly related to the profitability of our stores, to facilitate comparisons of store operating performance as we do not consider these corporate overhead expenses when evaluating the ongoing performance of our stores from period to period. Corporate overhead expenses, which are a component of selling, general and administrative expenses, are comprised of various home office general and administrative expenses such as payroll expenses, occupancy costs, marketing and advertising, and consulting and professional fees. See our discussion of the changes in selling, general and administrative expenses presented in “—Results of Operations”. Store-level Adjusted EBITDA should not be used as a substitute for consolidated measures of profitability or performance because it does not reflect corporate overhead expenses that are necessary to allow us to effectively operate our stores and generate Store-level Adjusted EBITDA. We anticipate that we will continue to incur corporate overhead expenses in future periods. |
|
(3) |
The following table reconciles our net income (loss) to Adjusted Net Income (Loss) for the periods presented (in thousands): |
|
|
|
Fiscal Year Ended |
|
|||||||
|
|
|
January 28, 2017 |
|
January 30, 2016 |
|
January 31, 2015 |
|
|||
|
|
|
|
|
|
|
|
|
|
||
|
Net income (loss) as reported |
|
$ |
27,066 |
|
$ |
3,574 |
|
$ |
(436) |
|
|
Adjustments: |
|
|
|
|
|
|
|
|
|
|
|
Loss on extinguishment of debt |
|
|
2,715 |
|
|
36,046 |
|
|
— |
|
|
Stock-based compensation related to special one-time IPO bonus grant(a) |
|
|
5,318 |
|
|
— |
|
|
— |
|
|
IPO transaction costs(b) |
|
|
797 |
|
|
373 |
|
|
193 |
|
|
Tax impact of adjustments to net income (loss)(c) |
|
|
(3,244) |
|
|
(48,715) |
|
|
(214) |
|
|
Adjusted Net Income (Loss) |
|
$ |
32,652 |
|
$ |
(8,722) |
|
$ |
(457) |
|
|
(a) |
Non-cash stock-based compensation associated with a special one-time initial public offering bonus grant to senior executives, which we do not consider in our evaluation of our ongoing performance. The grant was made in addition to the ongoing equity |
44
incentive program that we have in place to incentivize and retain management and was made to reward certain senior executives for historical performance and allow them to benefit from future successful outcomes for our Sponsors. |
|
(b) |
Charges incurred in connection with our initial public offering, which we do not expect to recur and do not consider in our evaluation of our ongoing performance. |
|
(c) |
Represents the tax impact associated with the adjusted expenses utilizing the effective tax rate in effect during the periods presented. The effective tax rate for fiscal years 2017, 2016 and 2015 was 36.7%, 133.8% and 111.1%, respectively. |
Fiscal Year Ended January 28, 2017 Compared to Fiscal Year Ended January 30, 2016
Net Sales
Net sales increased $143.4 million, or 23.1%, to $765.6 million for the fiscal year ended January 28, 2017 from $622.2 million for the fiscal year ended January 30, 2016. The increase was primarily driven by approximately $122.8 million of incremental revenue from the net addition of 23 new stores opened since January 30, 2016 as well as a number of stores that were opened during fiscal year 2016 but had not yet been open for 15 months to be included in the comparable store base. The remaining $20.6 million increase in net sales is attributable to comparable store sales which increased 3.7% during the fiscal year ended January 28, 2017, driven primarily by our merchandising initiatives.
Cost of Sales
Cost of sales increased $96.4 million, or 22.9%, to $518.2 million for the fiscal year ended January 28, 2017 from $421.8 million for the fiscal year ended January 30, 2016. This increase was primarily driven by the 23.1% increase in net sales for the fiscal year ended January 28, 2017 compared to the fiscal year ended January 30, 2016, which resulted in a $65.9 million increase in merchandise costs. In addition, during the fiscal year ended January 28, 2017, we recognized a $6.5 million increase in depreciation and amortization and a $20.0 million increase in store occupancy costs, in each case as a result of new store openings since January 30, 2016 as well as throughout fiscal year 2016.
Gross Profit and Gross Margin
Gross profit was $247.5 million, or 32.3% of net sales, for the fiscal year ended January 28, 2017, an increase from $200.4 million, or 32.2% of net sales, for the fiscal year ended January 30, 2016. The increase in gross profit was primarily driven by increased sales volume from the net addition of 23 new stores opened since January 30, 2016 as well as a 3.7% increase in comparable stores sales. Gross margin increased 10 basis points during the fiscal year ended January 28, 2017 when compared to the fiscal year ended January 30, 2016. The 10 basis point increase is primarily due to a reduction in product-related costs, such as shrink, damages and freight, driven by operational improvements. This increase was partially offset by higher occupancy costs resulting from the sale-leaseback transactions that occurred in fiscal year 2017 and fiscal year 2016 as discussed in “—Liquidity and Capital Resources”. In addition, gross margin was also impacted by higher distribution center costs associated with incremental investments in low-priced inventory during the fiscal year ended January 28, 2017 compared to the fiscal year ended January 30, 2016. Gross margins for new stores did not differ materially from those of comparable stores during the fiscal year ended January 28, 2017 compared to the fiscal year ended January 30, 2016, primarily as a result of the short six month period to maturity of new stores, following which the performance of new stores was consistent with comparable stores in each such period.
Selling, General and Administrative Expenses
Selling, general and administrative expenses were $170.6 million for the fiscal year ended January 28, 2017 compared to $135.7 million for the fiscal year ended January 30, 2016, an increase of $34.9 million or 25.7%. As a percentage of sales, SG&A increased 50 basis points for the fiscal year ended January 28, 2017 to 22.3% from 21.8% for the fiscal year ended January 30, 2016, primarily due to stock-based compensation expenses associated with the special one-time IPO bonus grant issued under the At Home Group Inc. Equity Incentive Plan, which was subsequently amended and restated and approved by the Board in July 2016 (the “2016 Equity Plan”), transaction costs related to the initial public offering and an increase in advertising expenses, which were partially offset by leverage of recurring corporate overhead expenses. SG&A expenses include corporate overhead expenses, which represented $10.3 million of
45
the increase, attributable to additional home office support capabilities as well as increased payroll expenses incurred to support our growth strategies, stock-based compensation expenses associated with the special one-time IPO bonus grant issued under the 2016 Equity Plan, transaction costs related to the initial public offering and consulting and other professional fees relating to public company readiness initiatives. In addition, we recognized a $0.3 million loss on the sale of land in connection with the expansion of our distribution center during the fiscal year ended January 28, 2017. SG&A expenses also include expenses related to store operations, which represented $19.6 million of the increase primarily driven by a $11.2 million increase in payroll expenses due to new store headcount and labor cost associated with the incremental investments in low-priced inventory. Additionally, there was a $2.2 million increase in store pre-opening costs due to the increased number of new store openings and the timing of new store openings during the fiscal year ended January 28, 2017 compared to the fiscal year ended January 30, 2016 as well as increases in various other administrative costs to support the continued growth in our store base. In addition, we recognized a $1.8 million gain on the sale of a property in Houston, Texas during the fiscal year ended January 30, 2016.
The remaining increase in selling, general and administrative expenses was related to advertising expenses, which are included in SG&A. Total advertising expenses were $17.4 million for the fiscal year ended January 28, 2017 compared to $12.4 million for the fiscal year ended January 30, 2016, an increase of $5.0 million or 40.3%. The increase was driven by our efforts to continue to build brand awareness. Store pre-opening costs include additional marketing and advertising expenses of $2.2 million and $1.0 million for the fiscal years ended January 28, 2017 and January 30, 2016, respectively. In fiscal year 2017, we expanded our marketing and advertising spend to 2.6% of net sales, up from 2.2% of net sales in fiscal year 2016.
Interest Expense, Net
Interest expense, net decreased to $27.2 million for the fiscal year ended January 28, 2017 from $36.8 million for the fiscal year ended January 30, 2016, a decrease of $9.6 million. The decrease in interest expense primarily resulted from the June 2015 Refinancing and the repayment of our $130.0 million senior secured second lien term loan facility from net proceeds obtained through our initial public offering (the “Second Lien Repayment”). See “—Liquidity and Capital Resources”.
Loss on Extinguishment of Debt
During the fiscal year ended January 28, 2017, we recognized a loss on extinguishment of debt of $2.7 million resulting from the Second Lien Repayment, compared to $36.0 million resulting from the June 2015 Refinancing for the fiscal year ended January 30, 2016. The loss on extinguishment of debt for the fiscal year ended January 28, 2017 primarily relates to the write-off of unamortized deferred debt issuance costs. The loss on extinguishment of debt for the fiscal year ended January 30, 2016 includes the write-off of $7.0 million of unamortized deferred debt issuance costs.
Income Tax Provision
Income tax expense was $15.7 million for the fiscal year ended January 28, 2017 compared to a benefit of $14.2 million for the fiscal year ended January 30, 2016. The effective tax rate for the fiscal year ended January 28, 2017 was 36.7% compared to 133.8% for the fiscal year ended January 30, 2016. The effective tax rate for the fiscal year ended January 28, 2017 differs from the federal statutory rate primarily due to the impact of state and local income taxes, the release of unrecognized tax benefits, valuation on state net operating losses, nondeductible transaction costs and nondeductible interest expense. The effective income tax rate differs significantly from federal statutory rate for the fiscal year ended January 30, 2016 primarily due to the impact of state income taxes and changes in the valuation allowance on our deferred tax assets.
Fiscal Year Ended January 30, 2016 Compared to Fiscal Year Ended January 31, 2015
Net Sales
Net sales increased $124.5 million, or 25.0%, to $622.2 million for the fiscal year ended January 30, 2016 from $497.7 million for the fiscal year ended January 31, 2015. The increase was primarily driven by approximately $114.8
46
million of incremental revenue from the net addition of 19 new stores since January 31, 2015, as well as an approximately $17.5 million increase from comparable store sales, which increased 3.9% during the fiscal year ended January 30, 2016, driven primarily by our merchandising initiatives. The fiscal year ended January 31, 2015 had 53 weeks and this additional week contributed approximately $7.8 million in additional net sales during the period. Excluding the impact of the 53rd week, net sales increased 27.0% during the fiscal year ended January 30, 2016 compared to the fiscal year ended January 31, 2015. In addition, comparable store sales for the fiscal year ended January 31, 2015 reflected the impact of our rebranding initiative during fiscal year 2015, which resulted in an 8.3% increase in comparable store sales as compared to the fiscal year ended January 25, 2014.
Cost of Sales
Cost of sales increased $86.2 million, or 25.7%, to $421.8 million for the fiscal year ended January 30, 2016 from $335.6 million for the fiscal year ended January 31, 2015. This increase was primarily driven by the 25.0% increase in net sales for the fiscal year ended January 30, 2016 compared to the fiscal year ended January 31, 2015, which resulted in a $55.5 million increase in merchandise costs. In addition, during the fiscal year ended January 30, 2016, we recognized an $8.2 million increase in depreciation and amortization and a $14.2 million increase in store occupancy costs, in each case as a result of new store openings during the period.
Gross Profit and Gross Margin
Gross profit was $200.4 million, or 32.2% of net sales, for the fiscal year ended January 30, 2016, an increase from $162.1 million, or 32.6% of net sales, for the fiscal year ended January 31, 2015. The increase in gross profit was primarily driven by increased sales volume from the net addition of 19 new stores opened since January 31, 2015 as well as a 3.9% increase in comparable stores sales. Gross margin declined 40 basis points during the fiscal year ended January 30, 2016 primarily due to increased depreciation expense during the period as a result of purchased stores and ground up builds that were opened throughout fiscal year 2015 and fiscal year 2016. Gross margins for new stores did not materially differ from those of comparable stores during the fiscal year ended January 30, 2016 or the fiscal year ended January 31, 2015, primarily as a result of the short six month period to maturity of new stores, as discussed under “—Trends and Other Factors Affecting Our Business—New store openings”, following which the performance of new stores was consistent with comparable stores in each such period.
Selling, General and Administrative Expenses
Selling, general and administrative expenses were $135.7 million for the fiscal year ended January 30, 2016 compared to $110.5 million for the fiscal year ended January 31, 2015, an increase of $25.2 million or 22.8%. As a percentage of sales, SG&A for the fiscal year ended January 30, 2016 was 21.8% compared to 22.2% for the fiscal year ended January 31, 2015. SG&A expenses include corporate overhead expenses, which represented $14.3 million of the increase, resulting from additional home office support capabilities as well as increased marketing and advertising expenses, occupancy and consulting and professional fees incurred to support our growth strategies. In addition, corporate overhead expenses for the fiscal year ended January 31, 2015 reflected the impact of a $2.1 million reduction due to proceeds received on an insurance matter. The remaining $10.9 million in increased selling, general and administrative expenses that was contributed by store operations was primarily driven by a $7.5 million increase in payroll expenses resulting from new store headcount. Additionally, there was a $3.3 million increase in store pre-opening costs for new stores opening during fiscal years 2016 and 2017 and various other administrative costs to support the continued growth in our store base. These increases were partially offset by a $1.8 million gain recognized on the sale of a property in Houston, Texas in the fiscal year ended January 30, 2016.
Interest Expense, Net
Interest expense, net decreased to $36.8 million in the fiscal year ended January 30, 2016 from $42.4 million in the fiscal year ended January 31, 2015, a decrease of $5.6 million. The decrease in interest expense resulted from the June 2015 Refinancing. See “—Liquidity and Capital Resources”.
47
Loss on Extinguishment of Debt
During the fiscal year ended January 30, 2016, we recognized a loss on extinguishment of debt of approximately $36.0 million resulting from the June 2015 Refinancing. The loss on extinguishment of debt also includes the write-off of $7.0 million of unamortized deferred debt issuance costs.
Income Tax Provision
Income tax benefit was $14.2 million for the fiscal year ended January 30, 2016 compared to income tax expense of $4.4 million for the fiscal year ended January 31, 2015. The effective tax rate for the fiscal year ended January 30, 2016 was 133.8% compared to 111.1% for the fiscal year ended January 31, 2015. The effective tax rate for the fiscal year ended January 30, 2016 differs significantly from the federal statutory rate primarily due to the impact of the reversal of the valuation allowance we had historically maintained on our deferred tax assets and, to a lesser extent, the reduction of our reserve for uncertain tax positions. The effective tax rate for the fiscal year ended January 31, 2015 differs from the federal statutory rate because of the impact of state income taxes as well as changes in reserves for uncertain tax positions and changes in our federal valuation allowance on deferred tax assets.
When evaluating our valuation allowance, we are required to assess the available positive and negative evidence to estimate if sufficient future income will be generated to utilize deferred tax assets. In making our assessment as of January 30, 2016, we considered the four sources of taxable income described in Accounting Standards Codification (“ASC”) 740-10-30-18 and determined that three sources of future income were available: (1) future taxable income exclusive of reversing temporary differences and carryforwards; (2) reversing taxable temporary differences; and (3) the carryback of losses resulting from the reversals of deductible temporary differences in excess of reversing taxable temporary differences. We did not, however, identify any tax planning strategies which would serve as a source of future income.
We believe the cumulative pre-tax income is a significant piece of positive evidence that allows us to consider other subjective evidence such as future forecasted pre-tax income. For the fiscal year ended January 31, 2015, we determined we had three years of cumulative pre-tax income after excluding the $37.5 million tradename impairment recognized during the fiscal year 2014, which we consider to be unusual in nature because it was a result of our rebranding initiative. However, we did not believe that our three year cumulative pre-tax income position was positive evidence that we could consider because our rebranding efforts were still in the early stages and we had not yet demonstrated our ability to forecast our results of operations. For the fiscal year ended January 30, 2016, after excluding the tradename impairment, we determined that we continued to have three years of cumulative pre-tax income. In addition, taxable income (loss) exceeded pre-tax income (loss) for the fiscal year ended January 30, 2016 and for each of the two preceding fiscal years. As of January 30, 2016, we have completed approximately 18 months of operations following our rebranding initiative as well as demonstrated our ability to more accurately forecast the results of our operations. We concluded that because of this positive evidence, along with taxable income in the prior two fiscal years to absorb loss carrybacks that would be generated by reversing deductible differences in excess of reversing taxable differences, as well as cumulative pre-tax income (exclusive of the tradename impairment) in recent fiscal years, it was more likely than not that our deferred tax assets would be realized in future years. Accordingly, during fiscal year 2016 we reversed $6.0 million of the valuation allowance on deferred tax assets, with an offsetting credit to the provision for income taxes.
We concluded that deferred tax assets of $0.6 million related to state income tax net operating loss carryforwards would likely not be realizable in the future and that a valuation allowance for state deferred tax assets was appropriate as of January 30, 2016.
Liquidity and Capital Resources
Our principal sources of liquidity are our cash generated by operating activities, proceeds from sale-leaseback transactions and borrowings under our ABL Facility. Historically, we have financed our operations primarily from cash generated from operations and periodic borrowings under our ABL Facility. Our primary cash needs are for day-to-day operations, to provide for infrastructure investments in our stores, to finance new store openings, to pay interest and
48
principal on our indebtedness and to fund working capital requirements for seasonal inventory builds and new store inventory purchases.
As of January 28, 2017, we had $7.1 million of cash and cash equivalents and $108.4 million in borrowing availability under our ABL Facility. There were $3.6 million in face amount of letters of credit that had been issued under the ABL Facility at that date. In June 2016, we amended the agreement governing the ABL Facility (“ABL Credit Agreement”) to exercise the $75.0 million accordion feature which increased the aggregate revolving commitments from $140.0 million to $215.0 million. The availability under our ABL Facility is determined in accordance with a borrowing base which can decline due to various factors. Therefore, amounts under our ABL Facility may not be available when we need them.
In June 2015, we entered into the Term Loan Facilities. A portion of the proceeds from the Term Loan Facilities was used to refinance and redeem our Senior Secured Notes, which has reduced our interest expense. The interest rates on the Term Loan Facilities are variable; based on LIBOR rates in effect at June 5, 2015, we were subject to interest payments on the term loans at a blended effective rate of 6.2%. For additional details on such debt agreements entered into in June 2015, see “—Term Loan Facilities”. Historically, we were not subject to principal amortization payments under the Indenture governing the Senior Secured Notes. The Term Loan is repayable in equal quarterly installments of approximately $0.8 million and, prior to its repayment, the Second Lien Term Loan did not require periodic principal payments.
On August 3, 2016, our Registration Statement on Form S-1 relating to our initial public offering was declared effective by the SEC pursuant to which we registered an aggregate of 9,967,050 shares of our common stock (including 1,300,050 shares subject to the underwriters' over-allotment option). We issued and sold 8,667,000 of the shares registered at a price of $15.00 per share on August 9, 2016, resulting in net proceeds of $120.9 million after deducting underwriters' discounts and commissions of $9.1 million. We also incurred offering expenses of $6.0 million in connection with the initial public offering, which are included in additional paid-in capital in the consolidated balance sheets as of January 28, 2017.
On September 8, 2016, we issued and sold a further 863,041 shares of our common stock pursuant to the underwriters’ partial exercise of the over-allotment option. This exercise of the over-allotment option resulted in net proceeds to us of $12.0 million after deducting underwriters’ discounts and commissions of $0.9 million.
We used the net proceeds from the initial public offering and partial exercise of the over-allotment option, after deducting underwriters’ discounts and commissions, to repay in full the $130.0 million of principal amount of indebtedness outstanding under our Second Lien Term Loan.
Our capital expenditures can vary depending on the timing of new store openings and infrastructure-related investments. Capital expenditures for the fiscal year ended January 28, 2017 were approximately $62.1 million, net of proceeds from the sale of property and equipment, which includes sale-leaseback proceeds, of approximately $62.1 million. We estimate that our capital expenditures for the fiscal year ending January 27, 2018 will be in the range of $110 million to $130 million, net of proceeds from sale-leaseback transactions of $100 million. We plan to invest in the infrastructure necessary to support the further development of our business and continued growth. During fiscal year 2017, we opened 23 new stores, net of one relocated store. Net capital expenditures incurred to date have been substantially financed with cash from operating activities, sale-leaseback transactions and proceeds from our ABL Facility. We expect fiscal year 2018 net capital expenditures to be financed in the same manner.
Based on our growth plans, we believe that our cash position, net cash provided by operating activities and borrowings under our ABL Facility will be adequate to finance our planned capital expenditures, working capital requirements and debt service obligations over the next twelve months and the foreseeable future thereafter. If cash flows from operations and borrowings under our ABL Facility are not sufficient or available to meet our capital requirements, then we will be required to obtain additional equity or debt financing in the future. There can be no assurance that equity or debt financing will be available to us when we need it or, if available, that the terms will be satisfactory to us and not dilutive to our then-current shareholders.
49
Our indebtedness could adversely affect our ability to raise additional capital, limit our ability to react to changes in the economy or our industry, expose us to interest rate risk and prevent us from meeting our obligations. Management reacts strategically to changes in economic conditions and monitors compliance with debt covenants to seek to mitigate any potential material impacts to our financial condition and flexibility.
Sale-Leaseback Transactions
As part of our flexible real estate strategy, we utilize sale-leaseback transactions to finance investments previously made for the purchase of second generation properties and the construction of new store locations. This enhances our ability to access a range of locations and facilities efficiently. We factor sale-leaseback transactions into our capital allocation decisions. In order to support the execution of sale-leaseback transactions, we have relationships with publicly traded REITs, many of which have demonstrated interest in our portfolio of assets.
In certain cases, the sale is treated as a like-kind exchange transaction for U.S. federal income tax purposes in accordance with Section 1031 of the Internal Revenue Code (the “Code”). Section 1031 of the Code allows companies to defer the taxable gain realized from the sale of certain “relinquished” real property if the proceeds are reinvested, in a timely manner, in qualifying like-kind “replacement” property. In addition, Section 1031 of the Code requires the sale proceeds of the relinquished property to be held in a restricted cash account by a third-party qualified intermediary, pending utilization thereof for the acquisition of a qualifying replacement property.
In September 2014, we sold four of our properties in Raleigh, North Carolina; Mesa, Arizona; Lubbock, Texas; and Louisville, Kentucky for a total of $40.9 million. Contemporaneously with the closing of the sale, we entered into four leases, pursuant to which they leased back the properties for cumulative initial annual rent of $2.8 million, subject to annual escalations. The sale of the properties located in Lubbock, Texas and Louisville, Kentucky are being treated as like-kind exchanges for U.S. federal income tax purposes in accordance with Section 1031 of the Code.
In January 2015, we sold our property located in Omaha, Nebraska for approximately $8.0 million. Contemporaneously with the closing of the sale, we entered into a lease, pursuant to which we leased back the property for cumulative initial annual rent of $0.5 million, subject to annual escalations.
In September 2015, we sold five of our properties in Grand Prairie, Texas; Toledo, Ohio; Pharr, Texas; New Braunfels, Texas; and Gulfport, Mississippi for a total of $40.2 million. Contemporaneously with the closing of the sale, we entered into a lease pursuant to which we leased back the properties for cumulative initial annual rent of $2.7 million, subject to annual escalations. Approximately $5.5 million of the proceeds from the sale were used to pay off notes payable related the Grand Prairie and New Braunfels properties.
In August 2016, we sold four properties in Broomfield, Colorado; Corpus Christi, Texas; Jenison, Michigan; and Buford, Georgia for a total of $32.6 million. Contemporaneously with the closing of the sale, we entered into a lease pursuant to which we leased back the properties for cumulative initial annual rent of $2.2 million, subject to annual escalations. Approximately $3.7 million of the proceeds from the sale were used to pay off a note payable related the Corpus Christi property.
In September 2016, we sold three properties in Colorado Springs, Colorado; Kissimmee, Florida; and O’Fallon, Illinois for a total of $30.6 million. Contemporaneously with the closing of the sale, we entered into a lease pursuant to which we leased back the properties for cumulative initial annual rent of $2.1 million, subject to annual escalations.
See “Risk Factors—Risks Relating to Our Business—We are subject to risks associated with our sale-leaseback strategy”.
50
Summary of Cash Flows
A summary of our cash flows from operating, investing and financing activities is presented in the following table (in thousands):
|
|
|
Fiscal Year Ended |
|
|||||||
|
|
|
January 28, 2017 |
|
January 30, 2016 |
|
January 31, 2015 |
|
|||
|
|
|
|
|
|
|
|
|
|
|
|
|
Net Cash Provided by Operating Activities |
|
$ |
43,498 |
|
$ |
14,913 |
|
$ |
15,321 |
|
|
Net Cash Used in Investing Activities |
|
|
(63,174) |
|
|
(39,727) |
|
|
(100,098) |
|
|
Net Cash Provided by Financing Activities |
|
|
21,340 |
|
|
25,536 |
|
|
84,512 |
|
|
Net Increase (Decrease) in Cash and Cash Equivalents |
|
|
1,664 |
|
|
722 |
|
|
(265) |
|
Net Cash Provided by (Used in) Operating Activities
Net cash provided by operating activities was $43.5 million for the fiscal year ended January 28, 2017 compared to $14.9 million during the fiscal year ended January 30, 2016. The $28.6 million increase in cash provided by operating activities was primarily due to a decrease in payments for accounts payable of $30.6 million as well as a decrease in payments for accrued liabilities of $24.8 million, both related to the timing of payments, a decrease in cash paid for interest of $19.1 million and an increase in operating income of $10.5 million. These sources of cash were partially offset by an increase in purchases of merchandise inventories of $33.3 million and an increase in cash paid for income taxes of $29.7 million. Inventory levels at the end of fiscal year 2017 were $243.8 million, an increase of $67.4 million, or 38.2%, from the end of fiscal year 2016. The increase in inventories was primarily due to new store growth during fiscal year 2016 and fiscal year 2017, an acceleration of inventory purchases into late fiscal year 2017, which includes the impact of an earlier Chinese New Year, and incremental investments in low-priced inventory.
Net cash provided by operating activities was $14.9 million for the fiscal year ended January 30, 2016 compared to $15.3 million for the fiscal year ended January 31, 2015. The $0.4 million decrease in cash provided by operating activities was primarily due to a $9.2 million and $17.8 million decrease in inventory in transit and accounts payable, respectively, which was primarily driven by the build of inventory in preparation for new store openings in early fiscal year 2017 as well as a shift in the timing of the Chinese New Year, resulting in the acceleration of inventory purchases in late fiscal year 2016. Additionally, accrued interest decreased $6.4 million due to the timing of interest payments due under our Senior Secured Notes compared to the Term Loan Facilities at the end of fiscal year 2016. These decreases in cash provided by operating activities were offset by a $15.9 million increase in operating income as well as a $12.0 million decrease in cash paid for income taxes.
Net Cash Used in Investing Activities
Net cash used in investing activities was $63.2 million for the fiscal year ended January 28, 2017 compared to $39.7 million for the fiscal year ended January 30, 2016. The $23.5 million increase in cash used in investing activities was primarily driven by a decrease of $17.7 million in net restricted cash proceeds attributable to sale-leaseback transactions for which the sale was treated as a like-kind exchange in accordance with Section 1031 of the Code as well as an increase in capital expenditures of $5.2 million, net of proceeds from the sale of property and equipment. Capital expenditures of $124.3 million for the fiscal year ended January 28, 2017 consisted of $96.2 million invested in new store growth with the remaining $28.1 million primarily related to investments in information technology, our distribution center and existing stores. Capital expenditures of $102.5 million for the fiscal year ended January 30, 2016 consisted of $86.4 million invested in new store growth with the remaining $16.1 million being primarily related to investments in maintenance expenditures and information technology.
Net cash used in investing activities was $39.7 million for the fiscal year ended January 30, 2016 compared to $100.1 million for the fiscal year ended January 31, 2015. The $60.4 million decrease in cash used was primarily driven by an additional $18.2 million in capital expenditures during the fiscal year ended January 31, 2015 as a result of more purchased stores and ground up builds during that period as compared to more leased stores during the fiscal year ended January 30, 2016, as well as $17.1 million in capital expenditures incurred during the fiscal year ended January 31, 2015
51
to support our rebranding initiative. Capital expenditures of $102.5 million for the fiscal year ended January 30, 2016 consisted of $86.4 million invested in new store growth with the remaining $16.1 million primarily related to maintenance expenditures and investments in information technology. Capital expenditures during the fiscal year ended January 30, 2016 were offset by $17.2 million in net restricted cash proceeds, which were primarily related to sale-leaseback transactions that were consummated where the sale was treated as a like-kind exchange transaction in accordance with Section 1031 of the Code. In addition, during the fiscal year ended January 30, 2016, we received $6.3 million in proceeds from the sale of a property in Houston, Texas as well as $39.2 million in net proceeds resulting from a sale-leaseback transaction where we sold five of our properties in Grand Prairie, Texas, Toledo, Ohio, Pharr, Texas, New Braunfels, Texas and Gulfport, Mississippi. During the fiscal year ended January 31, 2015, we received $36.8 million in net proceeds from sale-leaseback transactions where we sold our property in Omaha, Nebraska as well as four properties in Raleigh, North Carolina, Mesa, Arizona, Lubbock, Texas and Louisville, Kentucky.
Net Cash Provided by Financing Activities
Net cash provided by financing activities was $21.3 million for the fiscal year ended January 28, 2017 compared to $25.5 million for the fiscal year ended January 30, 2016, a decrease of $4.2 million primarily due to $27.3 million of net proceeds from borrowings under our Term Loan Facilities after payment of related debt issuance costs and the redemption of the Senior Secured Notes during the fiscal year ended January 30, 2016. This decrease was partially offset by net proceeds from borrowings under our ABL Facility increasing $15.8 million during the fiscal year ended January 28, 2017 and payments on long-term debt decreasing $4.4 million due to the payoff of notes payable in fiscal year 2016 and fiscal year 2017. Net proceeds from financing activities during fiscal year 2017 due to our initial public offering were $132.9 million after deducting underwriters' discounts and commissions, which was mostly offset by the use of $130.0 million to effect the Second Lien Repayment of $130.0 million.
Net cash provided by financing activities was $25.5 million for fiscal year ended January 30, 2016 compared to $84.5 million for the fiscal year ended January 31, 2015, a decrease of $59.0 million primarily due to a $58.2 million decrease in net proceeds from borrowings under our ABL Facility.
Financing Obligations
In some cases, the assets we lease require construction in order to ready the space for its intended use and, in certain cases, we are involved in the construction of leased assets. The construction period typically begins when we execute our lease agreement with the landlord and continues until the space is substantially complete and ready for its intended use. In accordance with ASC 840-40-55 (Topic 840, “Leases”), we must consider the nature and extent of our involvement during the construction period and, in some cases, our involvement results in our being considered the accounting owner of the construction project. By completing the construction of key structural components of a leased building, we are deemed to have participated in the construction of the landlord's asset. In such cases, we capitalize the landlord's construction costs, including the value of costs incurred up to the date we execute our lease and costs incurred during the remainder of construction period, as such costs are incurred. Additionally, ASC 840-40-55 requires us to recognize a financing obligation for construction costs incurred by the landlord. Once construction is complete, we are required to perform a sale-leaseback analysis pursuant to ASC 840-40 to determine if we can remove the landlord's assets and associated financing obligations from our consolidated balance sheets. In certain leases, we maintain various forms of “prohibited continuing involvement” in the property, thereby precluding us from derecognizing the asset and associated financing obligations following the construction completion. In those cases, we will continue to account for the landlord's asset as if we are the legal owner, and the financing obligation, similar to other debt, until the lease expires or is modified to remove the continuing involvement that prohibits derecognition. Once derecognition is permitted, we would be required to account for the lease as either operating or capital in accordance with ASC 840. As of January 28, 2017, we have not derecognized any landlord assets or associated financing obligations.
Term Loan Facilities
On June 5, 2015, At Home Holding III Inc. (the “Borrower”) entered into a first lien credit agreement (the “First Lien Agreement”), by and among the Borrower, At Home Holding II Inc. (“At Home II”), certain indirect subsidiaries of At Home II, various lenders and Bank of America, N.A., as administrative agent and collateral agent. The First Lien
52
Agreement provides for the Term Loan, which amount was borrowed on June 5, 2015. The Term Loan will mature on June 3, 2022, and is repayable in equal quarterly installments of approximately $0.8 million for an annual aggregate amount equal to 1% of the original principal amount of $300.0 million. The Borrower has the option of paying interest on a 1-month, 2-month or quarterly basis on the Term Loan at an annual rate of LIBOR (subject to a 1% floor) plus 4.00%, subject to, after a qualifying initial public offering, a 0.50% reduction if the Borrower achieves a specified secured net leverage ratio level, which was met subsequent to our initial public offering for the fiscal year ended January 28, 2017.
The Term Loan permits us to add one or more incremental term loans up to $50.0 million plus additional amounts subject to our compliance with a first lien net leverage ratio test. The first lien net leverage ratio test is calculated using Adjusted EBITDA, which is defined as “Consolidated EBITDA” under our credit agreement.
The Term Loan has various non-financial covenants, customary representations and warranties, events of defaults and remedies substantially similar to those described in respect of the ABL Facility below. There are no financial maintenance covenants in the Term Loan. As of January 28, 2017 and January 30, 2016, we were in compliance with all covenants prescribed under the Term Loan.
At our option, the Term Loan was prepayable on or prior to June 5, 2016 subject to, in the case of a repricing transaction, a prepayment premium equal to the principal amount of Term Loan subject to such prepayment multiplied by 1%. Any prepayment of all or any portion of the outstanding Term Loan after June 5, 2016 is not subject to a premium.
On June 5, 2015, the Borrower entered into a second lien credit agreement (the “Second Lien Agreement”), by and among the Borrower, At Home II and Dynasty Financial II, LLC, as administrative agent, collateral agent and lender. The Second Lien Agreement provided for the Second Lien Term Loan, which amount was borrowed on June 5, 2015. The Second Lien Term Loan had a maturity date of June 5, 2023 and did not require periodic principal payments, with the total amount outstanding, plus accrued interest, due at maturity. The Borrower had the option of paying interest on a 1-month, 2-month or quarterly basis on the Second Lien Term Loan at an annual rate of LIBOR (subject to a 1% floor) plus 8.00%. We were in compliance with all covenants prescribed under the Second Lien Term Loan as of January 30, 2016. As discussed below, the Second Lien Term Loan was no longer outstanding as of January 28, 2017.
We refer to the Term Loan and, until the Second Lien Repayment, the Second Lien Term Loan, collectively as the “Term Loan Facilities”.
The Borrower used the net proceeds from the Term Loan Facilities (i) to effect the refinancing of all outstanding indebtedness under the Senior Secured Notes, (ii) to pay fees and expenses in connection with the Term Loan Facilities of approximately $13.6 million, (iii) to repay $29.2 million in amounts outstanding under the ABL Facility, and (iv) for general corporate purposes.
We used the net proceeds from the initial public offering and partial exercise of the over-allotment option, after deducting underwriters’ discounts and commissions, to effect the Second Lien Repayment for total cash consideration of $130.4 million, including $0.4 million of accrued interest. The repayment resulted in a loss on extinguishment of debt in the amount of $2.7 million, which was recognized during the fiscal year ended January 28, 2017.
10.75% Senior Secured Notes Due 2019
In May 2012, At Home Holding III Inc. (“At Home III”) issued $360.0 million aggregate principal amount of 10.75% senior secured notes that were scheduled to mature on June 1, 2019 (the “Senior Secured Notes”). The terms of the Senior Secured Notes were governed by the Indenture (the “Indenture”), dated May 16, 2012, among At Home III, the guarantors party thereto and Wells Fargo, National Association (the “Trustee”). Interest was payable semi-annually in arrears on each June 1st and December 1st, commencing on December 1, 2012.
The Senior Secured Notes were fully and unconditionally guaranteed, jointly and severally, on a senior secured basis by our domestic restricted subsidiaries. The Senior Secured Notes and the related guarantees were secured, subject
53
to certain exceptions, by (i) a first priority lien on substantially all of our and the guarantors' assets (other than inventory and accounts receivable and related assets, which assets secure our ABL Facility on a first priority basis (the “ABL Priority Collateral”)), including first priority liens on any capital stock held by us or a guarantor, and (ii) a second priority lien on the ABL Priority Collateral.
The Indenture contained customary covenants limiting At Home III's and its restricted subsidiaries' operations. It also provided for events of default that, in certain circumstances, permitted acceleration of the payment of principal, premium, if any, and interest on the then outstanding Senior Secured Notes.
On June 5, 2015, At Home III completed the redemption of the Senior Secured Notes at a price equal to 108.063% for total cash consideration of $389.4 million, which includes a $29.0 million early redemption premium and $0.4 million of accrued interest. The redemption resulted in a loss on extinguishment of debt in the amount of $36.0 million, which includes the write-off of $7.0 million of unamortized deferred debt issuance costs.
Asset-Based Lending Credit Facility
In October 2011, we entered into the ABL Facility which provided for cash borrowings or issuances of letters of credit based on defined percentages of eligible inventory and credit card receivable balances up to a maximum facility limit of $80.0 million. In May 2012, we entered into the First Amendment to the ABL Credit Agreement, which amended the ABL Facility to, among other things, permit the Senior Secured Notes. In May 2013, we entered into the Second Amendment to the ABL Credit Agreement, which amended the ABL Facility to increase the facility limit to $90.0 million, extend the maturity from October 2016 to May 2018, reduce the interest rate and fees and amended various other covenants and related definitions. In July 2014, we entered into the Third Amendment to the ABL Credit Agreement which further amended the ABL Facility to modify certain financial terms and other covenants. Such modifications included increasing the facility from $90.0 million to $140.0 million; extending the scheduled maturity date from May 2018 to July 2019; reducing the margin on borrowings by 0.25%; providing for the release of certain real property collateral in specified circumstances; adding Wells Fargo Bank, National Association as a new lender under the facility and amending various other covenants, terms and related definitions to provide additional flexibility with the facility. In September 2014, we entered into the Assumption and Ratification Agreement, which updated the names of the loan parties to reflect our corporate restructuring and rebranding. On June 5, 2015, At Home III also entered into the Fourth Amendment to the ABL Credit Agreement which further amended the ABL Facility to modify certain provisions of the agreement to, among other things, permit the Term Loan Facilities to be issued and amend certain terms in the ABL Facility to be consistent with the terms set forth in the Term Loan Facilities. In June 2016, we amended our ABL Facility to exercise the $75.0 million accordion feature of the ABL Facility, which increased the aggregate revolving commitments from $140.0 million to $215.0 million and increased the sublimit for the issuance of letters of credit from $10.0 million to $25.0 million. The other terms of the ABL Facility were not changed by that amendment.
The ABL Facility is secured by substantially all of our assets with a first priority lien on ABL Priority Collateral and a second priority lien (as between the ABL Facility Lenders and the Term Loan Facility Lenders) on all non-ABL Priority Collateral.
Borrowings under the ABL Facility bear interest at a rate per annum equal to, at our option: (x) the higher of (i) the Federal Funds Rate plus 1/2 of 1.00%, (ii) the bank's prime rate and (iii) LIBOR plus 1.00%, plus in each case, an applicable margin of 0.25% to 0.75% based on our availability or (y) the bank's LIBOR rate plus an applicable margin of 1.25% to 1.75% based on our availability. The effective interest rate was approximately 2.00% for each of the fiscal years ended January 28, 2017, January 30, 2016 and January 31, 2015, respectively.
As of January 28, 2017, approximately $101.6 million was outstanding under the ABL Facility, approximately $3.6 million in face amount of letters of credit had been issued and we had availability of approximately $108.4 million.
The ABL Facility contains a number of covenants that, among other things, restrict our ability to, subject to specified exceptions, incur additional debt; incur additional liens and contingent liabilities; sell or dispose of assets; merge with or acquire other companies; liquidate or dissolve ourselves; engage in businesses that are not in a related line of business; make loans, advances or guarantees; pay dividends; engage in transactions with affiliates; and make
54
investments. In addition, the ABL Facility contains certain cross-default provisions. There are no financial maintenance covenants in the ABL Facility. However, during the existence of an event of default or when we fail to maintain availability of at least the greater of $10.0 million or 10% of the line cap, the consolidated fixed charge coverage ratio of the most recently completed period of four consecutive quarters must be 1.00 to 1.00 or higher. As of January 28, 2017 and January 30, 2016, we were in compliance with all covenants under the ABL Facility.
Contractual Obligations
We enter into long-term obligations and commitments in the normal course of business, primarily debt obligations and non-cancelable operating leases. As of January 28, 2017, our contractual cash obligations over the next several periods were as follows (in thousands):
|
|
|
Total |
|
Less than |
|
1 to |
|
3 to |
|
More than |
|
|||||
|
|
|
|
|
|
|
|
|
|
|
|
|
|
|
|
|
|
|
Operating lease commitments(1) |
|
$ |
927,043 |
|
$ |
70,840 |
|
$ |
143,884 |
|
$ |
134,829 |
|
$ |
577,490 |
|
|
Capital lease commitments(2) |
|
|
9,136 |
|
|
623 |
|
|
8,513 |
|
|
— |
|
|
— |
|
|
Long-term debt obligations(3) |
|
|
301,599 |
|
|
3,152 |
|
|
6,332 |
|
|
6,373 |
|
|
285,742 |
|
|
Revolving credit facility(4) |
|
|
101,575 |
|
|
101,575 |
|
|
— |
|
|
— |
|
|
— |
|
|
Estimated interest payments(5) |
|
|
78,850 |
|
|
14,446 |
|
|
27,158 |
|
|
26,536 |
|
|
10,710 |
|
|
Financing obligations(6) |
|
|
18,925 |
|
|
1,916 |
|
|
3,877 |
|
|
3,982 |
|
|
9,150 |
|
|
Contractual tax obligations(7) |
|
|
2,553 |
|
|
2,553 |
|
|
— |
|
|
— |
|
|
— |
|
|
Total |
|
$ |
1,439,681 |
|
$ |
195,105 |
|
$ |
189,764 |
|
$ |
171,720 |
|
$ |
883,092 |
|
|
(1) |
Our operating lease commitments include leases for property used in our operations. Amounts shown do not reflect operating leases that are classified as financing obligations. |
|
(2) |
Our capital lease commitments include leases for property used in our operations. |
|
(3) |
Long-term debt obligations include principal payments due under our Term Loan and note payable. |
|
(4) |
Revolving credit facility includes principal payments due on our ABL Facility. |
|
(5) |
Interest expense on long-term debt includes future interest payments on outstanding obligations under our Term Loan and notes payable as well as payments due on our ABL Facility. Our ABL Facility bears interest at variable rates and this table is based on rates in effect as of January 28, 2017. |
|
(6) |
Includes base lease terms for properties where we have been deemed to be the accounting owner of the landlord's property in accordance with accounting guidance related to leases. |
|
(7) |
Represents the liability reported in accordance with the provisions of ASC 740 (Topic 740 “Income Taxes”). For further information related to unrecognized tax benefits, see Note 9 – Income Taxes to the consolidated financial statements included in this Report. |
Off-Balance Sheet Arrangements
We have not historically entered into off-balance sheet arrangements. We do enter into operating lease commitments, letters of credit and purchase obligations in the normal course of our operations.
Critical Accounting Policies and Use of Estimates
The preparation of financial statements in accordance with GAAP requires management to make estimates and assumptions that affect the reported amounts of assets, liabilities, revenues, and expenses, as well as the related disclosures of contingent assets and liabilities at the date of the financial statements. Management evaluates its accounting policies, estimates, and judgments on an ongoing basis. Management bases its estimates and judgments on historical experience and various other factors that are believed to be reasonable under the circumstances. Actual results may differ from these estimates under different assumptions and conditions.
Management evaluated the development and selection of its critical accounting policies and estimates and believes that the following involve a higher degree of judgment or complexity and are most significant to reporting our results of operations and financial position, and are therefore discussed as critical. The following critical accounting policies reflect the significant estimates and judgments used in the preparation of our consolidated financial statements. With respect to critical accounting policies, even a relatively minor variance between actual and expected experience can
55
potentially have a materially favorable or unfavorable impact on subsequent results of operations. More information on all of our significant accounting policies can be found in Note 1—Nature of Operations and Summary of Significant Accounting Policies to our audited consolidated financial statements included elsewhere in this report.
Inventories
Inventories are comprised of finished merchandise and are stated at the lower of cost or net realizable value with cost determined using the weighted-average method. The cost of inventories include the actual landed cost of an item at the time it is received in our distribution center, or at the point of shipment for certain international shipments, as well as transportation costs to our distribution center and to our retail stores, if applicable. Net inventory cost is recognized through cost of sales when the inventory is sold.
Vendor allowances, which primarily represent volume rebates and cooperative advertising funds, are recorded as a reduction of the cost of the merchandise inventories and a subsequent reduction in cost of sales when the inventory is sold. We generally earn vendor allowances as a percentage of certain merchandise purchases with no minimum purchase requirements. Typically, our vendor allowance programs extend for a period of twelve months.
Physical inventory counts are performed for our stores at least once per year by a third-party inventory counting service for stores that have been in operation for at least one year. Inventory records are adjusted to reflect actual inventory counts and any resulting shortage (“shrinkage”) is recognized. Reserves for shrinkage are estimated and recorded throughout the period as a percentage of net sales based on the most recent physical inventory, in combination with current events and historical experience. We have loss prevention programs and policies in place intended to mitigate shrinkage. A 10% increase in our estimated shrinkage reserve rate would have affected net income by approximately $0.9 million for fiscal year 2017. We also evaluate our merchandise to ensure that the expected net realizable value of the merchandise held at the end of a fiscal period exceeds cost. In the event that the expected net realizable value is less than cost, we reduce the value of that inventory accordingly.
Goodwill
Goodwill is tested for impairment at least annually at the operating segment level; we have only one operating segment and we do not have a reporting unit that exists below our operating segment. If the implied fair value of goodwill is lower than its carrying amount, goodwill impairment is indicated and goodwill is written down to its implied fair value. We assess the business enterprise value using a combination of the income approach and market approach to determine the fair value of the Company to be compared against the carrying value of net assets. The income approach, using the discounted cash flow method, includes key factors used in the valuation of the Company (a Level 3 valuation) which include, but are not limited to, management's plans for future operations, recent operating results, income tax rates, and discounted projected future cash flows.
No impairment of goodwill was recognized during the fiscal years ended January 28, 2017, January 30, 2016 or January 31, 2015. However, the use of different assumptions, estimates or judgments with respect to the estimation of the projected future cash flows and the determination of the discount rate and sales growth rate used to calculate the net present value of projected future cash flows could materially increase or decrease our estimates of fair value. Additionally, future impairment charges could be required if we do not achieve our current net sales and profitability projections, which would occur if we are not able to meet our new store growth targets, or the weighted average cost of capital increases.
Impairment of Long-Lived Assets
We evaluate the recoverability of the carrying value of long-lived assets whenever events or changes in circumstances indicate their carrying amount may not be recoverable. Our evaluation compares the carrying value of the assets with their estimated future undiscounted cash flows expected to result from the use and eventual disposition of the assets. We evaluate long-lived intangible assets at an individual store level, which is the lowest level of identifiable cash flows. We evaluate corporate assets or other long-lived assets that are not store-specific at the consolidated level.
56
To estimate store-specific future cash flows, we make assumptions about key store variables, including sales, growth rate, gross margin, payroll and other controllable expenses. Stores that are owned by us and do not meet the initial criteria are further evaluated taking into consideration the fair market value of the property compared to the carrying value of the assets. Furthermore, management considers other factors when evaluating stores for impairment, including the individual store's execution of its operating plan and other local market conditions. Our estimates are subject to uncertainty and may be affected by a number of factors outside our control, including general economic conditions and the competitive environment.
An impairment is recognized once all the factors noted above are taken into consideration and it is determined that the carrying amount of the store's assets are not recoverable. The impairment loss would be recognized in the amount by which the carrying amount of a long-lived asset exceeds its fair value, excluding assets that can be redeployed. No impairment of long-term assets was recognized during the fiscal years ended January 28, 2017, January 30, 2016 or January 31, 2015.
We test indefinite-lived trade name intangible assets annually for impairment or more frequently if impairment indicators arise. If the fair value of the indefinite-lived intangible asset is lower than its carrying amount, the asset is written down to its fair value. The fair value of our trade name (a Level 3 valuation) was calculated using a relief-from-royalty approach, which assumes the value of the trade name is the discounted cash flows of the amount that would be paid by a hypothetical market participant had they not owned the trade name and instead licensed the trade name from another company. As of January 31, 2015, the Garden Ridge trade name definite-lived intangible asset was fully amortized. The carrying value of the At Home trade name as of January 28, 2017 is approximately $1.5 million. No impairment of our indefinite-lived trade name intangible asset was recognized during the fiscal years ended January 28, 2017, January 30, 2016 or January 31, 2015.
Revenue Recognition
Revenue from sales of our merchandise is recognized when the customer takes possession of the merchandise. Revenue is presented net of sales taxes collected. We allow for merchandise to be returned within 60 days from the purchase date and provide a reserve for estimated returns. We use historical customer return behavior to estimate our reserve requirements, which are accounted for as a reduction in revenue; we also reduce cost of sales to reflect our estimates of the inventory cost of products that will be returned. As of January 28, 2017 and January 30, 2016, our sales returns reserves were approximately $1.1 million and $0.8 million, respectively.
We record a gift card liability on the date we issue the gift card to the customer. We record revenue and reduce the gift card liability as the customer redeems the gift card. As of January 28, 2017 and January 30, 2016, our gift card liability was approximately $4.1 million and $2.4 million, respectively. In addition, we recognize gift card breakage as revenue after 60 months of non-use. We recognized revenue related to breakage of such gift card balances of an immaterial amount of revenue for each of the fiscal years ended January 28, 2017 and January 30, 2016 and approximately $0.1 million for the fiscal year ended January 31, 2015.
Stock-Based Compensation
We account for stock-based compensation in accordance with ASC 718 (Topic 718, “Compensation—Stock Compensation”), which requires all stock-based payments to employees, including grants of employee stock options, to be recognized in the consolidated financial statements over the requisite service period. Compensation expense based upon the fair value of awards is recognized on a straight-line basis over the requisite service period for awards that actually vest. Stock-based compensation expense is recorded in selling, general and administrative expenses in the consolidated statements of operations.
We estimate fair value of each stock option grant on the date of grant based upon the Black-Scholes option pricing model, with exception to a special one-time initial public offering transaction bonus grant which was valued on the date of grant using the Monte Carlo simulation method.
57
The Black-Scholes option pricing model requires various significant judgmental assumptions in order to derive a final fair value determination for each type of award including the following:
|
· |
Expected term—The expected term of the options represents the period of time between the grant date of the options and the date the options are either exercised or canceled. |
|
· |
Expected volatility—The expected volatility is calculated based on the historical volatility of the common stock for comparable companies. |
|
· |
Expected dividend yield—The expected dividend yield is based on our expectation of not paying dividends on our common stock for the foreseeable future. |
|
· |
Risk-free interest rate—The risk-free interest rate is the average of the 3-year and 5-year U.S. Treasury rate in effect at the time of grant and with a maturity that approximates the expected term. |
We used a Monte Carlo simulation model to determine the fair value of the special one-time initial public offering transaction bonus grant subject to market-based conditions. The stock option grants subject to market-based conditions have cliff vesting beginning in the third quarter of fiscal year 2017 and continuing through the following eight quarters subject to the achievement of market conditions. We valued the stock option grants as a single award with the related compensation cost recognized using a straight-line method over the derived service period. The expected volatility is based on a combination of historical and implied volatilities of the common stock for comparable companies.
All grants of our stock options have an exercise price equal to or greater than the fair market value of our common stock on the date of grant, based on the foregoing estimates and assumptions. Because we were a privately held company prior to August 4, 2016 and there was no public market for our common stock, the fair value of our equity was approved by our Board at the time option grants were awarded. In estimating the fair value of our common stock, we considered factors we believed to be material to the valuation process including, but not limited to, our actual and projected financial results, risks and prospects and economic and market conditions. Our valuations utilized projections of our future performance, estimates of our weighted average cost of capital and metrics based on the performance of a peer group of similar companies, including valuation multiples and stock price volatility.
We believe the combination of these methods provides an appropriate estimate of our expected fair value. We have considered the valuation analyses to determine the best estimate of the fair value of our common stock at each stock option grant date.
The estimates used in determining the fair value of our common stock prior to our IPO were highly complex and subject to significant judgment. Those assumptions were similar to those we make with respect to goodwill as described above and include the selection of revenue growth rates, discount rates and comparable public companies used in the guideline public company analysis, and the non-marketability discount used. There was also inherent uncertainty in our forecasts and projections. If we had made different assumptions and estimates than those described previously, the amount of our stock-based compensation expense, net income (loss) and net income (loss) per share amounts could have been materially different. Following the initial public offering, such estimates are no longer needed to determine fair value for new awards due to a publicly-available trading price for our common stock.
Income Taxes
We account for the provision for income taxes under the asset and liability method prescribed by ASC 740 (Topic 740, “Income Taxes”). Deferred tax assets and liabilities are recognized for the future tax consequences attributable to differences between the financial statement carrying amounts of existing assets and liabilities and their respective tax bases, operating losses and tax credit carryforwards. Deferred tax assets and liabilities are measured using the enacted tax rates expected to apply to taxable income in the years in which those temporary differences are expected to be recovered or settled. The effect on deferred tax assets and liabilities of a change in tax rates is recognized in income
58
in the period the tax rate changes are enacted. We record a valuation allowance to reduce the carrying amounts to the amount that is believed more likely than not to be realized.
We are required to assess the available positive and negative evidence to estimate if sufficient future income will be generated to utilize deferred tax assets. A significant piece of positive or negative evidence that we consider is cumulative income or losses (generally defined as losses before income taxes) incurred over the most recent three-year period. Such evidence is supplemented by the four sources of taxable income described in ASC 740-10-30-18. We considered all available positive and negative evidence as of January 31, 2015 and concluded that a valuation allowance was appropriate to the extent our deferred tax assets would not be realized through the future reversals of existing taxable temporary differences and the carry back of the resultant loss from the excess of reversing deferred tax assets over reversing deferred liabilities. During our assessment of available positive and negative evidence as of January 30, 2016, we concluded that the valuation allowance was no longer appropriate except as it related to certain state net operating loss carryforwards. As of January 30, 2016, after excluding items that we considered to be unusual in nature, we determined that we had three years of cumulative pre-tax income which we believed was a significant piece of positive evidence that allowed us to consider other subjective evidence such as future forecasted pre-tax income. We concluded that because of this positive evidence, along with taxable income in the prior two fiscal years to absorb loss carrybacks that would be generated by reversing deductible differences in excess of reversing taxable differences, as well as cumulative pre-tax income (exclusive of unusual items) in recent fiscal years, it was more likely than not that our deferred tax assets would be realized in future years.
Our valuation allowances totaled $0.3 million, $0.6 million and $6.6 million, as of January 28, 2017, January 30, 2016 and January 31, 2015, respectively. Because our deferred tax assets solely relate to temporary differences, periodic changes in the amount of net deferred tax assets during the fiscal year ended January 31, 2015 directly impacted our income tax provision in that fiscal year and made our effective tax rate difficult to predict. For example, the change in the required federal valuation allowance for fiscal year 2015 impacted our income tax provision by $1.0 million.
Recent Accounting Pronouncements
In May 2014, the Financial Accounting Standards Board (“FASB”) issued ASU No. 2014-09, “Revenue from Contracts with Customers” (“ASU 2014-09”). ASU 2014-09 supersedes the revenue recognition requirements in “Topic 605, Revenue Recognition”, and requires entities to recognize revenue in a way that depicts the transfer of promised goods or services to customers in an amount that reflects the consideration to which the entity expects to be entitled to in exchange for those goods or services. ASU 2014-09 is effective for annual reporting periods beginning after December 15, 2017, including interim periods within that reporting period. We completed an initial impact assessment and believe adopting this ASU will not materially impact the timing of revenue recognition. We expect to adopt this new guidance using the full retrospective method in the first quarter of fiscal year 2019.
In February 2016, the FASB issued ASU No. 2016-02 “Leases”, which supersedes ASC 840 “Leases” and creates a new topic, ASC 842 “Leases” (“ASU 2016-02”). Under ASU 2016-02, an entity will be required to recognize right-of-use assets and lease liabilities on its balance sheet and disclose key information about leasing arrangements. ASU 2016-02 offers specific accounting guidance for a lessee, a lessor and sale and leaseback transactions. Lessees and lessors are required to disclose qualitative and quantitative information about leasing arrangements to enable a user of the financial statements to assess the amount, timing and uncertainty of cash flows arising from leases. ASU 2016-02 is effective for annual reporting periods beginning after December 15, 2018, including interim periods within that reporting period, with early adoption permitted. At adoption, this update will be applied using a modified retrospective approach. We are currently evaluating the impact of ASU 2016-02 and we expect that upon adoption we will recognize right-of-use assets and liabilities that could be material to our financial statements.
In March 2016, the FASB issued ASU No. 2016-04, “Recognition of Breakage for Certain Prepaid Stored-Value Products” (“ASU 2016-04”). ASU 2016-04 requires that breakage on prepaid stored-value product liabilities (for example, prepaid gift cards) be accounted for consistent with the breakage guidance in “Topic 606, Revenue from Contracts with Customers”. ASU 2016-04 is effective for annual reporting periods beginning after December 15, 2017, including interim reporting periods within that reporting period, with early adoption permitted. This standard is to be
59
applied either using a modified retrospective approach or retrospectively to each period presented. We expect to adopt this new guidance using the full retrospective method in the first quarter of fiscal year 2019.
In March 2016, the FASB issued ASU No. 2016-09, “Improvements to Employee Share-Based Payment Accounting” (“ASU 2016-09”). ASU 2016-09 is intended to simplify various aspects of the accounting for employee share-based payment award transactions and is effective for annual reporting periods beginning after December 15, 2016, including interim periods within that reporting period, with early adoption permitted. We plan to adopt ASU 2016-09 prospectively for annual reporting periods beginning in the first quarter of fiscal year 2018. We have evaluated ASU 2016-09 and do not expect the impact of this guidance to have an immediate material impact on our consolidated financial statements, given that we have no historical exercises of stock options as of January 28, 2017. However, under certain circumstances, this guidance will have an impact on our effective tax rate in the future as the adoption of ASU 2016-09 also requires all income tax adjustments to be recorded in the consolidated statements of operations and changes between tax and book treatment of equity compensation will be recognized in the provision for income taxes beginning in fiscal year 2018. Under the adoption of ASU 2016-09, Management will elect the accounting policy to continue to estimate the number of awards expected to be forfeited and adjust those estimates when it is no longer probable each period.
In August 2016, the FASB issued ASU No. 2016-15, “Classification of Certain Cash Receipts and Cash Payments” (“ASU 2016-15”). ASU 2016-15 is intended to reduce the diversity in practice around how certain transactions are classified within the statement of cash flows. ASU 2016-15 is effective for annual reporting periods beginning after December 15, 2017, including interim periods within that reporting period, with early adoption permitted. We are currently evaluating the impact of ASU 2016-15.
In November 2016, the FASB issued ASU No. 2016-18, “Restricted Cash” (“ASU 2016-18”). ASU 2016-18 is intended to reduce the diversity in practice around how restricted cash is classified within the statement of cash flows. ASU 2016-18 is effective for annual reporting periods beginning after December 15, 2017, including interim periods within that reporting period, with early adoption permitted. We are currently evaluating the impact of ASU 2016-18.
In January 2017, the FASB issued ASU No. 2017-04, “Simplifying the Test for Goodwill Impairment” (“ASU 2017-04”). ASU 2017-04 simplifies the measurement of goodwill impairment by removing the second step of the goodwill impairment test, which requires the determination of the fair value of individual assets and liabilities of a reporting unit. Under ASU 2017-04, goodwill impairment is to be measured as the amount by which a reporting unit’s carrying value exceeds its fair value with the loss recognized not to exceed the total amount of goodwill allocated to the reporting unit. ASU 2017-04 is effective for fiscal years beginning after December 15, 2019, with early adoption permitted for interim or annual goodwill impairment tests performed after January 1, 2017. The standard is to be applied on a prospective basis. We are currently evaluating the impact of ASU 2017-04 and do not anticipate a material impact to the consolidated financial statements once implemented.
Jumpstart Our Business Act of 2012
We are an “emerging growth company” as defined in the Jumpstart Our Business Startups Act of 2012, which we refer to as the JOBS Act. We will remain an emerging growth company until the earlier of (1) the last day of our fiscal year (a) following the fifth anniversary of the completion of our initial public offering, (b) in which we have total annual gross revenue of at least $1.0 billion, or (c) in which we are deemed to be a large accelerated filer, which means the market value of our common stock that is held by non-affiliates exceeds $700.0 million as of the last business day of our most recently completed second fiscal quarter, and (2) the date on which we have issued more than $1.0 billion in non-convertible debt securities during the prior three-year period. An emerging growth company may take advantage of specified reduced reporting and other burdens that are otherwise applicable generally to public companies.
As an emerging growth company, the JOBS Act allows us to take advantage of an extended transition period to comply with new or revised accounting standards applicable to public companies. We are choosing to irrevocably ‘‘opt out’’ of this provision and, as a result, we will comply with new or revised accounting standards as required when they are adopted.
60
ITEM 7A. QUANTITATIVE AND QUALITATIVE DISCLOSURES ABOUT MARKET RISKS
Interest Rate Risk
We have market risk exposure arising from changes in interest rates on our ABL Facility and Term Loan Facilities, which bear interest at rates that are benchmarked against London Interbank Offered Rates (“LIBOR”). Based on our overall interest rate exposure to variable rate debt outstanding as of January 28, 2017, a 1% increase or decrease in interest rates would increase or decrease income before income taxes by approximately $4.0 million. A 1% increase or decrease in interest rates would impact the fair value of our long-term fixed rate debt by an immaterial amount. A change in interest rates would not materially affect the fair value of our variable rate debt as the debt reprices periodically.
Impact of Inflation
Our results of operations and financial condition are presented based on historical cost. While it is difficult to accurately measure the impact of inflation due to the imprecise nature of the estimates required, we believe the effects of inflation, if any, on our results of operations and financial condition have been immaterial. We cannot assure you, however, that our results of operations and financial condition will not be materially impacted by inflation in the future.
Foreign Currency Risk
During the fiscal year ended January 28, 2017, we purchase approximately 60% of our merchandise from suppliers in foreign countries, however, those purchases are made exclusively in U.S. dollars. Therefore, we do not believe that foreign currency fluctuation has had a material impact on our financial performance for the periods presented in this report.
61
ITEM 8. FINANCIAL STATEMENTS AND SUPPLEMENTARY DATA
See the Index to Consolidated Financial Statements and Supplementary Data on page F-1. The Consolidated Financial Statements and Supplementary Data are included on pages F-2 through F-33 and are incorporated herein by reference.
ITEM 9. CHANGES AND DISAGREEMENTS WITH ACCOUNTANTS ON ACCOUNTING AND FINANCIAL DISCLOSURES
Not applicable.
ITEM 9A. CONTROLS AND PROCEDURES
Evaluation of Disclosure Controls and Procedures
Our management has evaluated, under the supervision and with the participation of our Chief Executive Officer and Chief Financial Officer, the effectiveness of our disclosure controls and procedures, as defined in Rule 13(a)-15(e) of the Securities Exchange Act of 1934 (the “Exchange Act”), as of the end of the period covered by this Annual Report on Form 10-K. Our management used the criteria set forth by the Committee of Sponsoring Organizations of the Treadway Commission (COSO) in its Internal Control—Integrated Framework (2013). Based on that evaluation, our Chief Executive Officer and Chief Financial Officer have concluded that our disclosure controls and procedures as of the end of the period covered by this Annual Report on Form 10-K are effective at a reasonable assurance level in ensuring that information required to be disclosed in our Exchange Act reports is (1) recorded, processed, summarized and reported in a timely manner and (2) accumulated and communicated to our management, including our Chief Executive Officer and Chief Financial Officer, as appropriate to allow timely decisions regarding required disclosure. Our management, including our Chief Executive Officer and Chief Financial Officer, does not expect that our disclosure controls and procedures will prevent or detect all errors and all fraud.
While our disclosure controls and procedures are designed to provide reasonable assurance of their effectiveness, because of the inherent limitations in all control systems, no evaluation of controls can provide absolute assurance that all control issues and instances of fraud, if any, within the Company have been detected.
Changes in Internal Control
There were no changes in our internal control over financial reporting that occurred during the quarterly period ended January 28, 2017 that have materially affected, or are reasonably likely to materially affect, our internal control over financial reporting.
Management's Report on Internal Control over Financial Reporting
We have not engaged an independent registered accounting firm to perform an audit of our internal control over financial reporting as of any balance sheet date or for any period reported in our financial statements. Presently, we are not an accelerated filer, as such term is defined by Rule 12b-2 of the Exchange Act, and our management is not presently required to perform an annual assessment of the effectiveness of our internal control over financial reporting. This requirement could apply as early as our Annual Report on Form 10-K for the year ending January 27, 2018 if certain triggers requiring accelerated filing deadlines are met prior to that. Our independent public registered accounting firm will first be required to attest to the effectiveness of our internal control over financial reporting for our Annual Report on Form 10-K for the first year we are no longer an “emerging growth company”.
None.
62
ITEM 10. DIRECTORS, EXECUTIVE OFFICERS AND CORPORATE GOVERNANCE
The information required by this item is incorporated by reference to the information set forth in the sections titled “Nominees for Election as Directors,” “Information About Our Executive Officers,” “Directors Continuing in Office,” “Section 16(a) Beneficial Ownership Reporting Compliance,” “Code of Business Conduct and Ethics” and “Information about the Board of Directors and Corporate Governance - Audit Committee” in our Proxy Statement.
ITEM 11. EXECUTIVE COMPENSATION
The information required by this item is incorporated by reference to the information set forth in the sections titled “Executive Compensation,” “Director Compensation” and “Information about the Board of Directors and Corporate Governance - Compensation Committee Interlocks and Insider Participation” in our Proxy Statement.
ITEM 12. SECURITY OWNERSHIP OF CERTAIN BENEFICIAL OWNERS AND MANAGEMENT AND RELATED STOCKHOLDER MATTERS
The information required by this item is incorporated by reference to the information set forth in the sections titled “Securities Authorized for Issuance under Equity Compensation Plans” and “Security Ownership of Certain Beneficial Owners and Management” in our Proxy Statement.
ITEM 13. CERTAIN RELATIONSHIPS AND RELATED TRANSACTIONS, AND DIRECTOR INDEPENDENCE
The information required by this item is incorporated by reference to the information set forth in the sections titled “Board of Directors’ Independence” and “Transactions with Related Persons” in our Proxy Statement.
ITEM 14. PRINCIPAL ACCOUNTING FEES AND SERVICES
The information required by this item is incorporated by reference to the information set forth in the section titled “Independent Registered Public Accounting Firm Fees and Services” in our Proxy Statement.
63
ITEM 15. EXHIBITS AND FINANCIAL STATEMENT SCHEDULES
The following documents are filed as a part of this report:
|
(1) |
Consolidated Financial Statements: |
See Index to Consolidated Financial Statements on page F-1.
|
(2) |
Financial Statement Schedules: |
All financial statement schedules are omitted because they are not required or are not applicable, or the required information is provided in the consolidated financial statements or notes described in 15(1) above.
|
(3) |
Exhibits: |
The exhibits listed in the accompanying Index to Exhibits attached hereto are filed or incorporated by reference into this Annual Report on Form 10-K.
64
INDEX TO CONSOLIDATED FINANCIAL STATEMENTS
|
|
Page |
|
|
|
|
F-2 |
|
|
|
|
|
Consolidated Balance Sheets as of January 28, 2017 and January 30, 2016 |
F-3 |
|
|
|
|
F-4 |
|
|
|
|
|
F-5 |
|
|
|
|
|
F-6 |
|
|
|
|
|
F-7 |
|
|
|
|
|
F-30 |
F-1
Report of Independent Registered Public Accounting Firm
The Board of Directors and Shareholders of
At Home Group Inc.
We have audited the accompanying consolidated balance sheets of At Home Group Inc. as of January 28, 2017 and January 30, 2016, and the related consolidated statements of operations, shareholders’ equity and cash flows for each of the three years in the period ended January 28, 2017. Our audits also included the accompanying financial statement schedule. These financial statements and schedule are the responsibility of the Company’s management. Our responsibility is to express an opinion on these financial statements and schedule based on our audits.
We conducted our audits in accordance with the standards of the Public Company Accounting Oversight Board (United States). Those standards require that we plan and perform the audit to obtain reasonable assurance about whether the financial statements are free of material misstatement. We were not engaged to perform an audit of the Company’s internal control over financial reporting. Our audits included consideration of internal control over financial reporting as a basis for designing audit procedures that are appropriate in the circumstances, but not for the purpose of expressing an opinion on the effectiveness of the Company’s internal control over financial reporting. Accordingly, we express no such opinion. An audit also includes examining, on a test basis, evidence supporting the amounts and disclosures in the financial statements, assessing the accounting principles used and significant estimates made by management, and evaluating the overall financial statement presentation. We believe that our audits provide a reasonable basis for our opinion.
In our opinion, the financial statements referred to above present fairly, in all material respects, the consolidated financial position of At Home Group Inc. at January 28, 2017 and January 30, 2016, and the consolidated results of its operations and its cash flows for each of the three years in the period ended January 28, 2017, in conformity with U.S. generally accepted accounting principles. Also, in our opinion, the related financial statement schedule, when considered in relation to the basic financial statements taken as a whole, presents fairly in all material respects the information set forth therein.
/s/ Ernst & Young LLP
Dallas, Texas
April 5, 2017
F-2
Consolidated Balance Sheets
(in thousands, except share and per share data)
|
|
|
January 28, 2017 |
|
January 30, 2016 |
|
||
|
Assets |
|
|
|
|
|
|
|
|
Current assets: |
|
|
|
|
|
|
|
|
Cash and cash equivalents |
|
$ |
7,092 |
|
$ |
5,428 |
|
|
Inventories, net |
|
|
243,795 |
|
|
176,388 |
|
|
Prepaid expenses |
|
|
6,130 |
|
|
6,351 |
|
|
Other current assets |
|
|
1,860 |
|
|
3,229 |
|
|
Total current assets |
|
|
258,877 |
|
|
191,396 |
|
|
Property and equipment, net |
|
|
340,358 |
|
|
272,776 |
|
|
Goodwill |
|
|
569,732 |
|
|
569,732 |
|
|
Trade name |
|
|
1,458 |
|
|
872 |
|
|
Debt issuance costs, net |
|
|
1,202 |
|
|
1,323 |
|
|
Restricted cash |
|
|
482 |
|
|
26 |
|
|
Noncurrent deferred tax asset |
|
|
40,735 |
|
|
14,726 |
|
|
Other assets |
|
|
549 |
|
|
3,959 |
|
|
Total assets |
|
$ |
1,213,393 |
|
$ |
1,054,810 |
|
|
Liabilities and Shareholders' Equity |
|
|
|
|
|
|
|
|
Current liabilities: |
|
|
|
|
|
|
|
|
Accounts payable |
|
$ |
58,425 |
|
$ |
31,139 |
|
|
Accrued liabilities |
|
|
74,439 |
|
|
54,472 |
|
|
Revolving line of credit |
|
|
101,575 |
|
|
76,600 |
|
|
Current portion of deferred rent |
|
|
7,082 |
|
|
4,518 |
|
|
Current portion of long-term debt and financing obligations |
|
|
3,691 |
|
|
3,789 |
|
|
Income taxes payable |
|
|
7,265 |
|
|
— |
|
|
Total current liabilities |
|
|
252,477 |
|
|
170,518 |
|
|
Long-term debt |
|
|
299,606 |
|
|
422,610 |
|
|
Financing obligations |
|
|
19,937 |
|
|
19,017 |
|
|
Deferred rent |
|
|
103,692 |
|
|
70,156 |
|
|
Other long-term liabilities |
|
|
2,811 |
|
|
3,356 |
|
|
Total liabilities |
|
|
678,523 |
|
|
685,657 |
|
|
Shareholders' Equity |
|
|
|
|
|
|
|
|
Common stock; $0.01 par value; 500,000,000 shares authorized; 60,366,768 and 50,836,727 shares issued and outstanding, respectively |
|
|
604 |
|
|
508 |
|
|
Additional paid-in capital |
|
|
548,301 |
|
|
409,746 |
|
|
Accumulated deficit |
|
|
(14,035) |
|
|
(41,101) |
|
|
Total shareholders' equity |
|
|
534,870 |
|
|
369,153 |
|
|
Total liabilities and shareholders' equity |
|
$ |
1,213,393 |
|
$ |
1,054,810 |
|
See Notes to Consolidated Financial Statements.
F-3
Consolidated Statements of Operations
(in thousands, except share and per share data)
|
|
|
Fiscal Year Ended |
|
|||||||
|
|
|
January 28, 2017 |
|
January 30, 2016 |
|
January 31, 2015 |
|
|||
|
|
|
|
|
|
|
|
|
|
||
|
Net sales |
|
$ |
765,635 |
|
$ |
622,161 |
|
$ |
497,733 |
|
|
Cost of sales |
|
|
518,155 |
|
|
421,750 |
|
|
335,617 |
|
|
Gross profit |
|
|
247,480 |
|
|
200,411 |
|
|
162,116 |
|
|
|
|
|
|
|
|
|
|
|
|
|
|
Operating expenses |
|
|
|
|
|
|
|
|
|
|
|
Selling, general and administrative expenses |
|
|
170,556 |
|
|
135,716 |
|
|
110,503 |
|
|
Depreciation and amortization |
|
|
4,247 |
|
|
2,476 |
|
|
5,310 |
|
|
Total operating expenses |
|
|
174,803 |
|
|
138,192 |
|
|
115,813 |
|
|
|
|
|
|
|
|
|
|
|
|
|
|
Operating income |
|
|
72,677 |
|
|
62,219 |
|
|
46,303 |
|
|
Interest expense, net |
|
|
27,174 |
|
|
36,759 |
|
|
42,382 |
|
|
Loss on extinguishment of debt |
|
|
2,715 |
|
|
36,046 |
|
|
— |
|
|
Income (loss) before income taxes |
|
|
42,788 |
|
|
(10,586) |
|
|
3,921 |
|
|
Income tax provision (benefit) |
|
|
15,722 |
|
|
(14,160) |
|
|
4,357 |
|
|
Net income (loss) |
|
$ |
27,066 |
|
$ |
3,574 |
|
$ |
(436) |
|
|
|
|
|
|
|
|
|
|
|
|
|
|
Earnings per share: |
|
|
|
|
|
|
|
|
|
|
|
Net income (loss) per common share: |
|
|
|
|
|
|
|
|
|
|
|
Basic |
|
$ |
0.49 |
|
$ |
0.07 |
|
$ |
(0.01) |
|
|
Diluted |
|
$ |
0.48 |
|
$ |
0.07 |
|
$ |
(0.01) |
|
|
Weighted average shares outstanding: |
|
|
|
|
|
|
|
|
|
|
|
Basic |
|
|
55,414,037 |
|
|
50,836,727 |
|
|
50,836,727 |
|
|
Diluted |
|
|
56,892,183 |
|
|
51,732,752 |
|
|
50,836,727 |
|
See Notes to Consolidated Financial Statements.
F-4
Consolidated Statements of Shareholders’ Equity
(in thousands, except share data)
|
|
|
|
|
Additional |
|
|
|
|
|
|
|
||||
|
|
|
Common Stock |
|
Paid-in |
|
Accumulated |
|
|
|
|
|||||
|
|
|
Shares |
|
Par Value |
|
Capital |
|
Deficit |
|
Total |
|
||||
|
|
|
|
|
|
|
|
|
|
|
|
|
|
|
|
|
|
Balance, January 25, 2014 |
|
50,836,727 |
|
$ |
508 |
|
$ |
400,832 |
|
$ |
(44,239) |
|
$ |
357,101 |
|
|
Stock-based compensation |
|
— |
|
|
— |
|
|
4,251 |
|
|
— |
|
|
4,251 |
|
|
Net loss |
|
— |
|
|
— |
|
|
— |
|
|
(436) |
|
|
(436) |
|
|
Balance, January 31, 2015 |
|
50,836,727 |
|
|
508 |
|
|
405,083 |
|
|
(44,675) |
|
|
360,916 |
|
|
Stock-based compensation |
|
— |
|
|
— |
|
|
4,663 |
|
|
— |
|
|
4,663 |
|
|
Net income |
|
— |
|
|
— |
|
|
— |
|
|
3,574 |
|
|
3,574 |
|
|
Balance, January 30, 2016 |
|
50,836,727 |
|
|
508 |
|
|
409,746 |
|
|
(41,101) |
|
|
369,153 |
|
|
Stock-based compensation |
|
— |
|
|
— |
|
|
9,384 |
|
|
— |
|
|
9,384 |
|
|
Issuance of stock from initial public offering, net of costs |
|
9,530,041 |
|
|
96 |
|
|
126,815 |
|
|
— |
|
|
126,911 |
|
|
Excess tax benefit from initial public offering expenses |
|
— |
|
|
— |
|
|
2,356 |
|
|
— |
|
|
2,356 |
|
|
Net income |
|
— |
|
|
— |
|
|
— |
|
|
27,066 |
|
|
27,066 |
|
|
Balance, January 28, 2017 |
|
60,366,768 |
|
$ |
604 |
|
$ |
548,301 |
|
$ |
(14,035) |
|
$ |
534,870 |
|
See Notes to Consolidated Financial Statements.
F-5
Consolidated Statements of Cash Flows
(in thousands)
|
|
|
Fiscal Year Ended |
|
|||||||
|
|
|
January 28, 2017 |
|
January 30, 2016 |
|
January 31, 2015 |
|
|||
|
Operating Activities |
|
|
|
|
|
|
|
|||
|
Net income (loss) |
|
$ |
27,066 |
|
$ |
3,574 |
|
$ |
(436) |
|
|
Adjustments to reconcile net income (loss) to net cash provided by operating activities: |
|
|
|
|
|
|
|
|
|
|
|
Depreciation and amortization |
|
|
36,925 |
|
|
28,694 |
|
|
23,317 |
|
|
Loss (gain) on disposal of fixed assets |
|
|
216 |
|
|
(1,852) |
|
|
746 |
|
|
Non-cash interest expense |
|
|
2,664 |
|
|
2,757 |
|
|
1,780 |
|
|
Amortization of deferred gain on sale-leaseback |
|
|
(4,721) |
|
|
(3,152) |
|
|
(1,759) |
|
|
Deferred income taxes |
|
|
(26,008) |
|
|
(12,308) |
|
|
(1,992) |
|
|
Stock-based compensation |
|
|
9,384 |
|
|
4,663 |
|
|
4,251 |
|
|
Loss on extinguishment of debt |
|
|
2,715 |
|
|
36,046 |
|
|
— |
|
|
Changes in operating assets and liabilities |
|
|
|
|
|
|
|
|
|
|
|
Inventories |
|
|
(67,407) |
|
|
(34,132) |
|
|
(33,131) |
|
|
Prepaid expenses and other current assets |
|
|
1,600 |
|
|
(781) |
|
|
(4,581) |
|
|
Other assets |
|
|
(2,624) |
|
|
(3,380) |
|
|
287 |
|
|
Accounts payable |
|
|
24,344 |
|
|
(6,285) |
|
|
11,554 |
|
|
Accrued liabilities |
|
|
19,415 |
|
|
(5,418) |
|
|
15,950 |
|
|
Income taxes payable |
|
|
9,621 |
|
|
(515) |
|
|
(5,513) |
|
|
Deferred rent |
|
|
10,308 |
|
|
7,002 |
|
|
4,848 |
|
|
Net cash provided by operating activities |
|
|
43,498 |
|
|
14,913 |
|
|
15,321 |
|
|
Investing Activities |
|
|
|
|
|
|
|
|
|
|
|
Purchase of property and equipment |
|
|
(124,273) |
|
|
(102,541) |
|
|
(137,044) |
|
|
Purchase of intangible assets |
|
|
(586) |
|
|
(19) |
|
|
(464) |
|
|
Change in restricted cash |
|
|
(456) |
|
|
17,234 |
|
|
597 |
|
|
Net proceeds from sale of property and equipment |
|
|
62,141 |
|
|
45,599 |
|
|
36,813 |
|
|
Net cash used in investing activities |
|
|
(63,174) |
|
|
(39,727) |
|
|
(100,098) |
|
|
Financing Activities |
|
|
|
|
|
|
|
|
|
|
|
Payments under lines of credit |
|
|
(406,164) |
|
|
(230,900) |
|
|
(212,400) |
|
|
Proceeds from lines of credit |
|
|
431,139 |
|
|
240,100 |
|
|
279,800 |
|
|
Payment of debt issuance costs |
|
|
(323) |
|
|
(13,742) |
|
|
(956) |
|
|
Proceeds from issuance of long-term debt |
|
|
— |
|
|
430,000 |
|
|
6,532 |
|
|
Payment of Second Lien Term Loan |
|
|
(130,000) |
|
|
— |
|
|
— |
|
|
Payment of Senior Secured Notes |
|
|
— |
|
|
(389,027) |
|
|
— |
|
|
Payments on financing obligations |
|
|
(128) |
|
|
(360) |
|
|
— |
|
|
Proceeds from financing obligations |
|
|
— |
|
|
— |
|
|
12,158 |
|
|
Payments on long-term debt |
|
|
(6,128) |
|
|
(10,535) |
|
|
(622) |
|
|
Proceeds from issuance of common stock |
|
|
132,944 |
|
|
— |
|
|
— |
|
|
Net cash provided by financing activities |
|
|
21,340 |
|
|
25,536 |
|
|
84,512 |
|
|
Increase (decrease) in cash and cash equivalents |
|
|
1,664 |
|
|
722 |
|
|
(265) |
|
|
Cash and cash equivalents, beginning of period |
|
|
5,428 |
|
|
4,706 |
|
|
4,971 |
|
|
Cash and cash equivalents, end of period |
|
$ |
7,092 |
|
$ |
5,428 |
|
$ |
4,706 |
|
|
|
|
|
|
|
|
|
|
|
|
|
|
Supplemental Cash Flow Information |
|
|
|
|
|
|
|
|
|
|
|
Cash paid for interest |
|
$ |
21,058 |
|
$ |
40,184 |
|
$ |
40,616 |
|
|
Cash paid for income taxes |
|
$ |
30,760 |
|
$ |
1,026 |
|
$ |
13,037 |
|
|
Supplemental Information for Non-cash Investing and Financing Activities |
|
|
|
|
|
|
|
|
|
|
|
Property and equipment included in accounts payable |
|
$ |
2,941 |
|
$ |
5,787 |
|
$ |
940 |
|
|
Property and equipment reduction due to sale leaseback |
|
$ |
(30,910) |
|
$ |
(22,535) |
|
$ |
(16,214) |
|
|
Property and equipment acquired under capital lease |
|
$ |
8,613 |
|
$ |
— |
|
$ |
— |
|
|
Property and equipment additions due to build-to-suit lease transactions |
|
$ |
— |
|
$ |
— |
|
$ |
7,369 |
|
See Notes to Consolidated Financial Statements.
F-6
1. Nature of Operations and Summary of Significant Accounting Policies
Description of Business
At Home is a home décor superstore focused exclusively on providing a broad assortment of products for any room, in any style, for any budget. As of January 28, 2017, we operated 123 home décor superstores in 30 states, primarily in the South Central, Southeastern, Mid-Atlantic and Midwestern regions of the United States. At Home is owned and operated by At Home Group Inc. and its wholly-owned subsidiaries. All references to “we”, “us”, “our” and the “Company” and similar expressions are references to At Home Group Inc. and our consolidated, wholly-owned subsidiaries, unless otherwise expressly stated or the context otherwise requires.
Stock Split
On July 22, 2016, the Company’s board of directors approved a 128.157393-for-one stock split of its existing Class A common stock, Class B common stock and Class C common stock and the conversion of such Class A common stock, Class B common stock and Class C common stock into a single class of common stock. All historical share and per share information has been retroactively adjusted to reflect the stock split and conversion. Effective July 22, 2016, the Company's total authorized share capital is comprised of 500,000,000 shares of common stock and 50,000,000 shares of preferred stock.
Initial Public Offering
On August 3, 2016, our Registration Statement on Form S-1 relating to our initial public offering was declared effective by the SEC pursuant to which we registered an aggregate of 9,967,050 shares of our common stock (including 1,300,050 shares subject to the underwriters' over-allotment option). We issued and sold 8,667,000 of the shares registered at a price of $15.00 per share on August 9, 2016, resulting in net proceeds of $120.9 million after deducting underwriters' discounts and commissions of $9.1 million. We also incurred offering expenses of $6.0 million in connection with the initial public offering, which are included in additional paid-in capital in the consolidated balance sheet as of January 28, 2017.
On September 8, 2016, we issued and sold a further 863,041 shares of our common stock pursuant to the underwriters’ partial exercise of the over-allotment option. This exercise of the over-allotment option resulted in net proceeds to us of $12.0 million after deducting underwriters’ discounts and commissions of $0.9 million.
We used the net proceeds from the initial public offering and partial exercise of the over-allotment option, after deducting underwriters’ discounts and commissions, to repay in full the $130.0 million of principal amount of indebtedness outstanding under our $130.0 million second lien term loan (the “Second Lien Term Loan”).
Rebranding Initiative
During the fiscal year ended January 31, 2015, we launched a significant rebranding initiative through which we changed our brand and corporate name, redesigned stores and changed merchandise. As part of this initiative, we changed our name from “Garden Ridge” to “At Home”. We completed the rebranding initiative during the first nine months of fiscal year 2015. All of our stores operate under the At Home brand.
Corporate Restructuring
At Home Group Inc. was formed as a Delaware corporation on June 30, 2011, under the name GRD Holding I Corporation (“GRD I”). Upon incorporation, GRD I became the parent of GRD Holding II Corporation (“GRD II”), which owned 100% of GRD Holding III Corporation (“GRD III”). GRD III was organized for the purpose of acquiring all of the outstanding common stock of Garden Holdings Inc., a Delaware corporation. Garden Holdings Inc. owned,
F-7
directly or indirectly, 100% of Garden Ridge Corporation and other entities. On September 29, 2014, GRD I, GRD II, GRD III and its affiliates completed an entity restructuring and amended various corporate names to reflect the “At Home” brand. In particular, (i) GRD Holding I Corporation was renamed to At Home Group Inc. (“At Home Group”), (ii) GRD Holding II Corporation was renamed to At Home Holding II Inc. (“At Home II”), (iii) GRD Holding III Corporation was renamed to At Home Holding III Inc. (“At Home III”), (iv) Garden Holdings Inc. was converted from a Delaware corporation to a Delaware limited liability company named At Home Companies LLC (“At Home LLC”), (v) both Garden Ridge Corporation and Garden Ridge, L.P. were merged with and into Garden Ridge Management, LLC and (vi) Garden Ridge Management, LLC was renamed At Home Stores LLC (“At Home Stores”).
Fiscal Year
We report on the basis of a 52- or 53-week fiscal year, which ends on the last Saturday in January. References to a fiscal year mean the year in which that fiscal year ends. References herein to “fiscal year 2017” relate to the 52 weeks ended January 28, 2017, references to “fiscal year 2016” relate to the 52 weeks ended January 30, 2016 and references to “fiscal year 2015” relate to the 53 weeks ended January 31, 2015.
Consolidation
The accompanying consolidated financial statements include the accounts of At Home Group Inc. and its consolidated wholly-owned subsidiaries. All intercompany balances and transactions have been eliminated in consolidation.
The Company does not have any components of other comprehensive income recorded within its consolidated financial statements, and, therefore, does not separately present a statement of comprehensive income in its consolidated financial statements.
Use of Estimates
Preparing financial statements in conformity with U.S. generally accepted accounting principles requires us to make estimates and assumptions that affect the reported amounts of certain assets, liabilities, revenues and expenses, and related disclosure of contingent assets and liabilities at the date of the financial statements. We base our estimates on historical experience and on various other assumptions that we believe to be reasonable under the circumstances, the results of which form the basis for making judgments about the carrying values of assets and liabilities that are not readily apparent from other sources. Because of the use of estimates inherent in the financial reporting process, actual results may differ from these estimates.
Segment Information
Management has determined that we have one operating segment, and therefore, one reportable segment. Our chief operating decision maker (“CODM”) is our Chief Executive Officer; our CODM reviews financial performance and allocates resources at a consolidated level on a recurring basis. All of our assets are located in the United States. All of our revenue is derived in the United States. It is impracticable for us to disclose revenue by each group of similar products.
Cash and Cash Equivalents
Cash and cash equivalents consists of highly liquid investments with original maturities of three months or less as well as credit card receivables. At January 28, 2017 and January 30, 2016, our cash and cash equivalents were comprised primarily of credit card receivables.
F-8
Restricted Cash
From time to time, we consummate sale-leaseback transactions where the sale is treated as a like-kind exchange transaction for U.S. federal income tax purposes in accordance with Section 1031 of the Internal Revenue Code (the "Code"). Section 1031 of the Code allows deferral of the recognition of taxable gain realized from the sale of property where the taxpayer timely reinvests the proceeds in qualifying like-kind property. In addition, Section 1031 of the Code requires sale proceeds of the relinquished property to be held by a third-party intermediary, pending utilization thereof for the acquisition of a qualifying like-kind property. The $17.3 million restricted cash balance as of January 31, 2015 related to sale proceeds that were used for qualifying property acquisitions that were completed by the second quarter of fiscal year 2016.
Inventories
Inventories are comprised of finished merchandise and are stated at the lower of cost or net realizable value with cost determined using the weighted-average method. The cost of inventories include the actual landed cost of an item at the time it is received in our distribution center, or at the point of shipment for certain international shipments, as well as transportation costs to our distribution center and to our retail stores, if applicable. Net inventory cost is recognized through cost of sales when the inventory is sold.
Physical inventory counts are performed for all of our stores at least once per year by a third-party inventory counting service. Inventory records are adjusted to reflect actual inventory counts and any resulting shortage (“shrinkage”) is recognized. Reserves for shrinkage are estimated and recorded throughout the period as a percentage of sales based on the most recent physical inventory, in combination with current events and historical experience. We also evaluate our merchandise to ensure that the expected net realizable value of the merchandise held at the end of a fiscal period exceeds cost. In the event that the expected net realizable value is less than cost, we reduce the value of that inventory accordingly
Consideration Received from Vendors
We receive vendor support in the form of cash payments or allowances for a variety of vendor-sponsored programs, such as volume rebates, markdown allowances and advertising. We also receive consideration for certain compliance programs. We have agreements in place with each vendor setting forth the specific conditions for each allowance.
Vendor support reduces our inventory costs based on the underlying provisions of the agreement. Vendor compliance charges are recorded as a reduction of the cost of merchandise inventories and a subsequent reduction in cost of sales when the inventory is sold.
Property and Equipment
Property and equipment is recorded at cost less accumulated depreciation and amortization. Depreciation of property and equipment other than leasehold improvements is recorded on a straight-line basis over the estimated useful lives of the assets ranging from 3 to 20 years. Leasehold improvements are amortized on a straight-line basis over the shorter of the remaining lease term, including renewals determined to be reasonably assured, or the estimated useful life of the related improvement.
We expense all internal-use software costs incurred in the preliminary project stage. Certain direct costs incurred at later stages and associated with the development and purchase of internal-use software, including external costs for services and internal payroll costs related to the software project, are capitalized within property and equipment in the accompanying consolidated balance sheets. Capitalized costs are amortized on a straight-line basis over the estimated useful lives of the software, generally between three and five years. For the fiscal years ended January 28,
F-9
2017, January 30, 2016 and January 31, 2015, we capitalized software costs of $7.7 million, $5.5 million and $1.2 million, respectively. Amortization expense related to capitalized software costs totaled $2.7 million, $1.0 million and $0.2 million during the fiscal years ended January 28, 2017, January 30, 2016 and January 31, 2015, respectively.
We capitalize major replacements and improvements and expense routine maintenance and repairs as incurred. We remove the cost of assets sold or retired and the related accumulated depreciation or amortization from the consolidated balance sheets and include any resulting gain or loss in the accompanying consolidated statements of operations.
Capitalized Interest
We capitalize interest on borrowings during the active construction period of major capital projects. Capitalized interest is added to the cost of the underlying assets and is amortized over the useful lives of the assets. Our capitalized interest cost was approximately $0.4 million, $0.3 million and $0.3 million for the fiscal years ended January 28, 2017, January 30, 2016 and January 31, 2015, respectively.
Fair Value Measurements
We follow the provisions of Accounting Standards Codification (“ASC”) 820 (Topic 820, “Fair Value Measurements and Disclosures”). ASC 820 establishes a three-tiered fair value hierarchy that prioritizes inputs to valuation techniques used in fair value calculations.
|
· |
Level 1 - Unadjusted quoted market prices for identical assets or liabilities in active markets that we have the ability to access. |
|
· |
Level 2 - Quoted prices for similar assets or liabilities in active markets; quoted prices for identical or similar assets or liabilities in inactive markets; or valuations based on models where the significant inputs are observable (e.g., interest rates, yield curves, prepayment speeds, default rates, loss severities, etc.) or can be corroborated by observable market data. |
|
· |
Level 3 - Valuations based on models where significant inputs are not observable. The unobservable inputs reflect our own assumptions about the assumptions that market participants would use. |
ASC 820 requires us to maximize the use of observable inputs and minimize the use of unobservable inputs. If a financial instrument uses inputs that fall in different levels of the hierarchy, the instrument is categorized based upon the lowest level of input that is significant to the fair value calculation.
The fair value of all current financial instruments approximates carrying value because of the short-term nature of these instruments. We have variable and fixed rates on our long-term debt. The fair value of long-term debt with variable rates approximates carrying value as the interest rates of these amounts approximate market rates. We determine fair value on our fixed rate debt by using quoted market prices and current interest rates.
At January 28, 2017, the fair value of our fixed rate mortgage due February 1, 2037 was $6.6 million, which was approximately $0.5 million above the carrying value of $6.1 million. Fair value for the fixed rate mortgage was determined using Level 2 inputs.
Goodwill
Goodwill is tested for impairment at least annually at the operating segment level; we have only one operating segment and we do not have a reporting unit that exists below our operating segment. If the implied fair value of goodwill is lower than its carrying amount, goodwill impairment is indicated and goodwill is written down to its implied
F-10
fair value. We assess the business enterprise value using a combination of the income approach and market approach to determine the fair value of the Company to be compared against the carrying value of net assets. The income approach, using the discounted cash flow method, includes key factors used in the valuation of the Company (a Level 3 valuation) which include, but are not limited to, management's plans for future operations, recent operating results, income tax rates, and discounted projected future cash flows.
No impairment of goodwill was recognized during the fiscal years ended January 28, 2017, January 30, 2016 or January 31, 2015. However, the use of different assumptions, estimates or judgments with respect to the estimation of the projected future cash flows and the determination of the discount rate and sales growth rate used to calculate the net present value of projected future cash flows could materially increase or decrease our estimates of fair value. Additionally, future impairment charges could be required if we do not achieve our current net sales and profitability projections, which would occur if we are not able to meet our new store growth targets, or the weighted average cost of capital increases.
Impairment of Long-Lived and Indefinite-Lived Assets
We evaluate the recoverability of the carrying value of long-lived assets whenever events or changes in circumstances indicate their carrying amount may not be recoverable. Our evaluation compares the carrying value of the assets with their estimated future undiscounted cash flows expected to result from the use and eventual disposition of the assets. We evaluate long-lived intangible assets at an individual store level, which is the lowest level of identifiable cash flows. We evaluate corporate assets or other long-lived assets that are not store-specific at the consolidated level.
To estimate store-specific future cash flows, we make assumptions about key store variables, including sales, growth rate, gross margin, payroll and other controllable expenses. Stores that are owned by us and do not meet the initial criteria are further evaluated taking into consideration the fair market value of the property compared to the carrying value of the assets. Furthermore, management considers other factors when evaluating stores for impairment, including the individual store's execution of its operating plan and other local market conditions. Our estimates are subject to uncertainty and may be affected by a number of factors outside our control, including general economic conditions and the competitive environment.
An impairment is recognized once all the factors noted above are taken into consideration and it is determined that the carrying amount of the store's assets are not recoverable. The impairment loss would be recognized in the amount by which the carrying amount of a long-lived asset exceeds its fair value, excluding assets that can be redeployed. No impairment of long-term assets was recognized during the fiscal years ended January 28, 2017, January 30, 2016 or January 31, 2015.
We test indefinite-lived trade name intangible assets annually for impairment or more frequently if impairment indicators arise. If the fair value of the indefinite-lived intangible asset is lower than its carrying amount, the asset is written down to its fair value. During fiscal year 2014, we committed to a rebranding initiative that resulted in the conversion of the then existing “Garden Ridge” trade name to the new trade name “At Home”. We performed an impairment analysis of the indefinite-lived trade name immediately before the conversion and, as a result, recognized a $37.5 million trade name impairment during the fiscal year ended January 25, 2014. The fair value of our trade name (a Level 3 valuation) was calculated using a relief-from-royalty approach, which assumes the value of the trade name is the discounted cash flows of the amount that would be paid by a hypothetical market participant had they not owned the trade name and instead licensed the trade name from another company. As of January 31, 2015, the Garden Ridge trade name definite-lived intangible asset was fully amortized. The carrying value of the At Home trade name as of January 28, 2017 is approximately $1.5 million. No impairment of our indefinite-lived trade name intangible asset was recognized during the fiscal years ended January 28, 2017, January 30, 2016 or January 31, 2015.
F-11
Debt Issuance Costs
Debt issuance costs are costs incurred in connection with obtaining or modifying financing arrangements. These costs are capitalized as a direct deduction from the carrying value of the debt, other than costs incurred in conjunction with our line of credit, which are capitalized as an asset, and amortized over the term of the respective debt agreements.
Total amortization expense related to debt issuance costs was approximately $1.8 million, $1.9 million and $1.6 million for the fiscal years ended January 28, 2017, January 30, 2016 and January 31, 2015, respectively.
Deferred Rent
We record rent expense on a straight-line basis over the term of the lease beginning with the date we take possession of or control the physical access to the premises. We record tenant improvement allowances as a liability and adjust the liability on a straight-line basis as a reduction to rent expense over the lease term beginning with the date we take possession of or control the physical access to the premises.
We recognize free rent periods, tenant improvement allowances and standard rent increases contained in our leases on a straight-line basis over the expected lease term, beginning when we first take possession of the property and including renewal option periods in those instances where exercising such options is reasonably assured. For leases where we are considered to be the owner of the construction project and receive tenant improvement allowances, we record the amounts received as a component of the financing obligation liability. See Note 7—Financing Obligations.
Insurance Liabilities
For the period from December 1, 2013 through January 28, 2017, we were fully insured for workers' compensation and commercial general liability claims. Prior to that period, we used a combination of commercial insurance and self-insurance for workers' compensation and commercial general liability claims and purchased insurance coverage that limited our aggregate exposure for individual claims to $250,000 per workers' compensation and commercial general liability claim.
We utilize a combination of commercial insurance and self-insurance for employee-related health care plans. The cost of our health care plan is borne in part by our employees. We purchase insurance coverage that limits our aggregate exposure for individual claims to $175,000 per employee-related health care claim.
Health care reserves are based on actual claims experience and an estimate of claims incurred but not reported. Reserves for commercial general liability and workers' compensation are determined through the use of actuarial studies. Due to the judgments and estimates utilized in determining these reserves, they are subject to a high degree of variability. In the event our insurance carriers are unable to pay claims submitted to them, we would record a liability for such estimated payments we expect to incur.
Revenue Recognition
Revenue from sales of our merchandise is recognized when the customer takes possession of the merchandise. Revenue is presented net of sales taxes collected. We allow for merchandise to be returned within 60 days from the purchase date and provide a reserve for estimated returns. We use historical customer return behavior to estimate our reserve requirements, which are accounted for as a reduction in revenue; we also reduce cost of sales to reflect our estimates of the inventory cost of products that will be returned. As of January 28, 2017 and January 30, 2016, our sales returns reserves were approximately $1.1 million and $0.8 million, respectively.
We record a gift card liability on the date we issue the gift card to the customer. We record revenue and reduce the gift card liability as the customer redeems the gift card. As of January 28, 2017 and January 30, 2016, our gift card
F-12
liability was approximately $4.1 million and $2.4 million, respectively. In addition, we recognize gift card breakage as revenue after 60 months of non-use. We recognized revenue related to breakage of such gift card balances of an immaterial amount of revenue for each of the fiscal years ended January 28, 2017 and January 30, 2016 and approximately $0.1 million for the fiscal year ended January 31, 2015.
Cost of Sales
Cost of sales are included in merchandise inventories and expensed as the merchandise is sold. We include the following expenses in cost of sales:
|
· |
cost of merchandise, net of inventory shrinkage, damages and vendor allowances; |
|
· |
inbound freight and internal transportation costs such as distribution center-to-store freight costs; |
|
· |
costs of operating our distribution center, including labor, occupancy costs, supplies and depreciation; and |
|
· |
store occupancy costs including rent, insurance, taxes, common area maintenance, utilities, repairs, maintenance and depreciation. |
Selling, General and Administrative Expenses
Selling, general and administrative expenses include payroll, benefits and other personnel expenses for corporate and store employees, including stock-based compensation expense, consulting, legal and other professional services expenses, advertising expenses, occupancy costs for our corporate headquarters and various other expenses.
Store Pre-Opening Costs
We expense pre-opening costs for new stores as they are incurred. During the fiscal years ended January 28, 2017, January 30, 2016 and January 31, 2015, store pre-opening costs were approximately $13.9 million, $12.3 million and $8.2 million, respectively. Store pre-opening costs, such as occupancy expenses, advertising and labor are included in selling, general and administrative expenses.
Advertising
Advertising costs, exclusive of store pre-opening advertising expenses discussed above, include billboard, newspaper, radio, digital and other advertising mediums. Advertising costs are expensed as incurred and included in selling, general and administrative expenses. Total advertising expenses were approximately $17.4 million, $12.4 million and $8.1 million for the fiscal years ended January 28, 2017, January 30, 2016 and January 31, 2015, respectively.
Stock-Based Compensation
We account for stock-based compensation in accordance with ASC 718 (Topic 718, “Compensation—Stock Compensation”), which requires all stock-based payments to employees, including grants of employee stock options, to be recognized in the consolidated financial statements over the requisite service period. Compensation expense based upon the fair value of awards is recognized on a straight-line basis over the requisite service period for awards that actually vest. Stock-based compensation expense is recorded in selling, general and administrative expenses in the consolidated statements of operations.
We estimate fair value of each stock option grant on the date of grant based upon the Black-Scholes option pricing model, with exception to a special one-time initial public offering transaction bonus grant which was valued on the date of grant using the Monte Carlo simulation method.
F-13
The Black-Scholes option pricing model requires various significant judgmental assumptions in order to derive a final fair value determination for each type of award including the following:
|
· |
Expected term—The expected term of the options represents the period of time between the grant date of the options and the date the options are either exercised or canceled. |
|
· |
Expected volatility—The expected volatility is calculated based on the historical volatility of the common stock for comparable companies. |
|
· |
Expected dividend yield—The expected dividend yield is based on our expectation of not paying dividends on its common stock for the foreseeable future. |
|
· |
Risk-free interest rate—The risk-free interest rate is the average of the 3-year and 5-year U.S. Treasury rate in effect at the time of grant and with a maturity that approximates the expected term. |
We used a Monte Carlo simulation model to determine the fair value of the special one-time initial public offering transaction bonus grant subject to market-based conditions. The stock option grants subject to market-based conditions have cliff vesting beginning in the third quarter of fiscal year 2017 and continuing through the following eight quarters subject to the achievement of market conditions. We valued the stock option grants as a single award with the related compensation cost recognized using a straight-line method over the derived service period. The expected volatility is based on a combination of historical and implied volatilities of the common stock for comparable companies.
All grants of our stock options have an exercise price equal to or greater than the fair market value of our common stock on the date of grant, based on the foregoing estimates and assumptions. Because we were a privately held company prior to August 4, 2016 and there was no public market for our common stock, the fair value of our equity was approved by our Board at the time option grants were awarded. In estimating the fair value of our common stock, we considered factors we believed to be material to the valuation process including, but not limited to, our actual and projected financial results, risks and prospects and economic and market conditions. Our valuations utilized projections of our future performance, estimates of our weighted average cost of capital and metrics based on the performance of a peer group of similar companies, including valuation multiples and stock price volatility.
We believe the combination of these methods provided an appropriate estimate of our expected fair value prior to our initial public offering. We considered the valuation analyses to determine the best estimate of the fair value of our common stock at each stock option grant date. Following the initial public offering, such estimates are no longer needed to determine fair value for new awards due to a publicly-available trading price for our common stock.
Income Taxes
The provision for income taxes is accounted for under the asset and liability method prescribed by ASC 740 (Topic 740, “Income Taxes”). Deferred tax assets and liabilities are recognized for the future tax consequences attributable to differences between the financial statement carrying amounts of existing assets and liabilities and their respective tax bases, operating losses and tax credit carryforwards. Deferred tax assets and liabilities are measured using the enacted tax rates expected to apply to taxable income in the years in which those temporary differences are expected to be recovered or settled. The effect on deferred tax assets and liabilities of a change in tax rates is recognized in income in the period the tax rate changes are enacted. We record a valuation allowance to reduce the carrying amounts to the amount that is believed more likely than not to be realized.
We recognize the tax benefit from an uncertain tax position only if it is more likely than not the tax position will be sustained on examination by the taxing authorities, based on the technical merits of the position. The tax benefits
F-14
recognized in the financial statements from such positions are then measured based on the largest benefit that has a greater than 50% likelihood of being realized upon settlement.
Recent Accounting Pronouncements
In May 2014, the FASB issued ASU No. 2014-09, “Revenue from Contracts with Customers” (“ASU 2014-09”). ASU 2014-09 supersedes the revenue recognition requirements in “Topic 605, Revenue Recognition”, and requires entities to recognize revenue in a way that depicts the transfer of promised goods or services to customers in an amount that reflects the consideration to which the entity expects to be entitled to in exchange for those goods or services. ASU 2014-09 is effective for annual reporting periods beginning after December 15, 2017, including interim periods within that reporting period. We completed an initial impact assessment and believe adopting this ASU will not materially impact the timing of revenue recognition. We expect to adopt this new guidance using the full retrospective method in the first quarter of fiscal year 2019.
In February 2016, the FASB issued ASU No. 2016-02 “Leases”, which supersedes ASC 840 “Leases” and creates a new topic, ASC 842 “Leases” (“ASU 2016-02”). Under ASU 2016-02, an entity will be required to recognize right-of-use assets and lease liabilities on its balance sheet and disclose key information about leasing arrangements. ASU 2016-02 offers specific accounting guidance for a lessee, a lessor and sale and leaseback transactions. Lessees and lessors are required to disclose qualitative and quantitative information about leasing arrangements to enable a user of the financial statements to assess the amount, timing and uncertainty of cash flows arising from leases. ASU 2016-02 is effective for annual reporting periods beginning after December 15, 2018, including interim periods within that reporting period, with early adoption permitted. At adoption, this update will be applied using a modified retrospective approach. We are currently evaluating the impact of ASU 2016-02 and we expect that upon adoption we will recognize right-of-use assets and liabilities that could be material to our financial statements.
In March 2016, the FASB issued ASU No. 2016-04, “Recognition of Breakage for Certain Prepaid Stored-Value Products” (“ASU 2016-04”). ASU 2016-04 requires that breakage on prepaid stored-value product liabilities (for example, prepaid gift cards) be accounted for consistent with the breakage guidance in “Topic 606, Revenue from Contracts with Customers”. ASU 2016-04 is effective for annual reporting periods beginning after December 15, 2017, including interim reporting periods within that reporting period, with early adoption permitted. This standard is to be applied either using a modified retrospective approach or retrospectively to each period presented. We are currently evaluating the impact of AS 2016-04 and we expect to adopt this new guidance using the full retrospective method in the first quarter of fiscal year 2019.
In March 2016, the FASB issued ASU No. 2016-09, “Improvements to Employee Share-Based Payment Accounting” (“ASU 2016-09”). ASU 2016-09 is intended to simplify various aspects of the accounting for employee share-based payment award transactions and is effective for annual reporting periods beginning after December 15, 2016, including interim periods within that reporting period, with early adoption permitted. We plan to adopt ASU 2016-09 prospectively for annual reporting periods beginning in the first quarter of fiscal year 2018. We have evaluated ASU 2016-09 and do not expect the impact of this guidance to have an immediate material impact on our consolidated financial statements, given that we have no historical exercises of stock options as of January 28, 2017. However, under certain circumstances, this guidance will have an impact on our effective tax rate in the future as the adoption of ASU 2016-09 also requires all income tax adjustments to be recorded in the consolidated statements of operations and changes between tax and book treatment of equity compensation will be recognized in the provision for income taxes beginning in fiscal year 2018. Under the adoption of ASU 2016-09, Management will elect the accounting policy to continue to estimate the number of awards expected to be forfeited and adjust those estimates when it is no longer probable each period.
In August 2016, the FASB issued ASU No. 2016-15, “Classification of Certain Cash Receipts and Cash Payments” (“ASU 2016-15”). ASU 2016-15 is intended to reduce the diversity in practice around how certain transactions are classified within the statement of cash flows. ASU 2016-15 is effective for annual reporting periods
F-15
beginning after December 15, 2017, including interim periods within that reporting period, with early adoption permitted. We are currently evaluating the impact of ASU 2016-15.
In November 2016, the FASB issued ASU No. 2016-18, “Restricted Cash” (“ASU 2016-18”). ASU 2016-18 is intended to reduce the diversity in practice around how restricted cash is classified within the statement of cash flows. ASU 2016-18 is effective for annual reporting periods beginning after December 15, 2017, including interim periods within that reporting period, with early adoption permitted. We are currently evaluating the impact of ASU 2016-18.
In January 2017, the FASB issued ASU No. 2017-04, “Simplifying the Test for Goodwill Impairment” (“ASU 2017-04”). ASU 2017-04 simplifies the measurement of goodwill impairment by removing the second step of the goodwill impairment test, which requires the determination of the fair value of individual assets and liabilities of a reporting unit. Under ASU 2017-04, goodwill impairment is to be measured as the amount by which a reporting unit’s carrying value exceeds its fair value with the loss recognized not to exceed the total amount of goodwill allocated to the reporting unit. ASU 2017-04 is effective for fiscal years beginning after December 15, 2019, with early adoption permitted for interim or annual goodwill impairment tests performed after January 1, 2017. The standard is to be applied on a prospective basis. We are currently evaluating the impact of ASU 2017-04 and do not anticipate a material impact to the consolidated financial statements once implemented.
2. Property and Equipment
Property and equipment consists of the following (in thousands):
|
|
|
January 28, |
|
January 30, |
|
||
|
|
|
2017 |
|
2016 |
|
||
|
|
|
|
|
|
|
|
|
|
Land |
|
$ |
33,531 |
|
$ |
35,520 |
|
|
Buildings |
|
|
85,116 |
|
|
70,646 |
|
|
Computer hardware and software |
|
|
32,212 |
|
|
18,241 |
|
|
Equipment, furniture and fixtures |
|
|
93,427 |
|
|
68,274 |
|
|
Leasehold improvements |
|
|
165,058 |
|
|
104,317 |
|
|
Construction in progress |
|
|
32,738 |
|
|
36,017 |
|
|
|
|
|
442,082 |
|
|
333,015 |
|
|
Less: accumulated depreciation and amortization |
|
|
(101,724) |
|
|
(60,239) |
|
|
Property and equipment, net |
|
$ |
340,358 |
|
$ |
272,776 |
|
Depreciation and amortization expense for the fiscal years ended January 28, 2017, January 30, 2016 and January 31, 2015 totaled approximately $36.9 million, $28.7 million and $23.3 million, respectively. Approximately $32.7 million, $26.2 million and $18.0 million of depreciation and amortization expense is included in cost of sales for the fiscal years ended January 28, 2017, January 30, 2016 and January 31, 2015, respectively. In addition, depreciation and amortization expense for the fiscal year ended January 31, 2015 includes $4.0 million in amortization expense related to our former Garden Ridge trade name definite-lived intangible asset.
3. Sale-Leaseback Transactions
In September 2016, we sold three of our properties in Colorado Springs, Colorado; Kissimmee, Florida; and O’Fallon, Illinois for a total of $30.6 million resulting in a net gain of $16.9 million. Contemporaneously with the closing of the sale, we entered into a lease pursuant to which we leased back the properties for cumulative initial annual rent of $2.1 million, subject to annual escalations. The lease is being accounted for as an operating lease. The net gain on the sale of the properties has been deferred and is included in deferred rent liabilities in the accompanying consolidated
F-16
balance sheets. The gain will be amortized to rent expense on a straight-line basis through the lease term, or September 2031.
In August 2016, we sold four of our properties in Broomfield, Colorado; Corpus Christi, Texas; Jenison, Michigan; and Buford, Georgia for a total of $32.6 million resulting in a net gain of $14.2 million. Contemporaneously with the closing of the sale, we entered into a lease pursuant to which we leased back the properties for cumulative initial annual rent of $2.2 million, subject to annual escalations. The lease is being accounted for as an operating lease. The net gain on the sale of the properties has been deferred and is included in deferred rent liabilities in the accompanying consolidated balance sheets. The gain will be amortized to rent expense on a straight-line basis through the lease term, or July 2031. Approximately $3.7 million of the proceeds from the sale were used to pay off a note payable related to the Corpus Christi property.
In September 2015, we sold five of our properties in Grand Prairie, Texas; Toledo, Ohio; Pharr, Texas; New Braunfels, Texas; and Gulfport, Mississippi for a total of $40.2 million resulting in a net gain of $15.8 million. Contemporaneously with the closing of the sale, we entered into a lease pursuant to which we leased back the properties for cumulative initial annual rent of $2.7 million, subject to annual escalations. The lease is being accounted for as an operating lease. The net gain on the sale of the properties has been deferred and is included in deferred rent liabilities in the accompanying consolidated balance sheets. The gain will be amortized to rent expense on a straight-line basis through the lease term, or September 2030. Approximately $5.5 million of the proceeds from the sale were used to pay off notes payable related the Grand Prairie and New Braunfels properties.
In January 2015, we sold our property located in Omaha, Nebraska for approximately $8.0 million, resulting in a net gain of $2.7 million. Contemporaneously with the closing of the sale, we entered into a lease, pursuant to which we leased back the property for cumulative initial annual rent of $0.5 million, subject to annual escalations. The lease is being accounted for as an operating lease. The net gain on the sale of the property has been deferred and is included in deferred rent liabilities in the accompanying consolidated balance sheets. The gain will be amortized to rent expense on a straight-line basis through the lease term, or January 2030.
In September 2014, we sold four of our properties in Raleigh, North Carolina; Mesa, Arizona; Lubbock, Texas; and Louisville, Kentucky for a total of $40.9 million, resulting in a net gain of $17.1 million. Contemporaneously with the closing of the sale, we entered into four leases, pursuant to which we leased back the properties for cumulative initial annual rent of $2.8 million, subject to annual escalations. The leases on the Raleigh, Lubbock and Louisville properties are being accounted for as operating leases. The lease on the Mesa property is being accounted for as a financing transaction in accordance with ASC 840-40-55 (Topic 840, “Leases”) due to a prohibited form of continuing involvement related to an existing sublease on that property (See Note 7—Financing Obligations). The $17.1 million net gain associated with the sale of these properties has been deferred and is included in deferred rent liabilities in the accompanying consolidated balance sheets. The gain will be amortized to rent expense on a straight-line basis through the lease terms, or September 2029. The sales of the properties located in Lubbock and Louisville are being treated as like-kind exchanges for U.S. federal income tax purposes in accordance with the Code.
F-17
4. Accrued Liabilities
Accrued liabilities consist of the following (in thousands):
|
|
|
January 28, |
|
January 30, |
|
||
|
|
|
2017 |
|
2016 |
|
||
|
|
|
|
|
|
|
|
|
|
Inventory in-transit |
|
$ |
10,833 |
|
$ |
14,817 |
|
|
Accrued payroll and other employee-related liabilities |
|
|
12,498 |
|
|
10,089 |
|
|
Accrued taxes, other than income |
|
|
10,029 |
|
|
8,345 |
|
|
Accrued interest |
|
|
3,807 |
|
|
337 |
|
|
Insurance liabilities |
|
|
3,247 |
|
|
3,505 |
|
|
Construction costs |
|
|
6,295 |
|
|
4,210 |
|
|
Accrued inbound freight |
|
|
10,554 |
|
|
757 |
|
|
Other |
|
|
17,176 |
|
|
12,412 |
|
|
Total accrued liabilities |
|
$ |
74,439 |
|
$ |
54,472 |
|
5. Revolving Line of Credit
In October 2011, At Home III and At Home Stores (collectively, the “ABL Borrower”), entered into an Asset-Based Lending Credit Facility (“ABL Facility”) which provided for cash borrowings or issuances of letters of credit based on defined percentages of eligible inventory and credit card receivable balances up to a maximum facility limit of $80.0 million. In May 2012, the ABL Borrower entered into the First Amendment to the Credit Agreement, which amended the ABL Facility to, among other things, permit the Senior Secured Notes to be issued. In May 2013, the ABL Borrower entered into the Second Amendment to the Credit Agreement, which amended the ABL Facility to increase the facility limit to $90.0 million, extend the maturity from October 2016 to May 2018, reduce the interest rate and fees and amend various other covenants and related definitions. In July 2014, the ABL Borrower entered into the Third Amendment to the Credit Agreement which further amended the ABL Facility to modify certain financial terms and other covenants. Such modifications included increasing the facility from $90.0 million to $140.0 million; extending the scheduled maturity date from May 2018 to July 2019; reducing the margin on borrowings by 0.25%; providing for the release of certain real property collateral in specified circumstances; adding Wells Fargo Bank, National Association as a new lender under the ABL Facility and amending various other covenants, terms and related definitions to provide additional flexibility with the ABL Facility. The ABL Facility is secured by substantially all of the ABL Borrower's assets with a first lien on certain assets, including primarily inventory and accounts receivable and related assets (the “ABL Priority Collateral”), and a second lien on all non-ABL Priority Collateral.
In June 2015, the ABL Borrower entered into the Fourth Amendment to the Credit Agreement which further amended the ABL Facility to modify certain provisions of the agreement to, among other things, permit the Term Loan Facilities to be issued and amend certain terms in the ABL Facility to be consistent with the terms set forth in the Term Loan Facilities.
In June 2016, we amended the agreement governing the ABL Facility to exercise the $75.0 million accordion feature which increased the aggregate revolving commitments from $140.0 million to $215.0 million and increased the sublimit for the issuance of letters of credit from $10.0 million to $25.0 million. The other terms of the ABL Facility were not changed by the amendment.
Interest on borrowings under our ABL Facility is computed based on our average daily availability, at our option, of: (x) the higher of (i) the Federal Funds Rate plus 1/2 of 1.00%, (ii) the bank's prime rate and (iii) LIBOR plus 1.00%, plus in each case, an applicable margin of 0.25% to 0.75% or (y) the bank's LIBOR rate plus an applicable margin of 1.25% to 1.75%. The effective interest rate was approximately 2.00% for each of the fiscal years ended January 28, 2017, January 30, 2016 and January 31, 2015, respectively.
F-18
As of January 28, 2017, approximately $101.6 million was outstanding under the ABL Facility, approximately $3.6 million in face amount of letters of credit had been issued and we had availability of approximately $108.4 million. As of January 28, 2017, we were in compliance with all covenants prescribed in the ABL Facility.
The ABL Facility includes restrictions customarily found in such agreements on the ability of the ABL Borrower and the subsidiary guarantors to incur additional liens and indebtedness, make investments and dispositions, pay dividends to At Home II or enter into other transactions, among other restrictions, in each case subject to certain exceptions. Under the ABL Facility, the ABL Borrower and the subsidiary guarantors are permitted to pay dividends to At Home II, (a) so long as after giving effect to such payment, (i) availability is equal to or greater than 15% of the loan cap (i.e., the lesser of (x) the aggregate lender commitments under the ABL Facility and (y) the borrowing base) and (ii) if availability is less than 20% of the loan cap, the consolidated fixed charge coverage ratio is equal to or greater than 1.0 to 1.0, and (b) pursuant to certain other limited exceptions.
6. Long-Term Debt
Long-term debt consists of the following (in thousands):
|
|
|
January 28, |
|
January 30, |
|
||
|
|
|
2017 |
|
2016 |
|
||
|
|
|
|
|
|
|
|
|
|
Term Loan Facilities |
|
$ |
295,500 |
|
$ |
428,559 |
|
|
Note payable, bank (a) |
|
|
6,099 |
|
|
6,241 |
|
|
Note payable, bank |
|
|
— |
|
|
3,736 |
|
|
Obligations under capital leases |
|
|
8,630 |
|
|
— |
|
|
Total debt |
|
|
310,229 |
|
|
438,536 |
|
|
Less: current maturities |
|
|
3,552 |
|
|
3,248 |
|
|
Less: unamortized deferred debt issuance costs |
|
|
7,071 |
|
|
12,678 |
|
|
Long-term debt |
|
$ |
299,606 |
|
$ |
422,610 |
|
|
(a) |
Matures February 1, 2037; $42,697 payable monthly, including interest at 5.90%; secured by the location’s land and building. |
Aggregate annual maturities of long-term debt, excluding capital lease obligations, are as follows (in thousands):
|
|
|
January 28, |
|
|
|
|
|
2017 |
|
|
|
|
|
|
|
|
|
2018 |
|
$ |
3,152 |
|
|
2019 |
|
|
3,161 |
|
|
2020 |
|
|
3,171 |
|
|
2021 |
|
|
3,930 |
|
|
2022 |
|
|
2,443 |
|
|
Thereafter |
|
|
285,742 |
|
|
|
|
$ |
301,599 |
|
Term Loan Facilities
On June 5, 2015, our indirect wholly owned subsidiary, At Home Holding III Inc. (“Borrower”), entered into a first lien credit agreement (the “First Lien Agreement”), by and among the Borrower, At Home Holding II Inc. (“At Home II”), a direct wholly owned subsidiary of ours, as guarantor, various lenders and Bank of America, N.A., as
F-19
administrative agent and collateral agent. The First Lien Agreement provides for a $300.0 million term loan (“Term Loan”), which amount was borrowed on June 5, 2015. The Term Loan will mature on June 3, 2022, and is repayable in equal quarterly installments of approximately $0.8 million for an annual aggregate amount equal to 1% of the original principal amount of $300.0 million. The Borrower has the option of paying interest on a 1-month, 2-month or quarterly basis on the Term Loan at an annual rate of LIBOR (subject to a 1% floor) plus 4.00%, subject to, after a qualifying initial public offering, a 0.50% reduction if the Borrower achieves a specified secured net leverage ratio level, which was met subsequent to our initial public offering for the fiscal year ended January 28, 2017.
On June 5, 2015, the Borrower also entered into a second lien credit agreement (the “Second Lien Agreement”), by and among the Borrower, At Home II and Dynasty Financial II, LLC, as administrative agent, collateral agent and lender. The Second Lien Agreement provided for the Second Lien Term Loan (together with the Term Loan, the “Term Loan Facilities”), which amount was borrowed on June 5, 2015. The Second Lien Term Loan had a maturity date of June 5, 2023 and did not require periodic principal payments, with the total amount outstanding, plus accrued interest, due at maturity. The Borrower had the option of paying interest on a 1-month, 2-month or quarterly basis on the Second Lien Term Loan at an annual rate of LIBOR (subject to a 1% floor) plus 8.00%.
The Term Loan Facilities have various non-financial covenants, representations and warranties, events of defaults and remedies, substantially similar to those described in respect of the ABL Facility. There are no financial maintenance covenants in the Term Loan Facilities.
At our option, the Term Loan was prepayable on or prior to June 5, 2016 subject to, in the case of a repricing transaction, a prepayment premium equal to the principal amount of Term Loan subject to such prepayment multiplied by 1%. Any prepayment of all or any portion of the outstanding Term Loan after June 5, 2016 is not subject to a premium.
The Borrower used the net proceeds from the Term Loan Facilities (i) to effect the refinancing of all outstanding indebtedness under the $360.0 million aggregate principal amount of 10.75% senior secured notes maturing on June 1, 2019 (the “Senior Secured Notes”), (ii) to pay fees and expenses in connection with Term Loan Facilities and the redemption of the Senior Secured Notes, (iii) to repay certain amounts outstanding under the ABL Facility, and (iv) for general corporate purposes.
During the fiscal year ended January 28, 2017, we used the net proceeds from our initial public offering and the partial exercise of the over-allotment option, after deducting underwriters’ discounts and commissions, to repay in full the $130.0 million of principal amount of indebtedness outstanding under our Second Lien Term Loan. The repayment resulted in a loss on extinguishment of debt in the amount of $2.7 million.
10.75% Senior Notes Due 2019
In May 2012, At Home III issued $360.0 million aggregate principal amount of Senior Secured Notes. The terms of the Senior Secured Notes were governed by the Indenture, dated May 16, 2012, among At Home III, the guarantors party thereto and Wells Fargo Bank, National Association, as Trustee. Interest was payable semi-annually in arrears on each June 1 and December 1, commencing on December 1, 2012.
The Senior Secured Notes were fully and unconditionally guaranteed, jointly and severally, on a senior secured basis by our restricted subsidiaries. The Senior Secured Notes and the related guarantees were secured, subject to certain exceptions, by (i) a first priority lien on substantially all of our and the guarantors' assets (other than inventory and accounts receivable and related assets, which assets secure our ABL Facility on a first priority basis (the “ABL Priority Collateral”)), including first priority liens on any capital stock held by us or a guarantor, and (ii) a second priority lien on the ABL Priority Collateral.
F-20
The Indenture contained customary covenants limiting At Home III's and its restricted subsidiaries' operations. It also provided for events of default that, in certain circumstances, permitted acceleration of the payment of principal, premium, if any, and interest on the then outstanding Senior Secured Notes.
On June 5, 2015, At Home III completed the redemption of the Senior Secured Notes at a price equal to 108.063% for total cash consideration of $389.4 million, which included a $29.0 million early redemption premium and $0.4 million of accrued interest. The redemption resulted in a loss on extinguishment of debt in the amount of approximately $36.0 million.
The restricted net assets of At Home Group's consolidated subsidiaries was $542.1 million as of January 28, 2017.
7. Financing Obligations
In some cases, the assets we lease require construction in order to ready the space for its intended use and, in certain cases, we are involved in the construction of leased assets. The construction period typically begins when we execute our lease agreement with the landlord and continues until the space is substantially complete and ready for its intended use. In accordance with ASC 840-40-55, we must consider the nature and extent of our involvement during the construction period and, in some cases, our involvement results in our being considered the accounting owner of the construction project. By completing the construction of key structural components of a leased building, we are deemed to have participated in the construction of the landlord asset. In such cases, we capitalize the landlord's construction costs, including the value of costs incurred up to the date we execute our lease and costs incurred during the remainder of construction period, as such costs are incurred. Additionally, ASC 840-40-55 requires us to recognize a financing obligation for construction costs incurred by the landlord. Once construction is complete, we are required to perform a sale-leaseback analysis pursuant to ASC 840-40 to determine if we can remove the landlord's assets and associated financing obligations from our consolidated balance sheet. In certain leases, we maintain various forms of “prohibited continuing involvement” in the property, thereby precluding us from derecognizing the asset and associated financing obligations following the construction completion. In those cases, we will continue to account for the landlord's asset as if we are the legal owner, and the financing obligation, similar to other debt, until the lease expires or is modified to remove the continuing involvement that prohibits derecognition. Once derecognition is permitted, we would be required to account for the lease as either operating or capital in accordance with ASC 840. As of January 28, 2017 we have not derecognized any landlord assets or associated financing obligations.
8. Related Party Transactions
In connection with the initial public offering, the management agreement with our controlling shareholder, AEA Investors LP (“AEA”), an affiliate of our controlling shareholder, and affiliated co-investors including Starr Investment Holdings, LLC (“Starr Investments” and, together with AEA, the “Sponsors”), was terminated as of August 3, 2016 and the Sponsors no longer receive management fees from us. Following our initial public offering, the Sponsors own approximately 85% of our outstanding common stock.
We were previously obligated to pay management fees of approximately $2.6 million annually to AEA. We recognized management fees and reimbursed expenses of approximately $1.4 million during the fiscal year ended January 28, 2017 and approximately $2.7 million during each of the fiscal years ended January 30, 2016 and January 31, 2015.
We were also obligated to pay management fees of approximately $0.9 million annually to Starr Investments. We recognized management fees of approximately $0.5 million during the fiscal year ended January 28, 2017 and approximately $0.9 million during each of the fiscal years ended January 30, 2016 and January 31, 2015.
F-21
In addition, Starr Indemnity & Liability Company, an affiliate of Starr Investments, was an underwriter for our general liability and workers' compensation insurance policies that were effective until December 1, 2013. The total cost of the policies was approximately $2.3 million, of which approximately $1.9 million was paid during the fiscal year ended January 31, 2015. These policies expired on December 1, 2014 and were replaced with policies underwritten by an unrelated party.
Until November 1, 2016, affiliates of AEA owned a significant equity position in Dematic Corporation, an external vendor that designs, develops and delivers solutions that optimize companies' supply chain, improve performance and increase productivity through intelligent warehouse logistics and materials handling solutions. In February 2014, we executed an agreement with Dematic Corporation for the installation of a system to assist in the automation of our distribution center. During the fiscal years ended January 28, 2017 and January 31, 2015, we paid Dematic Corporation approximately $0.4 million and $7.2 million, respectively, under the agreement which is primarily recorded in property and equipment, net. Affiliates of AEA disposed of their interest in Dematic Corporation as of November 1, 2016, and Dematic Corporation is no longer a related party.
Merry Mabbett Inc. (“MMI”) is owned by Merry Mabbett Dean, who is the mother of Lewis L. Bird III, our Chief Executive Officer. During the fiscal years ended January 28, 2017, January 30, 2016 and January 31, 2015, Ms. Dean, through MMI, provided certain design services to us, including design for our home office, as well as design in our stores. In addition, through MMI, we purchased certain fixtures, furniture and equipment that is now owned and used by us in our home office, new store offices or in the product vignettes in the stores. During the fiscal year ended January 28, 2017, we paid MMI approximately $0.2 million for fixtures, furniture and equipment and design related services. During each of the fiscal years ended January 30, 2016 and January 31, 2015, we paid MMI approximately $0.4 million for fixtures, furniture and equipment and design related services.
9. Income Taxes
Our income tax provision (benefit) is as follows (in thousands):
|
|
Fiscal Year Ended |
|
||||||||||
|
|
January 28, |
|
January 30, |
|
January 31, |
|
||||||
|
|
2017 |
|
2016 |
|
2015 |
|
||||||
|
Current income tax expense (benefit) |
|
|
|
|
|
|
|
|
|
|
|
|
|
Federal |
$ |
36,956 |
|
$ |
(1,673) |
|
$ |
4,552 |
|
|||
|
State |
|
4,756 |
|
|
(178) |
|
|
1,797 |
|
|||
|
|
|
|
|
|
|
|
|
|
|
|
|
|
|
Deferred income tax expense (benefit) |
|
|
|
|
|
|
|
|
|
|
|
|
|
Federal |
|
(22,261) |
|
|
(11,227) |
|
|
(1,471) |
|
|||
|
State |
|
(3,729) |
|
|
(1,082) |
|
|
(521) |
|
|||
|
Income tax provision (benefit) |
$ |
15,722 |
|
$ |
(14,160) |
|
$ |
4,357 |
|
|||
F-22
Deferred tax assets and liabilities are determined based on the estimated future tax effects of the difference between the financial statement and tax basis of asset and liability balances using statutory tax rates. Tax effects of temporary differences that give rise to significant components of the deferred tax assets and liabilities are as follows (in thousands):
|
|
|
January 28, |
|
January 30, |
|
||
|
|
|
2017 |
|
2016 |
|
||
|
Deferred tax assets |
|
|
|
|
|
|
|
|
Inventory |
|
$ |
5,968 |
|
$ |
5,086 |
|
|
Accruals |
|
|
5,756 |
|
|
4,617 |
|
|
Deferred rent |
|
|
8,101 |
|
|
5,272 |
|
|
Net operating losses |
|
|
314 |
|
|
630 |
|
|
Deferred gains |
|
|
36,778 |
|
|
21,913 |
|
|
Deferred compensation |
|
|
8,641 |
|
|
5,062 |
|
|
Prepaid rent |
|
|
2,742 |
|
|
— |
|
|
Other, net |
|
|
4,597 |
|
|
1,706 |
|
|
Total deferred tax assets |
|
|
72,897 |
|
|
44,286 |
|
|
Less: Valuation allowance |
|
|
(314) |
|
|
(571) |
|
|
Deferred tax assets, net of valuation |
|
|
72,583 |
|
|
43,715 |
|
|
|
|
|
|
|
|
|
|
|
Deferred tax liabilities |
|
|
|
|
|
|
|
|
Property and equipment |
|
|
(29,550) |
|
|
(25,658) |
|
|
Debt cancellation income |
|
|
(2,237) |
|
|
(3,313) |
|
|
Trade name |
|
|
(61) |
|
|
(18) |
|
|
Total deferred tax liabilities |
|
|
(31,848) |
|
|
(28,989) |
|
|
Net deferred tax asset |
$ |
40,735 |
$ |
14,726 | |||
We are required to assess the available positive and negative evidence to estimate if sufficient future income will be generated to utilize deferred tax assets. We believe the cumulative pre-tax income is a significant piece of positive evidence that allows us to consider other subjective evidence such as future forecasted pre-tax income. For the fiscal year ended January 31, 2015, we determined we had three years of cumulative pre-tax income after excluding the $37.5 million tradename impairment recognized during the fiscal year 2014, which we consider to be unusual in nature because it was a result of our rebranding initiative. However, we did not believe that our three year cumulative pre-tax income position was positive evidence that we could consider because our rebranding efforts were still in the early stages and we had not yet demonstrated our ability to forecast our results of operations.
For the fiscal year ended January 30, 2016, after excluding the trade name impairment, we determined that we continued to have three years of cumulative pre-tax income. In addition, taxable income (loss) exceeded pre-tax income (loss) for the fiscal year ended January 30, 2016 and for each of the two preceding fiscal years. As of January 30, 2016, we had completed approximately 18 months of operations following our rebranding initiative as well as demonstrated our ability to more accurately forecast the results of our operations. We concluded that because of this positive evidence, along with taxable income in the prior two fiscal years to absorb loss carrybacks that would be generated by reversing deductible differences in excess of reversing taxable differences, as well as cumulative pre-tax income (exclusive of the tradename impairment) in recent fiscal years, it was more likely than not that our deferred tax assets would be realized in future years. Accordingly, during fiscal year 2016 we reversed $6.0 million of the valuation allowance on deferred tax assets, with an offsetting credit to the provision for income taxes.
For the fiscal year ended January 28, 2017 we continued to have three years of cumulative pre-tax income. In addition, taxable income (loss) exceeded pre-tax income (loss) for the fiscal year ended January 28, 2017 and for each of the two preceding fiscal years. We concluded that because of this positive evidence, along with taxable income in the carryback period to absorb losses that would be generated by reversing deductible differences in excess of reversing taxable differences, as well as cumulative pre-tax income in recent fiscal years, it was more likely than not that our
F-23
deferred tax assets would be realized in future years. Accordingly, during fiscal year 2017, we determined no valuation allowance, with the exception of state net operating losses, was required.
Our valuation allowances totaled $0.3 million and $0.6 million as of January 28, 2017 and January 30, 2016, respectively. The change was mainly due to utilization of losses in certain jurisdictions.
We had approximately $8.2 million and $15.8 million of state net operating loss carryforwards at January 28, 2017 and January 30, 2016, respectively. The state net operating losses begin to expire in fiscal year 2023. We determined that the valuation allowance for state net operating losses was appropriate for the fiscal years ended January 28, 2017 and January 30, 2016.
The reconciliation between the actual income tax provision (benefit) and the income tax provision (benefit) calculated at the federal statutory tax rate is as follows (dollars in thousands):
|
|
Fiscal Year Ended |
|
|
|||||||||
|
|
January 28, |
|
|
January 30, |
|
|
January 31, |
|
|
|||
|
|
2017 |
|
|
2016 |
|
|
2015 |
|
|
|||
|
|
|
|
|
|
|
|
|
|
|
|
|
|
|
Income tax provision (benefit) at the federal statutory rate |
$ |
14,976 |
|
|
$ |
(3,705) |
|
|
$ |
1,372 |
|
|
|
Permanent differences |
|
625 |
|
|
|
122 |
|
|
|
55 |
|
|
|
State income taxes, net of federal income tax effect |
|
924 |
|
|
|
(636) |
|
|
|
1,276 |
|
|
|
Change in unrecognized tax benefits |
|
(378) |
|
|
|
(2,078) |
|
|
|
678 |
|
|
|
Change in valuation allowance |
|
(257) |
|
|
|
(6,009) |
|
|
|
1,027 |
|
|
|
Tax credits |
|
(141) |
|
|
|
(59) |
|
|
|
(55) |
|
|
|
Deferred adjustment |
|
(23) |
|
|
|
(1,632) |
|
|
|
— |
|
|
|
Other |
|
(4) |
|
|
|
(163) |
|
|
|
4 |
|
|
|
Income tax provision (benefit) |
$ |
15,722 |
|
|
$ |
(14,160) |
|
|
$ |
4,357 |
|
|
|
Effective tax rate |
|
36.7 |
% |
|
|
133.8 |
% |
|
|
111.1 |
% |
|
Uncertain Tax Positions
We operate in a number of tax jurisdictions and are subject to examination of its income tax returns by tax authorities in those jurisdictions who may challenge any item on these returns. Because the tax matters challenged by tax authorities are typically complex, the ultimate outcome of these challenges is uncertain. In accordance with ASC 740 (Topic 740, “Income Taxes”), we recognize the benefits of uncertain tax positions in our consolidated financial statements only after determining that it is more likely than not that the uncertain tax positions will be sustained.
The total amount of unrecognized tax benefits as of January 28, 2017 was $2.6 million, $0.7 million of which would favorably impact the effective tax rate if resolved in our favor.
A reconciliation of the beginning and ending amount of unrecognized tax benefits is as follows (in thousands):
|
|
|
January 28, |
|
January 30, |
|
||
|
|
|
2017 |
|
2016 |
|
||
|
|
|
|
|
|
|
|
|
|
Balance, beginning of period |
|
$ |
3,076 |
|
$ |
5,720 |
|
|
Additions based on tax positions related to the current year |
|
|
233 |
|
|
453 |
|
|
Subtractions based on tax positions related to the prior year |
|
|
(563) |
|
|
(2,425) |
|
|
Settlements |
|
|
— |
|
|
(69) |
|
|
Expiration of statute of limitations |
|
|
(193) |
|
|
(603) |
|
|
Balance, end of period |
|
$ |
2,553 |
|
$ |
3,076 |
|
F-24
We recognize accrued interest and penalties related to unrecognized tax benefits in our provision for income taxes. As of January 28, 2017 and January 30, 2016, there was approximately $0.1 million in accrued penalties. As of January 28, 2017 and January 30, 2016, there was approximately $0.2 million in accrued interest. In addition, we recognized an immaterial amount of interest expense and penalties during the fiscal year ended January 28, 2017 and we released approximately $0.1 million in interest expense during the fiscal year ended January 30, 2016.
In the normal course of business, we are subject to examination by taxing authorities in U.S. Federal and U.S. state jurisdictions. The period subject to examination for our federal return is fiscal year 2014 and later since all prior years have been audited with no changes and fiscal year 2013 and later for all major state tax returns. We believe that an adequate provision has been made for any adjustments that may result from tax examinations. However, the outcome of tax audits cannot be predicted with certainty. If any issues addressed in our tax audits are resolved in a manner not consistent with management's expectations, we could be required to adjust the provision for income tax in the period such resolution occurs.
10. Commitments and Contingencies
Leases
We lease space for certain of our retail properties, our distribution center and corporate office pursuant to leases that expire at various dates through 2036. A number of the leases have renewal options for various periods of time at our discretion. We are typically responsible for taxes, utilities, insurance, repairs and maintenance for these retail properties. Certain leases require the payment of contingent rent based on a specified percentage of stores' gross sales, as defined in the lease agreement, and are subject to certain limitations. An immaterial amount of contingent rent was paid during the fiscal years ended January 28, 2017 and January 30, 2016 and no contingent rent was required to be paid for the fiscal year ended January 31, 2015. Rent expense for the fiscal years ended January 28, 2017, January 30, 2016 and January 31, 2015 totaled approximately $68.1 million, $52.3 million and $42.9 million, respectively.
Future minimum annual rental commitments for all leases are as follows (in thousands):
|
|
|
Capital |
|
Operating |
|
Financing |
|
|
||||
|
|
|
Leases |
|
Leases |
|
Obligations |
|
Total |
||||
|
|
|
|
|
|
|
|
|
|
|
|
|
|
|
2018 |
|
$ |
623 |
|
$ |
70,840 |
|
$ |
1,916 |
|
$ |
73,379 |
|
2019 |
|
|
1,068 |
|
|
72,685 |
|
|
1,931 |
|
|
75,684 |
|
2020 |
|
|
7,445 |
|
|
71,199 |
|
|
1,946 |
|
|
80,590 |
|
2021 |
|
|
— |
|
|
68,232 |
|
|
1,974 |
|
|
70,206 |
|
2022 |
|
|
— |
|
|
66,597 |
|
|
2,008 |
|
|
68,605 |
|
Thereafter |
|
|
— |
|
|
577,490 |
|
|
9,150 |
|
|
586,640 |
|
Total minimum lease payments |
|
$ |
9,136 |
|
$ |
927,043 |
|
$ |
18,925 |
|
$ |
955,104 |
|
Less amount representing interest |
|
|
(506) |
|
|
|
|
|
|
|
|
|
|
Present value of minimum lease payments |
|
$ |
8,630 |
|
|
|
|
|
|
|
|
|
Minimum future annual rent receivable under operating subleases as of January 28, 2017 is approximately $0.2 million. Lease rental income was approximately $0.2 million for each of the fiscal years ended January 28, 2017, January 30, 2016, and January 31, 2015.
Litigation
We are subject to claims and lawsuits that arise primarily in the ordinary course of business. It is the opinion of management that the disposition or ultimate resolution of such claims and lawsuits will not have a material adverse effect on our consolidated financial position, results of operations or liquidity.
F-25
11. Employee Benefit Plan
Effective October 1, 2014, we sponsor a 401(k) Savings Plan for eligible employees. Participation in the 401(k) Savings Plan is voluntary and available to any employee who is at least 18 years of age and has completed six months of service. Participants may elect to contribute up to 100% of their compensation on a pre-tax basis subject to Internal Revenue Service (“IRS”) limitations. In accordance with the provisions of the 401(k) Savings Plan, we make a safe harbor matching cash contribution to the account of each participant in an amount equal to 100% of the participant's pre-tax contributions that do not exceed 3% of the participant's considered annual compensation plus 50% of the participant's pre-tax contributions between 3% and 5% of the participant's considered annual compensation, which are also subject to regulatory limits. Matching contributions, and any actual earnings thereon, vest to the participants immediately. Our matching contribution expenses were $0.8 million, $0.5 million and $0.2 million for the fiscal years ended January 28, 2017, January 30, 2016 and January 31, 2015, respectively.
12. Capital Stock
On July 22, 2016, our board of directors approved a 128.157393-for-one stock split of its existing Class A common stock, Class B common stock and Class C common stock and the conversion of such Class A common stock, Class B common stock and Class C common stock into a single class of common stock. All historical share and per share information has been retroactively adjusted to reflect the stock split and conversion. Effective July 22, 2016, our total authorized share capital is comprised of 500,000,000 shares of common stock and 50,000,000 shares of preferred stock.
On August 3, 2016, our Registration Statement on Form S-1 relating to our initial public offering was declared effective by the SEC pursuant to which we issued and sold 8,667,000 of the shares registered at a price of $15.00 per share on August 9, 2016.
On September 8, 2016, we issued and sold a further 863,041 shares of our common stock at a price of $15.00 per share pursuant to the underwriters’ partial exercise of the over-allotment option.
As of January 28, 2017, we had 500,000,000 shares of common stock authorized with a par value of $0.01, of which 60,366,768 were issued and outstanding. Additionally, as of January 28, 2017, we had 50,000,000 shares of preferred stock authorized with a par value of $0.01, of which no shares were issued and outstanding.
13. Earnings Per Share
In accordance with ASC 260, (Topic 260, “Earnings Per Share”), basic earnings per share is computed by dividing net income (loss) available to common stockholders by the weighted average number of common shares outstanding for the period. Diluted earnings per share is computed by dividing net income (loss) available to common stockholders by the weighted average shares outstanding for the period and include the dilutive impact of potential shares from the exercise of stock options. Potentially dilutive securities are excluded from the computation of diluted net income (loss) per share if their effect is anti-dilutive.
F-26
The following table sets forth the calculation of basic and diluted earnings per share as follows (dollars in thousands, except share and per share data):
|
|
|
Fiscal Year Ended |
|
|||||||
|
|
|
January 28, 2017 |
|
January 30, 2016 |
|
January 31, 2015 |
|
|||
|
Numerator: |
|
|
|
|
|
|
|
|
|
|
|
Net income (loss) |
|
$ |
27,066 |
|
$ |
3,574 |
|
$ |
(436) |
|
|
|
|
|
|
|
|
|
|
|
|
|
|
Denominator: |
|
|
|
|
|
|
|
|
|
|
|
Weighted average common shares outstanding-basic |
|
|
55,414,037 |
|
|
50,836,727 |
|
|
50,836,727 |
|
|
Effect of dilutive securities: |
|
|
|
|
|
|
|
|
|
|
|
Stock options |
|
|
1,478,146 |
|
|
896,025 |
|
|
— |
|
|
Weighted average common shares outstanding-diluted |
|
|
56,892,183 |
|
|
51,732,752 |
|
|
50,836,727 |
|
|
|
|
|
|
|
|
|
|
|
|
|
|
Per common share: |
|
|
|
|
|
|
|
|
|
|
|
Basic net income (loss) per common share |
|
$ |
0.49 |
|
$ |
0.07 |
|
$ |
(0.01) |
|
|
Diluted net income (loss) per common share |
|
$ |
0.48 |
|
$ |
0.07 |
|
$ |
(0.01) |
|
For the fiscal years ended January 28, 2017, January 30, 2016 and January 31, 2015, approximately 1,514,168, 2,900,239 and 4,514,194, respectively, of stock options were excluded from the calculation of diluted net income (loss) per common share since their effect was anti-dilutive.
14. Stock-Based Compensation
We account for stock-based compensation in accordance with ASC 718 (Topic 718, “Compensation—Stock Compensation”), which requires all stock-based payments to employees, including grants of employee stock options, to be recognized in the consolidated financial statements over the requisite service period. Compensation expense based upon the fair value of awards is recognized on a straight-line basis, over the requisite service period for awards that actually vest. Stock-based compensation expense is recorded in selling, general and administrative expenses in the consolidated statements of operations.
We have two equity compensation plans (the “Equity Plans”) under which we grant equity awards: the GRD Holding I Corporation Stock Option Plan, as may be amended from time to time (the “2012 Option Plan”), and the At Home Group Inc. Equity Incentive Plan, which was subsequently amended and restated and approved by the Board in July 2016 (the “2016 Equity Plan”). Pursuant to the 2012 Option Plan, we have 5,648,525 shares of common stock reserved for the issuance of options to purchase shares. Any shares issued under the 2012 Option Plan that expire, are cancelled, or otherwise terminate without issuance of the shares shall again be available for issuance. At January 28, 2017, there were no shares available for future grant under the 2012 Option Plan.
In September 2015, we adopted the 2016 Equity Plan, which was subsequently amended and restated and approved by the Board in July 2016. Under the 2016 Equity Plan, equity awards may be made for up to 6,196,755 shares of our common stock. Subject to any adjustment as provided in the 2016 Plan, (i) up to 2,478,702 shares (the ‘‘IPO Bonus Pool’’) were issuable pursuant to awards granted under the 2016 Equity Plan to senior executives of the Company in connection with the consummation of our initial public offering and (ii) up to 3,718,053 shares may be issued pursuant to awards granted under the 2016 Equity Plan (other than the IPO Bonus Pool) (the "Post-IPO Share Pool"). At January 28, 2017, there were 3,764,139 shares available for future grant under the 2016 Plan.
On August 3, 2016, we made a special one-time initial public offering transaction bonus grant of 2,478,702 options to certain members of our senior management team under the 2016 Equity Plan (the “IPO Grant”). On August 3,
F-27
2016 we also granted to one employee an option to purchase 28,326 shares of common stock under the 2012 Option Plan at the initial public offering price.
Option awards are granted with an exercise price equal to the fair market value of our common stock at the date of grant. Option awards under the 2012 Option Plans generally vest based on four years of continuous service and have 10-year contractual terms. The IPO Grant is subject to market conditions in which vesting occurs if the closing price of the Company’s common stock achieves the pre-established targets at any time during the specified performance period of seven years from the date of the grant and exceeds the targets for twenty consecutive trading days, disregarding the six-month period immediately following August 3, 2016. Certain option and share awards provide for accelerated vesting if there is a change in control (as defined in the Equity Plans).
We determined the fair value of the IPO Grant subject to market conditions using a Monte Carlo simulation method. The IPO Grant had a grant date fair value of approximately $20.0 million, which will be incremental to our ongoing stock-based compensation expense. The stock-based compensation expense for the IPO Grant will be expensed over the derived service period, which began in the third fiscal quarter 2017 and will continue through the following eight quarters.
We estimate the fair value of each service condition stock option grant under the Equity Plans on the date of grant based upon the Black-Scholes option-pricing model which includes the following variables: 1) exercise price of the instrument, 2) fair market value of the underlying stock on date of grant, 3) expected term, 4) expected volatility and 5) the risk-free interest rate. We utilized the following assumptions in estimating the fair value of the option grants:
|
|
|
January 28, |
|
|
January 30, |
|
|
January 31, |
|
|
|
|
2017 |
|
|
2016 |
|
|
2015 |
|
|
|
|
|
|
|
|
|
|
|
|
|
Weighted-average expected volatility |
|
57.7 |
% |
|
40.5 |
% |
|
39.0 |
% |
|
Expected dividend yield |
|
— |
% |
|
— |
% |
|
— |
% |
|
Weighted-average expected term (in years) |
|
4.0 |
|
|
4.0 |
|
|
4.0 |
|
|
Weighted-average risk-free interest rate |
|
2.3 |
% |
|
1.1 |
% |
|
1.3 |
% |
A summary of option activity under the Equity Plans as of January 28, 2017, and changes during the fiscal year then ended, is presented below:
|
|
|
|
|
|
|
|
Weighted- |
|
|
|
|
|
|
Weighted- |
|
Average |
|
|
|
|
|
|
|
Average |
|
Remaining |
|
|
|
|
|
|
|
Exercise |
|
Contractual |
|
|
|
|
|
Options |
|
Price |
|
Term |
|
|
|
|
|
|
|
|
|
|
|
|
|
Outstanding, beginning of year |
|
5,620,199 |
|
$ |
10.18 |
|
|
|
|
Granted |
|
2,672,996 |
|
|
15.04 |
|
|
|
|
Exercised |
|
— |
|
|
— |
|
|
|
|
Forfeited or expired |
|
(212,054) |
|
|
16.36 |
|
|
|
|
Outstanding, end of year |
|
8,081,141 |
|
$ |
11.63 |
|
6.40 years |
|
|
Exercisable, end of year |
|
4,618,130 |
|
$ |
9.86 |
|
6.14 years |
|
We recognized stock-based compensation expense related to stock options of approximately $9.4 million, $4.7 million and $4.3 million during the fiscal years ended January 28, 2017, January 30, 2016 and January 31, 2015, respectively.
As of January 28, 2017, there was approximately $16.7 million of total unrecognized compensation expense related to nonvested share-based compensation arrangements granted under the Plans that is expected to be recognized over a weighted-average period of 1.29 years, which includes $13.7 million of remaining unrecognized compensation
F-28
expense associated with the IPO grant to certain members of our senior management in connection with our initial public offering.
15. Quarterly Results of Operations (Unaudited)
Unaudited quarterly results of operations for the fiscal years ended January 28, 2017 and January 30, 2016 were as follows (in thousands, except per share data):
|
|
|
Fiscal Year 2017 |
|
||||||||||
|
|
|
First Quarter |
|
Second Quarter |
|
Third Quarter |
|
Fourth Quarter |
|
||||
|
|
|
|
|
|
|
|
|
|
|
|
|
||
|
Net sales |
|
$ |
172,079 |
|
$ |
188,364 |
|
$ |
170,678 |
|
$ |
234,514 |
|
|
Gross profit(1) |
|
|
58,306 |
|
|
62,050 |
|
|
51,395 |
|
|
75,730 |
|
|
Operating income |
|
|
19,970 |
|
|
18,908 |
|
|
4,533 |
|
|
29,266 |
|
|
Loss on extinguishment of debt |
|
|
— |
|
|
— |
|
|
2,715 |
|
|
— |
|
|
Net income (loss) |
|
|
7,326 |
|
|
6,338 |
|
|
(1,856) |
|
|
15,258 |
|
|
Basic net income (loss) per common share(1) |
|
|
0.14 |
|
|
0.12 |
|
|
(0.03) |
|
|
0.25 |
|
|
Diluted net income (loss) per common share |
|
$ |
0.14 |
|
$ |
0.12 |
|
$ |
(0.03) |
|
$ |
0.25 |
|
|
|
|
|
|
|
|
|
|
|
|
|
|
|
|
|
|
|
Fiscal Year 2016 |
|
||||||||||
|
|
|
First Quarter |
|
Second Quarter |
|
Third Quarter |
|
Fourth Quarter |
|
||||
|
|
|
|
|
|
|
|
|
|
|
|
|
||
|
Net sales |
|
$ |
141,217 |
|
$ |
156,007 |
|
$ |
139,431 |
|
$ |
185,506 |
|
|
Gross profit |
|
|
47,305 |
|
|
52,772 |
|
|
41,438 |
|
|
58,896 |
|
|
Operating income |
|
|
16,898 |
|
|
20,951 |
|
|
4,638 |
|
|
19,732 |
|
|
Loss on extinguishment of debt |
|
|
— |
|
|
36,046 |
|
|
— |
|
|
— |
|
|
Net income (loss) |
|
|
1,768 |
|
|
(46,110) |
|
|
(10,857) |
|
|
58,773 |
|
|
Basic net income (loss) per common share |
|
|
0.03 |
|
|
(0.91) |
|
|
(0.21) |
|
|
1.16 |
|
|
Diluted net income (loss) per common share(1) |
|
$ |
0.03 |
|
$ |
(0.91) |
|
$ |
(0.21) |
|
$ |
1.12 |
|
|
(1) |
The sum of the quarters does not equal the total fiscal year due to rounding. |
F-29
Schedule I – Condensed Financial Information of Registrant
AT HOME GROUP INC. (parent company only)
Condensed Balance Sheets
(in thousands, except share and per share data)
|
|
|
January 28, 2017 |
|
January 30, 2016 |
|
||
|
Assets |
|
|
|
|
|
|
|
|
Current assets: |
|
|
|
|
|
|
|
|
Receivable from subsidiaries |
|
$ |
7,265 |
|
$ |
— |
|
|
Other current assets |
|
|
— |
|
|
2,218 |
|
|
Total current assets |
|
|
7,265 |
|
|
2,218 |
|
|
Investment in subsidiaries |
|
|
534,870 |
|
|
369,153 |
|
|
Total assets |
|
$ |
542,135 |
|
$ |
371,371 |
|
|
Liabilities and Shareholders' Equity |
|
|
|
|
|
|
|
|
Current liabilities: |
|
|
|
|
|
|
|
|
Income taxes payable |
|
$ |
7,265 |
|
$ |
— |
|
|
Payable to subsidiaries |
|
|
— |
|
|
2,218 |
|
|
Total current liabilities |
|
|
7,265 |
|
|
2,218 |
|
|
Noncurrent liabilities |
|
|
— |
|
|
— |
|
|
Total liabilities |
|
|
7,265 |
|
|
2,218 |
|
|
Shareholders' Equity |
|
|
|
|
|
|
|
|
Common stock; $0.01 par value; 500,000,000 shares authorized; 60,366,768 and 50,836,727 shares issued and outstanding, respectively |
|
|
604 |
|
|
508 |
|
|
Additional paid-in capital |
|
|
548,301 |
|
|
409,746 |
|
|
Accumulated deficit |
|
|
(14,035) |
|
|
(41,101) |
|
|
Total shareholders' equity |
|
|
534,870 |
|
|
369,153 |
|
|
Total liabilities and shareholders' equity |
|
$ |
542,135 |
|
$ |
371,371 |
|
See Notes to Condensed Financial Statements.
F-30
Schedule I – Condensed Financial Information of Registrant
AT HOME GROUP INC. (parent company only)
Condensed Statement of Operations
(in thousands)
|
|
|
Fiscal Year Ended |
|
|||||||
|
|
|
January 28, 2017 |
|
January 30, 2016 |
|
January 31, 2015 |
|
|||
|
|
|
|
|
|
|
|
|
|
||
|
Net sales |
|
$ |
— |
|
$ |
— |
|
$ |
— |
|
|
Cost of sales |
|
|
— |
|
|
— |
|
|
— |
|
|
Gross profit |
|
|
— |
|
|
— |
|
|
— |
|
|
|
|
|
|
|
|
|
|
|
|
|
|
Operating expenses |
|
|
|
|
|
|
|
|
|
|
|
Selling, general and administrative expenses |
|
|
— |
|
|
— |
|
|
— |
|
|
Depreciation and amortization |
|
|
— |
|
|
— |
|
|
— |
|
|
Total operating expenses |
|
|
— |
|
|
— |
|
|
— |
|
|
|
|
|
|
|
|
|
|
|
|
|
|
Operating income |
|
|
— |
|
|
— |
|
|
— |
|
|
Interest expense, net |
|
|
— |
|
|
— |
|
|
— |
|
|
Income before income taxes |
|
|
— |
|
|
— |
|
|
— |
|
|
Income tax provision |
|
|
— |
|
|
— |
|
|
— |
|
|
Income before equity in net income of subsidiaries |
|
|
— |
|
|
— |
|
|
— |
|
|
Net income (loss) from subsidiaries |
|
|
27,066 |
|
|
3,574 |
|
|
(436) |
|
|
Net income (loss) |
|
$ |
27,066 |
|
$ |
3,574 |
|
$ |
(436) |
|
See Notes to Condensed Financial Statements.
F-31
Schedule I – Condensed Financial Information of Registrant
AT HOME GROUP INC. (parent company only)
Notes to Condensed Financial Statements
1. Basis of Presentation
In the parent-company-only financial statements, At Home Group Inc.'s (“Parent”) investment in subsidiaries is stated at cost plus equity in undistributed earnings of subsidiaries since the date of acquisition. The parent-company-only financial statements should be read in conjunction with the Company's consolidated financial statements. A condensed statement of cash flows was not presented because At Home Group Inc.'s net operating activities have no cash impact and there were no investing or financing cash flow activities during the fiscal years ended January 28, 2017, January 30, 2016 and January 31, 2015.
2. Guarantees and Restrictions
At Home Holding III Inc. (“At Home III”), a subsidiary of the Parent, issued $360.0 million in aggregate principal amount of Senior Secured Notes on May 16, 2012 pursuant to the Indenture. Under the terms of the Indenture, the Senior Secured Notes were fully and unconditionally guaranteed, jointly and severally, on a senior secured basis by each of At Home III's existing and future domestic restricted subsidiaries (other than certain immaterial subsidiaries) that are wholly owned or guarantee any of At Home III's or its guarantors' indebtedness. In the event of a default under the Indenture, At Home Group III and its guaranteeing subsidiaries were directly liable to the holders of the Senior Secured Notes. The Senior Secured Notes were scheduled to mature on June 1, 2019. The Indenture contained covenants limiting, among other things, At Home III's ability and the ability of its restricted subsidiaries to incur additional debt, pay dividends or distributions on its capital stock to any direct or indirect parent company (including Parent) or repurchase its capital stock, issue stock of subsidiaries, make certain investments, create liens on its assets to secure debt, enter into transactions with affiliates, merge or consolidate with another company or sell or otherwise transfer assets, in each case subject to certain exceptions. Under the Indenture, At Home III was permitted to pay dividends to any direct or indirect parent company (including Parent) (a) up to an amount equal to (i) a basket that builds based on 50% of At Home III's Consolidated Net Income (as defined in the Indenture) and certain other amounts, subject to various conditions including compliance with a fixed charge coverage ratio of 2.0 to 1.0, plus (ii) $10 million and (b) in certain additional limited amounts, subject to certain limited exceptions. On June 5, 2015, At Home III completed the redemption of the Senior Secured Notes at a price equal to 108.063% for total cash consideration of $389.4 million, which includes a $29.0 million early redemption premium and $0.4 million of accrued interest.
At Home III and its indirect wholly-owned subsidiary, At Home Stores LLC, are co-borrowers (in such capacities, the “ABL Borrowers”) under the ABL Facility. The ABL Borrowers have $108.4 million of available credit under the ABL Facility which provides commitments of up to $215.0 million for revolving loans and letters of credit, as of January 28, 2017. At Home Holding II Inc. (“Holdings”), the direct parent of At Home III, and its direct and indirect domestic subsidiaries (other than the ABL Borrowers and certain immaterial subsidiaries)(the “ABL Subsidiary Guarantors” and, together with Holdings, the “ABL Guarantors”) have guaranteed all obligations of the ABL Borrowers under the ABL Facility. In the event of a default under the ABL Facility, the ABL Borrowers and the Guarantors will be directly liable to the lenders under the ABL Facility. The ABL Facility, which matures on July 28, 2019, includes restrictions on the ability of ABL Borrowers and ABL Subsidiary Guarantors to incur additional liens and indebtedness, make investments and dispositions, pay dividends to Holdings or enter into other transactions, among other restrictions, in each case subject to certain exceptions. Under the ABL Facility, the ABL Borrowers and the ABL Subsidiary Guarantors are permitted to pay dividends to Holdings, (a) so long as after giving effect to such payment, (i) availability is equal to or greater than 15% of the loan cap (i.e., the lesser of (x) the aggregate lender commitments under the ABL Facility and (y) the borrowing base) and (ii) if availability is less than 20% of the loan cap, the consolidated fixed charge coverage ratio is equal to or greater than 1.0 to 1.0, and (b) pursuant to certain other limited exceptions.
On June 5, 2015, our indirect wholly owned subsidiary, At Home Holding III Inc. (“Borrower”), entered into a first lien credit agreement (the “First Lien Agreement”), by and among the Borrower, At Home Holding II Inc. (“At Home II”), a direct wholly owned subsidiary of ours, as guarantor, various lenders and Bank of America, N.A., as administrative agent and collateral agent. The First Lien Agreement provides for a $300.0 million term loan (“Term
F-32
Schedule I – Condensed Financial Information of Registrant
AT HOME GROUP INC. (parent company only)
Notes to Condensed Financial Statements (Continued)
Loan”), which amount was borrowed on June 5, 2015. The Term Loan will mature on June 3, 2022, and is repayable in equal quarterly installments of approximately $0.8 million for an annual aggregate amount equal to 1% of the original principal amount of $300.0 million. The Borrower has the option of paying interest on a 1-month, 2-month or quarterly basis on the Term Loan at an annual rate of LIBOR (subject to a 1% floor) plus 4.00%, subject to, after a qualifying initial public offering, a 0.50% reduction if a specified secured net leverage ratio level is met, which was met subsequent to our initial public offering for the fiscal year ended January 28, 2017.
On June 5, 2015, the Borrower also entered into a second lien credit agreement (the “Second Lien Agreement”), by and among the Borrower, At Home II and Dynasty Financial II, LLC, as administrative agent, collateral agent and lender. The Second Lien Agreement provided for the Second Lien Term Loan (together with the Term Loan, the “Term Loan Facilities”), which amount was borrowed on June 5, 2015. The Second Lien Term Loan had a maturity date of June 5, 2023 and did not require periodic principal payments, with the total amount outstanding, plus accrued interest, due at maturity. The Borrower had the option of paying interest on a 1-month, 2-month or quarterly basis on the Second Lien Term Loan at an annual rate of LIBOR (subject to a 1% floor) plus 8.00%.
The Term Loan Facilities include restrictions on the ability of the Borrower and its restricted subsidiaries to incur additional liens and indebtedness, make investments and dispositions, pay dividends to Holdings or enter into other transactions, among other restrictions, in each case subject to certain exceptions. Under the Term Loan Facilities, the Borrower is permitted to pay dividends to Holdings (a) up to an amount equal to, so long as immediately after giving effect thereto, no default or event of default has occurred and is continuing, (i) (x) $10 million under the First Lien Term Facility or (y) $11.5 million under the Second Lien Term Facility, plus (ii) a basket that builds based on (x) $30 million under the First Lien Term Facility or (y) $34.5 million under the Second Lien Term Facility, plus 50% of the Borrower's and its restricted subsidiaries' Consolidated Net Income (as defined in the Term Loan Facilities) and certain other amounts, subject to various conditions including compliance with a minimum cash interest coverage ratio of 2.0 to 1.0, plus (iii) an unlimited amount, subject to pro forma compliance with a 3.0 to 1.0 total leverage ratio and (b) in certain additional limited amounts, subject to certain limited exceptions.
The Borrower used the net proceeds from the Term Loan Facilities (i) to effect the refinancing of all outstanding indebtedness under the $360.0 million aggregate principal amount of 10.75% senior secured notes maturing on June 1, 2019 (the “Senior Secured Notes”), (ii) to pay fees and expenses in connection with Term Loan Facilities and the redemption of the Senior Secured Notes, (iii) to repay certain amounts outstanding under the ABL Facility, and (iv) for general corporate purposes.
On August 3, 2016, our Registration Statement on Form S-1 relating to our initial public offering was declared effective by the SEC pursuant to which we registered an aggregate of 9,967,050 shares of our common stock (including 1,300,050 shares subject to the underwriters' over-allotment option). We issued and sold 8,667,000 of the shares registered at a price of $15.00 per share on August 9, 2016, resulting in net proceeds of $120.9 million after deducting underwriters' discounts and commissions of $9.1 million. We also incurred offering expenses of $6.0 million in connection with the initial public offering, which are included in additional paid-in capital in the consolidated balance sheet as of January 28, 2017.
On September 8, 2016, we issued and sold a further 863,041 shares of our common stock pursuant to the underwriters’ partial exercise of the over-allotment option. This exercise of the over-allotment option resulted in net proceeds to us of $12.0 million after deducting underwriters’ discounts and commissions of $0.9 million.
During the fiscal year ended January 28, 2017, we used the net proceeds from our initial public offering and the exercise of the over-allotment option, after deducting underwriters’ discounts and commissions, to repay in full the $130.0 million of principal amount of indebtedness outstanding under the Second Lien Term Loan. The repayment resulted in a loss on extinguishment of debt in the amount of $2.7 million.
F-33
INDEX TO EXHIBITS
(a) Exhibits
The following exhibits are filed or furnished as a part of this report:
|
Exhibit No. |
Exhibit Description |
|
3.1 |
Second Amended and Restated Certificate of Incorporation of the Company (incorporated by reference to Exhibit 3.1 to Amendment No. 6 to the Registrant's Registration Statement on Form S-1 filed on July 25, 2016 (File No. 333-206772)). |
|
|
|
|
3.2 |
Amended and Restated Bylaws of the Company (incorporated by reference to Exhibit 3.2 to Amendment No. 6 to the Registrant's Registration Statement on Form S-1 filed on July 25, 2016 (File No. 333-206772)). |
|
|
|
|
4.1 |
Specimen Common Stock Certificate of the Company (incorporated by reference to Exhibit 4.1 to Amendment No. 6 to the Registrant's Registration Statement on Form S-1 filed on July 25, 2016 (File No. 333-206772)). |
|
|
|
|
4.2 |
Second Amended and Restated Stockholders’ Agreement, dated as of July 22, 2016, among At Home Group Inc., Starr Investment Fund II, LLC, SPH GRD Holdings, LLC, GRD Holding LP, GRD Holding AEA LLC and GRD Holding‑A LP (incorporated by reference to Exhibit 4.2 to Amendment No. 6 to the Registrant's Registration Statement on Form S-1 filed on July 25, 2016 (File No. 333-206772)). |
|
|
|
|
4.3 |
Registration Rights Agreement, dated as of July 22, 2016, among At Home Group Inc., Starr Investment Fund II, LLC, SPH GRD Holdings, LLC, GRD Holding LP, GRD Holding AEA LLC and GRD Holding‑A LP (incorporated by reference to Exhibit 4.3 to Amendment No. 6 to the Registrant's Registration Statement on Form S-1 filed on July 25, 2016 (File No. 333-206772)). |
|
|
|
|
10.1 |
Senior Secured Asset Based Revolving Credit Facility, dated October 5, 2011, by and among At Home Holding III Inc. and At Home Stores LLC, with At Home Holding II Inc. as parent guarantor, certain of At Home Holding II Inc.’s indirect wholly‑owned domestic subsidiaries as subsidiary guarantors, the lenders party thereto and Bank of America, N.A., as administrative agent and collateral agent (incorporated by reference to Exhibit 10.1 to Amendment No. 1 to the Registrant's Registration Statement on Form S-1 filed on September 25, 2015 (File No. 333-206772)). |
|
|
|
|
10.1.1 |
First Amendment to Credit Agreement, dated May 9, 2012, by and among At Home Holding III Inc. and At Home Stores LLC, with At Home Holding II Inc. as parent guarantor, certain of At Home Holding II Inc.’s indirect wholly‑owned domestic subsidiaries as subsidiary guarantors, the lenders party thereto and Bank of America, N.A., as administrative agent and collateral agent (incorporated by reference to Exhibit 10.1.1 to Amendment No. 1 to the Registrant's Registration Statement on Form S-1 filed on September 25, 2015 (File No. 333-206772)). |
|
|
|
|
10.1.2 |
Second Amendment to Credit Agreement, dated May 23, 2013, by and among At Home Holding III Inc. and At Home Stores LLC, with At Home Holding II Inc. as parent guarantor, certain of At Home Holding II Inc.’s indirect wholly‑owned domestic subsidiaries as subsidiary guarantors, the lenders party thereto and Bank of America, N.A., as administrative agent and collateral agent (incorporated by reference to Exhibit 10.1.2 to Amendment No. 1 to the Registrant's Registration Statement on Form S-1 filed on September 25, 2015 (File No. 333-206772)). |
|
|
|
|
Exhibit No. |
Exhibit Description |
|
10.1.3 |
Third Amendment to Credit Agreement, dated July 28, 2014, by and among At Home Holding III Inc. and At Home Stores LLC, with At Home Holding II Inc. as parent guarantor, certain of At Home Holding II Inc.’s indirect wholly‑owned domestic subsidiaries as subsidiary guarantors, the lenders party thereto and Bank of America, N.A., as administrative agent and collateral agent (incorporated by reference to Exhibit 10.1.3 to Amendment No. 1 to the Registrant's Registration Statement on Form S-1 filed on September 25, 2015 (File No. 333-206772)). |
|
|
|
|
10.1.4 |
Assumption and Ratification Agreement, dated September 29, 2014, by and among At Home Holding III Inc. and At Home Stores LLC, with At Home Holding II Inc. as parent guarantor, certain of At Home Holding II Inc.’s indirect wholly‑owned domestic subsidiaries as subsidiary guarantors, the lenders party thereto and Bank of America, N.A., as administrative agent and collateral agent (incorporated by reference to Exhibit 10.1.4 to Amendment No. 1 to the Registrant's Registration Statement on Form S-1 filed on September 25, 2015 (File No. 333-206772)). |
|
|
|
|
10.1.5 |
Fourth Amendment to Credit Agreement, dated June 5, 2015, by and among At Home Holding III Inc. and At Home Stores LLC, with At Home Holding II Inc. as parent guarantor, certain of At Home Holding II Inc.’s indirect wholly‑owned domestic subsidiaries as subsidiary guarantors, the lenders party thereto and Bank of America, N.A., as administrative agent and collateral agent (incorporated by reference to Exhibit 10.1.5 to Amendment No. 1 to the Registrant's Registration Statement on Form S-1 filed on September 25, 2015 (File No. 333-206772)). |
|
|
|
|
10.1.6 |
Fifth Amendment to Credit Agreement, dated June 15, 2016, by and among At Home Holding III Inc. and At Home Stores LLC, with At Home Holding II Inc. as parent guarantor, certain of At Home Holding II Inc.’s indirect wholly‑owned domestic subsidiaries as subsidiary guarantors, the lenders party thereto and Bank of America N.A., as administrative agent and collateral agent (incorporated by reference to Exhibit 10.1.6 to Amendment No. 6 to the Registrant's Registration Statement on Form S-1 filed on July 25, 2016 (File No. 333-206772)). |
|
|
|
|
10.2 |
Senior Secured Term loan Facility, dated June 5, 2015, by and between At Home Holding III Inc., with At Home Holding II Inc. as parent guarantor, certain of At Home Holding II Inc.’s indirect wholly‑owned domestic subsidiaries as subsidiary guarantors, the lenders party thereto and Bank of America, N.A., as administrative agent and collateral agent (incorporated by reference to Exhibit 10.2 to Amendment No. 1 to the Registrant's Registration Statement on Form S-1 filed on September 25, 2015 (File No. 333-206772)). |
|
|
|
|
10.4† |
Employment Agreement by and between Garden Ridge Corporation, At Home Group Inc. (f/k/a GRD Holding I Corporation) and Lewis L. Bird III, dated as of November 15, 2012 (incorporated by reference to Exhibit 10.4 to Amendment No. 1 to the Registrant's Registration Statement on Form S-1 filed on September 25, 2015 (File No. 333-206772)). |
|
|
|
|
10.4.1† |
Amendment to Employment Agreement by and between Garden Ridge Corporation, At Home Group Inc. (f/k/a GRD Holding I Corporation) and Lewis L. Bird III, dated as of November 1, 2013 (incorporated by reference to Exhibit 10.4.1 to Amendment No. 1 to the Registrant's Registration Statement on Form S-1 filed on September 25, 2015 (File No. 333-206772)). |
|
|
|
|
10.5† |
Employment Agreement by and between Garden Ridge Corporation, At Home Group Inc. (f/k/a GRD Holding I Corporation) and Judd T. Nystrom, dated as of January 25, 2013 (incorporated by reference to Exhibit 10.5 to Amendment No. 1 to the Registrant's Registration Statement on Form S-1 filed on September 25, 2015 (File No. 333-206772)). |
|
|
|
|
Exhibit No. |
Exhibit Description |
|
10.5.1† |
Amendment to Employment Agreement by and between Garden Ridge Corporation, At Home Group Inc. (f/k/a GRD Holding I Corporation) and Judd T. Nystrom, dated as of November 1, 2013 (incorporated by reference to Exhibit 10.5.1 to Amendment No. 1 to the Registrant's Registration Statement on Form S-1 filed on September 25, 2015 (File No. 333-206772)). |
|
|
|
|
10.6† |
Employment Agreement by and between Garden Ridge Corporation, At Home Group Inc. (f/k/a GRD Holding I Corporation) and Peter S.G. Corsa, dated as of February 2, 2013 (incorporated by reference to Exhibit 10.6 to Amendment No. 1 to the Registrant's Registration Statement on Form S-1 filed on September 25, 2015 (File No. 333-206772)). |
|
|
|
|
10.6.1† |
Amendment to Employment Agreement by and between Garden Ridge Corporation, At Home Group Inc. (f/k/a GRD Holding I Corporation) and Peter S.G. Corsa, dated as of November 1, 2013 (incorporated by reference to Exhibit 10.6.1 to Amendment No. 1 to the Registrant's Registration Statement on Form S-1 filed on September 25, 2015 (File No. 333-206772)). |
|
|
|
|
10.7† |
At Home Group Inc. (f/k/a GRD Holding I Corporation) Stock Option Plan, effective as of November 12, 2012 (incorporated by reference to Exhibit 10.7 to Amendment No. 1 to the Registrant's Registration Statement on Form S-1 filed on September 25, 2015 (File No. 333-206772)). |
|
|
|
|
10.8† |
Nonqualified Stock Option Agreement by and between At Home Group Inc. (f/k/a GRD Holding I Corporation) and Lewis L. Bird III, dated as of November 26, 2012 (incorporated by reference to Exhibit 10.8 to Amendment No. 1 to the Registrant's Registration Statement on Form S-1 filed on September 25, 2015 (File No. 333-206772)). |
|
|
|
|
10.8.1† |
Letter Agreement by and between At Home Group Inc. (f/k/a GRD Holding I Corporation) and Lewis L. Bird III, dated as of November 26, 2012 (incorporated by reference to Exhibit 10.8.1 to Amendment No. 1 to the Registrant's Registration Statement on Form S-1 filed on September 25, 2015 (File No. 333-206772)). |
|
|
|
|
10.8.2† |
Amendment to Nonqualified Stock Option Agreement by and between At Home Group Inc. (f/k/a GRD Holding I Corporation) and Lewis L. Bird III, dated as of December 4, 2012 (incorporated by reference to Exhibit 10.8.2 to Amendment No. 1 to the Registrant's Registration Statement on Form S-1 filed on September 25, 2015 (File No. 333-206772)). |
|
|
|
|
10.9† |
Nonqualified Stock Option Agreement by and between At Home Group Inc. (f/k/a GRD Holding I Corporation) and Judd T. Nystrom, dated as of January 31, 2013 (incorporated by reference to Exhibit 10.9 to Amendment No. 1 to the Registrant's Registration Statement on Form S-1 filed on September 25, 2015 (File No. 333-206772)). |
|
|
|
|
10.9.1† |
Amendment to Nonqualified Stock Option Agreement between At Home Group Inc. (f/k/a GRD Holding I Corporation) and Judd T. Nystrom, dated as of February 18, 2013 (incorporated by reference to Exhibit 10.9.1 to Amendment No. 1 to the Registrant's Registration Statement on Form S-1 filed on September 25, 2015 (File No. 333-206772)). |
|
|
|
|
10.10† |
Nonqualified Stock Option Agreement by and between At Home Group Inc. (f/k/a GRD Holding I Corporation) and Judd T. Nystrom, dated as of June 3, 2014 (incorporated by reference to Exhibit 10.10 to Amendment No. 1 to the Registrant's Registration Statement on Form S-1 filed on September 25, 2015 (File No. 333-206772)). |
|
|
|
|
10.11† |
Nonqualified Stock Option Agreement by and between At Home Group Inc. (f/k/a GRD Holding I Corporation) and Peter S.G. Corsa, dated as of January 10, 2013 (incorporated by reference to Exhibit 10.11 to Amendment No. 1 to the Registrant's Registration Statement on Form S-1 filed on September 25, 2015 (File No. 333-206772)). |
|
Exhibit No. |
Exhibit Description |
|
|
|
|
10.11.1† |
Amendment to Nonqualified Stock Option Agreement between At Home Group Inc. (f/k/a GRD Holding I Corporation) and Peter S.G. Corsa, dated as of March 25, 2013 (incorporated by reference to Exhibit 10.11.1 to Amendment No. 1 to the Registrant's Registration Statement on Form S-1 filed on September 25, 2015 (File No. 333-206772)). |
|
|
|
|
10.12† |
Nonqualified Stock Option Agreement by and between At Home Group Inc. (f/k/a GRD Holding I Corporation) and Peter S.G. Corsa, dated as of June 3, 2014 (incorporated by reference to Exhibit 10.12 to Amendment No. 1 to the Registrant's Registration Statement on Form S-1 filed on September 25, 2015 (File No. 333-206772)). |
|
|
|
|
10.13† |
At Home Group Inc. Annual Bonus Plan (incorporated by reference to Exhibit 10.13 to Amendment No. 6 to the Registrant's Registration Statement on Form S-1 filed on July 25, 2016 (File No. 333-206772)). |
|
|
|
|
10.14† |
At Home Group Inc. Equity Incentive Plan (incorporated by reference to Exhibit 10.14 to Amendment No. 6 to the Registrant's Registration Statement on Form S-1 filed on July 25, 2016 (File No. 333-206772)). |
|
|
|
|
10.15† |
At Home Group Inc. Form of Option Award Agreement (incorporated by reference to Exhibit 10.15 to Amendment No. 6 to the Registrant's Registration Statement on Form S-1 filed on July 25, 2016 (File No. 333-206772)). |
|
|
|
|
10.16 |
Form of Indemnification Agreement (incorporated by reference to Exhibit 10.16 to Amendment No. 6 to the Registrant's Registration Statement on Form S-1 filed on July 25, 2016 (File No. 333-206772)). |
|
|
|
|
10.17† |
Offer Letter by and between At Home Group Inc. and Jennifer Warren, dated as of December 9, 2014 (incorporated by reference to Exhibit 10.17 to Amendment No. 4 to the Registrant's Registration Statement on Form S-1 filed on April 22, 2016 (File No. 333-206772)). |
|
|
|
|
10.18† |
Nonqualified Stock Option Agreement by and between At Home Group Inc. (f/k/a GRD Holding I Corporation) and Jennifer Warren, dated as of April 7, 2015 (incorporated by reference to Exhibit 10.18 to Amendment No. 4 to the Registrant's Registration Statement on Form S-1 filed on April 22, 2016 (File No. 333-206772)). |
|
|
|
|
10.19† |
Bonus Agreement by and between At Home Group Inc. (f/k/a GRD Holding I Corporation) and Jennifer Warren, dated as of April 8, 2015 (incorporated by reference to Exhibit 10.19 to Amendment No. 4 to the Registrant's Registration Statement on Form S-1 filed on April 22, 2016 (File No. 333-206772)). |
|
|
|
|
10.20 |
At Home Group Inc. Form of Nonqualified Stock Option Award Agreement (Director) (incorporated by reference to Exhibit 10.1 to the Registrant's Current Report on Form 8-K filed on December 5, 2016 (File No. 001-37849)).
|
|
10.21* |
Form of Employment Agreement entered into by and between At Home Stores LLC (f/k/a Garden Ridge Corporation) and certain executive officers of the Company.
|
|
21.1* |
List of subsidiaries of At Home Group Inc. |
|
|
|
|
31.1* |
Certification of Chief Executive Officer pursuant to Rule 13a-14(a) or 15d-14(a) of the Securities Exchange Act of 1934, as amended, as adopted pursuant to Section 302 of the Sarbanes-Oxley Act of 2002. |
|
|
|
|
Exhibit No. |
Exhibit Description |
|
31.2* |
Certification of Chief Financial Officer pursuant to Rule 13a-14(a) or 15d-14(a) of the Securities Exchange Act of 1934, as amended, as adopted pursuant to Section 302 of the Sarbanes-Oxley Act of 2002. |
|
|
|
|
32.1* |
Certification of Chief Executive Officer and Chief Financial Officer pursuant to 18 U.S.C. Section 1350, as adopted pursuant to Section 906 of the Sarbanes-Oxley Act of 2002. |
|
|
|
|
101.INS* |
XBRL Instance Document. |
|
|
|
|
101.SCH* |
XBRL Taxonomy Extension Schema Document. |
|
|
|
|
101.CAL* |
XBRL Taxonomy Extension Calculation Linkbase Document. |
|
|
|
|
101.DEF* |
XBRL Taxonomy Extension Definition Linkbase Document. |
|
|
|
|
101.LAB* |
XBRL Taxonomy Extension Label Linkbase Document. |
|
|
|
|
101.PRE* |
XBRL Taxonomy Extension Presentation Linkbase Document. |
*Filed herewith.
†Indicates management contracts or compensatory plans or arrangements in which our executive officers or directors participate.
SIGNATURES
Pursuant to the requirements of the Securities Exchange Act of 1934, the Registrant has duly caused this report to be signed on its behalf by the undersigned thereunto duly authorized.
|
|
AT HOME GROUP INC. |
|
|
|
|
|
|
|
|
|
|
Date: April 5, 2017 |
/s/ LEWIS L. BIRD III |
|
|
|
By: |
Lewis L. Bird III |
|
|
|
Chief Executive Officer (Principal Executive Officer) |
|
|
|
|
Pursuant to the requirements of the Securities Exchange Act of 1934, this report has been signed by the following persons in the capacities and on the dates indicated.
|
|
|
|
|
Signature |
Title |
Date |
|
|
|
|
|
/s/ Lewis L. Bird III |
Chief Executive Officer and Director (Principal Executive Officer) |
April 5, 2017 |
|
Lewis L. Bird III |
|
|
|
|
|
|
|
/s/ Judd T. Nystrom |
Chief Financial Officer (Principal Financial Officer) |
April 5, 2017 |
|
Judd T. Nystrom |
|
|
|
|
|
|
|
/s/ Becky Haislip |
Chief Accounting Officer (Principal Accounting Officer) |
April 5, 2017 |
|
Becky Haislip |
|
|
|
|
|
|
|
/s/ Martin C. Eltrich, III |
Director |
April 5, 2017 |
|
Martin C. Eltrich, III |
|
|
|
|
|
|
|
/s/ Brian R. Hoesterey |
Director |
April 5, 2017 |
|
Brian R. Hoesterey |
|
|
|
|
|
|
|
/s/ Geoffrey G. Clark |
Director |
April 5, 2017 |
|
Geoffrey G. Clark |
|
|
|
|
|
|
|
/s/ Allen I. Questrom |
Director |
April 5, 2017 |
|
Allen I. Questrom |
|
|
|
|
|
|
|
/s/ Wendy A. Beck |
Director |
April 5, 2017 |
|
Wendy A. Beck |
|
|
|
|
|
|
|
/s/ Larry D. Stone |
Director |
April 5, 2017 |
|
Larry D. Stone |
|
|
|
|
|
|
|
/s/ Philip L. Francis |
Director |
April 5, 2017 |
|
Philip L. Francis |
|
|
|
|
|
|
|
/s/ Elisabeth B. Charles |
Director |
April 5, 2017 |
|
Elisabeth B. Charles |
|
|